Kenyan vs Immigrants from Portugal Family Poverty
COMPARE
Kenyan
Immigrants from Portugal
Family Poverty
Family Poverty Comparison
Kenyans
Immigrants from Portugal
8.9%
FAMILY POVERTY
58.2/ 100
METRIC RATING
170th/ 347
METRIC RANK
9.4%
FAMILY POVERTY
20.5/ 100
METRIC RATING
201st/ 347
METRIC RANK
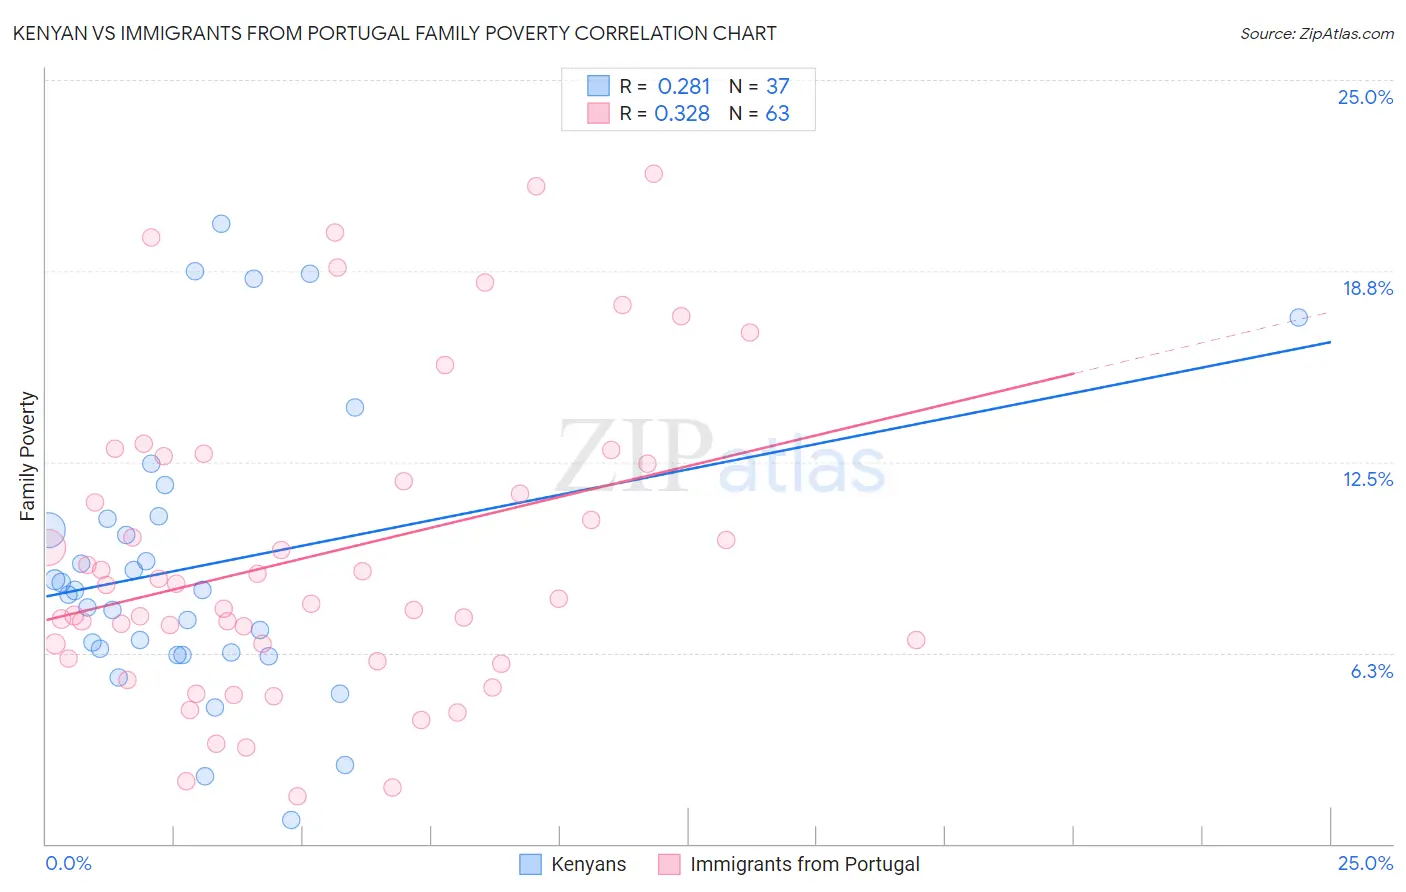
Kenyan vs Immigrants from Portugal Family Poverty Correlation Chart
The statistical analysis conducted on geographies consisting of 168,038,695 people shows a weak positive correlation between the proportion of Kenyans and poverty level among families in the United States with a correlation coefficient (R) of 0.281 and weighted average of 8.9%. Similarly, the statistical analysis conducted on geographies consisting of 174,489,914 people shows a mild positive correlation between the proportion of Immigrants from Portugal and poverty level among families in the United States with a correlation coefficient (R) of 0.328 and weighted average of 9.4%, a difference of 5.6%.
Family Poverty Correlation Summary
| Measurement | Kenyan | Immigrants from Portugal |
| Minimum | 0.77% | 1.6% |
| Maximum | 20.3% | 21.9% |
| Range | 19.5% | 20.4% |
| Mean | 9.1% | 9.4% |
| Median | 8.3% | 8.0% |
| Interquartile 25% (IQ1) | 6.2% | 6.1% |
| Interquartile 75% (IQ3) | 10.7% | 12.5% |
| Interquartile Range (IQR) | 4.5% | 6.4% |
| Standard Deviation (Sample) | 4.7% | 5.0% |
| Standard Deviation (Population) | 4.6% | 4.9% |
Similar Demographics by Family Poverty
Demographics Similar to Kenyans by Family Poverty
In terms of family poverty, the demographic groups most similar to Kenyans are Lebanese (8.9%, a difference of 0.080%), Immigrants from Peru (8.9%, a difference of 0.090%), Immigrants from Chile (8.9%, a difference of 0.19%), Immigrants from Fiji (8.9%, a difference of 0.25%), and Israeli (8.9%, a difference of 0.54%).
| Demographics | Rating | Rank | Family Poverty |
| Pennsylvania Germans | 66.0 /100 | #163 | Good 8.8% |
| Celtics | 64.9 /100 | #164 | Good 8.8% |
| Guamanians/Chamorros | 64.7 /100 | #165 | Good 8.8% |
| Afghans | 63.5 /100 | #166 | Good 8.8% |
| Immigrants | Ethiopia | 62.5 /100 | #167 | Good 8.9% |
| Israelis | 62.1 /100 | #168 | Good 8.9% |
| Immigrants | Chile | 59.6 /100 | #169 | Average 8.9% |
| Kenyans | 58.2 /100 | #170 | Average 8.9% |
| Lebanese | 57.6 /100 | #171 | Average 8.9% |
| Immigrants | Peru | 57.5 /100 | #172 | Average 8.9% |
| Immigrants | Fiji | 56.4 /100 | #173 | Average 8.9% |
| Immigrants | Albania | 50.0 /100 | #174 | Average 9.0% |
| Costa Ricans | 49.3 /100 | #175 | Average 9.0% |
| Immigrants | Syria | 47.5 /100 | #176 | Average 9.0% |
| Hawaiians | 47.2 /100 | #177 | Average 9.0% |
Demographics Similar to Immigrants from Portugal by Family Poverty
In terms of family poverty, the demographic groups most similar to Immigrants from Portugal are Immigrants from Sierra Leone (9.4%, a difference of 0.17%), German Russian (9.4%, a difference of 0.21%), Immigrants from Costa Rica (9.4%, a difference of 0.23%), Immigrants from Lebanon (9.4%, a difference of 0.31%), and Spaniard (9.4%, a difference of 0.42%).
| Demographics | Rating | Rank | Family Poverty |
| South Americans | 28.1 /100 | #194 | Fair 9.3% |
| Venezuelans | 27.4 /100 | #195 | Fair 9.3% |
| Immigrants | Venezuela | 26.1 /100 | #196 | Fair 9.3% |
| Immigrants | Colombia | 24.4 /100 | #197 | Fair 9.3% |
| Iraqis | 24.2 /100 | #198 | Fair 9.3% |
| Spaniards | 22.8 /100 | #199 | Fair 9.4% |
| Immigrants | Costa Rica | 21.7 /100 | #200 | Fair 9.4% |
| Immigrants | Portugal | 20.5 /100 | #201 | Fair 9.4% |
| Immigrants | Sierra Leone | 19.6 /100 | #202 | Poor 9.4% |
| German Russians | 19.4 /100 | #203 | Poor 9.4% |
| Immigrants | Lebanon | 18.9 /100 | #204 | Poor 9.4% |
| Aleuts | 18.0 /100 | #205 | Poor 9.5% |
| Immigrants | South America | 18.0 /100 | #206 | Poor 9.5% |
| Sierra Leoneans | 15.6 /100 | #207 | Poor 9.5% |
| Immigrants | Eastern Africa | 15.1 /100 | #208 | Poor 9.5% |