Alsatian vs Guamanian/Chamorro Female Poverty
COMPARE
Alsatian
Guamanian/Chamorro
Female Poverty
Female Poverty Comparison
Alsatians
Guamanians/Chamorros
14.5%
FEMALE POVERTY
4.0/ 100
METRIC RATING
220th/ 347
METRIC RANK
13.3%
FEMALE POVERTY
62.4/ 100
METRIC RATING
162nd/ 347
METRIC RANK
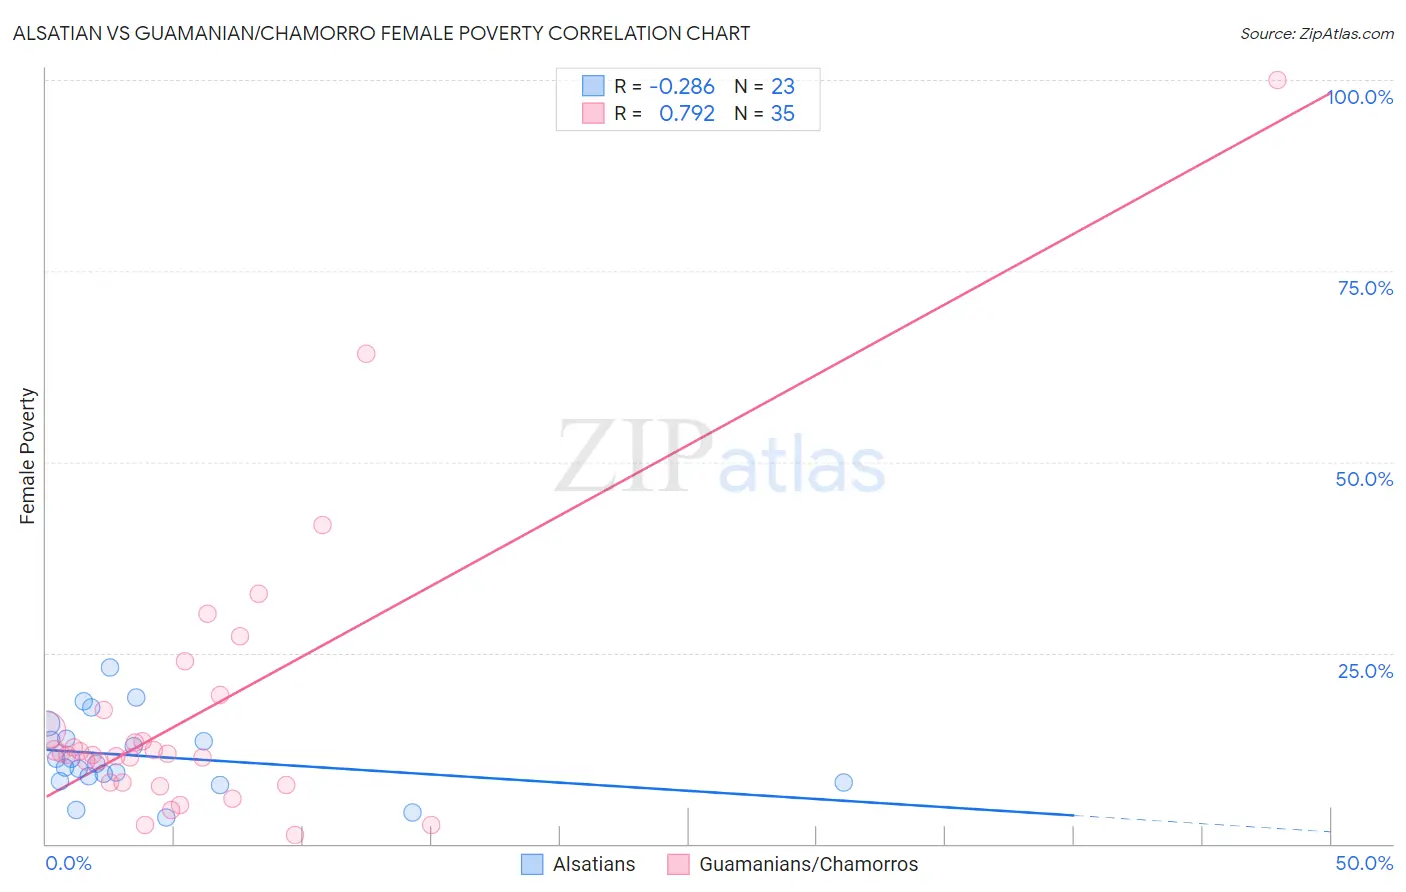
Alsatian vs Guamanian/Chamorro Female Poverty Correlation Chart
The statistical analysis conducted on geographies consisting of 82,678,421 people shows a weak negative correlation between the proportion of Alsatians and poverty level among females in the United States with a correlation coefficient (R) of -0.286 and weighted average of 14.5%. Similarly, the statistical analysis conducted on geographies consisting of 221,860,928 people shows a strong positive correlation between the proportion of Guamanians/Chamorros and poverty level among females in the United States with a correlation coefficient (R) of 0.792 and weighted average of 13.3%, a difference of 8.9%.
Female Poverty Correlation Summary
| Measurement | Alsatian | Guamanian/Chamorro |
| Minimum | 3.4% | 1.2% |
| Maximum | 23.1% | 100.0% |
| Range | 19.7% | 98.8% |
| Mean | 11.5% | 17.2% |
| Median | 10.5% | 11.7% |
| Interquartile 25% (IQ1) | 8.2% | 8.0% |
| Interquartile 75% (IQ3) | 13.7% | 17.6% |
| Interquartile Range (IQR) | 5.5% | 9.6% |
| Standard Deviation (Sample) | 5.0% | 18.9% |
| Standard Deviation (Population) | 4.9% | 18.6% |
Similar Demographics by Female Poverty
Demographics Similar to Alsatians by Female Poverty
In terms of female poverty, the demographic groups most similar to Alsatians are Japanese (14.5%, a difference of 0.050%), Immigrants from Uzbekistan (14.4%, a difference of 0.18%), Immigrants from Cambodia (14.5%, a difference of 0.19%), Nonimmigrants (14.5%, a difference of 0.22%), and Immigrants (14.4%, a difference of 0.23%).
| Demographics | Rating | Rank | Female Poverty |
| Alaskan Athabascans | 5.3 /100 | #213 | Tragic 14.4% |
| Marshallese | 5.0 /100 | #214 | Tragic 14.4% |
| Immigrants | Panama | 4.7 /100 | #215 | Tragic 14.4% |
| Immigrants | Thailand | 4.5 /100 | #216 | Tragic 14.4% |
| Immigrants | Immigrants | 4.5 /100 | #217 | Tragic 14.4% |
| Immigrants | Uzbekistan | 4.4 /100 | #218 | Tragic 14.4% |
| Japanese | 4.1 /100 | #219 | Tragic 14.5% |
| Alsatians | 4.0 /100 | #220 | Tragic 14.5% |
| Immigrants | Cambodia | 3.7 /100 | #221 | Tragic 14.5% |
| Immigrants | Nonimmigrants | 3.7 /100 | #222 | Tragic 14.5% |
| Immigrants | Africa | 3.3 /100 | #223 | Tragic 14.5% |
| Americans | 2.8 /100 | #224 | Tragic 14.6% |
| Immigrants | Micronesia | 2.8 /100 | #225 | Tragic 14.6% |
| Immigrants | Eritrea | 2.4 /100 | #226 | Tragic 14.6% |
| Immigrants | Nigeria | 2.1 /100 | #227 | Tragic 14.7% |
Demographics Similar to Guamanians/Chamorros by Female Poverty
In terms of female poverty, the demographic groups most similar to Guamanians/Chamorros are Immigrants from Albania (13.3%, a difference of 0.0%), Immigrants from Ethiopia (13.3%, a difference of 0.010%), Ethiopian (13.3%, a difference of 0.010%), Immigrants from Nepal (13.3%, a difference of 0.030%), and Scotch-Irish (13.3%, a difference of 0.030%).
| Demographics | Rating | Rank | Female Poverty |
| Hungarians | 70.1 /100 | #155 | Good 13.2% |
| Immigrants | Bosnia and Herzegovina | 69.7 /100 | #156 | Good 13.2% |
| Immigrants | Northern Africa | 68.8 /100 | #157 | Good 13.2% |
| Pennsylvania Germans | 67.3 /100 | #158 | Good 13.2% |
| Costa Ricans | 63.6 /100 | #159 | Good 13.3% |
| Immigrants | Nepal | 62.7 /100 | #160 | Good 13.3% |
| Immigrants | Ethiopia | 62.5 /100 | #161 | Good 13.3% |
| Guamanians/Chamorros | 62.4 /100 | #162 | Good 13.3% |
| Immigrants | Albania | 62.4 /100 | #163 | Good 13.3% |
| Ethiopians | 62.3 /100 | #164 | Good 13.3% |
| Scotch-Irish | 62.1 /100 | #165 | Good 13.3% |
| Immigrants | Oceania | 59.7 /100 | #166 | Average 13.3% |
| Immigrants | Chile | 57.4 /100 | #167 | Average 13.3% |
| Aleuts | 56.7 /100 | #168 | Average 13.4% |
| Lebanese | 55.9 /100 | #169 | Average 13.4% |