Zip Codes with the Highest Percentage of Population Employed in Agriculture, Fishing & Hunting in Lancaster, PA
RELATED REPORTS & OPTIONS
Agriculture, Fishing & Hunting
Lancaster
Compare Zip Codes
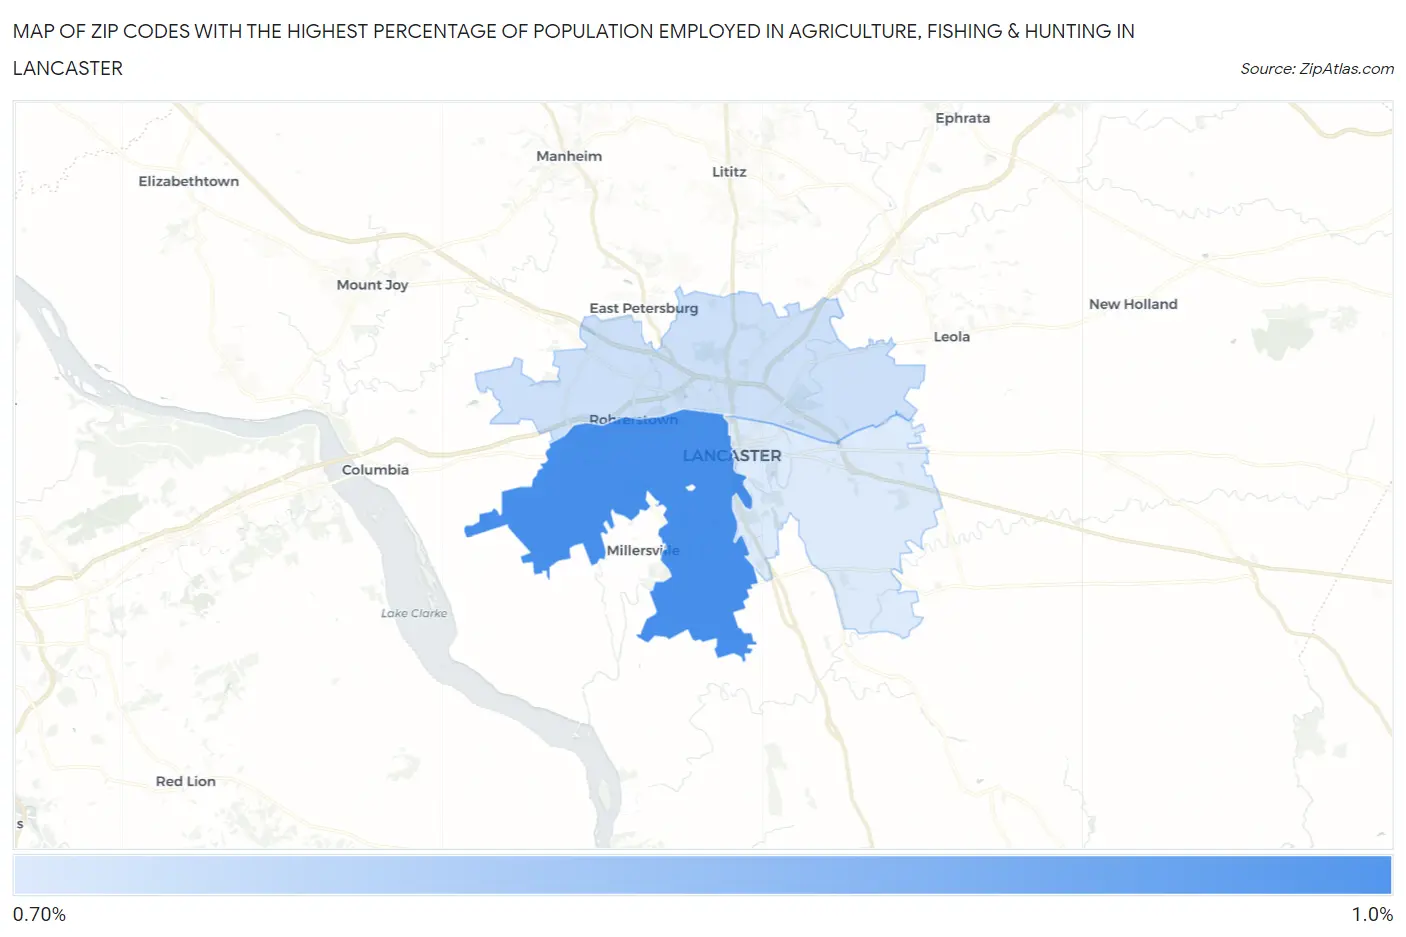
Map of Zip Codes with the Highest Percentage of Population Employed in Agriculture, Fishing & Hunting in Lancaster
0.0%
1.0%
Zip Codes with the Highest Percentage of Population Employed in Agriculture, Fishing & Hunting in Lancaster, PA
| Zip Code | % Employed | vs State | vs National | |
| 1. | 17603 | 0.83% | 0.87%(-0.035)#665 | 1.2%(-0.367)#17,065 |
| 2. | 17601 | 0.73% | 0.87%(-0.134)#705 | 1.2%(-0.467)#17,652 |
| 3. | 17602 | 0.72% | 0.87%(-0.146)#711 | 1.2%(-0.479)#17,728 |
1
Common Questions
What are the Top Zip Codes with the Highest Percentage of Population Employed in Agriculture, Fishing & Hunting in Lancaster, PA?
Top Zip Codes with the Highest Percentage of Population Employed in Agriculture, Fishing & Hunting in Lancaster, PA are:
What zip code has the Highest Percentage of Population Employed in Agriculture, Fishing & Hunting in Lancaster, PA?
17603 has the Highest Percentage of Population Employed in Agriculture, Fishing & Hunting in Lancaster, PA with 0.83%.
What is the Percentage of Population Employed in Agriculture, Fishing & Hunting in Lancaster, PA?
Percentage of Population Employed in Agriculture, Fishing & Hunting in Lancaster is 0.50%.
What is the Percentage of Population Employed in Agriculture, Fishing & Hunting in Pennsylvania?
Percentage of Population Employed in Agriculture, Fishing & Hunting in Pennsylvania is 0.87%.
What is the Percentage of Population Employed in Agriculture, Fishing & Hunting in the United States?
Percentage of Population Employed in Agriculture, Fishing & Hunting in the United States is 1.2%.