Zip Codes with the Highest Percentage of Population Employed in Office & Administration in Mansfield, OH
RELATED REPORTS & OPTIONS
Office & Administration
Mansfield
Compare Zip Codes
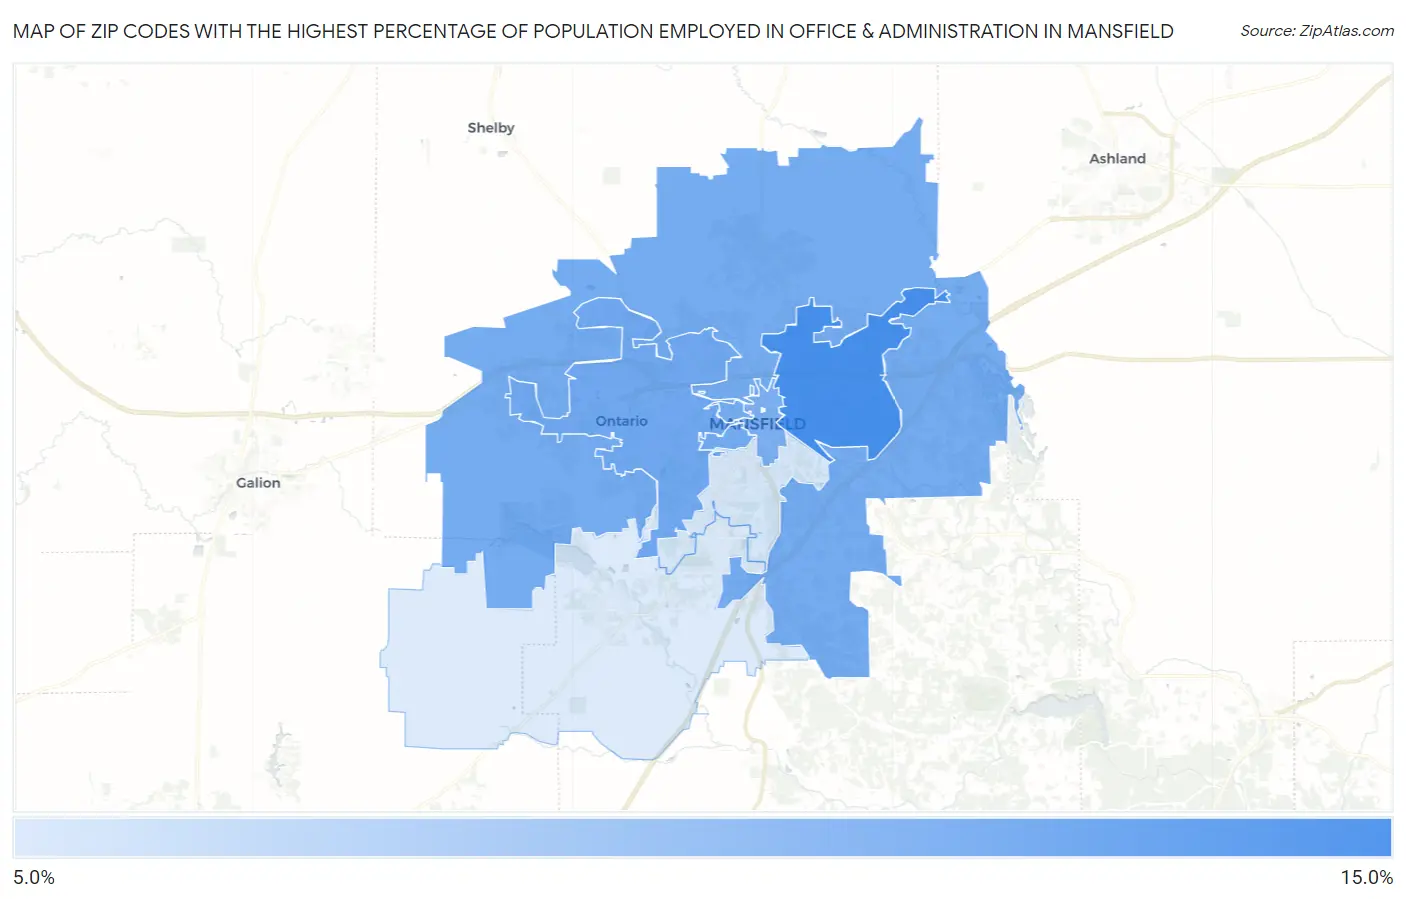
Map of Zip Codes with the Highest Percentage of Population Employed in Office & Administration in Mansfield
8.6%
12.4%
Zip Codes with the Highest Percentage of Population Employed in Office & Administration in Mansfield, OH
| Zip Code | % Employed | vs State | vs National | |
| 1. | 44905 | 12.4% | 11.3%(+1.17)#361 | 10.9%(+1.57)#9,490 |
| 2. | 44906 | 11.3% | 11.3%(+0.080)#503 | 10.9%(+0.480)#12,771 |
| 3. | 44903 | 11.3% | 11.3%(+0.004)#524 | 10.9%(+0.404)#13,015 |
| 4. | 44902 | 11.0% | 11.3%(-0.225)#553 | 10.9%(+0.175)#13,736 |
| 5. | 44907 | 8.8% | 11.3%(-2.46)#811 | 10.9%(-2.06)#20,858 |
| 6. | 44904 | 8.6% | 11.3%(-2.66)#831 | 10.9%(-2.26)#21,440 |
1
Common Questions
What are the Top 5 Zip Codes with the Highest Percentage of Population Employed in Office & Administration in Mansfield, OH?
Top 5 Zip Codes with the Highest Percentage of Population Employed in Office & Administration in Mansfield, OH are:
What zip code has the Highest Percentage of Population Employed in Office & Administration in Mansfield, OH?
44905 has the Highest Percentage of Population Employed in Office & Administration in Mansfield, OH with 12.4%.
What is the Percentage of Population Employed in Office & Administration in Mansfield, OH?
Percentage of Population Employed in Office & Administration in Mansfield is 10.1%.
What is the Percentage of Population Employed in Office & Administration in Ohio?
Percentage of Population Employed in Office & Administration in Ohio is 11.3%.
What is the Percentage of Population Employed in Office & Administration in the United States?
Percentage of Population Employed in Office & Administration in the United States is 10.9%.