Zip Codes with the Highest Percentage of Immigrants from Philippines in Mansfield, OH
RELATED REPORTS & OPTIONS
Philippines
Mansfield
Compare Zip Codes
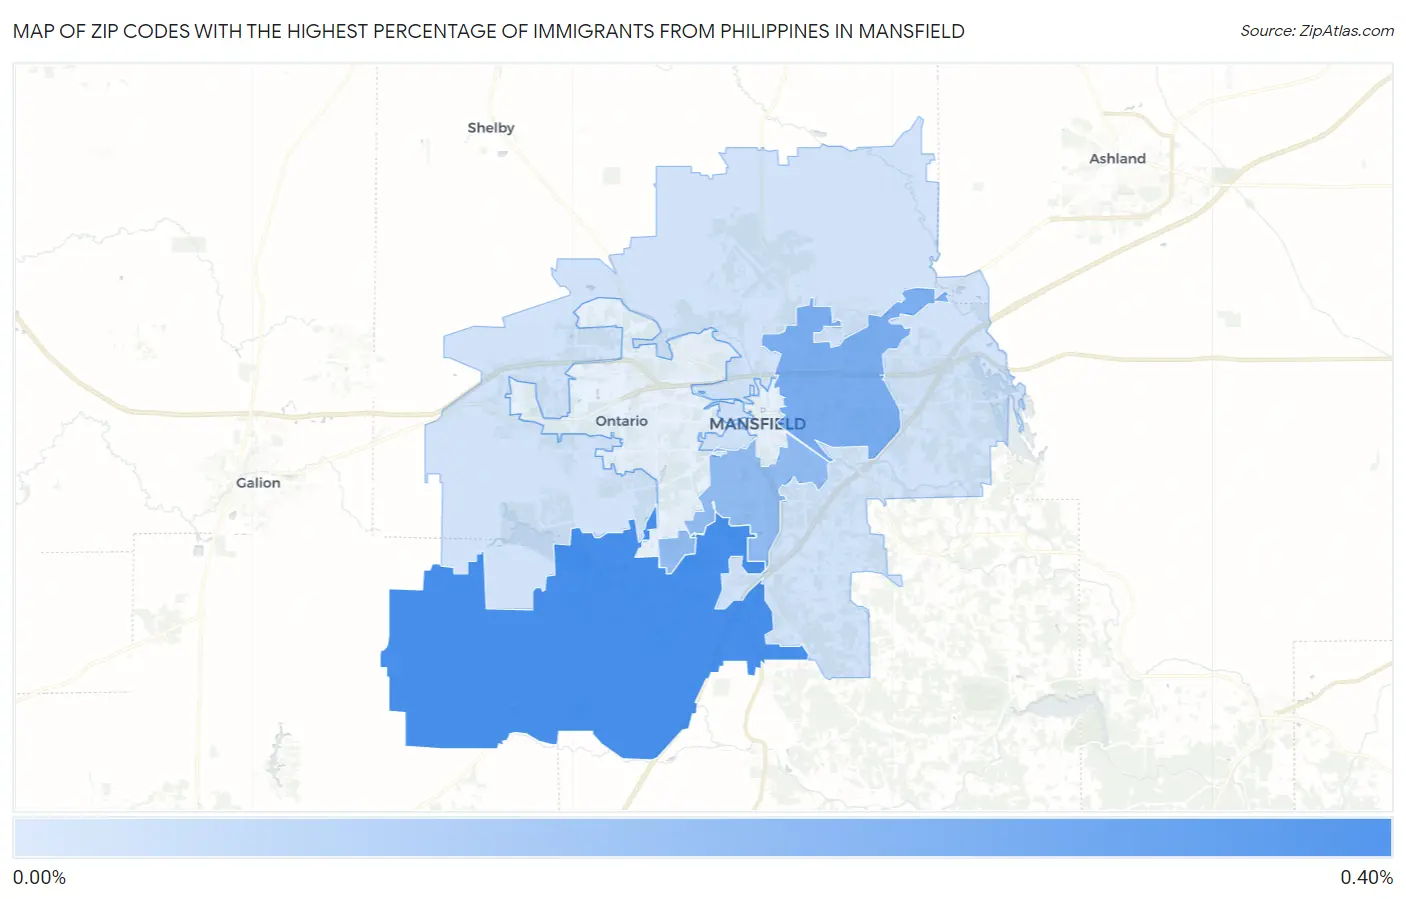
Map of Zip Codes with the Highest Percentage of Immigrants from Philippines in Mansfield
0.023%
0.30%
Zip Codes with the Highest Percentage of Immigrants from Philippines in Mansfield, OH
| Zip Code | Philippines | vs State | vs National | |
| 1. | 44904 | 0.30% | 0.15%(+0.152)#-1 | 0.60%(-0.296)#0 |
| 2. | 44905 | 0.20% | 0.15%(+0.050)#0 | 0.60%(-0.398)#1 |
| 3. | 44907 | 0.15% | 0.15%(+0.000)#1 | 0.60%(-0.448)#2 |
| 4. | 44903 | 0.023% | 0.15%(-0.128)#2 | 0.60%(-0.577)#3 |
1
Common Questions
What are the Top 5 Zip Codes with the Highest Percentage of Immigrants from Philippines in Mansfield, OH?
Top 5 Zip Codes with the Highest Percentage of Immigrants from Philippines in Mansfield, OH are:
What zip code has the Highest Percentage of Immigrants from Philippines in Mansfield, OH?
44904 has the Highest Percentage of Immigrants from Philippines in Mansfield, OH with 0.30%.
What is the Percentage of Immigrants from Philippines in Mansfield, OH?
Percentage of Immigrants from Philippines in Mansfield is 0.055%.
What is the Percentage of Immigrants from Philippines in Ohio?
Percentage of Immigrants from Philippines in Ohio is 0.15%.
What is the Percentage of Immigrants from Philippines in the United States?
Percentage of Immigrants from Philippines in the United States is 0.60%.