Zip Codes with the Highest Percentage of Population Employed in Administrative & Support Services in Mansfield, OH
RELATED REPORTS & OPTIONS
Administrative & Support Services
Mansfield
Compare Zip Codes
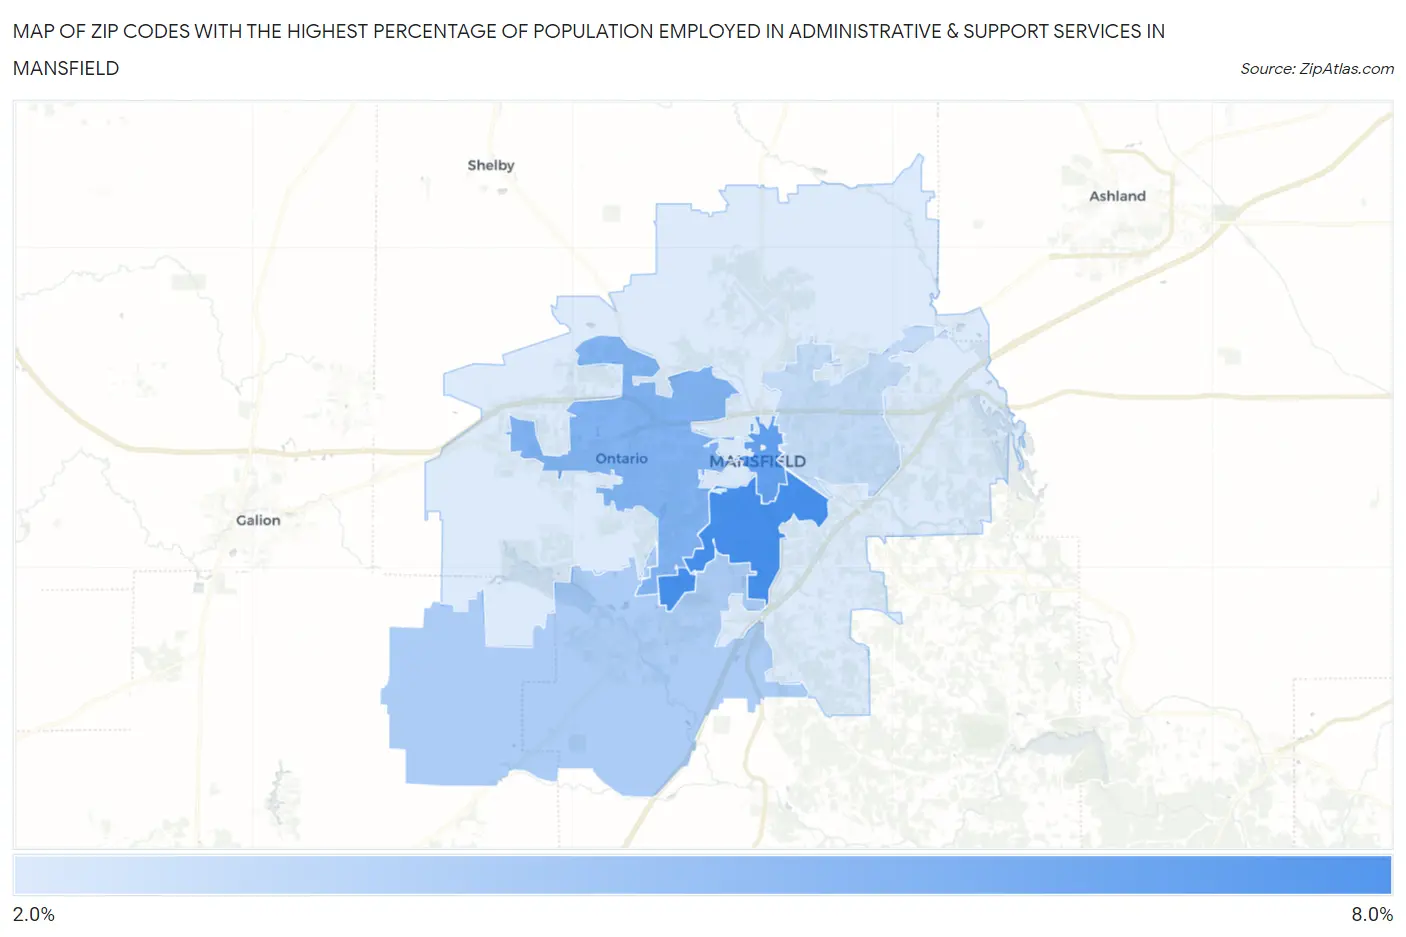
Map of Zip Codes with the Highest Percentage of Population Employed in Administrative & Support Services in Mansfield
2.5%
6.3%
Zip Codes with the Highest Percentage of Population Employed in Administrative & Support Services in Mansfield, OH
| Zip Code | % Employed | vs State | vs National | |
| 1. | 44907 | 6.3% | 3.7%(+2.56)#161 | 4.1%(+2.13)#4,269 |
| 2. | 44902 | 5.6% | 3.7%(+1.86)#217 | 4.1%(+1.44)#5,614 |
| 3. | 44906 | 4.9% | 3.7%(+1.13)#288 | 4.1%(+0.703)#7,569 |
| 4. | 44904 | 3.7% | 3.7%(+0.017)#446 | 4.1%(-0.409)#11,813 |
| 5. | 44905 | 3.1% | 3.7%(-0.584)#571 | 4.1%(-1.01)#14,795 |
| 6. | 44903 | 2.5% | 3.7%(-1.19)#711 | 4.1%(-1.61)#17,951 |
1
Common Questions
What are the Top 5 Zip Codes with the Highest Percentage of Population Employed in Administrative & Support Services in Mansfield, OH?
Top 5 Zip Codes with the Highest Percentage of Population Employed in Administrative & Support Services in Mansfield, OH are:
What zip code has the Highest Percentage of Population Employed in Administrative & Support Services in Mansfield, OH?
44907 has the Highest Percentage of Population Employed in Administrative & Support Services in Mansfield, OH with 6.3%.
What is the Percentage of Population Employed in Administrative & Support Services in Mansfield, OH?
Percentage of Population Employed in Administrative & Support Services in Mansfield is 4.4%.
What is the Percentage of Population Employed in Administrative & Support Services in Ohio?
Percentage of Population Employed in Administrative & Support Services in Ohio is 3.7%.
What is the Percentage of Population Employed in Administrative & Support Services in the United States?
Percentage of Population Employed in Administrative & Support Services in the United States is 4.1%.