Zip Codes with the Highest Percentage of Population Employed in Education Instruction & Library in Cleveland, OH

RELATED REPORTS & OPTIONS

Education Instruction & Library
Population
Families and Households
Female Fertility
Female Fertility (Unmarried)
Race (Community Size)
Race (Percentage)
Ancestry (Community Size)
AfghanAfricanAlbanianAlsatianAmericanApacheArabArgentineanArmenianAustralianAustrianBahamianBangladeshiBarbadianBelgianBelizeanBhutaneseBlackfeetBrazilianBritishBritish West IndianBulgarianBurmeseCajunCambodianCanadianCape VerdeanCarpatho RusynCelticCentral AmericanCentral American IndianCherokeeChickasawChileanChippewaChoctawColombianComancheCosta RicanCreekCroatianCubanCzechCzechoslovakianDanishDelawareDominicanDutchDutch West IndianEastern EuropeanEcuadorianEgyptianEnglishEstonianEthiopianEuropeanFilipinoFinnishFrenchFrench American IndianFrench CanadianGermanGhanaianGreekGuamanian / ChamorroGuatemalanGuyaneseHaitianHonduranHungarianIcelanderIndian (Asian)IndonesianIranianIraqiIrishIroquoisIsraeliItalianJamaicanJapaneseJordanianKoreanLaotianLatvianLebaneseLiberianLithuanianLumbeeLuxembourgerMacedonianMalaysianMexicanMexican American IndianMongolianMoroccanNative HawaiianNavajoNicaraguanNigerianNorthern EuropeanNorwegianPakistaniPalestinianPanamanianParaguayanPennsylvania GermanPeruvianPolishPortuguesePuebloPuerto RicanRomanianRussianSalvadoranSamoanScandinavianScotch-IrishScottishSeminoleSerbianSierra LeoneanSiouxSlavicSlovakSloveneSomaliSouth AfricanSouth AmericanSouth American IndianSpaniardSpanishSri LankanSubsaharan AfricanSudaneseSwedishSwissSyrianThaiTrinidadian and TobagonianTurkishU.S. Virgin IslanderUgandanUkrainianUruguayanVenezuelanVietnameseWelshWest IndianYaquiYugoslavianZimbabwean
Ancestry (Percentage)
AfghanAfricanAlbanianAlsatianAmericanApacheArabArgentineanArmenianAustralianAustrianBahamianBangladeshiBarbadianBelgianBelizeanBhutaneseBlackfeetBrazilianBritishBritish West IndianBulgarianBurmeseCajunCambodianCanadianCape VerdeanCarpatho RusynCelticCentral AmericanCentral American IndianCherokeeChickasawChileanChippewaChoctawColombianComancheCosta RicanCreekCroatianCubanCzechCzechoslovakianDanishDelawareDominicanDutchDutch West IndianEastern EuropeanEcuadorianEgyptianEnglishEstonianEthiopianEuropeanFilipinoFinnishFrenchFrench American IndianFrench CanadianGermanGhanaianGreekGuamanian / ChamorroGuatemalanGuyaneseHaitianHonduranHungarianIcelanderIndian (Asian)IndonesianIranianIraqiIrishIroquoisIsraeliItalianJamaicanJapaneseJordanianKoreanLaotianLatvianLebaneseLiberianLithuanianLumbeeLuxembourgerMacedonianMalaysianMexicanMexican American IndianMongolianMoroccanNative HawaiianNavajoNicaraguanNigerianNorthern EuropeanNorwegianPakistaniPalestinianPanamanianParaguayanPennsylvania GermanPeruvianPolishPortuguesePuebloPuerto RicanRomanianRussianSalvadoranSamoanScandinavianScotch-IrishScottishSeminoleSerbianSierra LeoneanSiouxSlavicSlovakSloveneSomaliSouth AfricanSouth AmericanSouth American IndianSpaniardSpanishSri LankanSubsaharan AfricanSudaneseSwedishSwissSyrianThaiTrinidadian and TobagonianTurkishU.S. Virgin IslanderUgandanUkrainianUruguayanVenezuelanVietnameseWelshWest IndianYaquiYugoslavianZimbabwean
Immigrant Origin (Total)
AfghanistanAfricaAlbaniaArgentinaAsiaAustraliaAustriaBangladeshBarbadosBelarusBelgiumBelizeBosnia and HerzegovinaBrazilBulgariaBurma / MyanmarCambodiaCanadaCaribbeanCentral AmericaChileChinaColombiaCongoCosta RicaCroatiaCubaCzechoslovakiaDominican RepublicEastern AfricaEastern AsiaEastern EuropeEcuadorEgyptEl SalvadorEnglandEthiopiaEuropeFranceGermanyGhanaGreeceGuatemalaGuyanaHaitiHondurasHong KongHungaryIndiaIndonesiaIranIraqIrelandIsraelItalyJamaicaJapanJordanKazakhstanKenyaKoreaKuwaitLaosLatin AmericaLatviaLebanonLiberiaLithuaniaMalaysiaMexicoMiddle AfricaMoldovaMoroccoNepalNetherlandsNicaraguaNigeriaNorthern AfricaNorthern EuropeOceaniaPakistanPanamaPeruPhilippinesPolandRomaniaRussiaSaudi ArabiaScotlandSerbiaSierra LeoneSingaporeSomaliaSouth AfricaSouth AmericaSouth Central AsiaSouth Eastern AsiaSouthern EuropeSpainSri LankaSudanSwedenSyriaTaiwanThailandTrinidad and TobagoTurkeyUgandaUkraineUruguayUzbekistanVenezuelaVietnamWest IndiesWestern AfricaWestern AsiaWestern EuropeZaireZimbabwe
Immigrant Origin (Percentage)
AfghanistanAfricaAlbaniaArgentinaAsiaAustraliaAustriaBangladeshBarbadosBelarusBelgiumBelizeBosnia and HerzegovinaBrazilBulgariaBurma / MyanmarCambodiaCanadaCaribbeanCentral AmericaChileChinaColombiaCongoCosta RicaCroatiaCubaCzechoslovakiaDominican RepublicEastern AfricaEastern AsiaEastern EuropeEcuadorEgyptEl SalvadorEnglandEthiopiaEuropeFranceGermanyGhanaGreeceGuatemalaGuyanaHaitiHondurasHong KongHungaryIndiaIndonesiaIranIraqIrelandIsraelItalyJamaicaJapanJordanKazakhstanKenyaKoreaKuwaitLaosLatin AmericaLatviaLebanonLiberiaLithuaniaMalaysiaMexicoMiddle AfricaMoldovaMoroccoNepalNetherlandsNicaraguaNigeriaNorthern AfricaNorthern EuropeOceaniaPakistanPanamaPeruPhilippinesPolandRomaniaRussiaSaudi ArabiaScotlandSerbiaSierra LeoneSingaporeSomaliaSouth AfricaSouth AmericaSouth Central AsiaSouth Eastern AsiaSouthern EuropeSpainSri LankaSudanSwedenSyriaTaiwanThailandTrinidad and TobagoTurkeyUgandaUkraineUruguayUzbekistanVenezuelaVietnamWest IndiesWestern AfricaWestern AsiaWestern EuropeZaireZimbabwe
Income
Income (Families)
Income (Households)
Poverty
Poverty (Families)
Unemployment
Employment Occupations
Employment Industries
Employer Class
Commute Time
Commute Means
School Enrollment
Education by Degree Field
Occupancy
Finances
Physical Characteristics
Cleveland
Compare Zip Codes
Comparison Subject

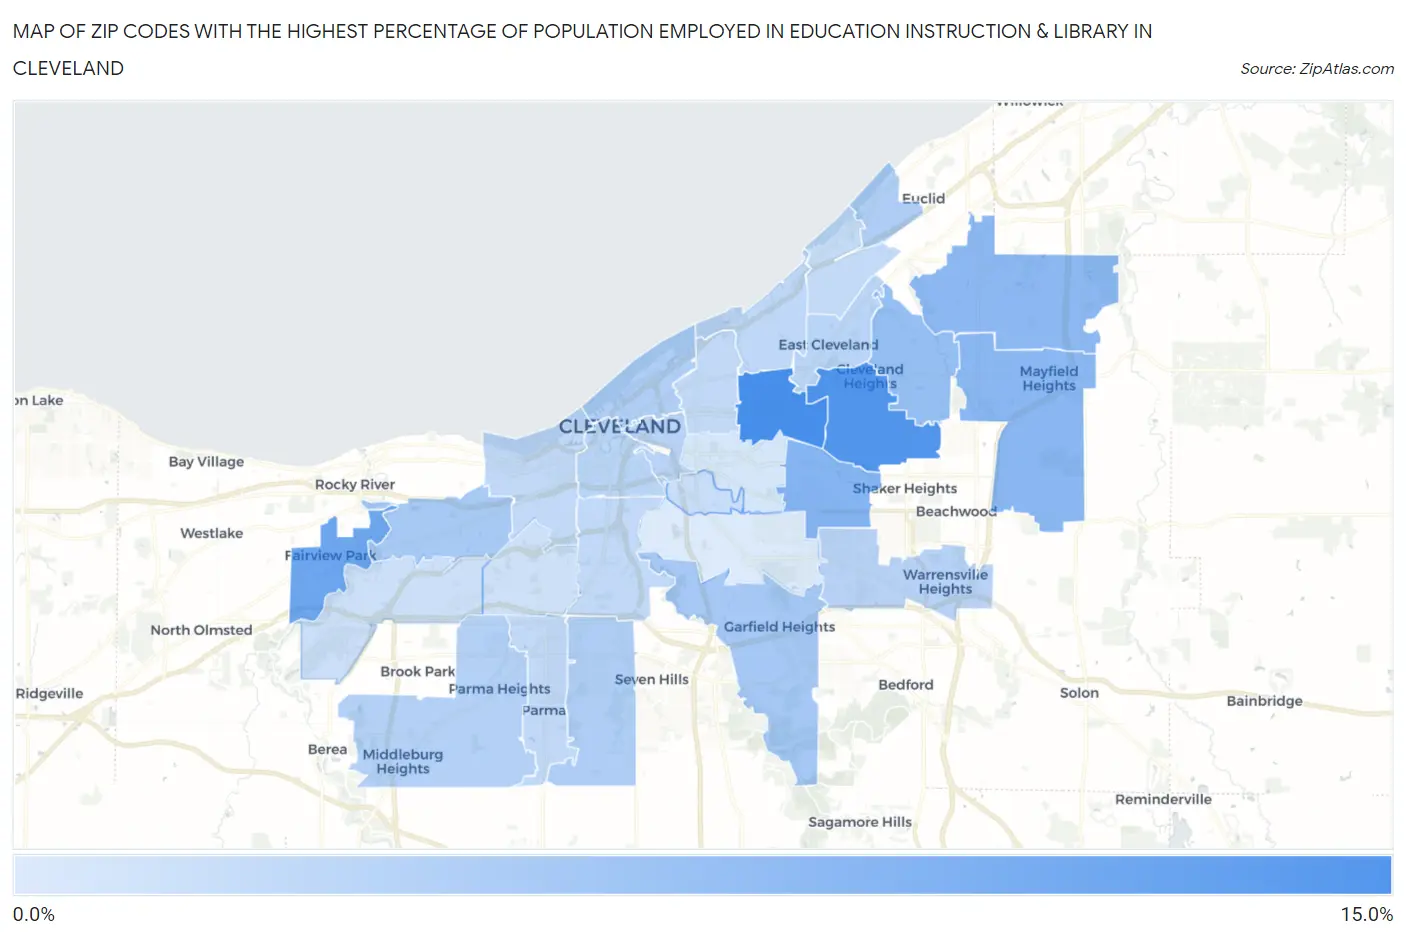
Map of Zip Codes with the Highest Percentage of Population Employed in Education Instruction & Library in Cleveland

0.0%
15.0%
Zip Codes with the Highest Percentage of Population Employed in Education Instruction & Library in Cleveland Map

Zip Codes with the Highest Percentage of Population Employed in Education Instruction & Library in Cleveland, OH

Zip Code % Employed vs State vs National
1.4410611.2%5.7%(+5.59)#606.2%(+5.06)#2,891
2.4411810.6%5.7%(+4.92)#776.2%(+4.38)#3,392
3.441268.6%5.7%(+3.00)#1326.2%(+2.47)#5,821
4.441207.2%5.7%(+1.58)#2246.2%(+1.05)#9,214
5.441246.9%5.7%(+1.30)#2506.2%(+0.765)#10,083
6.441436.7%5.7%(+1.10)#2776.2%(+0.563)#10,744
7.441216.3%5.7%(+0.599)#3326.2%(+0.067)#12,558
8.441255.3%5.7%(-0.372)#4626.2%(-0.904)#16,459
9.441115.0%5.7%(-0.621)#5106.2%(-1.15)#17,510
10.441344.7%5.7%(-0.945)#5736.2%(-1.48)#18,885
11.441194.7%5.7%(-0.965)#5776.2%(-1.50)#18,975
12.441144.5%5.7%(-1.18)#6136.2%(-1.71)#19,820
13.441304.4%5.7%(-1.21)#6216.2%(-1.74)#19,993
14.441154.2%5.7%(-1.50)#6706.2%(-2.03)#21,082
15.441284.0%5.7%(-1.60)#6916.2%(-2.14)#21,498
16.441124.0%5.7%(-1.67)#7026.2%(-2.20)#21,739
17.441133.9%5.7%(-1.74)#7146.2%(-2.27)#21,971
18.441083.7%5.7%(-1.95)#7466.2%(-2.48)#22,720
19.441293.6%5.7%(-2.07)#7626.2%(-2.60)#23,099
20.441093.5%5.7%(-2.12)#7756.2%(-2.65)#23,279
21.441033.5%5.7%(-2.16)#7786.2%(-2.69)#23,390
22.441023.5%5.7%(-2.18)#7836.2%(-2.71)#23,455
23.441103.4%5.7%(-2.21)#7906.2%(-2.74)#23,539
24.441273.1%5.7%(-2.52)#8356.2%(-3.06)#24,516
25.441352.8%5.7%(-2.86)#8676.2%(-3.39)#25,304
26.441442.7%5.7%(-2.98)#8896.2%(-3.52)#25,624
27.441042.3%5.7%(-3.32)#9326.2%(-3.85)#26,351
28.441051.9%5.7%(-3.79)#9806.2%(-4.32)#27,157

Common Questions

What are the Top 10 Zip Codes with the Highest Percentage of Population Employed in Education Instruction & Library in Cleveland, OH?
Top 10 Zip Codes with the Highest Percentage of Population Employed in Education Instruction & Library in Cleveland, OH are:
#1
11.2%
#2
10.6%
#3
8.6%
#4
7.2%
#5
6.9%
#6
6.7%
#7
6.3%
#8
5.3%
#9
5.0%
#10
4.7%
What zip code has the Highest Percentage of Population Employed in Education Instruction & Library in Cleveland, OH?
44106 has the Highest Percentage of Population Employed in Education Instruction & Library in Cleveland, OH with 11.2%.
What is the Percentage of Population Employed in Education Instruction & Library in Cleveland, OH?
Percentage of Population Employed in Education Instruction & Library in Cleveland is 4.0%.
What is the Percentage of Population Employed in Education Instruction & Library in Ohio?
Percentage of Population Employed in Education Instruction & Library in Ohio is 5.7%.
What is the Percentage of Population Employed in Education Instruction & Library in the United States?
Percentage of Population Employed in Education Instruction & Library in the United States is 6.2%.