Zip Codes with the Highest Percentage of Population Employed in Firefighting & Prevention in Cleveland, OH

RELATED REPORTS & OPTIONS

Firefighting & Prevention
Population
Families and Households
Female Fertility
Female Fertility (Unmarried)
Race (Community Size)
Race (Percentage)
Ancestry (Community Size)
AfghanAfricanAlbanianAlsatianAmericanApacheArabArgentineanArmenianAustralianAustrianBahamianBangladeshiBarbadianBelgianBelizeanBhutaneseBlackfeetBrazilianBritishBritish West IndianBulgarianBurmeseCajunCambodianCanadianCape VerdeanCarpatho RusynCelticCentral AmericanCentral American IndianCherokeeChickasawChileanChippewaChoctawColombianComancheCosta RicanCreekCroatianCubanCzechCzechoslovakianDanishDelawareDominicanDutchDutch West IndianEastern EuropeanEcuadorianEgyptianEnglishEstonianEthiopianEuropeanFilipinoFinnishFrenchFrench American IndianFrench CanadianGermanGhanaianGreekGuamanian / ChamorroGuatemalanGuyaneseHaitianHonduranHungarianIcelanderIndian (Asian)IndonesianIranianIraqiIrishIroquoisIsraeliItalianJamaicanJapaneseJordanianKoreanLaotianLatvianLebaneseLiberianLithuanianLumbeeLuxembourgerMacedonianMalaysianMexicanMexican American IndianMongolianMoroccanNative HawaiianNavajoNicaraguanNigerianNorthern EuropeanNorwegianPakistaniPalestinianPanamanianParaguayanPennsylvania GermanPeruvianPolishPortuguesePuebloPuerto RicanRomanianRussianSalvadoranSamoanScandinavianScotch-IrishScottishSeminoleSerbianSierra LeoneanSiouxSlavicSlovakSloveneSomaliSouth AfricanSouth AmericanSouth American IndianSpaniardSpanishSri LankanSubsaharan AfricanSudaneseSwedishSwissSyrianThaiTrinidadian and TobagonianTurkishU.S. Virgin IslanderUgandanUkrainianUruguayanVenezuelanVietnameseWelshWest IndianYaquiYugoslavianZimbabwean
Ancestry (Percentage)
AfghanAfricanAlbanianAlsatianAmericanApacheArabArgentineanArmenianAustralianAustrianBahamianBangladeshiBarbadianBelgianBelizeanBhutaneseBlackfeetBrazilianBritishBritish West IndianBulgarianBurmeseCajunCambodianCanadianCape VerdeanCarpatho RusynCelticCentral AmericanCentral American IndianCherokeeChickasawChileanChippewaChoctawColombianComancheCosta RicanCreekCroatianCubanCzechCzechoslovakianDanishDelawareDominicanDutchDutch West IndianEastern EuropeanEcuadorianEgyptianEnglishEstonianEthiopianEuropeanFilipinoFinnishFrenchFrench American IndianFrench CanadianGermanGhanaianGreekGuamanian / ChamorroGuatemalanGuyaneseHaitianHonduranHungarianIcelanderIndian (Asian)IndonesianIranianIraqiIrishIroquoisIsraeliItalianJamaicanJapaneseJordanianKoreanLaotianLatvianLebaneseLiberianLithuanianLumbeeLuxembourgerMacedonianMalaysianMexicanMexican American IndianMongolianMoroccanNative HawaiianNavajoNicaraguanNigerianNorthern EuropeanNorwegianPakistaniPalestinianPanamanianParaguayanPennsylvania GermanPeruvianPolishPortuguesePuebloPuerto RicanRomanianRussianSalvadoranSamoanScandinavianScotch-IrishScottishSeminoleSerbianSierra LeoneanSiouxSlavicSlovakSloveneSomaliSouth AfricanSouth AmericanSouth American IndianSpaniardSpanishSri LankanSubsaharan AfricanSudaneseSwedishSwissSyrianThaiTrinidadian and TobagonianTurkishU.S. Virgin IslanderUgandanUkrainianUruguayanVenezuelanVietnameseWelshWest IndianYaquiYugoslavianZimbabwean
Immigrant Origin (Total)
AfghanistanAfricaAlbaniaArgentinaAsiaAustraliaAustriaBangladeshBarbadosBelarusBelgiumBelizeBosnia and HerzegovinaBrazilBulgariaBurma / MyanmarCambodiaCanadaCaribbeanCentral AmericaChileChinaColombiaCongoCosta RicaCroatiaCubaCzechoslovakiaDominican RepublicEastern AfricaEastern AsiaEastern EuropeEcuadorEgyptEl SalvadorEnglandEthiopiaEuropeFranceGermanyGhanaGreeceGuatemalaGuyanaHaitiHondurasHong KongHungaryIndiaIndonesiaIranIraqIrelandIsraelItalyJamaicaJapanJordanKazakhstanKenyaKoreaKuwaitLaosLatin AmericaLatviaLebanonLiberiaLithuaniaMalaysiaMexicoMiddle AfricaMoldovaMoroccoNepalNetherlandsNicaraguaNigeriaNorthern AfricaNorthern EuropeOceaniaPakistanPanamaPeruPhilippinesPolandRomaniaRussiaSaudi ArabiaScotlandSerbiaSierra LeoneSingaporeSomaliaSouth AfricaSouth AmericaSouth Central AsiaSouth Eastern AsiaSouthern EuropeSpainSri LankaSudanSwedenSyriaTaiwanThailandTrinidad and TobagoTurkeyUgandaUkraineUruguayUzbekistanVenezuelaVietnamWest IndiesWestern AfricaWestern AsiaWestern EuropeZaireZimbabwe
Immigrant Origin (Percentage)
AfghanistanAfricaAlbaniaArgentinaAsiaAustraliaAustriaBangladeshBarbadosBelarusBelgiumBelizeBosnia and HerzegovinaBrazilBulgariaBurma / MyanmarCambodiaCanadaCaribbeanCentral AmericaChileChinaColombiaCongoCosta RicaCroatiaCubaCzechoslovakiaDominican RepublicEastern AfricaEastern AsiaEastern EuropeEcuadorEgyptEl SalvadorEnglandEthiopiaEuropeFranceGermanyGhanaGreeceGuatemalaGuyanaHaitiHondurasHong KongHungaryIndiaIndonesiaIranIraqIrelandIsraelItalyJamaicaJapanJordanKazakhstanKenyaKoreaKuwaitLaosLatin AmericaLatviaLebanonLiberiaLithuaniaMalaysiaMexicoMiddle AfricaMoldovaMoroccoNepalNetherlandsNicaraguaNigeriaNorthern AfricaNorthern EuropeOceaniaPakistanPanamaPeruPhilippinesPolandRomaniaRussiaSaudi ArabiaScotlandSerbiaSierra LeoneSingaporeSomaliaSouth AfricaSouth AmericaSouth Central AsiaSouth Eastern AsiaSouthern EuropeSpainSri LankaSudanSwedenSyriaTaiwanThailandTrinidad and TobagoTurkeyUgandaUkraineUruguayUzbekistanVenezuelaVietnamWest IndiesWestern AfricaWestern AsiaWestern EuropeZaireZimbabwe
Income
Income (Families)
Income (Households)
Poverty
Poverty (Families)
Unemployment
Employment Occupations
Employment Industries
Employer Class
Commute Time
Commute Means
School Enrollment
Education by Degree Field
Occupancy
Finances
Physical Characteristics
Cleveland
Compare Zip Codes
Comparison Subject

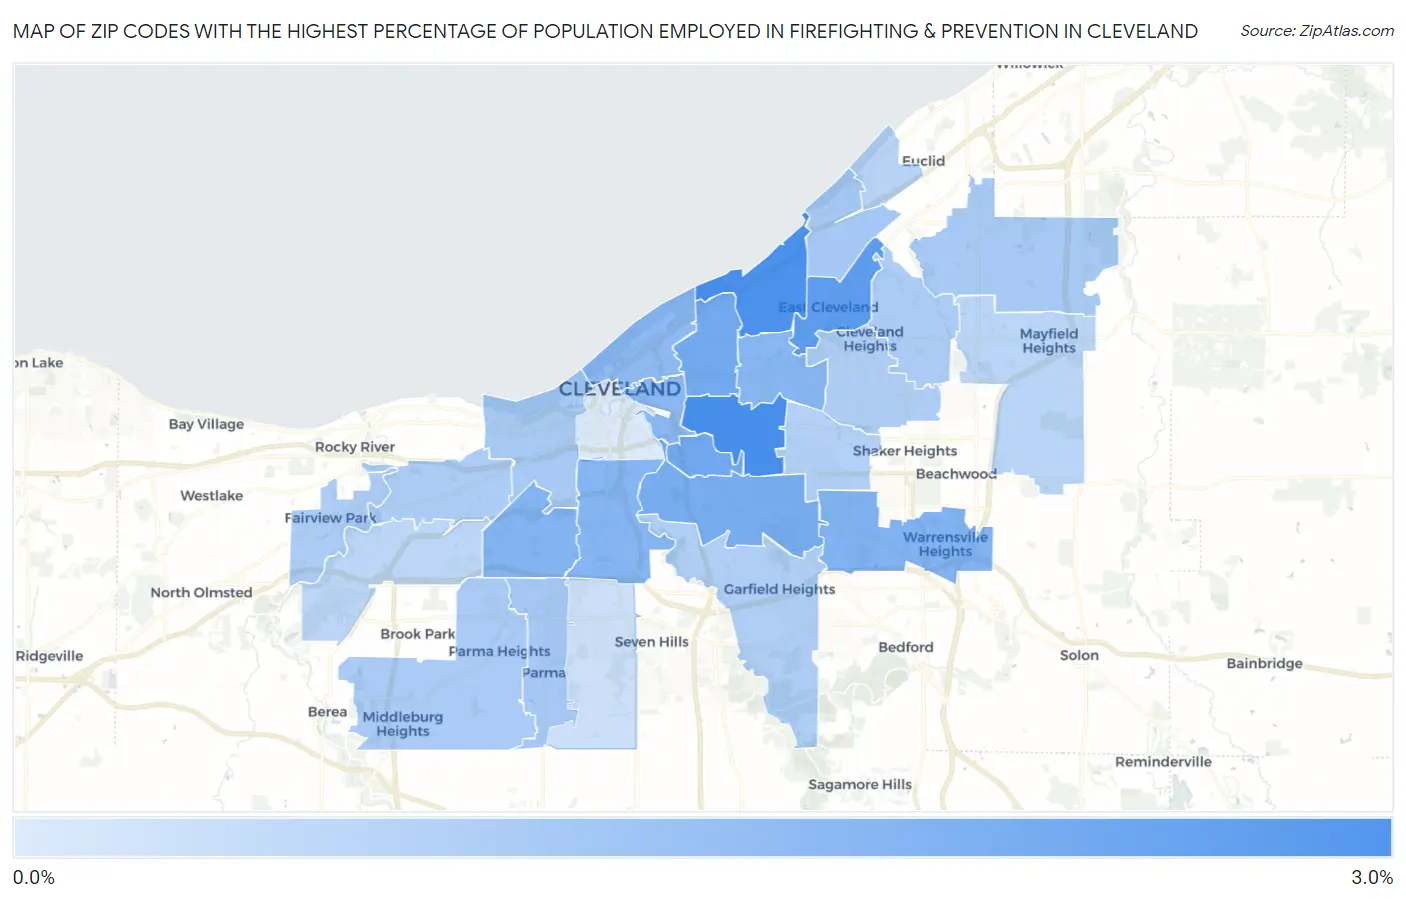
Map of Zip Codes with the Highest Percentage of Population Employed in Firefighting & Prevention in Cleveland

0.0%
3.0%
Zip Codes with the Highest Percentage of Population Employed in Firefighting & Prevention in Cleveland Map

Zip Codes with the Highest Percentage of Population Employed in Firefighting & Prevention in Cleveland, OH

Zip Code % Employed vs State vs National
1.441042.7%1.1%(+1.68)#671.2%(+1.56)#2,649
2.441082.7%1.1%(+1.60)#731.2%(+1.48)#2,781
3.441122.4%1.1%(+1.29)#911.2%(+1.17)#3,442
4.441272.0%1.1%(+0.973)#1261.2%(+0.854)#4,374
5.441032.0%1.1%(+0.939)#1291.2%(+0.819)#4,492
6.441051.9%1.1%(+0.868)#1391.2%(+0.749)#4,767
7.441281.8%1.1%(+0.729)#1541.2%(+0.610)#5,376
8.441441.8%1.1%(+0.703)#1591.2%(+0.583)#5,498
9.441091.7%1.1%(+0.645)#1751.2%(+0.525)#5,789
10.441061.7%1.1%(+0.615)#1811.2%(+0.495)#5,936
11.441151.6%1.1%(+0.575)#1881.2%(+0.455)#6,156
12.441141.6%1.1%(+0.496)#2061.2%(+0.376)#6,590
13.441291.2%1.1%(+0.107)#3111.2%(-0.013)#9,389
14.441101.2%1.1%(+0.107)#3121.2%(-0.013)#9,391
15.441021.2%1.1%(+0.085)#3221.2%(-0.035)#9,616
16.441431.1%1.1%(+0.060)#3371.2%(-0.060)#9,863
17.441301.1%1.1%(+0.052)#3411.2%(-0.067)#9,933
18.441261.1%1.1%(+0.008)#3541.2%(-0.112)#10,351
19.441111.1%1.1%(-0.011)#3671.2%(-0.131)#10,546
20.441211.0%1.1%(-0.018)#3691.2%(-0.138)#10,616
21.441251.0%1.1%(-0.029)#3711.2%(-0.149)#10,709
22.441181.0%1.1%(-0.033)#3731.2%(-0.153)#10,741
23.441200.95%1.1%(-0.113)#4201.2%(-0.233)#11,610
24.441190.89%1.1%(-0.181)#4491.2%(-0.300)#12,309
25.441240.83%1.1%(-0.235)#4791.2%(-0.355)#12,856
26.441350.79%1.1%(-0.272)#5031.2%(-0.392)#13,283
27.441340.52%1.1%(-0.544)#6371.2%(-0.664)#16,300
28.441130.27%1.1%(-0.792)#7421.2%(-0.912)#19,024

Common Questions

What are the Top 10 Zip Codes with the Highest Percentage of Population Employed in Firefighting & Prevention in Cleveland, OH?
Top 10 Zip Codes with the Highest Percentage of Population Employed in Firefighting & Prevention in Cleveland, OH are:
#1
2.7%
#2
2.7%
#3
2.4%
#4
2.0%
#5
2.0%
#6
1.9%
#7
1.8%
#8
1.8%
#9
1.7%
#10
1.7%
What zip code has the Highest Percentage of Population Employed in Firefighting & Prevention in Cleveland, OH?
44104 has the Highest Percentage of Population Employed in Firefighting & Prevention in Cleveland, OH with 2.7%.
What is the Percentage of Population Employed in Firefighting & Prevention in Cleveland, OH?
Percentage of Population Employed in Firefighting & Prevention in Cleveland is 1.5%.
What is the Percentage of Population Employed in Firefighting & Prevention in Ohio?
Percentage of Population Employed in Firefighting & Prevention in Ohio is 1.1%.
What is the Percentage of Population Employed in Firefighting & Prevention in the United States?
Percentage of Population Employed in Firefighting & Prevention in the United States is 1.2%.