Zip Codes with the Highest Percentage of Population with a Degree in Education in Massillon, OH
RELATED REPORTS & OPTIONS
Education
Massillon
Compare Zip Codes
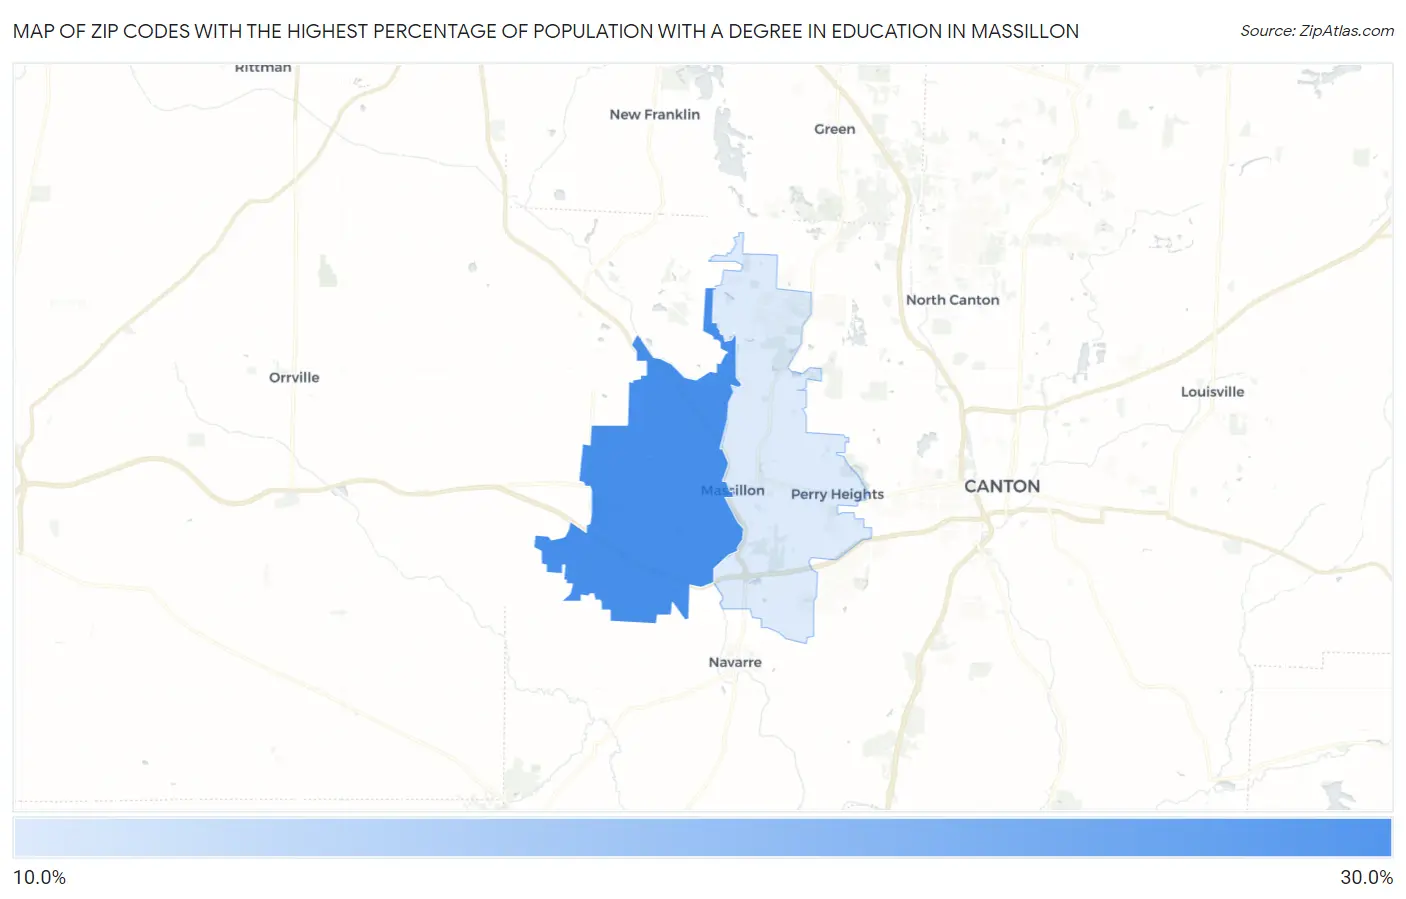
Map of Zip Codes with the Highest Percentage of Population with a Degree in Education in Massillon
18.2%
26.0%
Zip Codes with the Highest Percentage of Population with a Degree in Education in Massillon, OH
| Zip Code | % Graduates | vs State | vs National | |
| 1. | 44647 | 26.0% | 14.4%(+11.6)#258 | 11.1%(+14.9)#6,321 |
| 2. | 44646 | 18.2% | 14.4%(+3.87)#529 | 11.1%(+7.17)#12,143 |
1
Common Questions
What are the Top Zip Codes with the Highest Percentage of Population with a Degree in Education in Massillon, OH?
Top Zip Codes with the Highest Percentage of Population with a Degree in Education in Massillon, OH are:
What zip code has the Highest Percentage of Population with a Degree in Education in Massillon, OH?
44647 has the Highest Percentage of Population with a Degree in Education in Massillon, OH with 26.0%.
What is the Percentage of Population with a Degree in Education in Massillon, OH?
Percentage of Population with a Degree in Education in Massillon is 22.0%.
What is the Percentage of Population with a Degree in Education in Ohio?
Percentage of Population with a Degree in Education in Ohio is 14.4%.
What is the Percentage of Population with a Degree in Education in the United States?
Percentage of Population with a Degree in Education in the United States is 11.1%.