Zip Codes with the Highest Percentage of Population Driving Alone to Work in Bowling Green, OH
RELATED REPORTS & OPTIONS
Drive | Alone
Bowling Green
Compare Zip Codes
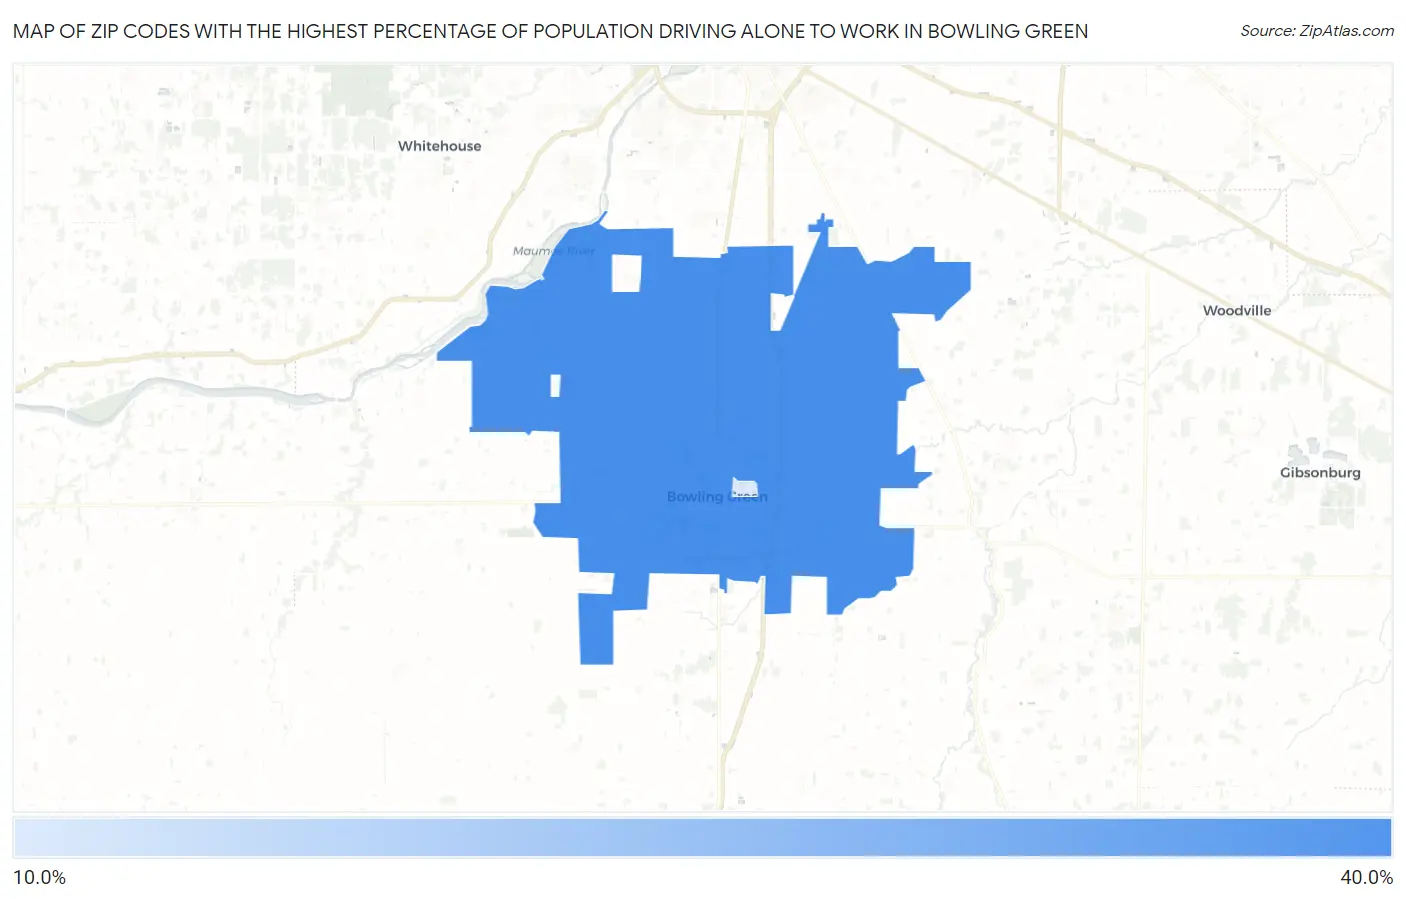
Map of Zip Codes with the Highest Percentage of Population Driving Alone to Work in Bowling Green
19.4%
30.2%
Zip Codes with the Highest Percentage of Population Driving Alone to Work in Bowling Green, OH
| Zip Code | % Drive Alone | vs State | vs National | |
| 1. | 43402 | 30.2% | 42.6%(-12.4)#1,143 | 42.1%(-11.9)#30,666 |
| 2. | 43403 | 19.4% | 42.6%(-23.2)#1,174 | 42.1%(-22.7)#31,505 |
1
Common Questions
What are the Top Zip Codes with the Highest Percentage of Population Driving Alone to Work in Bowling Green, OH?
Top Zip Codes with the Highest Percentage of Population Driving Alone to Work in Bowling Green, OH are:
What zip code has the Highest Percentage of Population Driving Alone to Work in Bowling Green, OH?
43402 has the Highest Percentage of Population Driving Alone to Work in Bowling Green, OH with 30.2%.
What is the Percentage of Population Driving Alone to Work in Bowling Green, OH?
Percentage of Population Driving Alone to Work in Bowling Green is 25.8%.
What is the Percentage of Population Driving Alone to Work in Ohio?
Percentage of Population Driving Alone to Work in Ohio is 42.6%.
What is the Percentage of Population Driving Alone to Work in the United States?
Percentage of Population Driving Alone to Work in the United States is 42.1%.