Zip Codes with the Highest Percentage of Population Employed in Cleaning & Maintenance in Bowling Green, OH
RELATED REPORTS & OPTIONS
Cleaning & Maintenance
Bowling Green
Compare Zip Codes
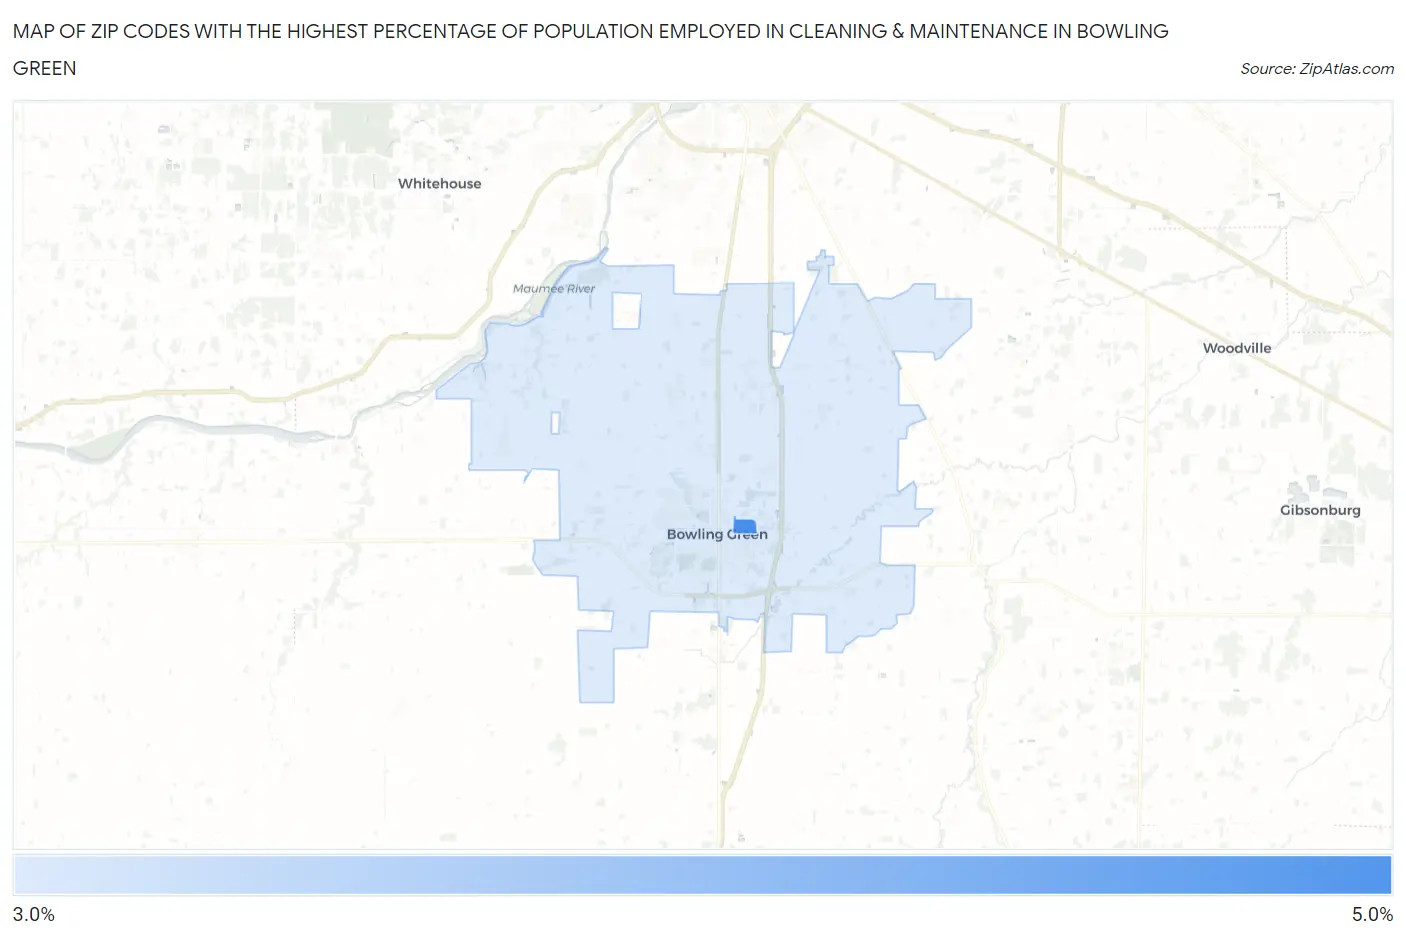
Map of Zip Codes with the Highest Percentage of Population Employed in Cleaning & Maintenance in Bowling Green
3.4%
4.9%
Zip Codes with the Highest Percentage of Population Employed in Cleaning & Maintenance in Bowling Green, OH
| Zip Code | % Employed | vs State | vs National | |
| 1. | 43403 | 4.9% | 3.2%(+1.71)#272 | 3.5%(+1.44)#8,163 |
| 2. | 43402 | 3.4% | 3.2%(+0.191)#521 | 3.5%(-0.077)#13,862 |
1
Common Questions
What are the Top Zip Codes with the Highest Percentage of Population Employed in Cleaning & Maintenance in Bowling Green, OH?
Top Zip Codes with the Highest Percentage of Population Employed in Cleaning & Maintenance in Bowling Green, OH are:
What zip code has the Highest Percentage of Population Employed in Cleaning & Maintenance in Bowling Green, OH?
43403 has the Highest Percentage of Population Employed in Cleaning & Maintenance in Bowling Green, OH with 4.9%.
What is the Percentage of Population Employed in Cleaning & Maintenance in Bowling Green, OH?
Percentage of Population Employed in Cleaning & Maintenance in Bowling Green is 3.6%.
What is the Percentage of Population Employed in Cleaning & Maintenance in Ohio?
Percentage of Population Employed in Cleaning & Maintenance in Ohio is 3.2%.
What is the Percentage of Population Employed in Cleaning & Maintenance in the United States?
Percentage of Population Employed in Cleaning & Maintenance in the United States is 3.5%.