Zip Codes with the Highest Percentage of Population Employed in Architecture & Engineering in Camden, NJ
RELATED REPORTS & OPTIONS
Architecture & Engineering
Camden
Compare Zip Codes
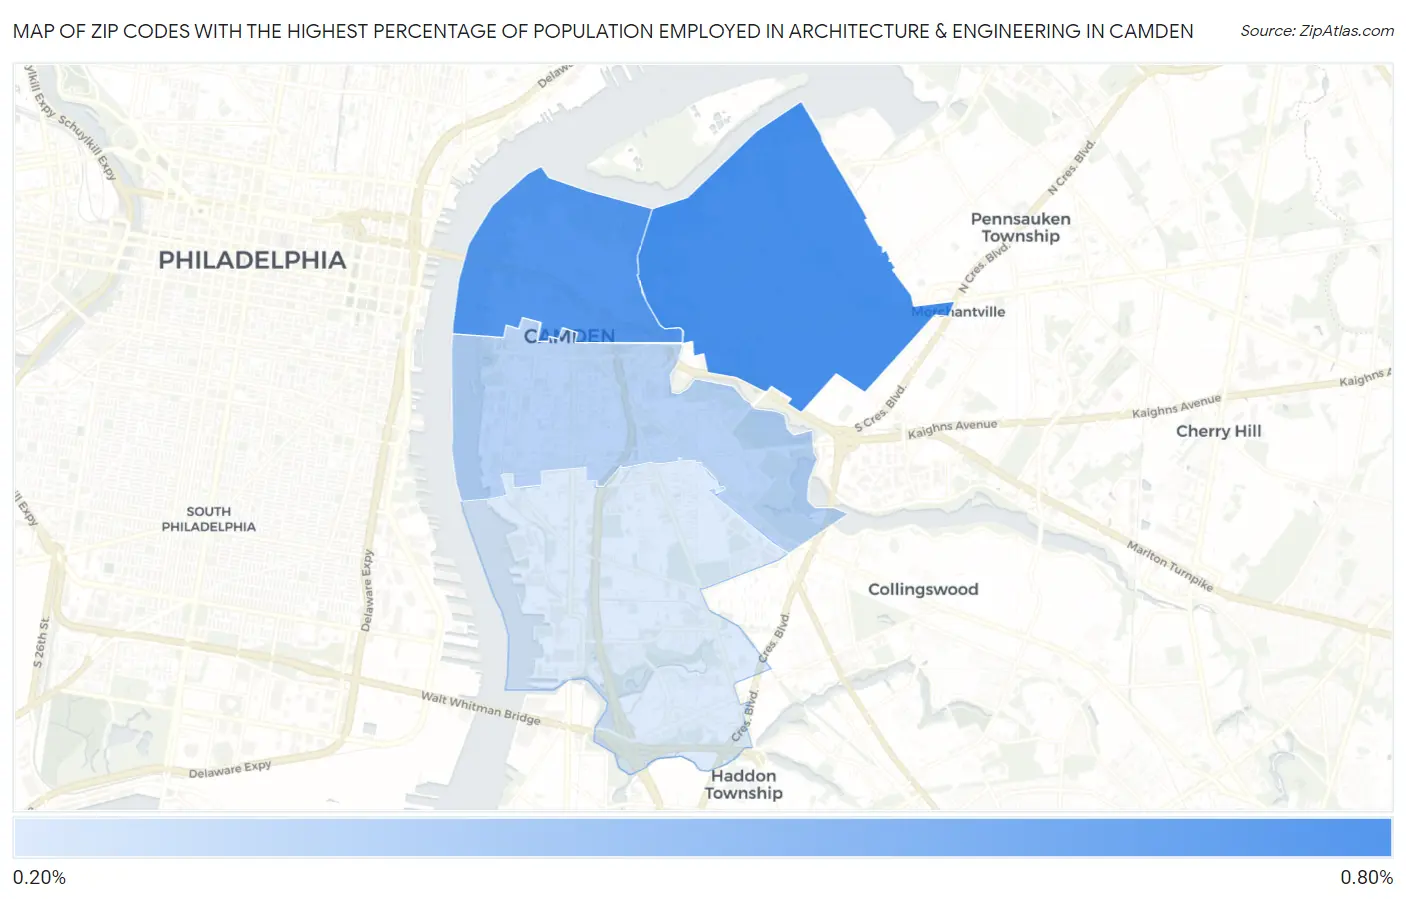
Map of Zip Codes with the Highest Percentage of Population Employed in Architecture & Engineering in Camden
0.26%
0.64%
Zip Codes with the Highest Percentage of Population Employed in Architecture & Engineering in Camden, NJ
| Zip Code | % Employed | vs State | vs National | |
| 1. | 08105 | 0.64% | 1.9%(-1.26)#475 | 2.1%(-1.51)#19,356 |
| 2. | 08102 | 0.60% | 1.9%(-1.29)#478 | 2.1%(-1.55)#19,613 |
| 3. | 08103 | 0.36% | 1.9%(-1.54)#509 | 2.1%(-1.79)#21,257 |
| 4. | 08104 | 0.26% | 1.9%(-1.63)#515 | 2.1%(-1.88)#21,750 |
1
Common Questions
What are the Top 3 Zip Codes with the Highest Percentage of Population Employed in Architecture & Engineering in Camden, NJ?
Top 3 Zip Codes with the Highest Percentage of Population Employed in Architecture & Engineering in Camden, NJ are:
What zip code has the Highest Percentage of Population Employed in Architecture & Engineering in Camden, NJ?
08105 has the Highest Percentage of Population Employed in Architecture & Engineering in Camden, NJ with 0.64%.
What is the Percentage of Population Employed in Architecture & Engineering in Camden, NJ?
Percentage of Population Employed in Architecture & Engineering in Camden is 0.46%.
What is the Percentage of Population Employed in Architecture & Engineering in New Jersey?
Percentage of Population Employed in Architecture & Engineering in New Jersey is 1.9%.
What is the Percentage of Population Employed in Architecture & Engineering in the United States?
Percentage of Population Employed in Architecture & Engineering in the United States is 2.1%.