Zip Codes with the Highest Percentage of Population Employed in Security & Protection in Camden, NJ
RELATED REPORTS & OPTIONS
Security & Protection
Camden
Compare Zip Codes
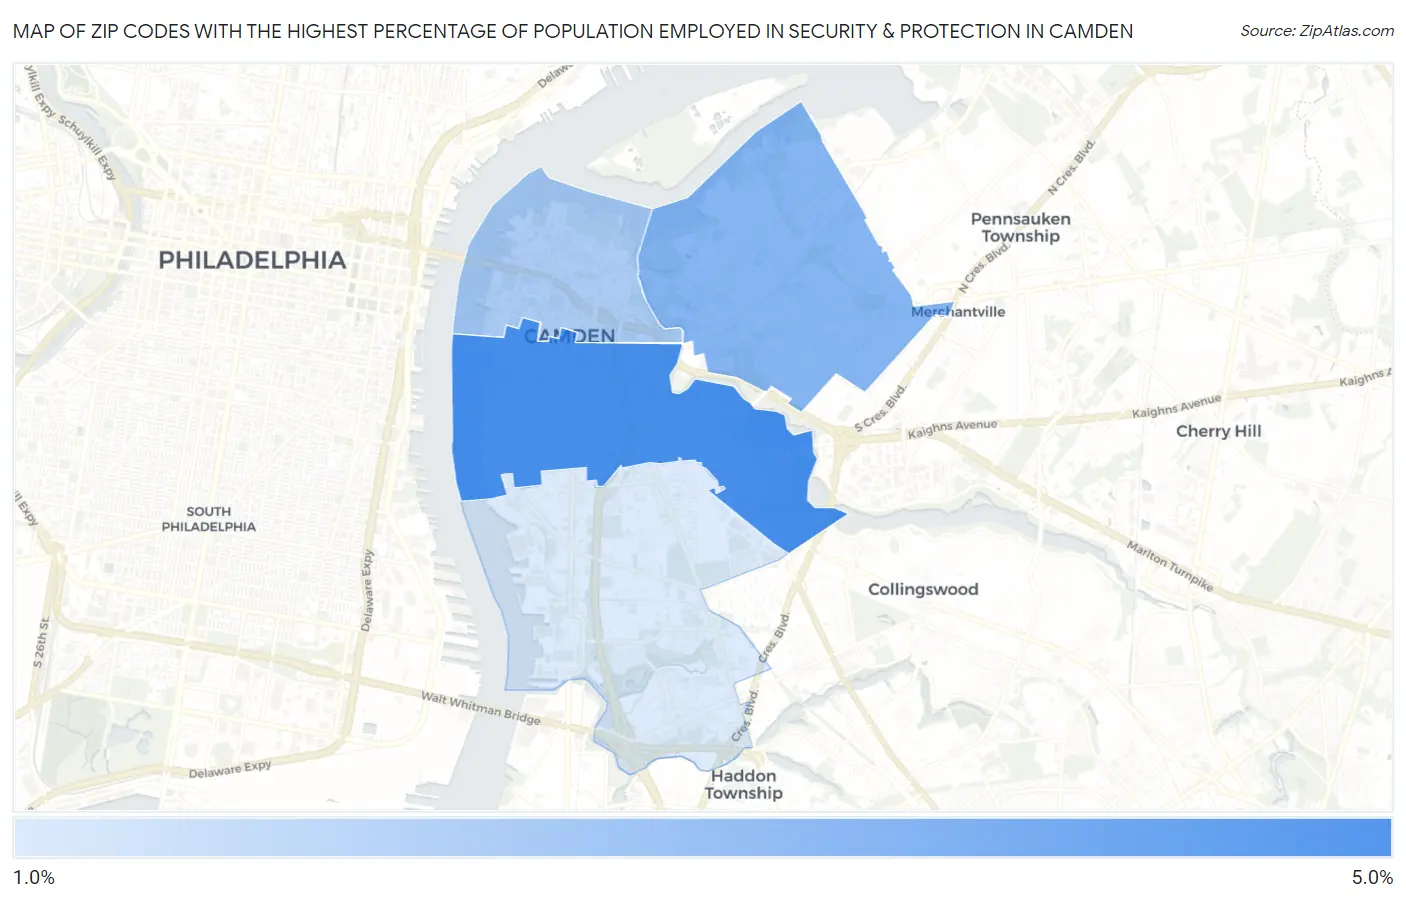
Map of Zip Codes with the Highest Percentage of Population Employed in Security & Protection in Camden
1.6%
4.7%
Zip Codes with the Highest Percentage of Population Employed in Security & Protection in Camden, NJ
| Zip Code | % Employed | vs State | vs National | |
| 1. | 08103 | 4.7% | 2.4%(+2.31)#50 | 2.1%(+2.57)#3,281 |
| 2. | 08105 | 3.4% | 2.4%(+0.987)#127 | 2.1%(+1.24)#5,975 |
| 3. | 08102 | 2.6% | 2.4%(+0.216)#215 | 2.1%(+0.470)#8,916 |
| 4. | 08104 | 1.6% | 2.4%(-0.843)#373 | 2.1%(-0.589)#15,727 |
1
Common Questions
What are the Top 3 Zip Codes with the Highest Percentage of Population Employed in Security & Protection in Camden, NJ?
Top 3 Zip Codes with the Highest Percentage of Population Employed in Security & Protection in Camden, NJ are:
What zip code has the Highest Percentage of Population Employed in Security & Protection in Camden, NJ?
08103 has the Highest Percentage of Population Employed in Security & Protection in Camden, NJ with 4.7%.
What is the Percentage of Population Employed in Security & Protection in Camden, NJ?
Percentage of Population Employed in Security & Protection in Camden is 2.9%.
What is the Percentage of Population Employed in Security & Protection in New Jersey?
Percentage of Population Employed in Security & Protection in New Jersey is 2.4%.
What is the Percentage of Population Employed in Security & Protection in the United States?
Percentage of Population Employed in Security & Protection in the United States is 2.1%.