Zip Codes with the Highest Percentage of Population Employed in Food Preparation & Serving in Camden, NJ
RELATED REPORTS & OPTIONS
Food Preparation & Serving
Camden
Compare Zip Codes
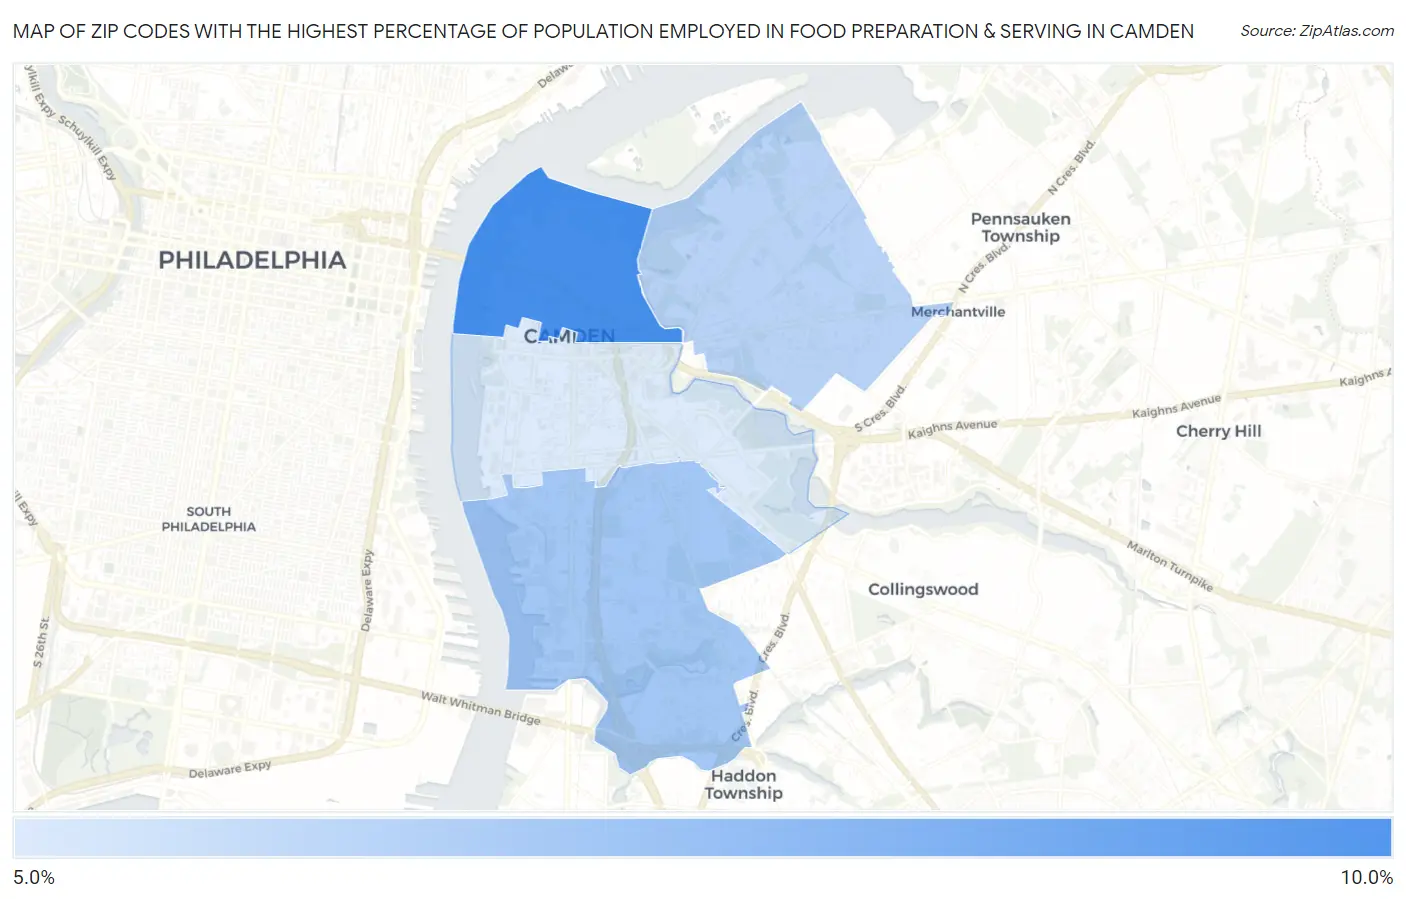
Map of Zip Codes with the Highest Percentage of Population Employed in Food Preparation & Serving in Camden
5.5%
9.1%
Zip Codes with the Highest Percentage of Population Employed in Food Preparation & Serving in Camden, NJ
| Zip Code | % Employed | vs State | vs National | |
| 1. | 08102 | 9.1% | 4.0%(+5.10)#28 | 5.3%(+3.77)#3,462 |
| 2. | 08104 | 6.9% | 4.0%(+2.90)#57 | 5.3%(+1.58)#6,905 |
| 3. | 08105 | 6.4% | 4.0%(+2.40)#73 | 5.3%(+1.07)#8,243 |
| 4. | 08103 | 5.5% | 4.0%(+1.54)#105 | 5.3%(+0.217)#11,060 |
1
Common Questions
What are the Top 3 Zip Codes with the Highest Percentage of Population Employed in Food Preparation & Serving in Camden, NJ?
Top 3 Zip Codes with the Highest Percentage of Population Employed in Food Preparation & Serving in Camden, NJ are:
What zip code has the Highest Percentage of Population Employed in Food Preparation & Serving in Camden, NJ?
08102 has the Highest Percentage of Population Employed in Food Preparation & Serving in Camden, NJ with 9.1%.
What is the Percentage of Population Employed in Food Preparation & Serving in Camden, NJ?
Percentage of Population Employed in Food Preparation & Serving in Camden is 6.7%.
What is the Percentage of Population Employed in Food Preparation & Serving in New Jersey?
Percentage of Population Employed in Food Preparation & Serving in New Jersey is 4.0%.
What is the Percentage of Population Employed in Food Preparation & Serving in the United States?
Percentage of Population Employed in Food Preparation & Serving in the United States is 5.3%.