Zip Codes with the Highest Percentage of Households With Three or more Vehicles in Camden, NJ
RELATED REPORTS & OPTIONS
Households with 3 or more Cars
Camden
Compare Zip Codes
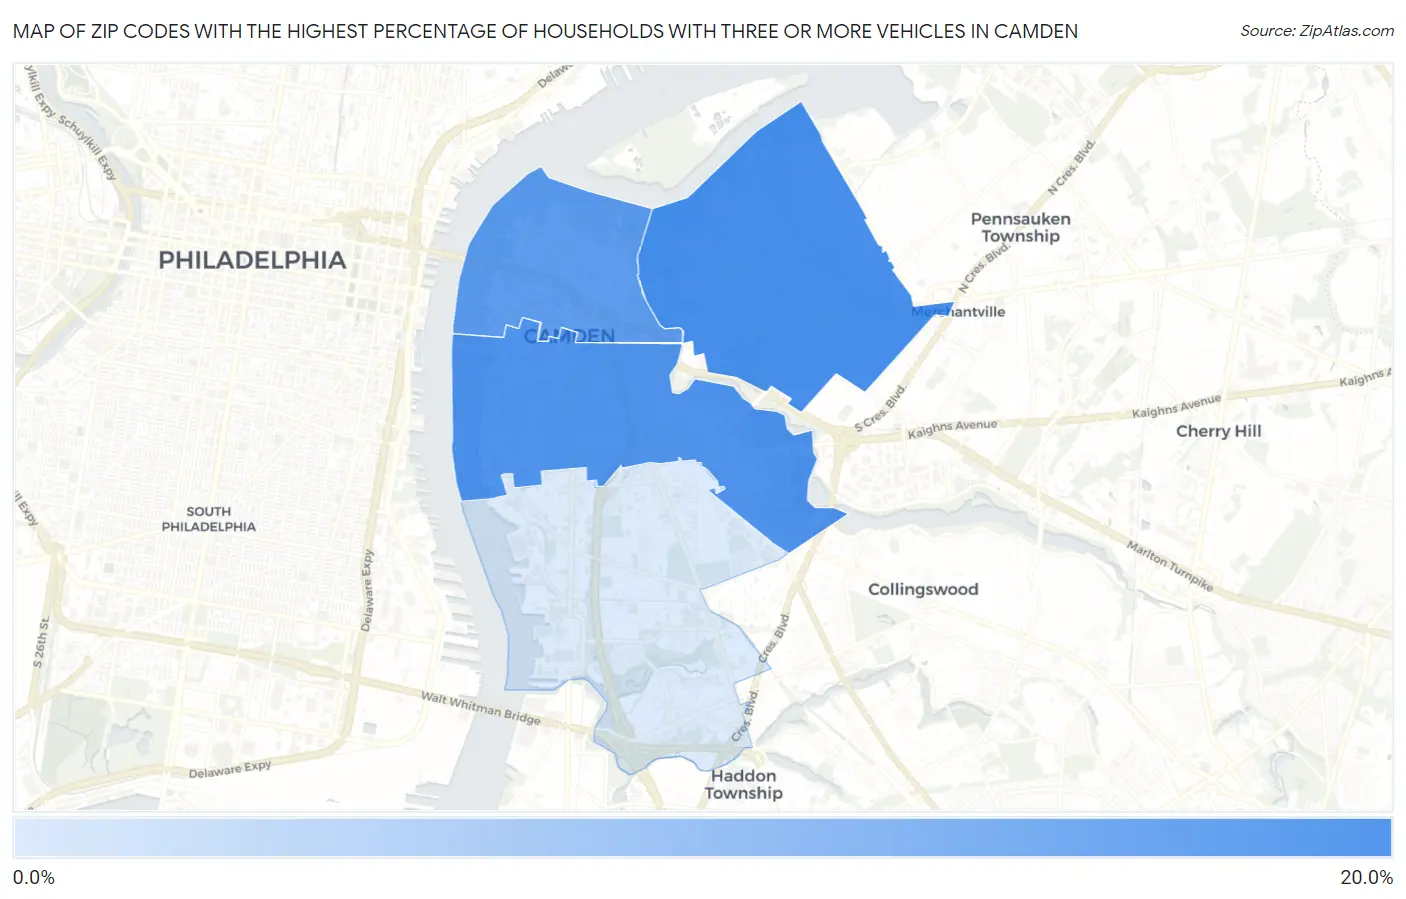
Map of Zip Codes with the Highest Percentage of Households With Three or more Vehicles in Camden
7.6%
18.6%
Zip Codes with the Highest Percentage of Households With Three or more Vehicles in Camden, NJ
| Zip Code | Housholds With 3+ Cars | vs State | vs National | |
| 1. | 08105 | 18.6% | 25.8%(-7.20)#473 | 29.0%(-10.4)#27,468 |
| 2. | 08103 | 18.0% | 25.8%(-7.80)#480 | 29.0%(-11.0)#27,808 |
| 3. | 08102 | 16.8% | 25.8%(-9.00)#498 | 29.0%(-12.2)#28,402 |
| 4. | 08104 | 7.6% | 25.8%(-18.2)#555 | 29.0%(-21.4)#30,795 |
1
Common Questions
What are the Top 3 Zip Codes with the Highest Percentage of Households With Three or more Vehicles in Camden, NJ?
Top 3 Zip Codes with the Highest Percentage of Households With Three or more Vehicles in Camden, NJ are:
What zip code has the Highest Percentage of Households With Three or more Vehicles in Camden, NJ?
08105 has the Highest Percentage of Households With Three or more Vehicles in Camden, NJ with 18.6%.
What is the Percentage of Households With Three or more Vehicles in Camden, NJ?
Percentage of Households With Three or more Vehicles in Camden is 15.5%.
What is the Percentage of Households With Three or more Vehicles in New Jersey?
Percentage of Households With Three or more Vehicles in New Jersey is 25.8%.
What is the Percentage of Households With Three or more Vehicles in the United States?
Percentage of Households With Three or more Vehicles in the United States is 29.0%.