Zip Codes with the Highest Percentage of Population Employed in Architecture & Engineering in Toms River, NJ
RELATED REPORTS & OPTIONS
Architecture & Engineering
Toms River
Compare Zip Codes
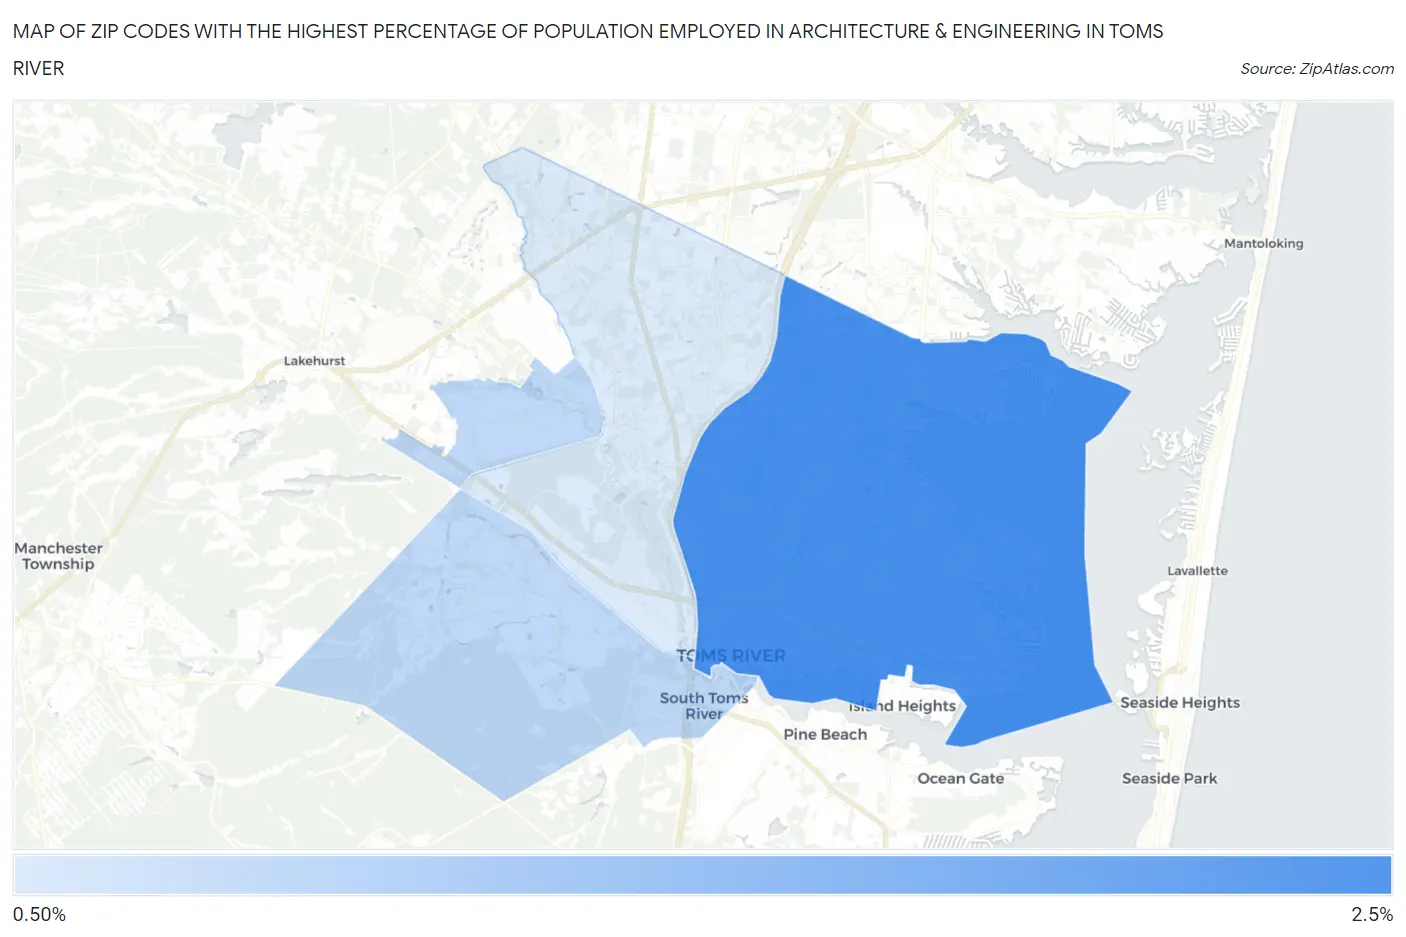
Map of Zip Codes with the Highest Percentage of Population Employed in Architecture & Engineering in Toms River
0.82%
2.0%
Zip Codes with the Highest Percentage of Population Employed in Architecture & Engineering in Toms River, NJ
| Zip Code | % Employed | vs State | vs National | |
| 1. | 08753 | 2.0% | 1.9%(+0.135)#225 | 2.1%(-0.121)#9,432 |
| 2. | 08757 | 1.1% | 1.9%(-0.836)#416 | 2.1%(-1.09)#16,202 |
| 3. | 08755 | 0.82% | 1.9%(-1.07)#448 | 2.1%(-1.32)#17,951 |
1
Common Questions
What are the Top Zip Codes with the Highest Percentage of Population Employed in Architecture & Engineering in Toms River, NJ?
Top Zip Codes with the Highest Percentage of Population Employed in Architecture & Engineering in Toms River, NJ are:
What zip code has the Highest Percentage of Population Employed in Architecture & Engineering in Toms River, NJ?
08753 has the Highest Percentage of Population Employed in Architecture & Engineering in Toms River, NJ with 2.0%.
What is the Percentage of Population Employed in Architecture & Engineering in Toms River, NJ?
Percentage of Population Employed in Architecture & Engineering in Toms River is 1.7%.
What is the Percentage of Population Employed in Architecture & Engineering in New Jersey?
Percentage of Population Employed in Architecture & Engineering in New Jersey is 1.9%.
What is the Percentage of Population Employed in Architecture & Engineering in the United States?
Percentage of Population Employed in Architecture & Engineering in the United States is 2.1%.