Zip Codes with the Highest Percentage of Immigrants from Eastern Asia in Camden, NJ
RELATED REPORTS & OPTIONS
Eastern Asia
Camden
Compare Zip Codes
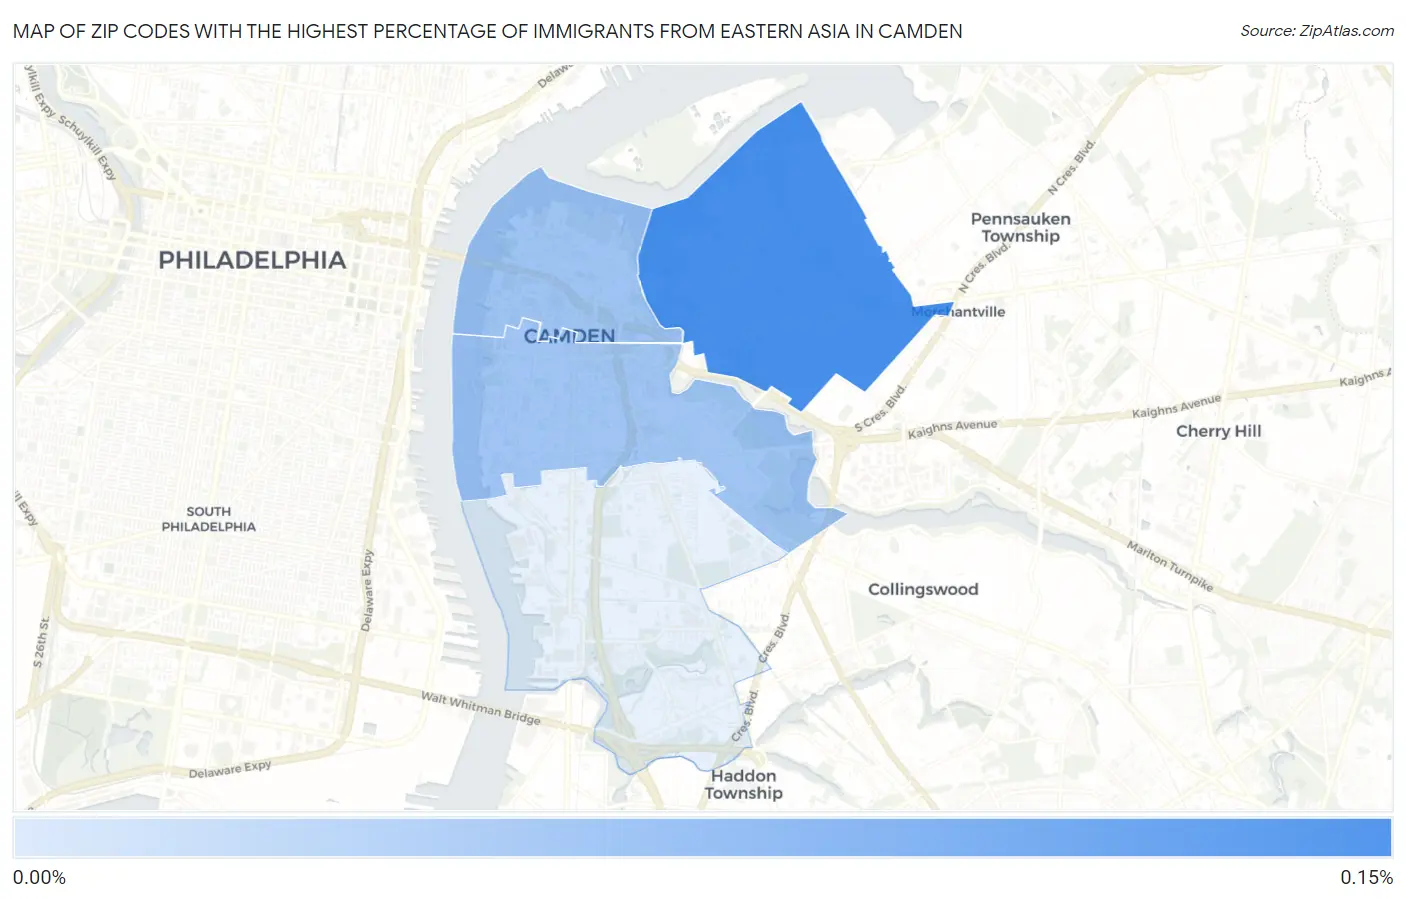
Map of Zip Codes with the Highest Percentage of Immigrants from Eastern Asia in Camden
0.047%
0.12%
Zip Codes with the Highest Percentage of Immigrants from Eastern Asia in Camden, NJ
| Zip Code | Eastern Asia | vs State | vs National | |
| 1. | 08105 | 0.12% | 2.01%(-1.90)#434 | 1.28%(-1.16)#11,824 |
| 2. | 08102 | 0.048% | 2.01%(-1.97)#466 | 1.28%(-1.23)#13,307 |
| 3. | 08103 | 0.047% | 2.01%(-1.97)#467 | 1.28%(-1.23)#13,310 |
1
Common Questions
What are the Top 3 Zip Codes with the Highest Percentage of Immigrants from Eastern Asia in Camden, NJ?
Top 3 Zip Codes with the Highest Percentage of Immigrants from Eastern Asia in Camden, NJ are:
What zip code has the Highest Percentage of Immigrants from Eastern Asia in Camden, NJ?
08105 has the Highest Percentage of Immigrants from Eastern Asia in Camden, NJ with 0.12%.
What is the Percentage of Immigrants from Eastern Asia in Camden, NJ?
Percentage of Immigrants from Eastern Asia in Camden is 0.057%.
What is the Percentage of Immigrants from Eastern Asia in New Jersey?
Percentage of Immigrants from Eastern Asia in New Jersey is 2.01%.
What is the Percentage of Immigrants from Eastern Asia in the United States?
Percentage of Immigrants from Eastern Asia in the United States is 1.28%.