Zip Codes with the Highest Percentage of Population Employed in Production in Camden, NJ
RELATED REPORTS & OPTIONS
Production
Camden
Compare Zip Codes
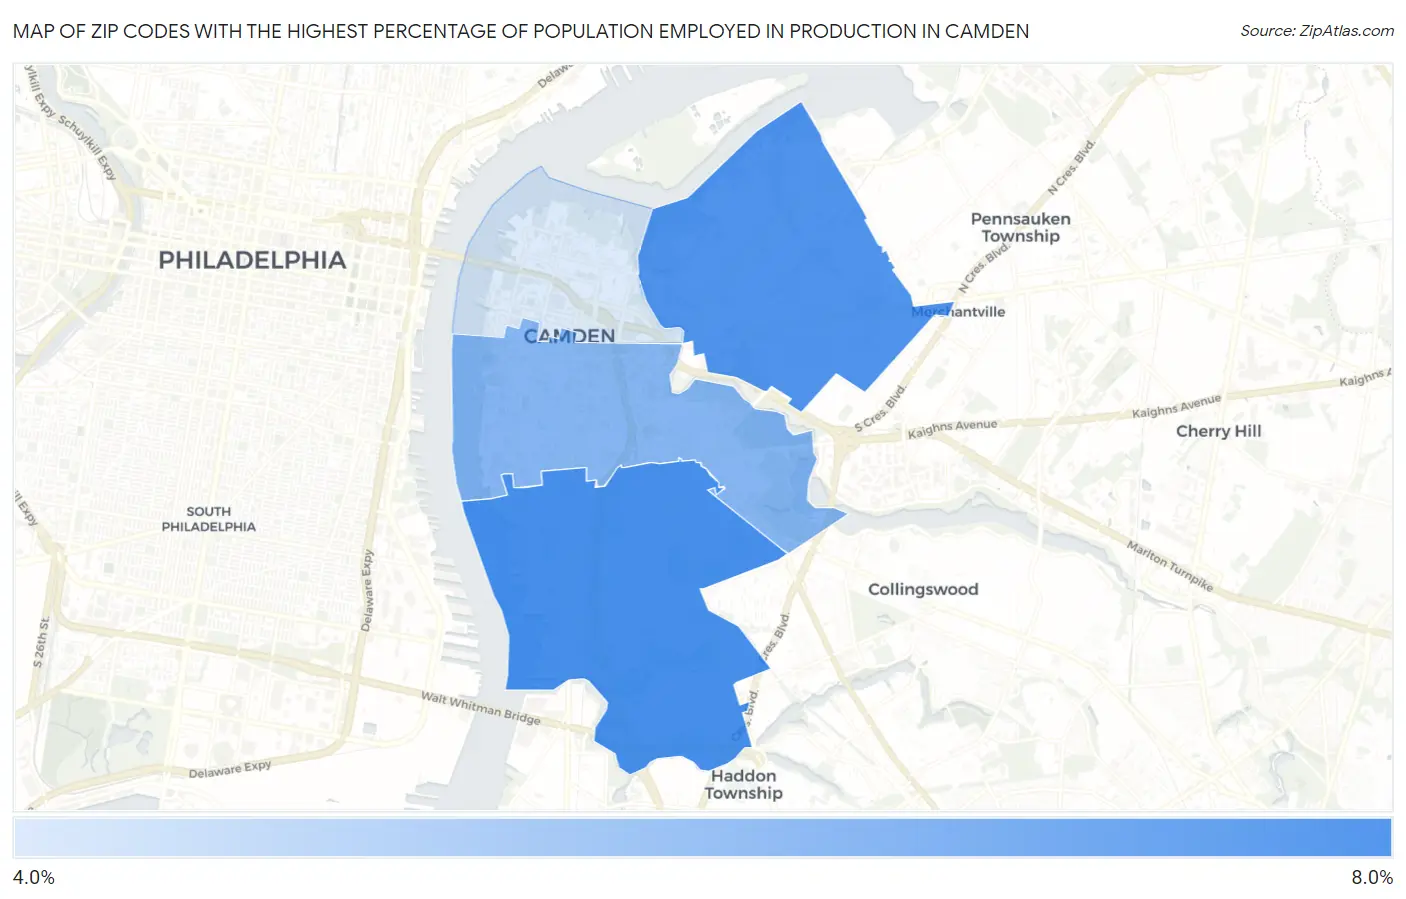
Map of Zip Codes with the Highest Percentage of Population Employed in Production in Camden
4.2%
7.0%
Zip Codes with the Highest Percentage of Population Employed in Production in Camden, NJ
| Zip Code | % Employed | vs State | vs National | |
| 1. | 08104 | 7.0% | 3.8%(+3.20)#58 | 5.5%(+1.55)#13,012 |
| 2. | 08105 | 6.9% | 3.8%(+3.08)#61 | 5.5%(+1.43)#13,238 |
| 3. | 08103 | 5.9% | 3.8%(+2.04)#94 | 5.5%(+0.390)#15,556 |
| 4. | 08102 | 4.2% | 3.8%(+0.394)#178 | 5.5%(-1.26)#19,788 |
1
Common Questions
What are the Top 3 Zip Codes with the Highest Percentage of Population Employed in Production in Camden, NJ?
Top 3 Zip Codes with the Highest Percentage of Population Employed in Production in Camden, NJ are:
What zip code has the Highest Percentage of Population Employed in Production in Camden, NJ?
08104 has the Highest Percentage of Population Employed in Production in Camden, NJ with 7.0%.
What is the Percentage of Population Employed in Production in Camden, NJ?
Percentage of Population Employed in Production in Camden is 7.2%.
What is the Percentage of Population Employed in Production in New Jersey?
Percentage of Population Employed in Production in New Jersey is 3.8%.
What is the Percentage of Population Employed in Production in the United States?
Percentage of Population Employed in Production in the United States is 5.5%.