Winfall, NC Map & Demographics
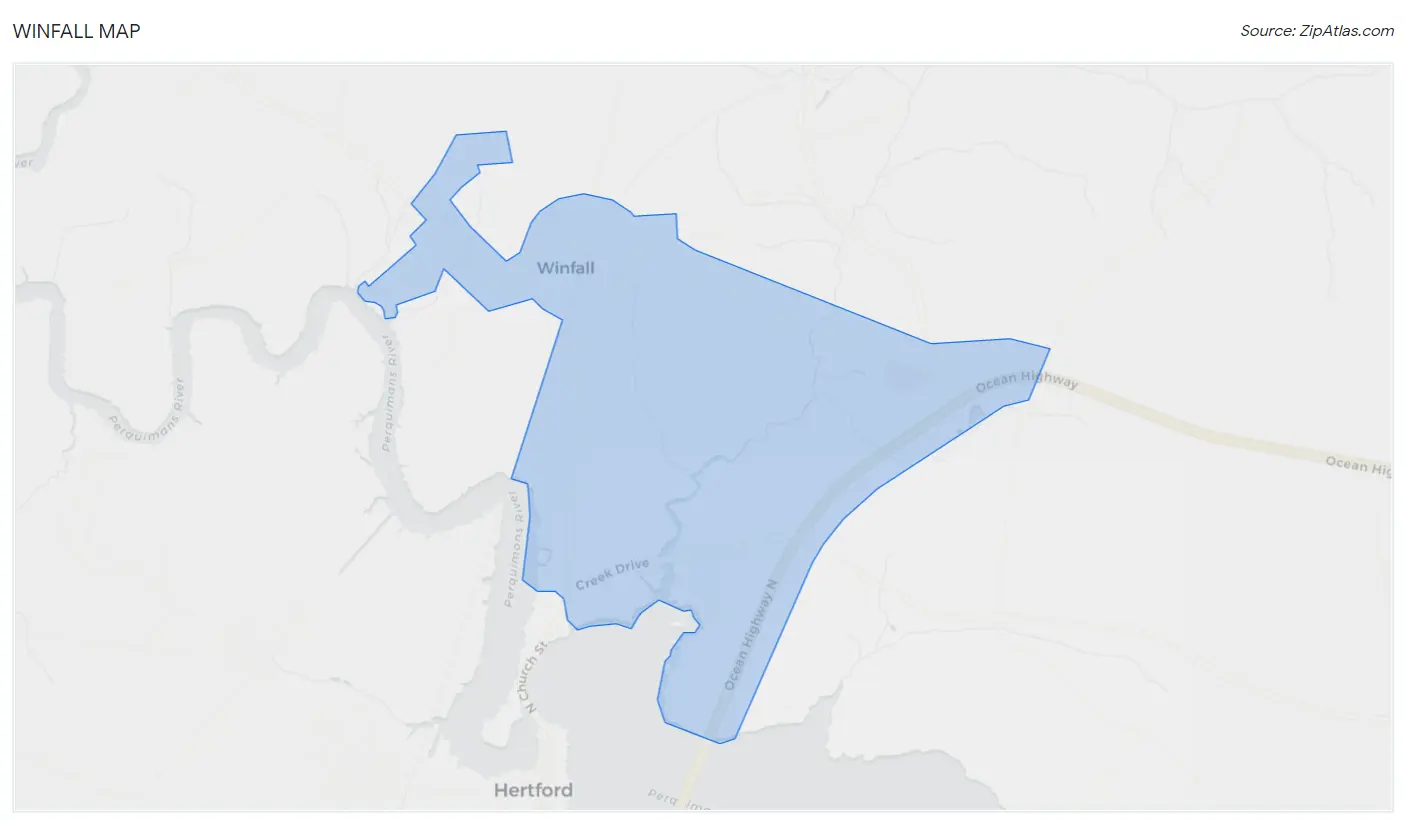
Winfall Map
Winfall Overview
$29,140
PER CAPITA INCOME
$84,375
AVG FAMILY INCOME
$59,732
AVG HOUSEHOLD INCOME
$8,119
FAMILY INCOME DEFICIT
0.43
INEQUALITY / GINI INDEX
900
TOTAL POPULATION
406
MALE POPULATION
494
FEMALE POPULATION
82.19
MALES / 100 FEMALES
121.67
FEMALES / 100 MALES
39.7
MEDIAN AGE
2.5
AVG FAMILY SIZE
2.4
AVG HOUSEHOLD SIZE
361
LABOR FORCE [ PEOPLE ]
53.2%
PERCENT IN LABOR FORCE
14.1%
UNEMPLOYMENT RATE
Winfall Zip Codes
Winfall Area Codes
Income in Winfall
Income Overview in Winfall
Per Capita Income in Winfall is $29,140, while median incomes of families and households are $84,375 and $59,732 respectively.
| Characteristic | Number | Measure |
| Per Capita Income | 900 | $29,140 |
| Median Family Income | 323 | $84,375 |
| Mean Family Income | 323 | $94,590 |
| Median Household Income | 374 | $59,732 |
| Mean Household Income | 374 | $85,092 |
| Income Deficit | 323 | $8,119 |
| Wage / Income Gap (%) | 900 | 0.00% |
| Wage / Income Gap ($) | 900 | 100.00¢ per $1 |
| Gini / Inequality Index | 900 | 0.43 |
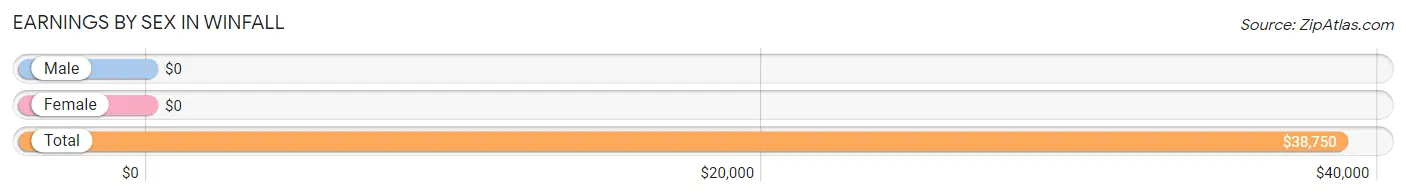
Earnings by Sex in Winfall
| Sex | Number | Average Earnings |
| Male | 181 (54.2%) | $0 |
| Female | 153 (45.8%) | $0 |
| Total | 334 (100.0%) | $38,750 |
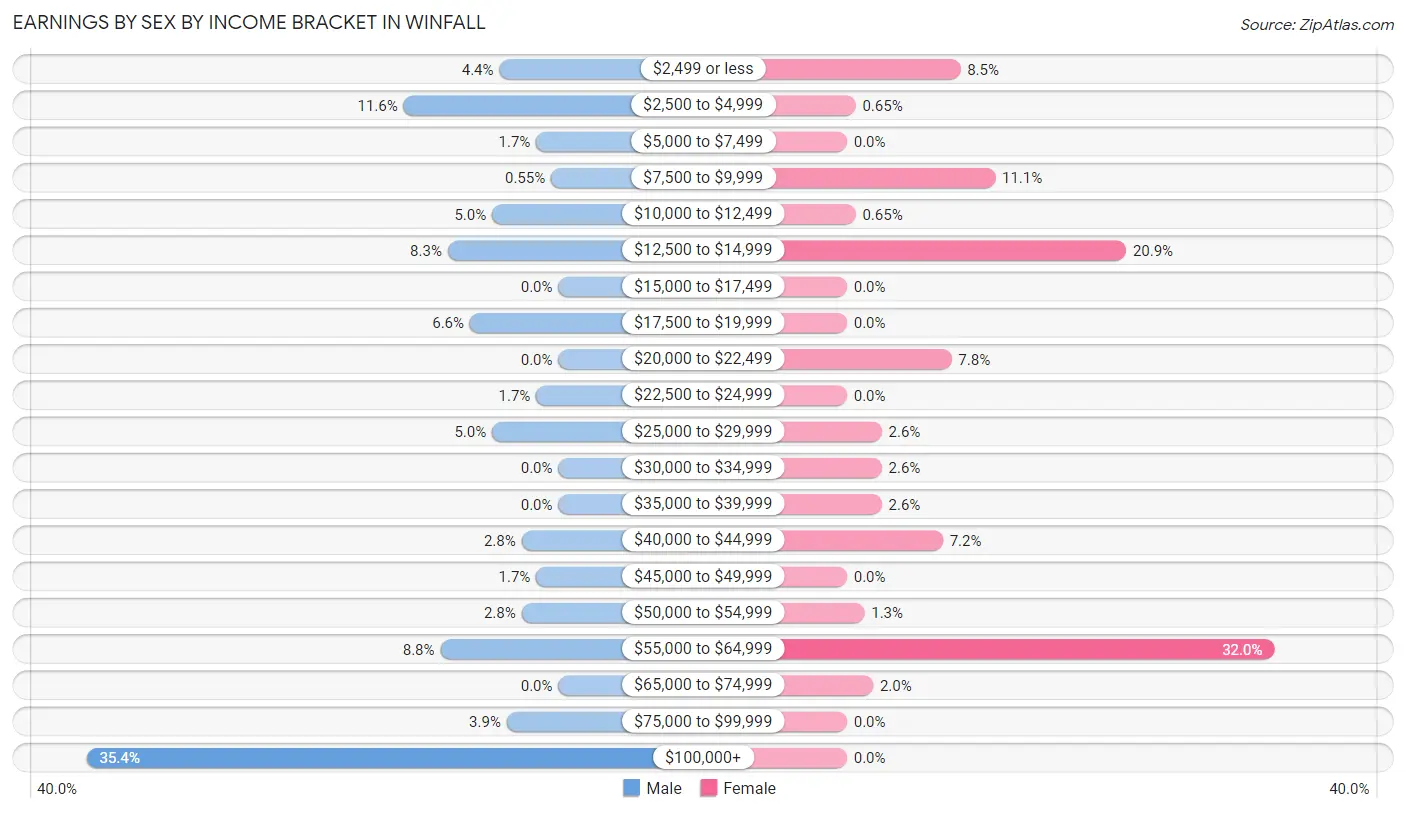
Earnings by Sex by Income Bracket in Winfall
The most common earnings brackets in Winfall are $100,000+ for men (64 | 35.4%) and $55,000 to $64,999 for women (49 | 32.0%).
| Income | Male | Female |
| $2,499 or less | 8 (4.4%) | 13 (8.5%) |
| $2,500 to $4,999 | 21 (11.6%) | 1 (0.6%) |
| $5,000 to $7,499 | 3 (1.7%) | 0 (0.0%) |
| $7,500 to $9,999 | 1 (0.5%) | 17 (11.1%) |
| $10,000 to $12,499 | 9 (5.0%) | 1 (0.6%) |
| $12,500 to $14,999 | 15 (8.3%) | 32 (20.9%) |
| $15,000 to $17,499 | 0 (0.0%) | 0 (0.0%) |
| $17,500 to $19,999 | 12 (6.6%) | 0 (0.0%) |
| $20,000 to $22,499 | 0 (0.0%) | 12 (7.8%) |
| $22,500 to $24,999 | 3 (1.7%) | 0 (0.0%) |
| $25,000 to $29,999 | 9 (5.0%) | 4 (2.6%) |
| $30,000 to $34,999 | 0 (0.0%) | 4 (2.6%) |
| $35,000 to $39,999 | 0 (0.0%) | 4 (2.6%) |
| $40,000 to $44,999 | 5 (2.8%) | 11 (7.2%) |
| $45,000 to $49,999 | 3 (1.7%) | 0 (0.0%) |
| $50,000 to $54,999 | 5 (2.8%) | 2 (1.3%) |
| $55,000 to $64,999 | 16 (8.8%) | 49 (32.0%) |
| $65,000 to $74,999 | 0 (0.0%) | 3 (2.0%) |
| $75,000 to $99,999 | 7 (3.9%) | 0 (0.0%) |
| $100,000+ | 64 (35.4%) | 0 (0.0%) |
| Total | 181 (100.0%) | 153 (100.0%) |
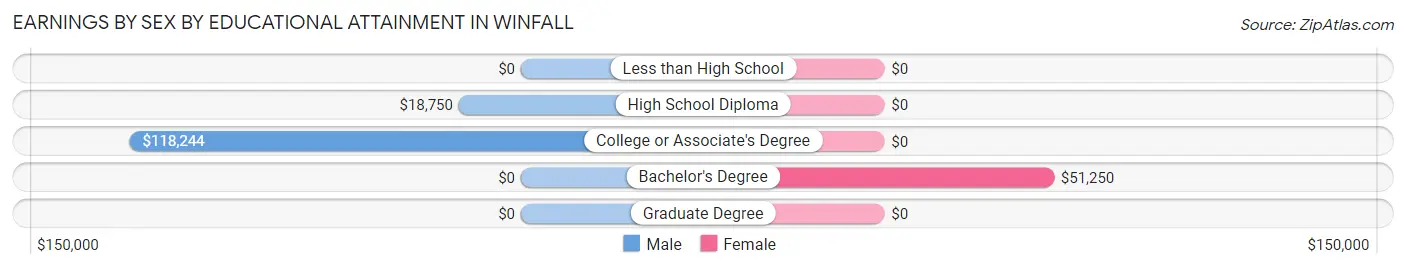
Earnings by Sex by Educational Attainment in Winfall
| Educational Attainment | Male Income | Female Income |
| Less than High School | - | - |
| High School Diploma | $18,750 | $0 |
| College or Associate's Degree | $118,244 | $0 |
| Bachelor's Degree | - | - |
| Graduate Degree | - | - |
| Total | - | - |
Family Income in Winfall
Family Income Brackets in Winfall
According to the Winfall family income data, there are 120 families falling into the $100,000 to $149,999 income range, which is the most common income bracket and makes up 37.1% of all families. Conversely, the $10,000 to $14,999 income bracket is the least frequent group with only 5 families (1.5%) belonging to this category.
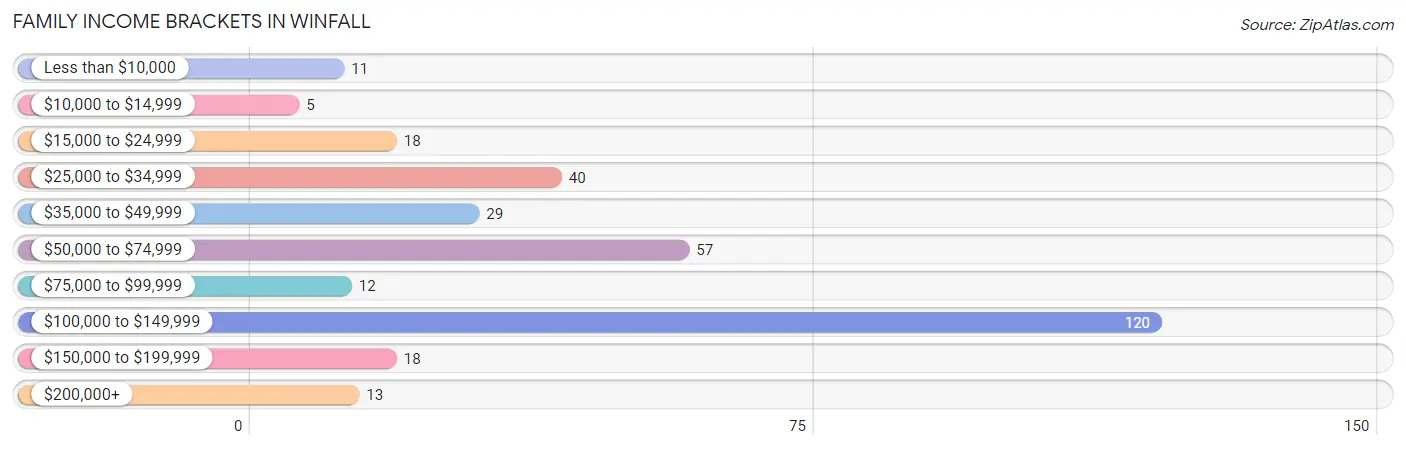
| Income Bracket | # Families | % Families |
| Less than $10,000 | 11 | 3.4% |
| $10,000 to $14,999 | 5 | 1.5% |
| $15,000 to $24,999 | 18 | 5.6% |
| $25,000 to $34,999 | 40 | 12.4% |
| $35,000 to $49,999 | 29 | 9.0% |
| $50,000 to $74,999 | 57 | 17.6% |
| $75,000 to $99,999 | 12 | 3.7% |
| $100,000 to $149,999 | 120 | 37.2% |
| $150,000 to $199,999 | 18 | 5.6% |
| $200,000+ | 13 | 4.0% |
Family Income by Famaliy Size in Winfall
2-person families (226 | 70.0%) account for the highest median family income in Winfall with $132,532 per family, while 2-person families (226 | 70.0%) have the highest median income of $66,266 per family member.
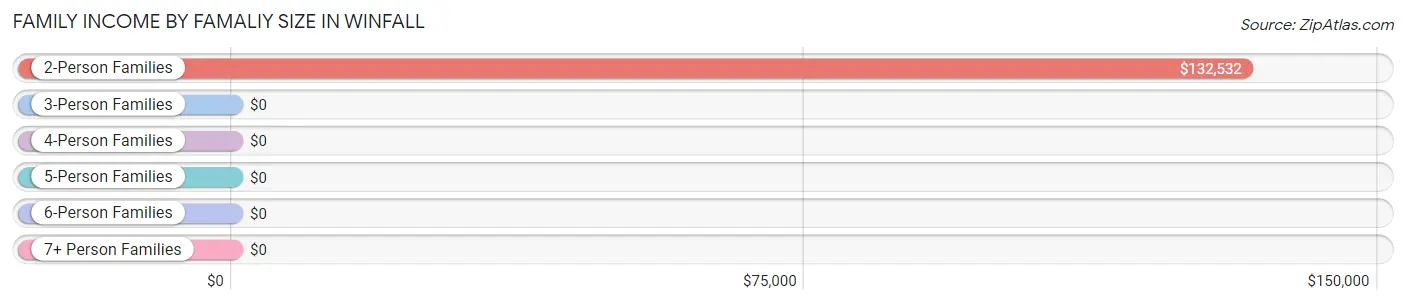
| Income Bracket | # Families | Median Income |
| 2-Person Families | 226 (70.0%) | $132,532 |
| 3-Person Families | 28 (8.7%) | $0 |
| 4-Person Families | 49 (15.2%) | $0 |
| 5-Person Families | 6 (1.9%) | $0 |
| 6-Person Families | 0 (0.0%) | $0 |
| 7+ Person Families | 14 (4.3%) | $0 |
| Total | 323 (100.0%) | $84,375 |
Family Income by Number of Earners in Winfall
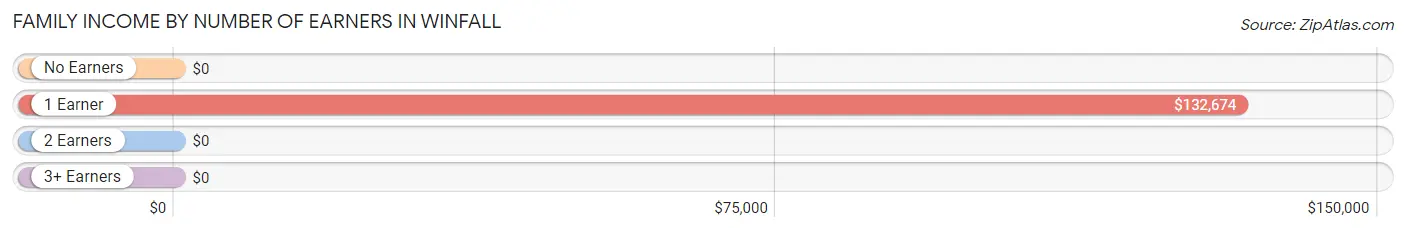
| Number of Earners | # Families | Median Income |
| No Earners | 55 (17.0%) | $0 |
| 1 Earner | 189 (58.5%) | $132,674 |
| 2 Earners | 79 (24.5%) | $0 |
| 3+ Earners | 0 (0.0%) | $0 |
| Total | 323 (100.0%) | $84,375 |
Household Income in Winfall
Household Income Brackets in Winfall
With 116 households falling in the category, the $100,000 to $149,999 income range is the most frequent in Winfall, accounting for 31.0% of all households. In contrast, only 12 households (3.2%) fall into the $75,000 to $99,999 income bracket, making it the least populous group.
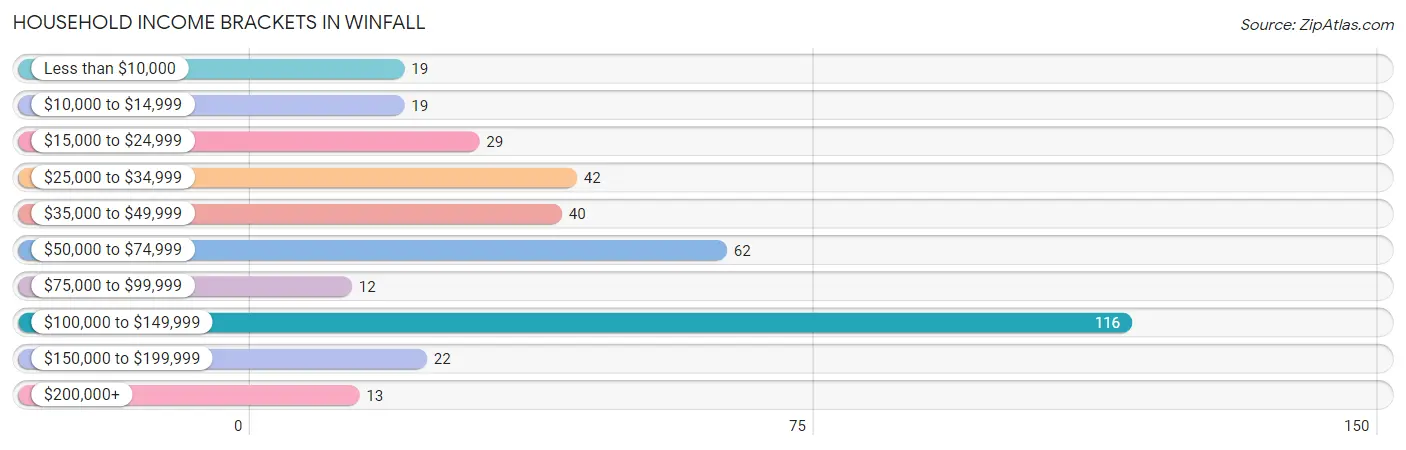
| Income Bracket | # Households | % Households |
| Less than $10,000 | 19 | 5.1% |
| $10,000 to $14,999 | 19 | 5.1% |
| $15,000 to $24,999 | 29 | 7.8% |
| $25,000 to $34,999 | 42 | 11.2% |
| $35,000 to $49,999 | 40 | 10.7% |
| $50,000 to $74,999 | 62 | 16.6% |
| $75,000 to $99,999 | 12 | 3.2% |
| $100,000 to $149,999 | 116 | 31.0% |
| $150,000 to $199,999 | 22 | 5.9% |
| $200,000+ | 13 | 3.5% |
Household Income by Householder Age in Winfall
The median household income in Winfall is $59,732, with the highest median household income of $133,085 found in the 65+ years age bracket for the primary householder. A total of 183 households (48.9%) fall into this category. Meanwhile, the 15 to 24 years age bracket for the primary householder has the lowest median household income of $0, with 2 households (0.5%) in this group.
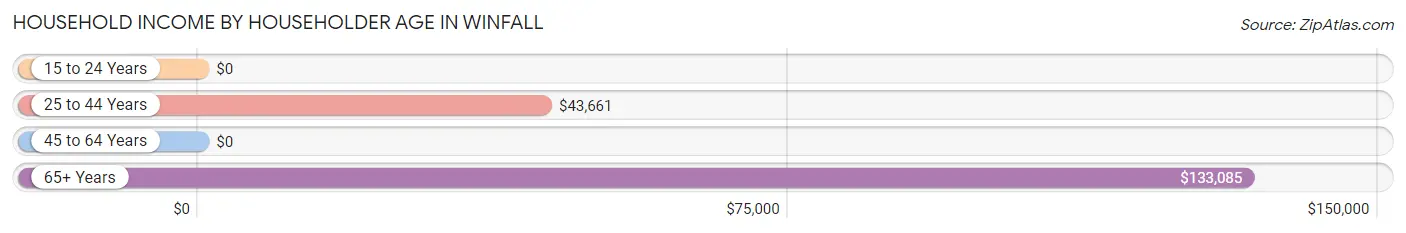
| Income Bracket | # Households | Median Income |
| 15 to 24 Years | 2 (0.5%) | $0 |
| 25 to 44 Years | 97 (25.9%) | $43,661 |
| 45 to 64 Years | 92 (24.6%) | $0 |
| 65+ Years | 183 (48.9%) | $133,085 |
| Total | 374 (100.0%) | $59,732 |
Poverty in Winfall
Income Below Poverty by Sex and Age in Winfall
With 26.5% poverty level for males and 23.6% for females among the residents of Winfall, 12 to 14 year old males and 15 year old females are the most vulnerable to poverty, with 37 males (64.9%) and 3 females (100.0%) in their respective age groups living below the poverty level.
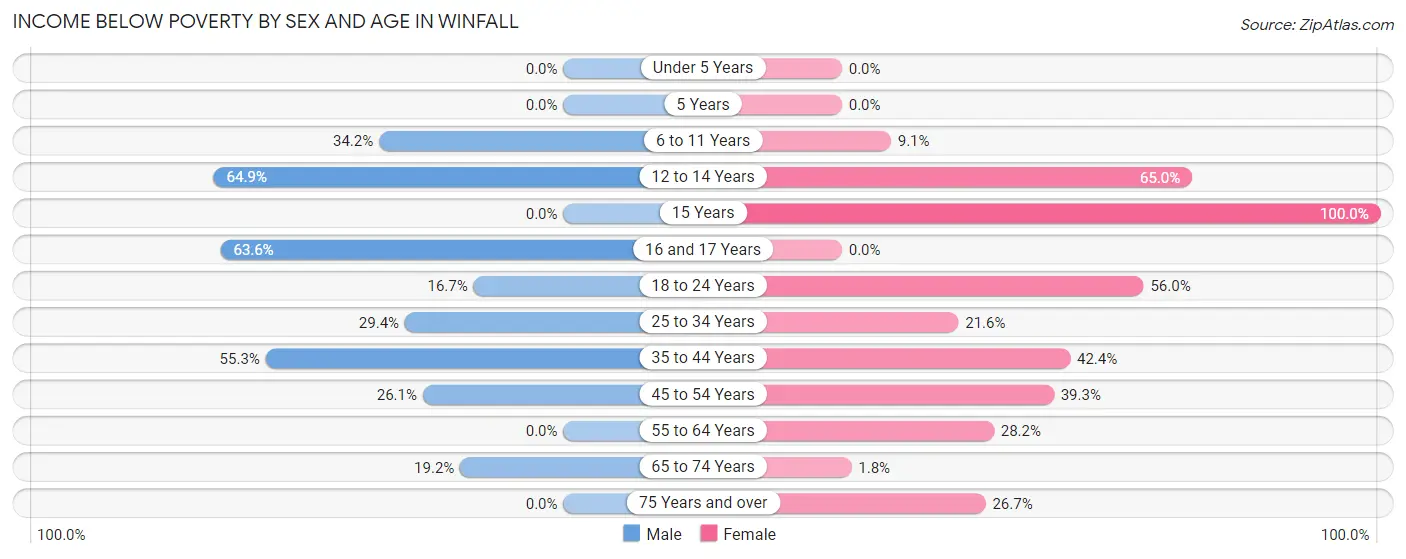
| Age Bracket | Male | Female |
| Under 5 Years | 0 (0.0%) | 0 (0.0%) |
| 5 Years | 0 (0.0%) | 0 (0.0%) |
| 6 to 11 Years | 13 (34.2%) | 2 (9.1%) |
| 12 to 14 Years | 37 (64.9%) | 13 (65.0%) |
| 15 Years | 0 (0.0%) | 3 (100.0%) |
| 16 and 17 Years | 7 (63.6%) | 0 (0.0%) |
| 18 to 24 Years | 7 (16.7%) | 14 (56.0%) |
| 25 to 34 Years | 5 (29.4%) | 8 (21.6%) |
| 35 to 44 Years | 21 (55.3%) | 25 (42.4%) |
| 45 to 54 Years | 6 (26.1%) | 24 (39.3%) |
| 55 to 64 Years | 0 (0.0%) | 11 (28.2%) |
| 65 to 74 Years | 9 (19.2%) | 2 (1.8%) |
| 75 Years and over | 0 (0.0%) | 12 (26.7%) |
| Total | 105 (26.5%) | 114 (23.6%) |
Income Above Poverty by Sex and Age in Winfall
According to the poverty statistics in Winfall, males aged under 5 years and females aged under 5 years are the age groups that are most secure financially, with 100.0% of males and 100.0% of females in these age groups living above the poverty line.
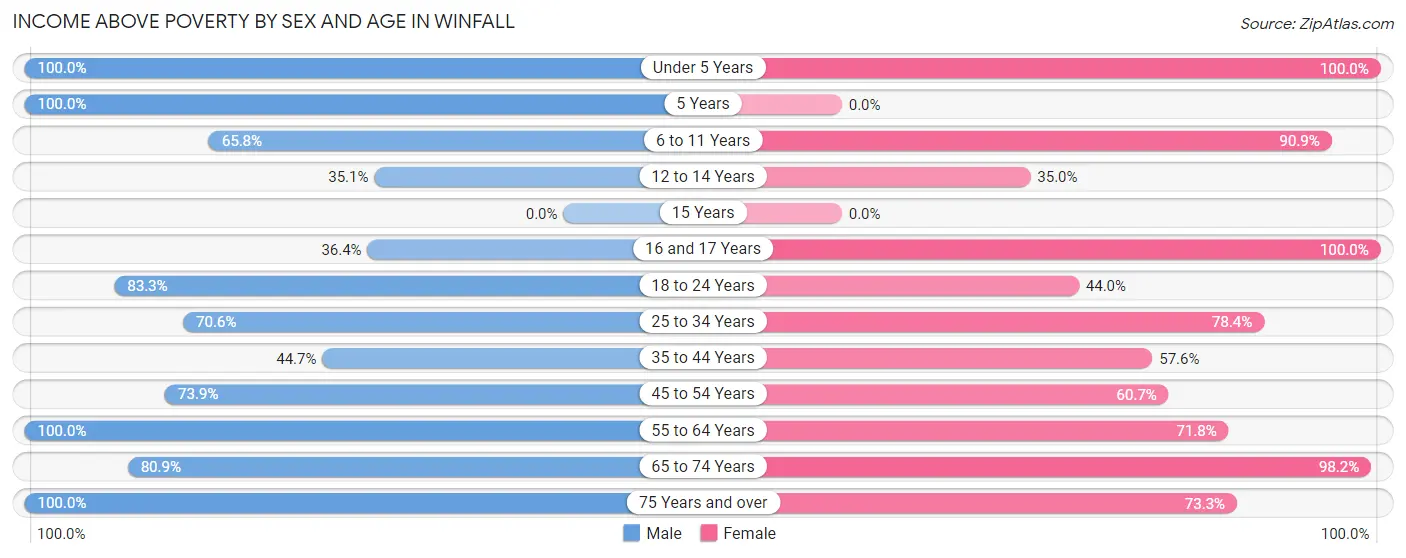
| Age Bracket | Male | Female |
| Under 5 Years | 19 (100.0%) | 39 (100.0%) |
| 5 Years | 6 (100.0%) | 0 (0.0%) |
| 6 to 11 Years | 25 (65.8%) | 20 (90.9%) |
| 12 to 14 Years | 20 (35.1%) | 7 (35.0%) |
| 15 Years | 0 (0.0%) | 0 (0.0%) |
| 16 and 17 Years | 4 (36.4%) | 19 (100.0%) |
| 18 to 24 Years | 35 (83.3%) | 11 (44.0%) |
| 25 to 34 Years | 12 (70.6%) | 29 (78.4%) |
| 35 to 44 Years | 17 (44.7%) | 34 (57.6%) |
| 45 to 54 Years | 17 (73.9%) | 37 (60.7%) |
| 55 to 64 Years | 59 (100.0%) | 28 (71.8%) |
| 65 to 74 Years | 38 (80.8%) | 111 (98.2%) |
| 75 Years and over | 39 (100.0%) | 33 (73.3%) |
| Total | 291 (73.5%) | 368 (76.3%) |
Income Below Poverty Among Married-Couple Families in Winfall
The poverty statistics for married-couple families in Winfall show that 10.7% or 24 of the total 224 families live below the poverty line. Families with 5 or more children have the highest poverty rate of 71.4%, comprising of 10 families. On the other hand, families with no children have the lowest poverty rate of 3.5%, which includes 7 families.
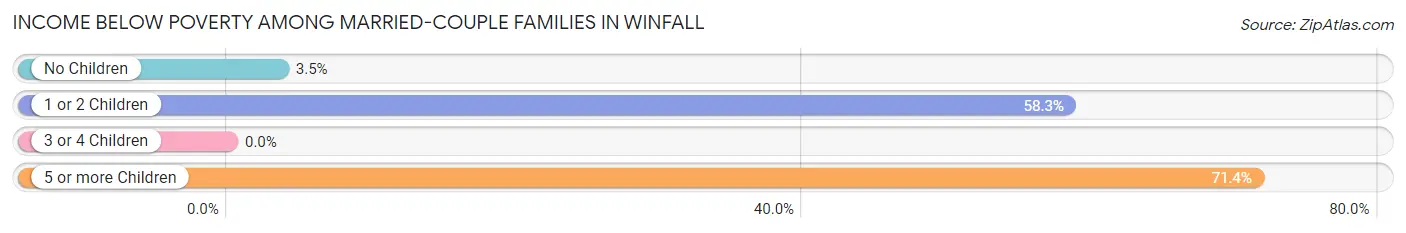
| Children | Above Poverty | Below Poverty |
| No Children | 191 (96.5%) | 7 (3.5%) |
| 1 or 2 Children | 5 (41.7%) | 7 (58.3%) |
| 3 or 4 Children | 0 (0.0%) | 0 (0.0%) |
| 5 or more Children | 4 (28.6%) | 10 (71.4%) |
| Total | 200 (89.3%) | 24 (10.7%) |
Income Below Poverty Among Single-Parent Households in Winfall
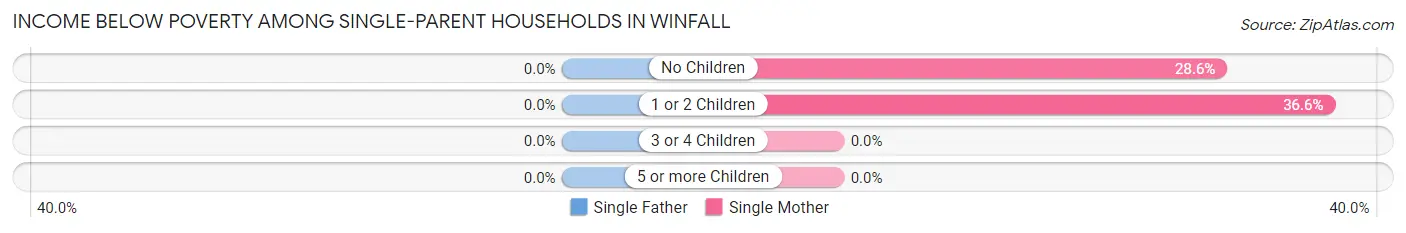
| Children | Single Father | Single Mother |
| No Children | 0 (0.0%) | 2 (28.6%) |
| 1 or 2 Children | 0 (0.0%) | 26 (36.6%) |
| 3 or 4 Children | 0 (0.0%) | 0 (0.0%) |
| 5 or more Children | 0 (0.0%) | 0 (0.0%) |
| Total | 0 (0.0%) | 28 (31.5%) |
Income Below Poverty Among Married-Couple vs Single-Parent Households in Winfall
The poverty data for Winfall shows that 24 of the married-couple family households (10.7%) and 28 of the single-parent households (28.3%) are living below the poverty level. Within the married-couple family households, those with 5 or more children have the highest poverty rate, with 10 households (71.4%) falling below the poverty line. Among the single-parent households, those with 1 or 2 children have the highest poverty rate, with 26 household (36.6%) living below poverty.
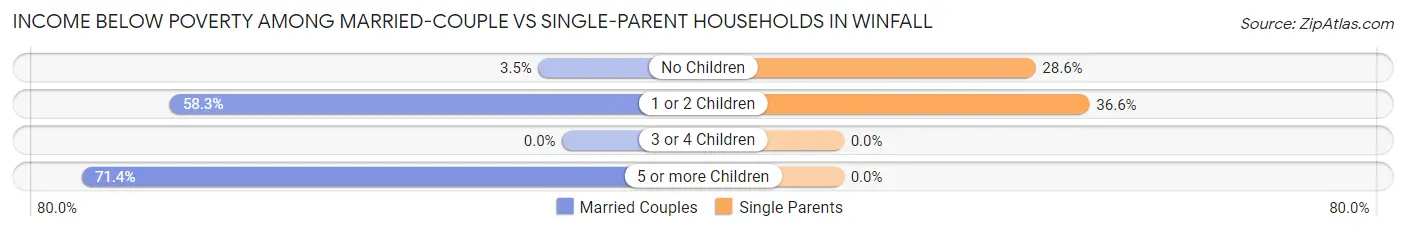
| Children | Married-Couple Families | Single-Parent Households |
| No Children | 7 (3.5%) | 2 (28.6%) |
| 1 or 2 Children | 7 (58.3%) | 26 (36.6%) |
| 3 or 4 Children | 0 (0.0%) | 0 (0.0%) |
| 5 or more Children | 10 (71.4%) | 0 (0.0%) |
| Total | 24 (10.7%) | 28 (28.3%) |
Race in Winfall
The most populous races in Winfall are White / Caucasian (483 | 53.7%), Black / African American (357 | 39.7%), and Two or more Races (60 | 6.7%).
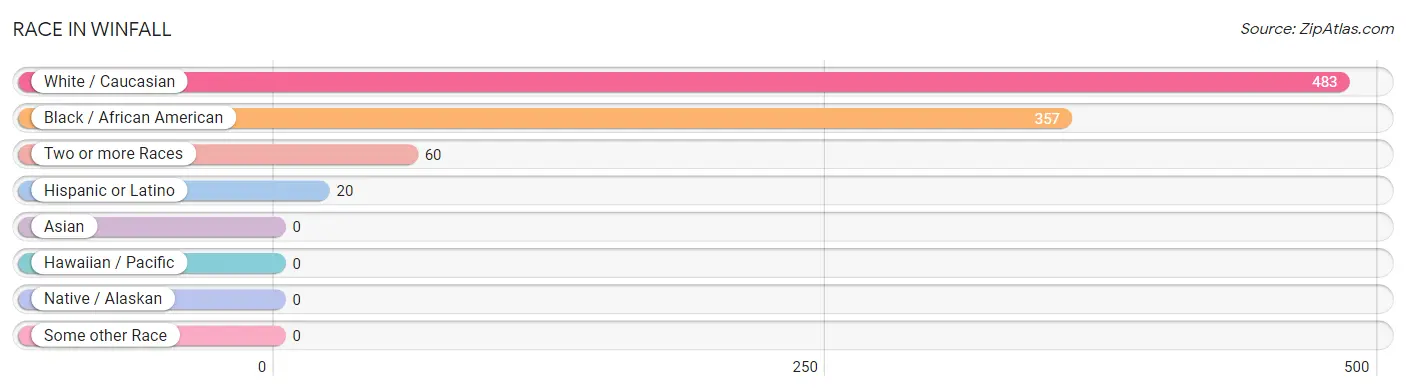
| Race | # Population | % Population |
| Asian | 0 | 0.0% |
| Black / African American | 357 | 39.7% |
| Hawaiian / Pacific | 0 | 0.0% |
| Hispanic or Latino | 20 | 2.2% |
| Native / Alaskan | 0 | 0.0% |
| White / Caucasian | 483 | 53.7% |
| Two or more Races | 60 | 6.7% |
| Some other Race | 0 | 0.0% |
| Total | 900 | 100.0% |
Ancestry in Winfall
The most populous ancestries reported in Winfall are Irish (130 | 14.4%), German (128 | 14.2%), English (73 | 8.1%), American (48 | 5.3%), and Welsh (23 | 2.6%), together accounting for 44.7% of all Winfall residents.
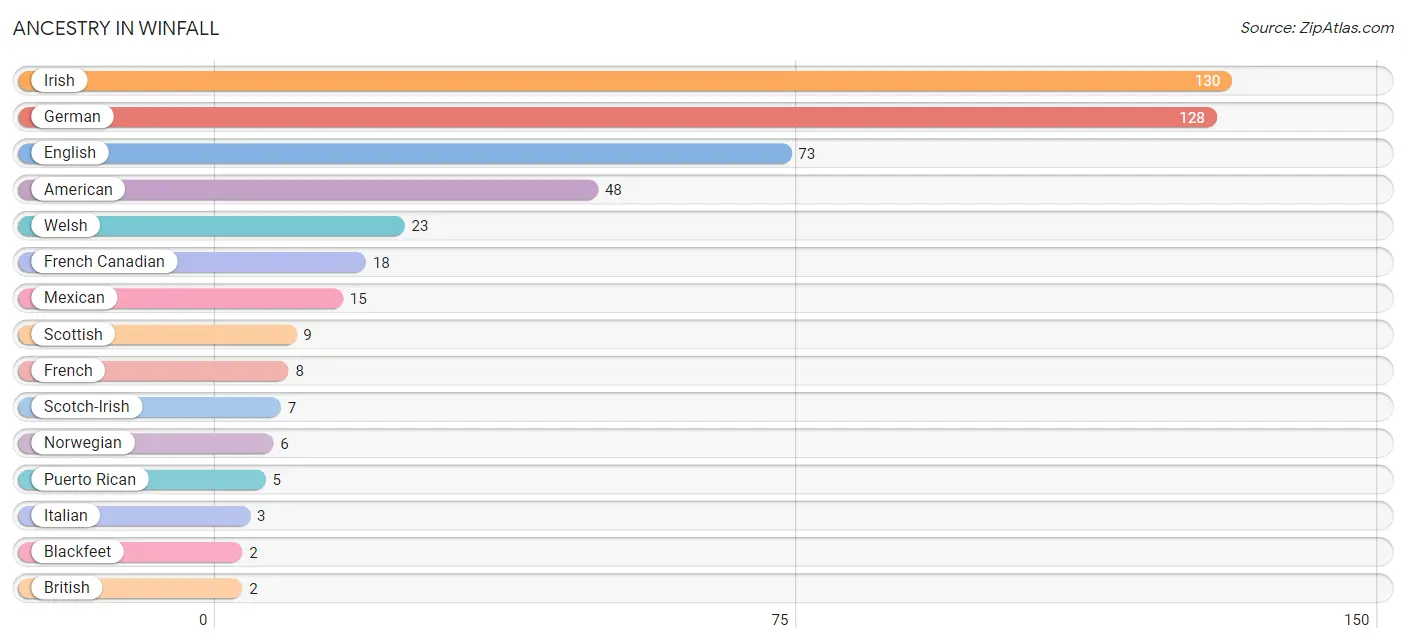
| Ancestry | # Population | % Population |
| American | 48 | 5.3% |
| Blackfeet | 2 | 0.2% |
| British | 2 | 0.2% |
| Cherokee | 2 | 0.2% |
| English | 73 | 8.1% |
| European | 2 | 0.2% |
| French | 8 | 0.9% |
| French Canadian | 18 | 2.0% |
| German | 128 | 14.2% |
| Irish | 130 | 14.4% |
| Italian | 3 | 0.3% |
| Mexican | 15 | 1.7% |
| Norwegian | 6 | 0.7% |
| Puerto Rican | 5 | 0.6% |
| Scotch-Irish | 7 | 0.8% |
| Scottish | 9 | 1.0% |
| Welsh | 23 | 2.6% | View All 17 Rows |
Immigrants in Winfall

| Immigration Origin | # Population | % Population | View All 0 Rows |
Sex and Age in Winfall
Sex and Age in Winfall
The most populous age groups in Winfall are 10 to 14 Years (72 | 17.7%) for men and 65 to 69 Years (87 | 17.6%) for women.
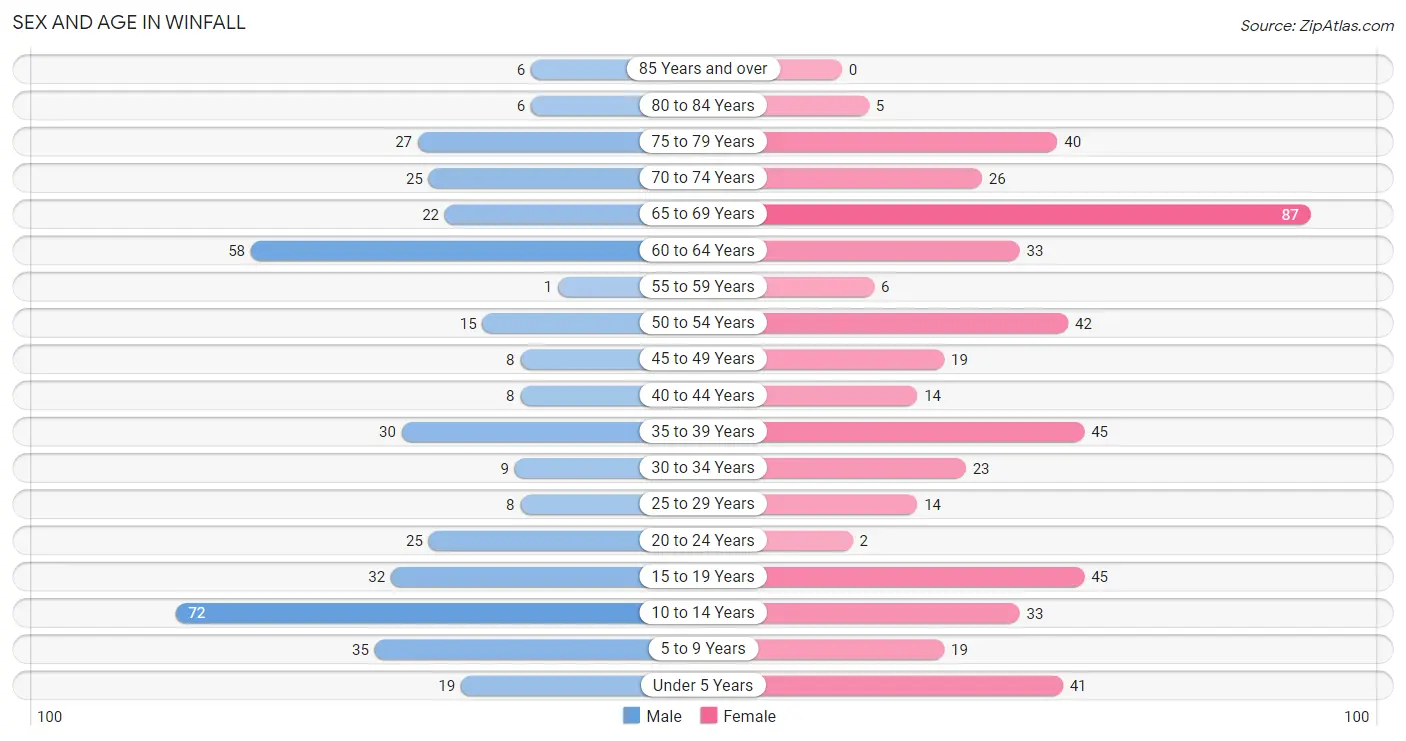
| Age Bracket | Male | Female |
| Under 5 Years | 19 (4.7%) | 41 (8.3%) |
| 5 to 9 Years | 35 (8.6%) | 19 (3.8%) |
| 10 to 14 Years | 72 (17.7%) | 33 (6.7%) |
| 15 to 19 Years | 32 (7.9%) | 45 (9.1%) |
| 20 to 24 Years | 25 (6.2%) | 2 (0.4%) |
| 25 to 29 Years | 8 (2.0%) | 14 (2.8%) |
| 30 to 34 Years | 9 (2.2%) | 23 (4.7%) |
| 35 to 39 Years | 30 (7.4%) | 45 (9.1%) |
| 40 to 44 Years | 8 (2.0%) | 14 (2.8%) |
| 45 to 49 Years | 8 (2.0%) | 19 (3.8%) |
| 50 to 54 Years | 15 (3.7%) | 42 (8.5%) |
| 55 to 59 Years | 1 (0.3%) | 6 (1.2%) |
| 60 to 64 Years | 58 (14.3%) | 33 (6.7%) |
| 65 to 69 Years | 22 (5.4%) | 87 (17.6%) |
| 70 to 74 Years | 25 (6.2%) | 26 (5.3%) |
| 75 to 79 Years | 27 (6.7%) | 40 (8.1%) |
| 80 to 84 Years | 6 (1.5%) | 5 (1.0%) |
| 85 Years and over | 6 (1.5%) | 0 (0.0%) |
| Total | 406 (100.0%) | 494 (100.0%) |
Families and Households in Winfall
Median Family Size in Winfall
The median family size in Winfall is 2.51 persons per family, with single male/father families (10 | 3.1%) accounting for the largest median family size of 5.6 persons per family. On the other hand, married-couple families (224 | 69.4%) represent the smallest median family size with 2.38 persons per family.
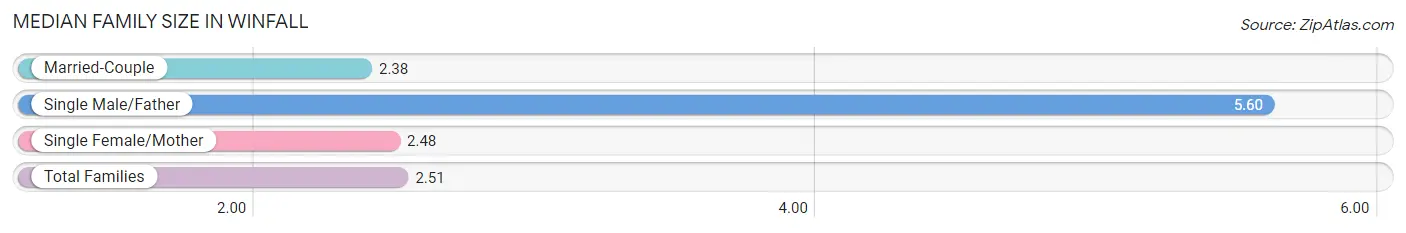
| Family Type | # Families | Family Size |
| Married-Couple | 224 (69.4%) | 2.38 |
| Single Male/Father | 10 (3.1%) | 5.60 |
| Single Female/Mother | 89 (27.6%) | 2.48 |
| Total Families | 323 (100.0%) | 2.51 |
Median Household Size in Winfall
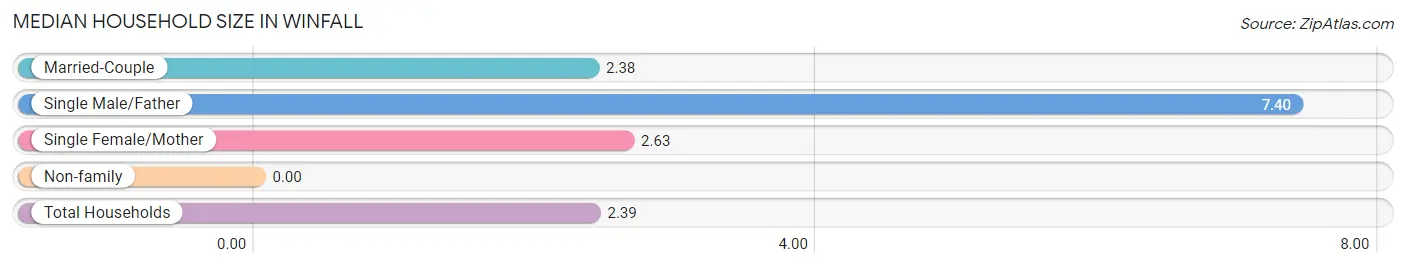
| Household Type | # Households | Household Size |
| Married-Couple | 224 (59.9%) | 2.38 |
| Single Male/Father | 10 (2.7%) | 7.40 |
| Single Female/Mother | 89 (23.8%) | 2.63 |
| Non-family | 51 (13.6%) | - |
| Total Households | 374 (100.0%) | 2.39 |
Household Size by Marriage Status in Winfall
Out of a total of 374 households in Winfall, 323 (86.4%) are family households, while 51 (13.6%) are nonfamily households. The most numerous type of family households are 2-person households, comprising 226, and the most common type of nonfamily households are 1-person households, comprising 51.
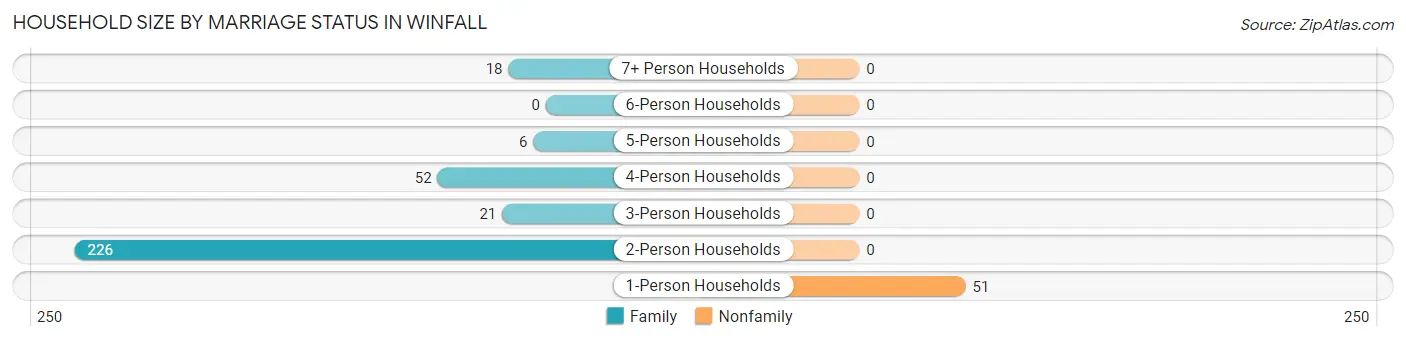
| Household Size | Family Households | Nonfamily Households |
| 1-Person Households | - | 51 (13.6%) |
| 2-Person Households | 226 (60.4%) | 0 (0.0%) |
| 3-Person Households | 21 (5.6%) | 0 (0.0%) |
| 4-Person Households | 52 (13.9%) | 0 (0.0%) |
| 5-Person Households | 6 (1.6%) | 0 (0.0%) |
| 6-Person Households | 0 (0.0%) | 0 (0.0%) |
| 7+ Person Households | 18 (4.8%) | 0 (0.0%) |
| Total | 323 (86.4%) | 51 (13.6%) |
Female Fertility in Winfall
Fertility by Age in Winfall
| Age Bracket | Women with Births | Births / 1,000 Women |
| 15 to 19 years | 0 (0.0%) | 0.0 |
| 20 to 34 years | 0 (0.0%) | 0.0 |
| 35 to 50 years | 0 (0.0%) | 0.0 |
| Total | 0 (0.0%) | 0.0 |
Fertility by Age by Marriage Status in Winfall
| Age Bracket | Married | Unmarried |
| 15 to 19 years | 0 (0.0%) | 0 (0.0%) |
| 20 to 34 years | 0 (0.0%) | 0 (0.0%) |
| 35 to 50 years | 0 (0.0%) | 0 (0.0%) |
| Total | 0 (0.0%) | 0 (0.0%) |
Fertility by Education in Winfall
| Educational Attainment | Women with Births | Births / 1,000 Women |
| Less than High School | 0 (0.0%) | 0.0 |
| High School Diploma | 0 (0.0%) | 0.0 |
| College or Associate's Degree | 0 (0.0%) | 0.0 |
| Bachelor's Degree | 0 (0.0%) | 0.0 |
| Graduate Degree | 0 (0.0%) | 0.0 |
| Total | 0 (0.0%) | 0.0 |
Fertility by Education by Marriage Status in Winfall
| Educational Attainment | Married | Unmarried |
| Less than High School | 0 (0.0%) | 0 (0.0%) |
| High School Diploma | 0 (0.0%) | 0 (0.0%) |
| College or Associate's Degree | 0 (0.0%) | 0 (0.0%) |
| Bachelor's Degree | 0 (0.0%) | 0 (0.0%) |
| Graduate Degree | 0 (0.0%) | 0 (0.0%) |
| Total | 0 (0.0%) | 0 (0.0%) |
Employment Characteristics in Winfall
Employment by Class of Employer in Winfall
Among the 305 employed individuals in Winfall, private company employees (164 | 53.8%), state government employees (68 | 22.3%), and local government employees (33 | 10.8%) make up the most common classes of employment.
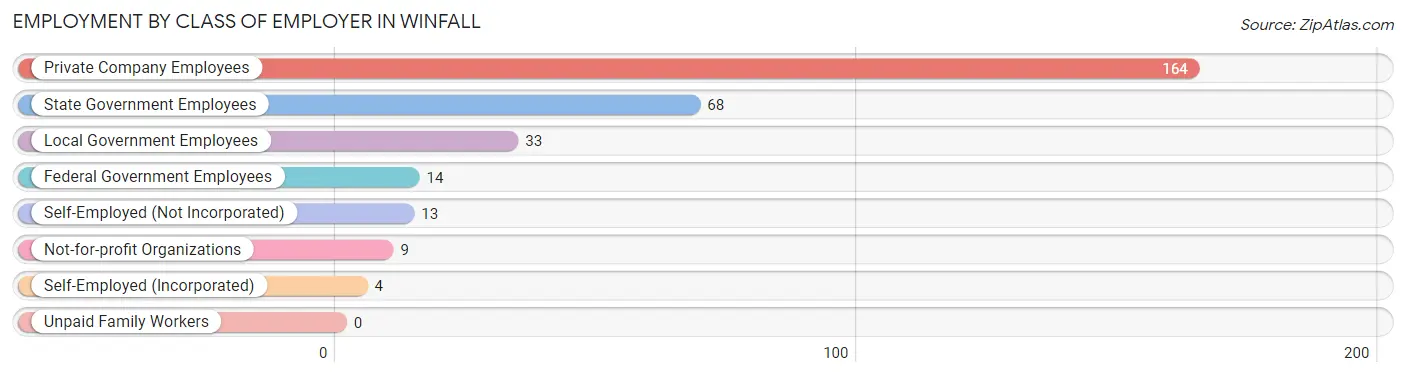
| Employer Class | # Employees | % Employees |
| Private Company Employees | 164 | 53.8% |
| Self-Employed (Incorporated) | 4 | 1.3% |
| Self-Employed (Not Incorporated) | 13 | 4.3% |
| Not-for-profit Organizations | 9 | 2.9% |
| Local Government Employees | 33 | 10.8% |
| State Government Employees | 68 | 22.3% |
| Federal Government Employees | 14 | 4.6% |
| Unpaid Family Workers | 0 | 0.0% |
| Total | 305 | 100.0% |
Employment Status by Age in Winfall
According to the labor force statistics for Winfall, out of the total population over 16 years of age (678), 53.2% or 361 individuals are in the labor force, with 14.1% or 51 of them unemployed. The age group with the highest labor force participation rate is 20 to 24 years, with 100.0% or 27 individuals in the labor force. Within the labor force, the 16 to 19 years age range has the highest percentage of unemployed individuals, with 58.3% or 28 of them being unemployed.
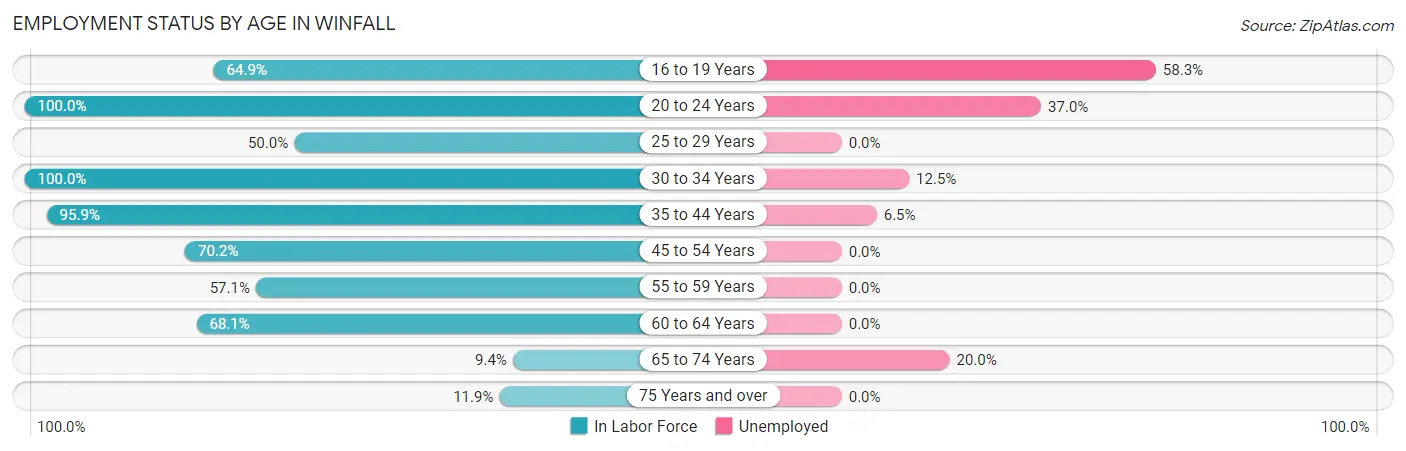
| Age Bracket | In Labor Force | Unemployed |
| 16 to 19 Years | 48 (64.9%) | 28 (58.3%) |
| 20 to 24 Years | 27 (100.0%) | 10 (37.0%) |
| 25 to 29 Years | 11 (50.0%) | 0 (0.0%) |
| 30 to 34 Years | 32 (100.0%) | 4 (12.5%) |
| 35 to 44 Years | 93 (95.9%) | 6 (6.5%) |
| 45 to 54 Years | 59 (70.2%) | 0 (0.0%) |
| 55 to 59 Years | 4 (57.1%) | 0 (0.0%) |
| 60 to 64 Years | 62 (68.1%) | 0 (0.0%) |
| 65 to 74 Years | 15 (9.4%) | 3 (20.0%) |
| 75 Years and over | 10 (11.9%) | 0 (0.0%) |
| Total | 361 (53.2%) | 51 (14.1%) |
Employment Status by Educational Attainment in Winfall
According to labor force statistics for Winfall, 78.4% of individuals (261) out of the total population between 25 and 64 years of age (333) are in the labor force, with 3.8% or 10 of them being unemployed. The group with the highest labor force participation rate are those with the educational attainment of bachelor's degree or higher, with 92.6% or 63 individuals in the labor force. Within the labor force, individuals with high school diploma education have the highest percentage of unemployment, with 10.9% or 6 of them being unemployed.
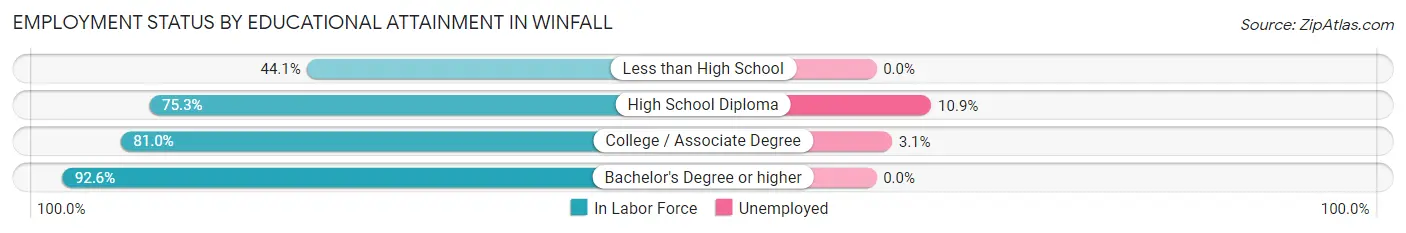
| Educational Attainment | In Labor Force | Unemployed |
| Less than High School | 15 (44.1%) | 0 (0.0%) |
| High School Diploma | 55 (75.3%) | 8 (10.9%) |
| College / Associate Degree | 128 (81.0%) | 5 (3.1%) |
| Bachelor's Degree or higher | 63 (92.6%) | 0 (0.0%) |
| Total | 261 (78.4%) | 13 (3.8%) |
Employment Occupations by Sex in Winfall
Management, Business, Science and Arts Occupations
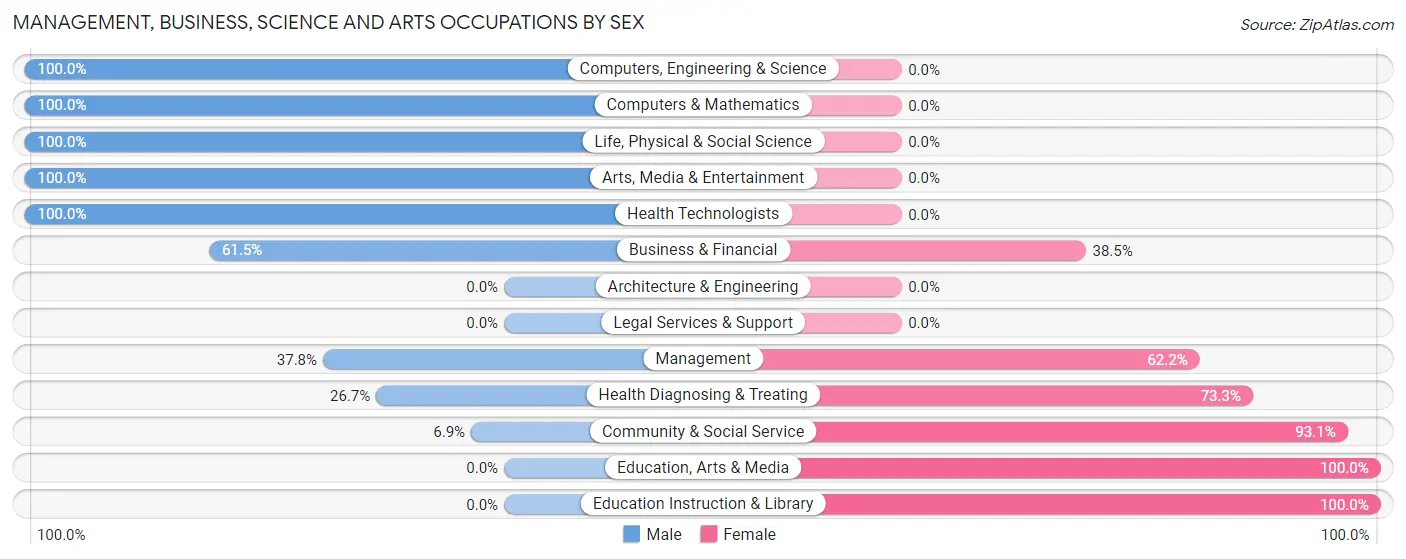
The most common Management, Business, Science and Arts occupations in Winfall are Management (45 | 14.5%), Community & Social Service (29 | 9.3%), Education, Arts & Media (23 | 7.4%), Health Diagnosing & Treating (15 | 4.8%), and Business & Financial (13 | 4.2%).
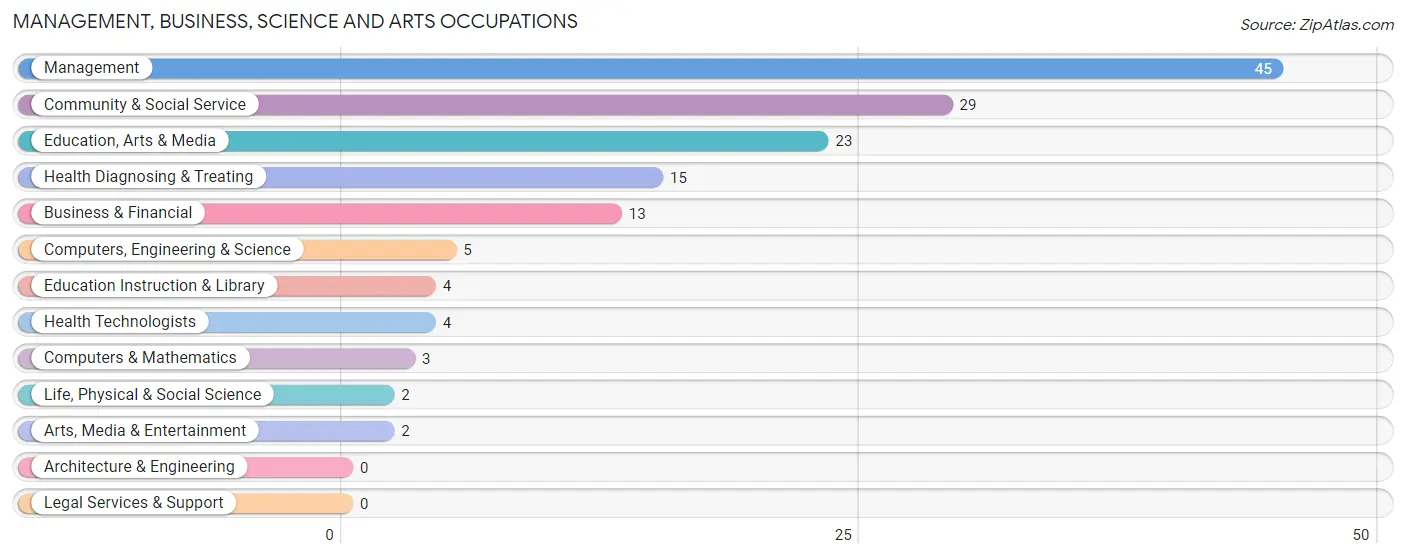
Management, Business, Science and Arts Occupations by Sex
Within the Management, Business, Science and Arts occupations in Winfall, the most male-oriented occupations are Computers, Engineering & Science (100.0%), Computers & Mathematics (100.0%), and Life, Physical & Social Science (100.0%), while the most female-oriented occupations are Education, Arts & Media (100.0%), Education Instruction & Library (100.0%), and Community & Social Service (93.1%).
| Occupation | Male | Female |
| Management | 17 (37.8%) | 28 (62.2%) |
| Business & Financial | 8 (61.5%) | 5 (38.5%) |
| Computers, Engineering & Science | 5 (100.0%) | 0 (0.0%) |
| Computers & Mathematics | 3 (100.0%) | 0 (0.0%) |
| Architecture & Engineering | 0 (0.0%) | 0 (0.0%) |
| Life, Physical & Social Science | 2 (100.0%) | 0 (0.0%) |
| Community & Social Service | 2 (6.9%) | 27 (93.1%) |
| Education, Arts & Media | 0 (0.0%) | 23 (100.0%) |
| Legal Services & Support | 0 (0.0%) | 0 (0.0%) |
| Education Instruction & Library | 0 (0.0%) | 4 (100.0%) |
| Arts, Media & Entertainment | 2 (100.0%) | 0 (0.0%) |
| Health Diagnosing & Treating | 4 (26.7%) | 11 (73.3%) |
| Health Technologists | 4 (100.0%) | 0 (0.0%) |
| Total (Category) | 36 (33.6%) | 71 (66.4%) |
| Total (Overall) | 167 (53.9%) | 143 (46.1%) |
Services Occupations
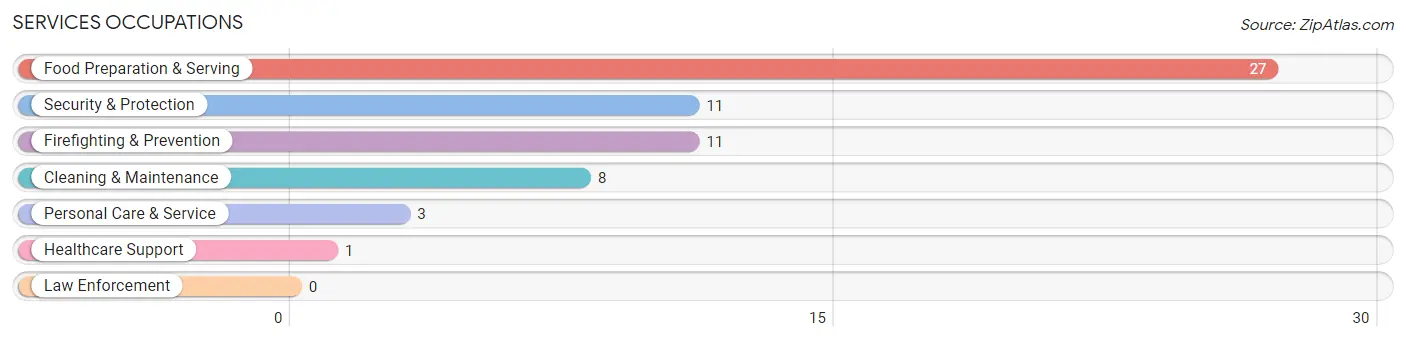
The most common Services occupations in Winfall are Food Preparation & Serving (27 | 8.7%), Security & Protection (11 | 3.5%), Firefighting & Prevention (11 | 3.5%), Cleaning & Maintenance (8 | 2.6%), and Personal Care & Service (3 | 1.0%).
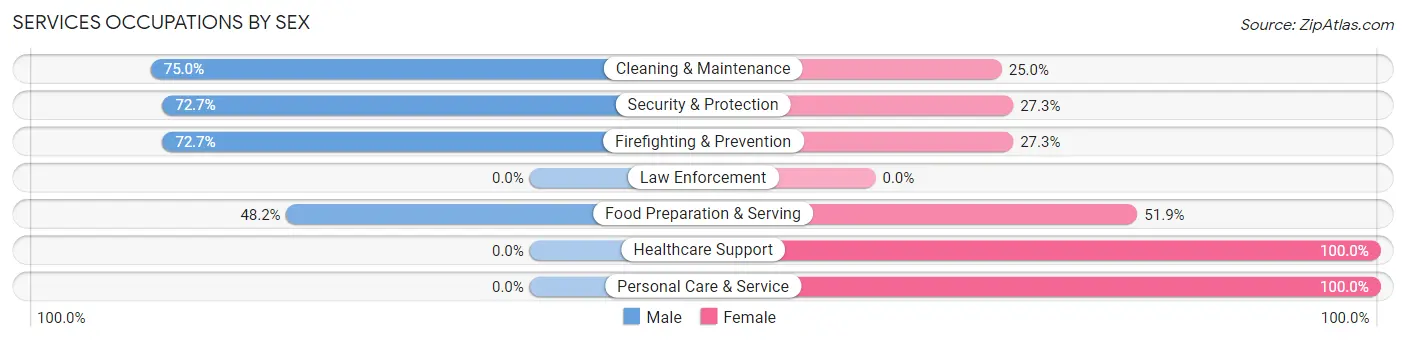
Services Occupations by Sex
Within the Services occupations in Winfall, the most male-oriented occupations are Cleaning & Maintenance (75.0%), Security & Protection (72.7%), and Firefighting & Prevention (72.7%), while the most female-oriented occupations are Healthcare Support (100.0%), Personal Care & Service (100.0%), and Food Preparation & Serving (51.8%).
| Occupation | Male | Female |
| Healthcare Support | 0 (0.0%) | 1 (100.0%) |
| Security & Protection | 8 (72.7%) | 3 (27.3%) |
| Firefighting & Prevention | 8 (72.7%) | 3 (27.3%) |
| Law Enforcement | 0 (0.0%) | 0 (0.0%) |
| Food Preparation & Serving | 13 (48.1%) | 14 (51.8%) |
| Cleaning & Maintenance | 6 (75.0%) | 2 (25.0%) |
| Personal Care & Service | 0 (0.0%) | 3 (100.0%) |
| Total (Category) | 27 (54.0%) | 23 (46.0%) |
| Total (Overall) | 167 (53.9%) | 143 (46.1%) |
Sales and Office Occupations
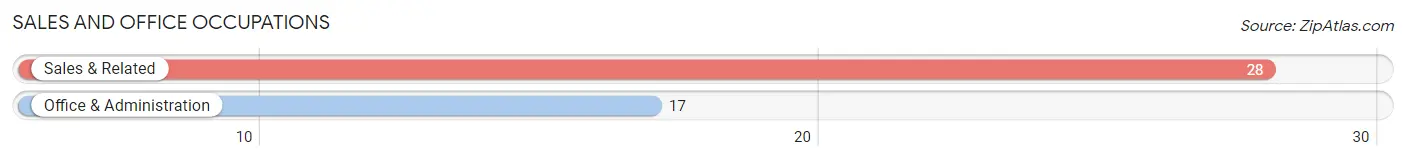
The most common Sales and Office occupations in Winfall are Sales & Related (28 | 9.0%), and Office & Administration (17 | 5.5%).
Sales and Office Occupations by Sex

| Occupation | Male | Female |
| Sales & Related | 21 (75.0%) | 7 (25.0%) |
| Office & Administration | 0 (0.0%) | 17 (100.0%) |
| Total (Category) | 21 (46.7%) | 24 (53.3%) |
| Total (Overall) | 167 (53.9%) | 143 (46.1%) |
Natural Resources, Construction and Maintenance Occupations
The most common Natural Resources, Construction and Maintenance occupations in Winfall are Construction & Extraction (14 | 4.5%), and Installation, Maintenance & Repair (3 | 1.0%).
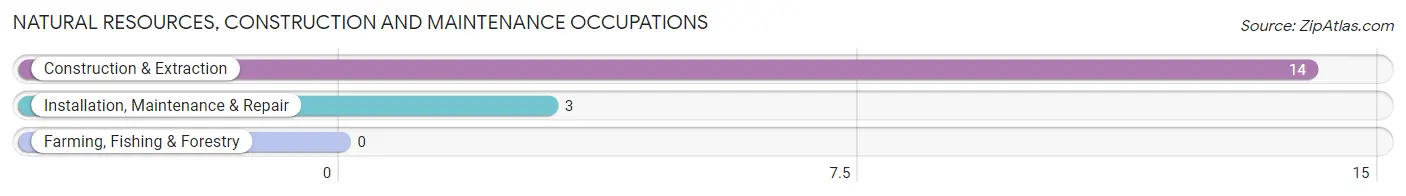
Natural Resources, Construction and Maintenance Occupations by Sex

| Occupation | Male | Female |
| Farming, Fishing & Forestry | 0 (0.0%) | 0 (0.0%) |
| Construction & Extraction | 14 (100.0%) | 0 (0.0%) |
| Installation, Maintenance & Repair | 3 (100.0%) | 0 (0.0%) |
| Total (Category) | 17 (100.0%) | 0 (0.0%) |
| Total (Overall) | 167 (53.9%) | 143 (46.1%) |
Production, Transportation and Moving Occupations
The most common Production, Transportation and Moving occupations in Winfall are Production (65 | 21.0%), Transportation (24 | 7.7%), and Material Moving (2 | 0.6%).
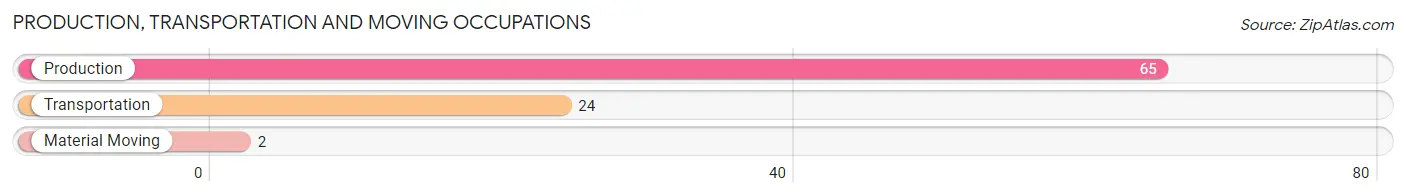
Production, Transportation and Moving Occupations by Sex
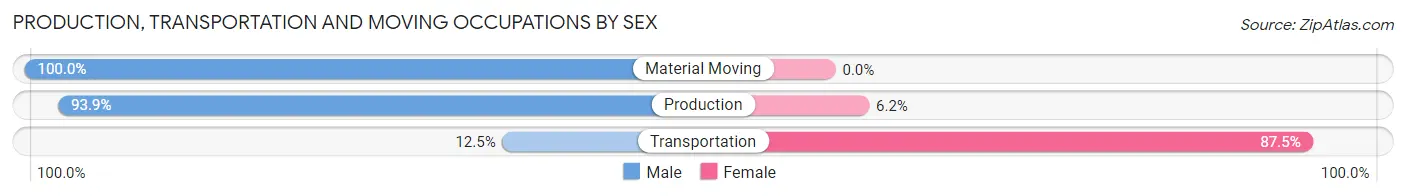
| Occupation | Male | Female |
| Production | 61 (93.9%) | 4 (6.1%) |
| Transportation | 3 (12.5%) | 21 (87.5%) |
| Material Moving | 2 (100.0%) | 0 (0.0%) |
| Total (Category) | 66 (72.5%) | 25 (27.5%) |
| Total (Overall) | 167 (53.9%) | 143 (46.1%) |
Employment Industries by Sex in Winfall
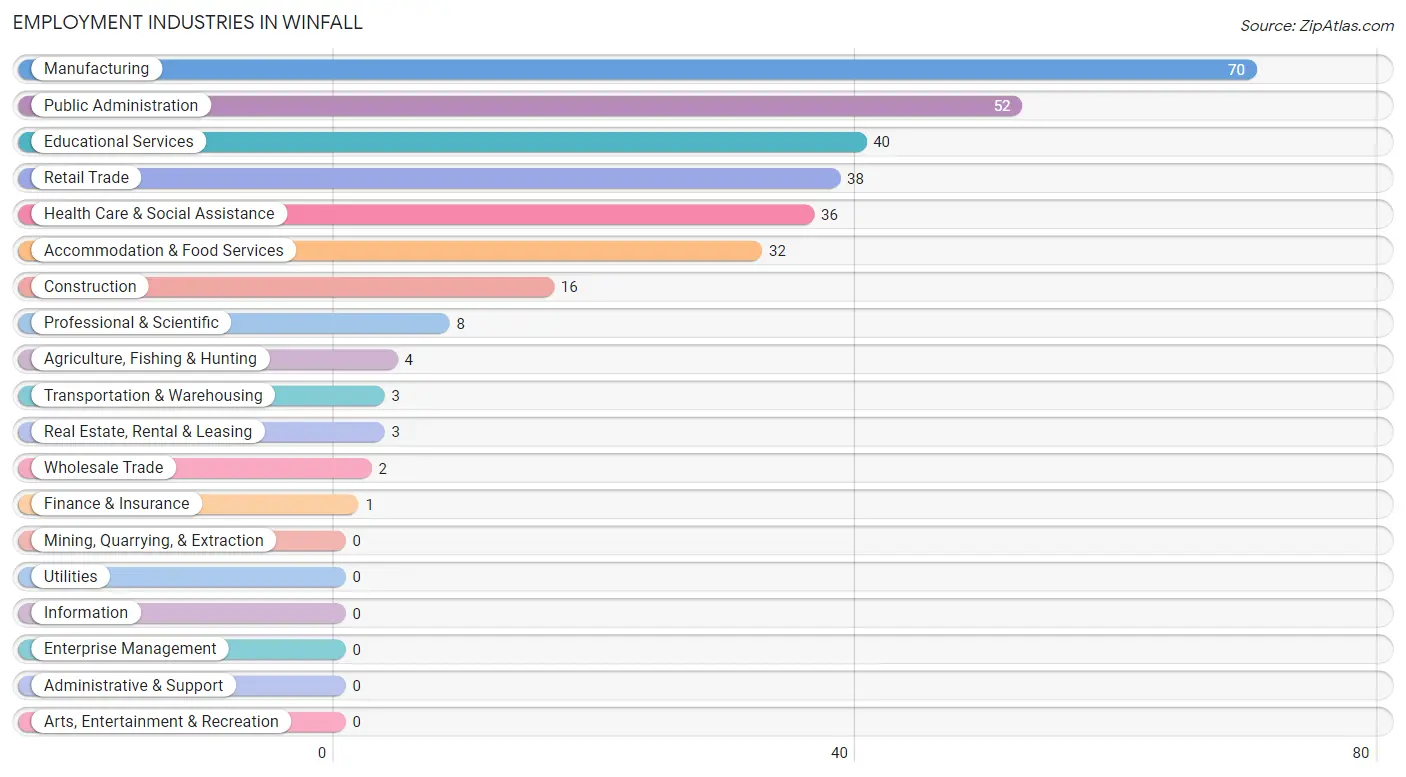
Employment Industries in Winfall
The major employment industries in Winfall include Manufacturing (70 | 22.6%), Public Administration (52 | 16.8%), Educational Services (40 | 12.9%), Retail Trade (38 | 12.3%), and Health Care & Social Assistance (36 | 11.6%).
Employment Industries by Sex in Winfall
The Winfall industries that see more men than women are Construction (100.0%), Wholesale Trade (100.0%), and Transportation & Warehousing (100.0%), whereas the industries that tend to have a higher number of women are Agriculture, Fishing & Hunting (100.0%), Finance & Insurance (100.0%), and Real Estate, Rental & Leasing (100.0%).
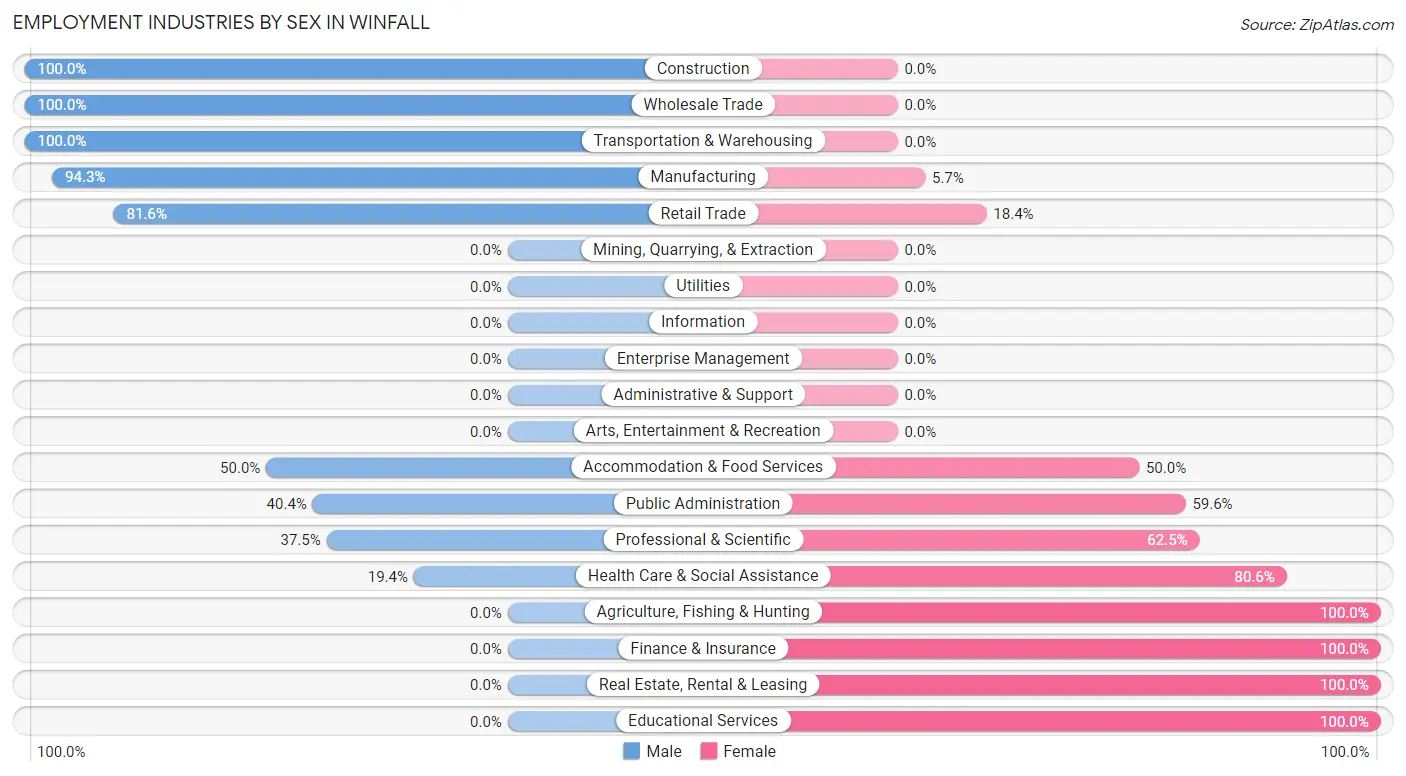
| Industry | Male | Female |
| Agriculture, Fishing & Hunting | 0 (0.0%) | 4 (100.0%) |
| Mining, Quarrying, & Extraction | 0 (0.0%) | 0 (0.0%) |
| Construction | 16 (100.0%) | 0 (0.0%) |
| Manufacturing | 66 (94.3%) | 4 (5.7%) |
| Wholesale Trade | 2 (100.0%) | 0 (0.0%) |
| Retail Trade | 31 (81.6%) | 7 (18.4%) |
| Transportation & Warehousing | 3 (100.0%) | 0 (0.0%) |
| Utilities | 0 (0.0%) | 0 (0.0%) |
| Information | 0 (0.0%) | 0 (0.0%) |
| Finance & Insurance | 0 (0.0%) | 1 (100.0%) |
| Real Estate, Rental & Leasing | 0 (0.0%) | 3 (100.0%) |
| Professional & Scientific | 3 (37.5%) | 5 (62.5%) |
| Enterprise Management | 0 (0.0%) | 0 (0.0%) |
| Administrative & Support | 0 (0.0%) | 0 (0.0%) |
| Educational Services | 0 (0.0%) | 40 (100.0%) |
| Health Care & Social Assistance | 7 (19.4%) | 29 (80.6%) |
| Arts, Entertainment & Recreation | 0 (0.0%) | 0 (0.0%) |
| Accommodation & Food Services | 16 (50.0%) | 16 (50.0%) |
| Public Administration | 21 (40.4%) | 31 (59.6%) |
| Total | 167 (53.9%) | 143 (46.1%) |
Education in Winfall
School Enrollment in Winfall
The most common levels of schooling among the 281 students in Winfall are middle school (82 | 29.2%), high school (64 | 22.8%), and college / undergraduate (55 | 19.6%).
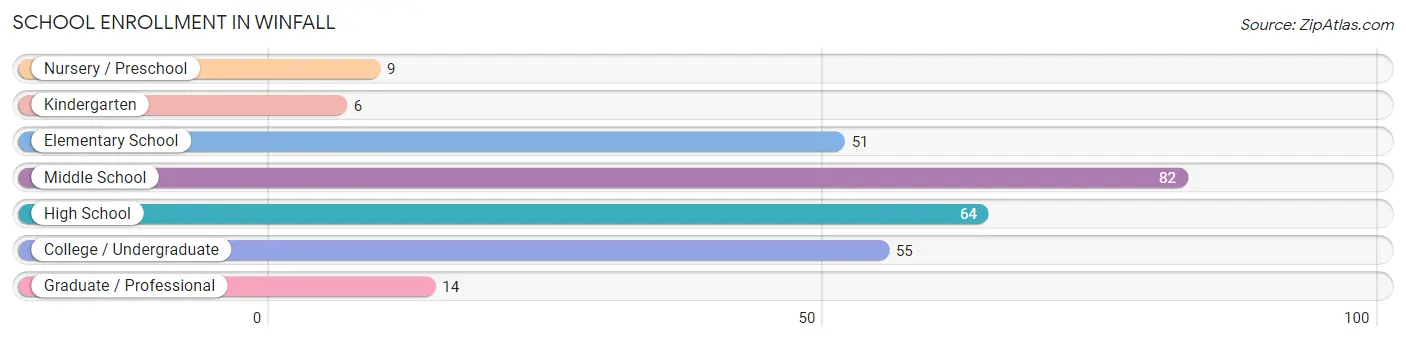
| School Level | # Students | % Students |
| Nursery / Preschool | 9 | 3.2% |
| Kindergarten | 6 | 2.1% |
| Elementary School | 51 | 18.1% |
| Middle School | 82 | 29.2% |
| High School | 64 | 22.8% |
| College / Undergraduate | 55 | 19.6% |
| Graduate / Professional | 14 | 5.0% |
| Total | 281 | 100.0% |
School Enrollment by Age by Funding Source in Winfall
Out of a total of 281 students who are enrolled in schools in Winfall, 23 (8.2%) attend a private institution, while the remaining 258 (91.8%) are enrolled in public schools. The age group of 18 to 19 year olds has the highest likelihood of being enrolled in private schools, with 11 (31.4% in the age bracket) enrolled. Conversely, the age group of 3 to 4 year olds has the lowest likelihood of being enrolled in a private school, with 9 (100.0% in the age bracket) attending a public institution.
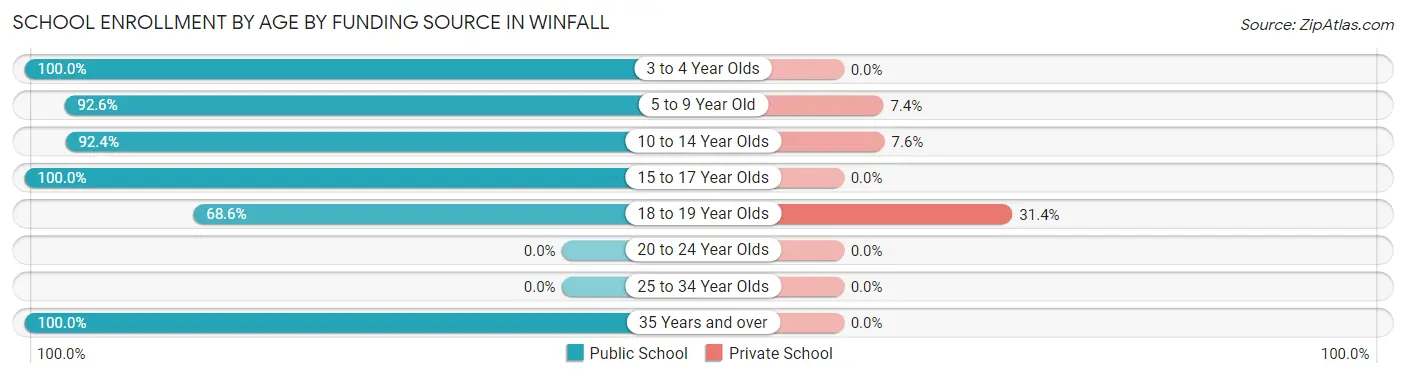
| Age Bracket | Public School | Private School |
| 3 to 4 Year Olds | 9 (100.0%) | 0 (0.0%) |
| 5 to 9 Year Old | 50 (92.6%) | 4 (7.4%) |
| 10 to 14 Year Olds | 97 (92.4%) | 8 (7.6%) |
| 15 to 17 Year Olds | 34 (100.0%) | 0 (0.0%) |
| 18 to 19 Year Olds | 24 (68.6%) | 11 (31.4%) |
| 20 to 24 Year Olds | 0 (0.0%) | 0 (0.0%) |
| 25 to 34 Year Olds | 0 (0.0%) | 0 (0.0%) |
| 35 Years and over | 44 (100.0%) | 0 (0.0%) |
| Total | 258 (91.8%) | 23 (8.2%) |
Educational Attainment by Field of Study in Winfall
Education (33 | 25.4%), psychology (23 | 17.7%), arts & humanities (18 | 13.9%), business (14 | 10.8%), and visual & performing arts (14 | 10.8%) are the most common fields of study among 130 individuals in Winfall who have obtained a bachelor's degree or higher.
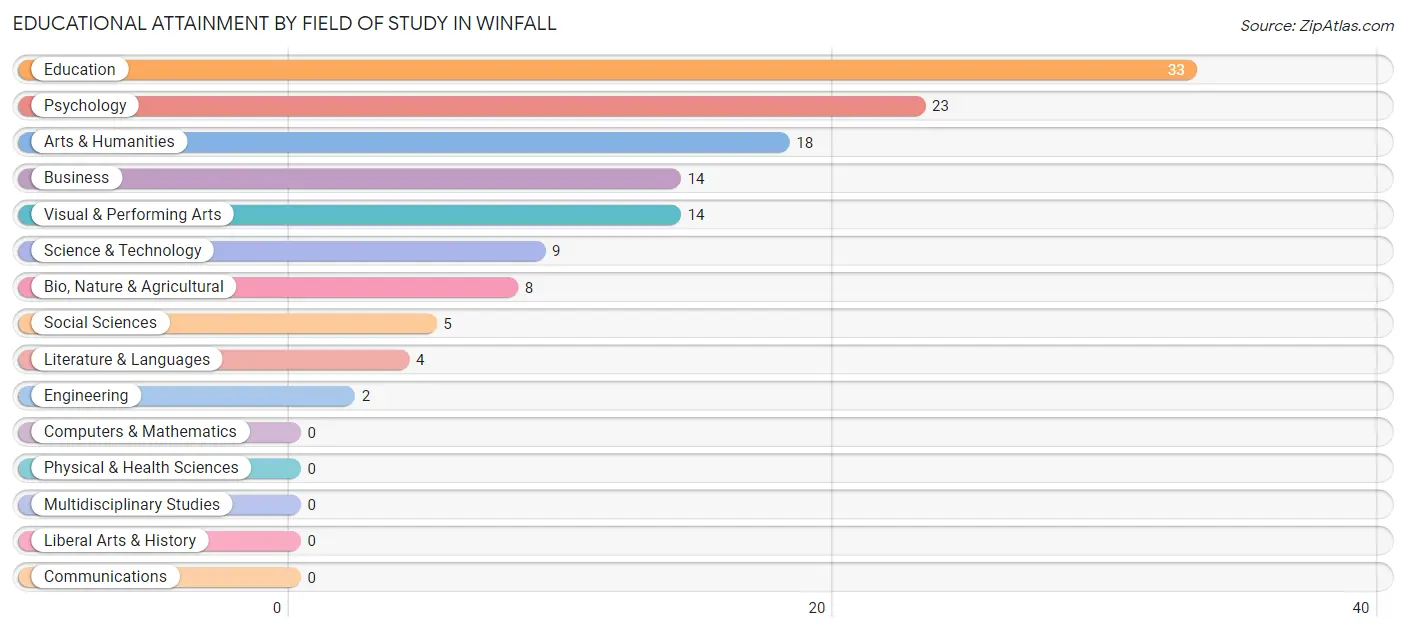
| Field of Study | # Graduates | % Graduates |
| Computers & Mathematics | 0 | 0.0% |
| Bio, Nature & Agricultural | 8 | 6.1% |
| Physical & Health Sciences | 0 | 0.0% |
| Psychology | 23 | 17.7% |
| Social Sciences | 5 | 3.8% |
| Engineering | 2 | 1.5% |
| Multidisciplinary Studies | 0 | 0.0% |
| Science & Technology | 9 | 6.9% |
| Business | 14 | 10.8% |
| Education | 33 | 25.4% |
| Literature & Languages | 4 | 3.1% |
| Liberal Arts & History | 0 | 0.0% |
| Visual & Performing Arts | 14 | 10.8% |
| Communications | 0 | 0.0% |
| Arts & Humanities | 18 | 13.9% |
| Total | 130 | 100.0% |
Transportation & Commute in Winfall
Vehicle Availability by Sex in Winfall
The most prevalent vehicle ownership categories in Winfall are males with 3 vehicles (87, accounting for 53.7%) and females with 3 vehicles (28, making up 60.8%).
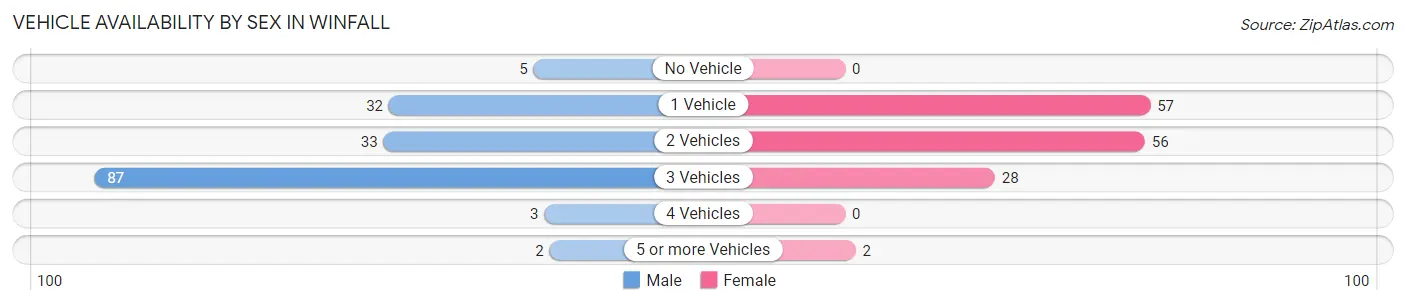
| Vehicles Available | Male | Female |
| No Vehicle | 5 (3.1%) | 0 (0.0%) |
| 1 Vehicle | 32 (19.8%) | 57 (39.9%) |
| 2 Vehicles | 33 (20.4%) | 56 (39.2%) |
| 3 Vehicles | 87 (53.7%) | 28 (19.6%) |
| 4 Vehicles | 3 (1.8%) | 0 (0.0%) |
| 5 or more Vehicles | 2 (1.2%) | 2 (1.4%) |
| Total | 162 (100.0%) | 143 (100.0%) |
Commute Time in Winfall
The most frequently occuring commute durations in Winfall are 15 to 19 minutes (60 commuters, 19.9%), 5 to 9 minutes (59 commuters, 19.6%), and 30 to 34 minutes (58 commuters, 19.3%).
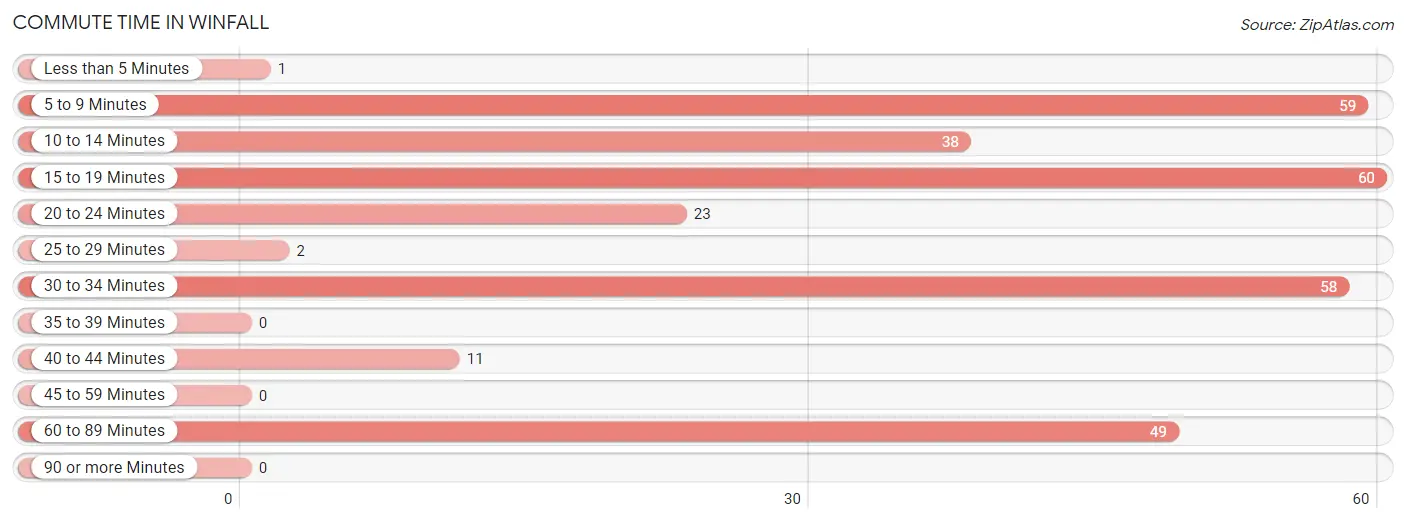
| Commute Time | # Commuters | % Commuters |
| Less than 5 Minutes | 1 | 0.3% |
| 5 to 9 Minutes | 59 | 19.6% |
| 10 to 14 Minutes | 38 | 12.6% |
| 15 to 19 Minutes | 60 | 19.9% |
| 20 to 24 Minutes | 23 | 7.6% |
| 25 to 29 Minutes | 2 | 0.7% |
| 30 to 34 Minutes | 58 | 19.3% |
| 35 to 39 Minutes | 0 | 0.0% |
| 40 to 44 Minutes | 11 | 3.6% |
| 45 to 59 Minutes | 0 | 0.0% |
| 60 to 89 Minutes | 49 | 16.3% |
| 90 or more Minutes | 0 | 0.0% |
Commute Time by Sex in Winfall
The most common commute times in Winfall are 15 to 19 minutes (56 commuters, 35.4%) for males and 30 to 34 minutes (41 commuters, 28.7%) for females.
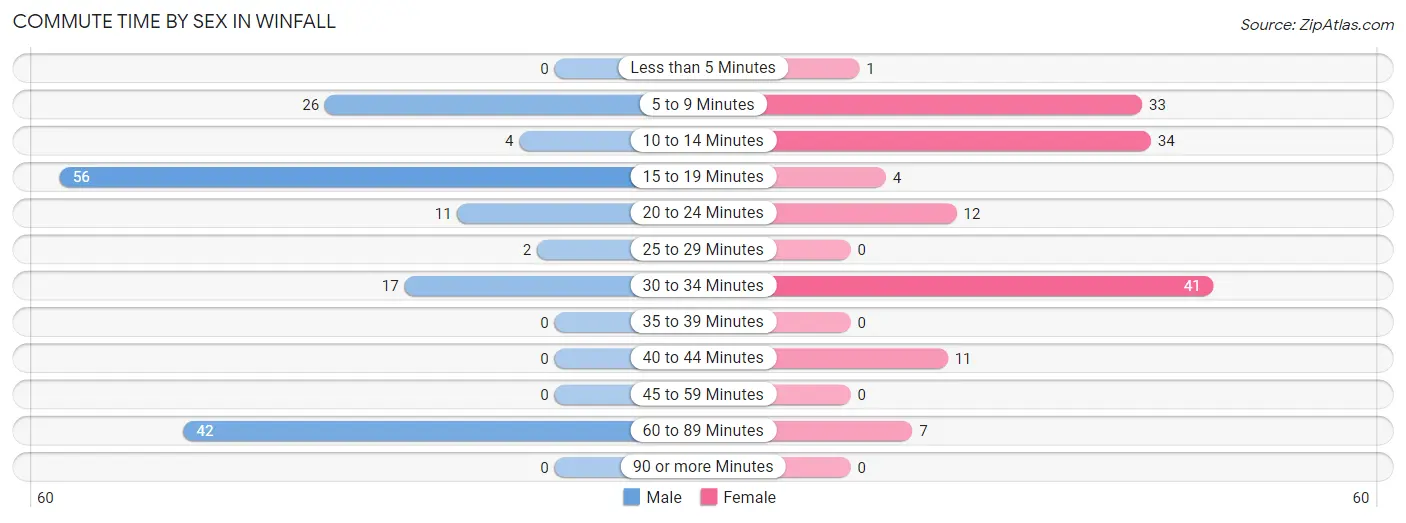
| Commute Time | Male | Female |
| Less than 5 Minutes | 0 (0.0%) | 1 (0.7%) |
| 5 to 9 Minutes | 26 (16.5%) | 33 (23.1%) |
| 10 to 14 Minutes | 4 (2.5%) | 34 (23.8%) |
| 15 to 19 Minutes | 56 (35.4%) | 4 (2.8%) |
| 20 to 24 Minutes | 11 (7.0%) | 12 (8.4%) |
| 25 to 29 Minutes | 2 (1.3%) | 0 (0.0%) |
| 30 to 34 Minutes | 17 (10.8%) | 41 (28.7%) |
| 35 to 39 Minutes | 0 (0.0%) | 0 (0.0%) |
| 40 to 44 Minutes | 0 (0.0%) | 11 (7.7%) |
| 45 to 59 Minutes | 0 (0.0%) | 0 (0.0%) |
| 60 to 89 Minutes | 42 (26.6%) | 7 (4.9%) |
| 90 or more Minutes | 0 (0.0%) | 0 (0.0%) |
Time of Departure to Work by Sex in Winfall
The most frequent times of departure to work in Winfall are 5:00 AM to 5:29 AM (42, 26.6%) for males and 4:00 PM to 11:59 PM (49, 34.3%) for females.
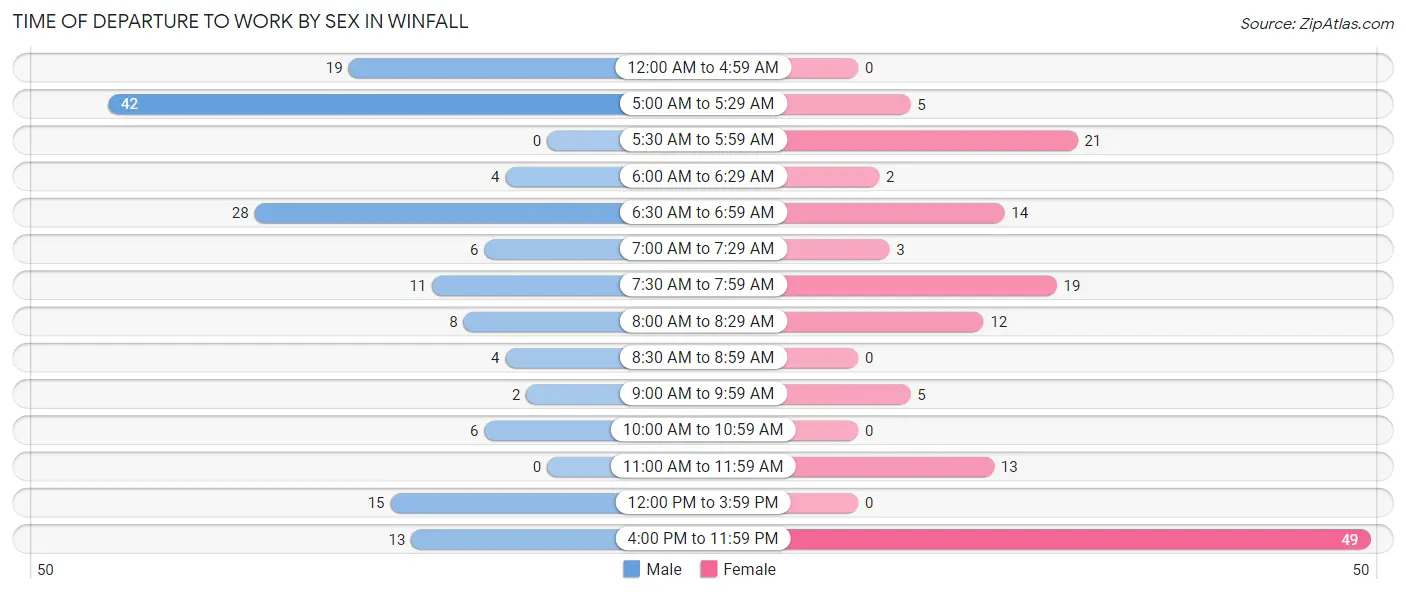
| Time of Departure | Male | Female |
| 12:00 AM to 4:59 AM | 19 (12.0%) | 0 (0.0%) |
| 5:00 AM to 5:29 AM | 42 (26.6%) | 5 (3.5%) |
| 5:30 AM to 5:59 AM | 0 (0.0%) | 21 (14.7%) |
| 6:00 AM to 6:29 AM | 4 (2.5%) | 2 (1.4%) |
| 6:30 AM to 6:59 AM | 28 (17.7%) | 14 (9.8%) |
| 7:00 AM to 7:29 AM | 6 (3.8%) | 3 (2.1%) |
| 7:30 AM to 7:59 AM | 11 (7.0%) | 19 (13.3%) |
| 8:00 AM to 8:29 AM | 8 (5.1%) | 12 (8.4%) |
| 8:30 AM to 8:59 AM | 4 (2.5%) | 0 (0.0%) |
| 9:00 AM to 9:59 AM | 2 (1.3%) | 5 (3.5%) |
| 10:00 AM to 10:59 AM | 6 (3.8%) | 0 (0.0%) |
| 11:00 AM to 11:59 AM | 0 (0.0%) | 13 (9.1%) |
| 12:00 PM to 3:59 PM | 15 (9.5%) | 0 (0.0%) |
| 4:00 PM to 11:59 PM | 13 (8.2%) | 49 (34.3%) |
| Total | 158 (100.0%) | 143 (100.0%) |
Housing Occupancy in Winfall
Occupancy by Ownership in Winfall
Of the total 374 dwellings in Winfall, owner-occupied units account for 226 (60.4%), while renter-occupied units make up 148 (39.6%).
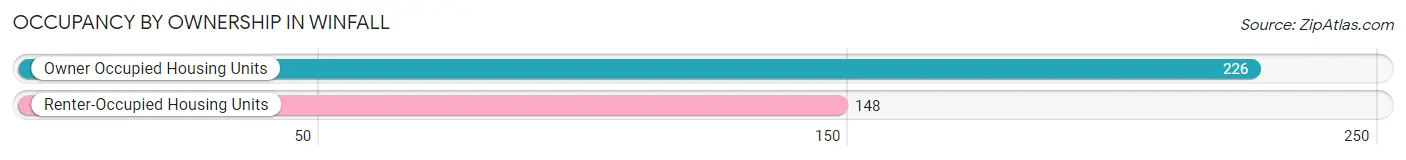
| Occupancy | # Housing Units | % Housing Units |
| Owner Occupied Housing Units | 226 | 60.4% |
| Renter-Occupied Housing Units | 148 | 39.6% |
| Total Occupied Housing Units | 374 | 100.0% |
Occupancy by Household Size in Winfall
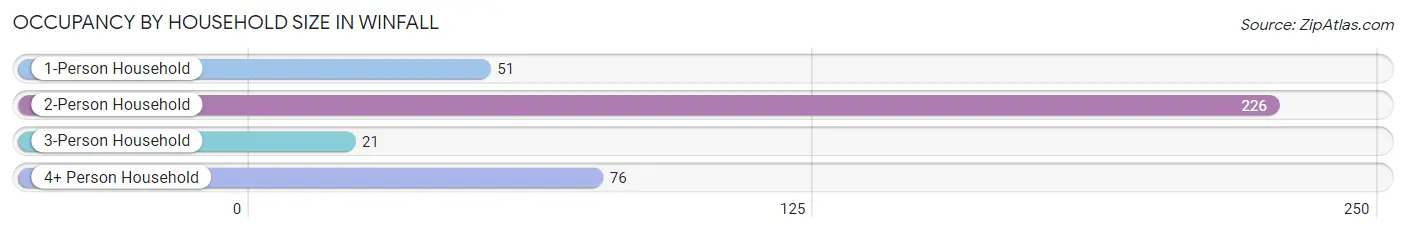
| Household Size | # Housing Units | % Housing Units |
| 1-Person Household | 51 | 13.6% |
| 2-Person Household | 226 | 60.4% |
| 3-Person Household | 21 | 5.6% |
| 4+ Person Household | 76 | 20.3% |
| Total Housing Units | 374 | 100.0% |
Occupancy by Ownership by Household Size in Winfall
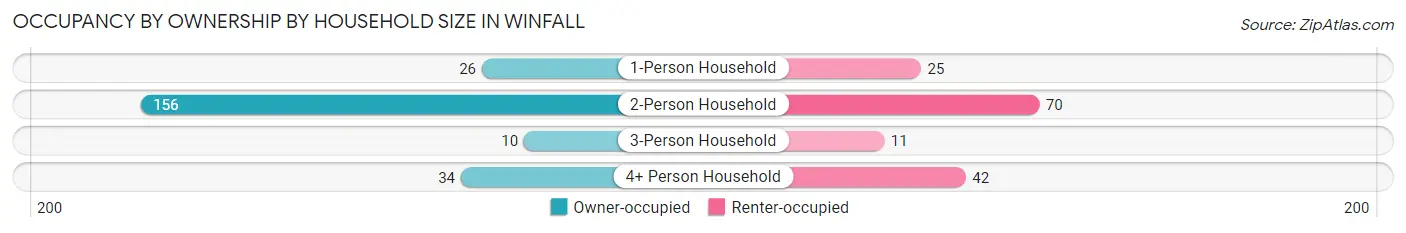
| Household Size | Owner-occupied | Renter-occupied |
| 1-Person Household | 26 (51.0%) | 25 (49.0%) |
| 2-Person Household | 156 (69.0%) | 70 (31.0%) |
| 3-Person Household | 10 (47.6%) | 11 (52.4%) |
| 4+ Person Household | 34 (44.7%) | 42 (55.3%) |
| Total Housing Units | 226 (60.4%) | 148 (39.6%) |
Occupancy by Educational Attainment in Winfall
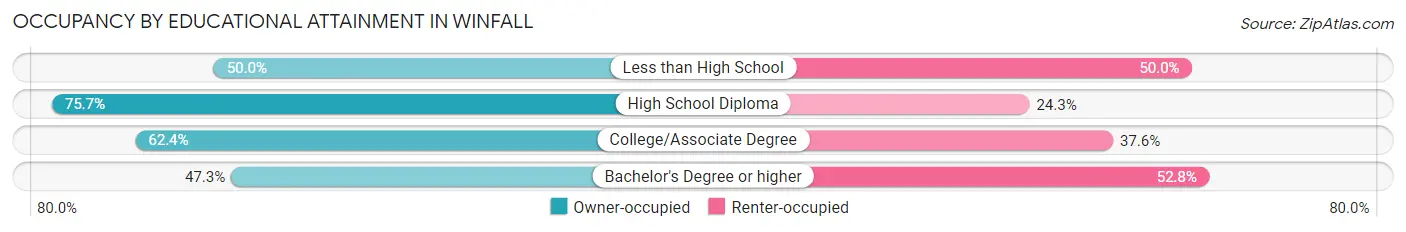
| Household Size | Owner-occupied | Renter-occupied |
| Less than High School | 14 (50.0%) | 14 (50.0%) |
| High School Diploma | 56 (75.7%) | 18 (24.3%) |
| College/Associate Degree | 113 (62.4%) | 68 (37.6%) |
| Bachelor's Degree or higher | 43 (47.2%) | 48 (52.7%) |
Occupancy by Age of Householder in Winfall
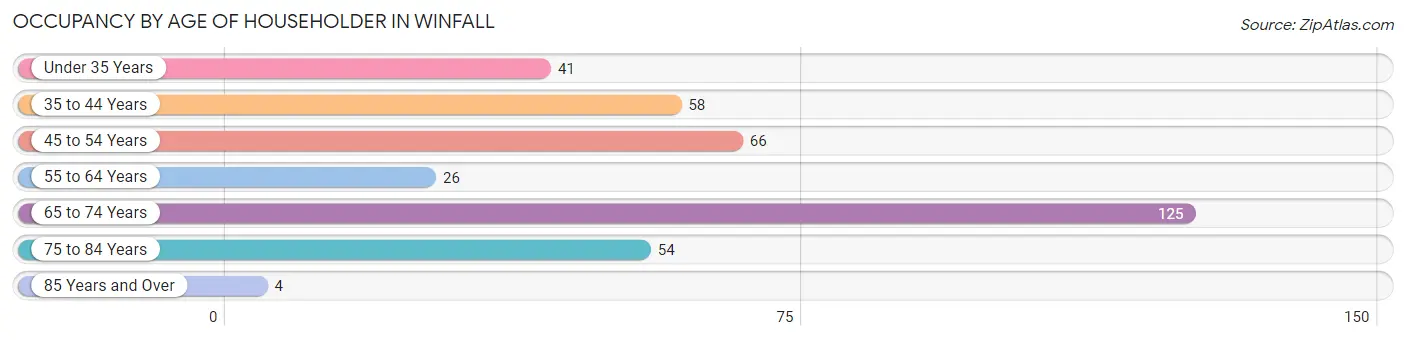
| Age Bracket | # Households | % Households |
| Under 35 Years | 41 | 11.0% |
| 35 to 44 Years | 58 | 15.5% |
| 45 to 54 Years | 66 | 17.6% |
| 55 to 64 Years | 26 | 7.0% |
| 65 to 74 Years | 125 | 33.4% |
| 75 to 84 Years | 54 | 14.4% |
| 85 Years and Over | 4 | 1.1% |
| Total | 374 | 100.0% |
Housing Finances in Winfall
Median Income by Occupancy in Winfall
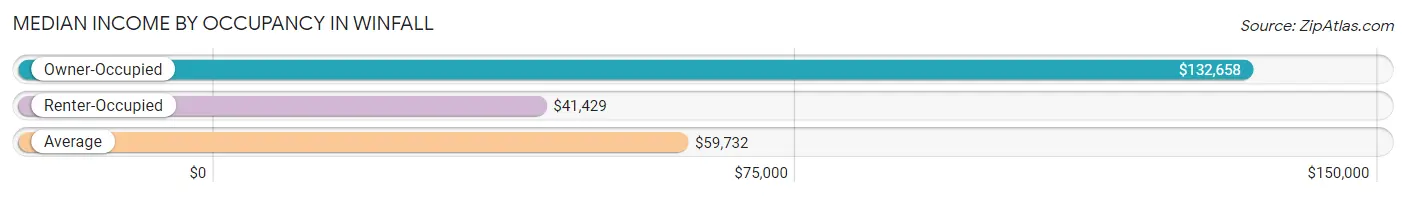
| Occupancy Type | # Households | Median Income |
| Owner-Occupied | 226 (60.4%) | $132,658 |
| Renter-Occupied | 148 (39.6%) | $41,429 |
| Average | 374 (100.0%) | $59,732 |
Occupancy by Householder Income Bracket in Winfall
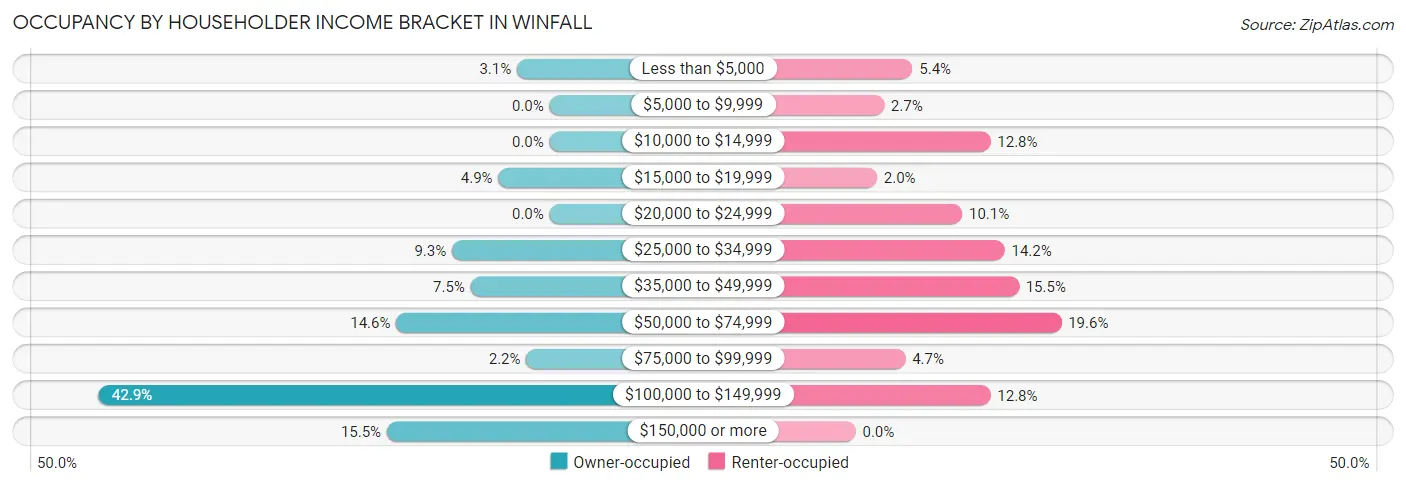
| Income Bracket | Owner-occupied | Renter-occupied |
| Less than $5,000 | 7 (3.1%) | 8 (5.4%) |
| $5,000 to $9,999 | 0 (0.0%) | 4 (2.7%) |
| $10,000 to $14,999 | 0 (0.0%) | 19 (12.8%) |
| $15,000 to $19,999 | 11 (4.9%) | 3 (2.0%) |
| $20,000 to $24,999 | 0 (0.0%) | 15 (10.1%) |
| $25,000 to $34,999 | 21 (9.3%) | 21 (14.2%) |
| $35,000 to $49,999 | 17 (7.5%) | 23 (15.5%) |
| $50,000 to $74,999 | 33 (14.6%) | 29 (19.6%) |
| $75,000 to $99,999 | 5 (2.2%) | 7 (4.7%) |
| $100,000 to $149,999 | 97 (42.9%) | 19 (12.8%) |
| $150,000 or more | 35 (15.5%) | 0 (0.0%) |
| Total | 226 (100.0%) | 148 (100.0%) |
Monthly Housing Cost Tiers in Winfall
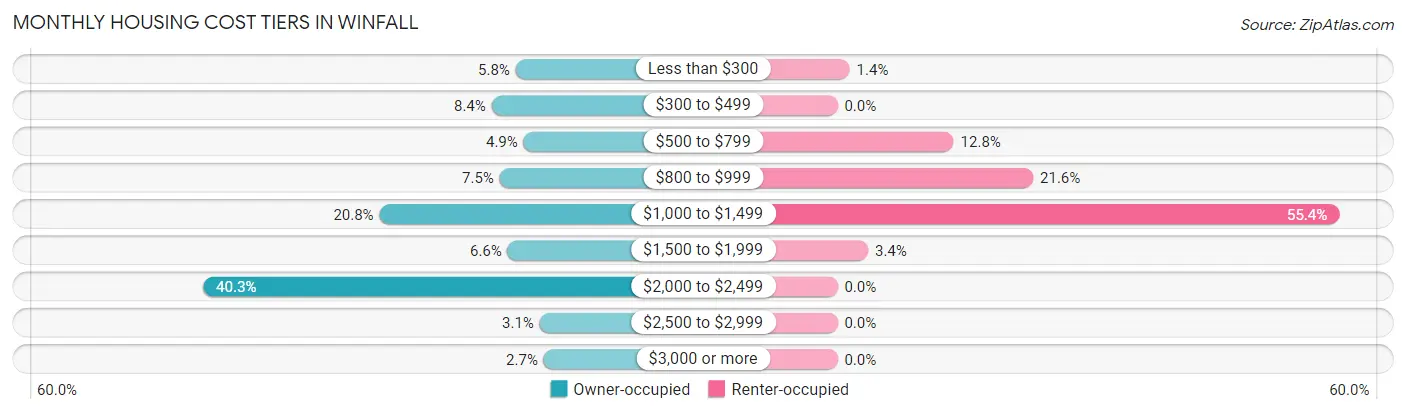
| Monthly Cost | Owner-occupied | Renter-occupied |
| Less than $300 | 13 (5.8%) | 2 (1.3%) |
| $300 to $499 | 19 (8.4%) | 0 (0.0%) |
| $500 to $799 | 11 (4.9%) | 19 (12.8%) |
| $800 to $999 | 17 (7.5%) | 32 (21.6%) |
| $1,000 to $1,499 | 47 (20.8%) | 82 (55.4%) |
| $1,500 to $1,999 | 15 (6.6%) | 5 (3.4%) |
| $2,000 to $2,499 | 91 (40.3%) | 0 (0.0%) |
| $2,500 to $2,999 | 7 (3.1%) | 0 (0.0%) |
| $3,000 or more | 6 (2.6%) | 0 (0.0%) |
| Total | 226 (100.0%) | 148 (100.0%) |
Physical Housing Characteristics in Winfall
Housing Structures in Winfall
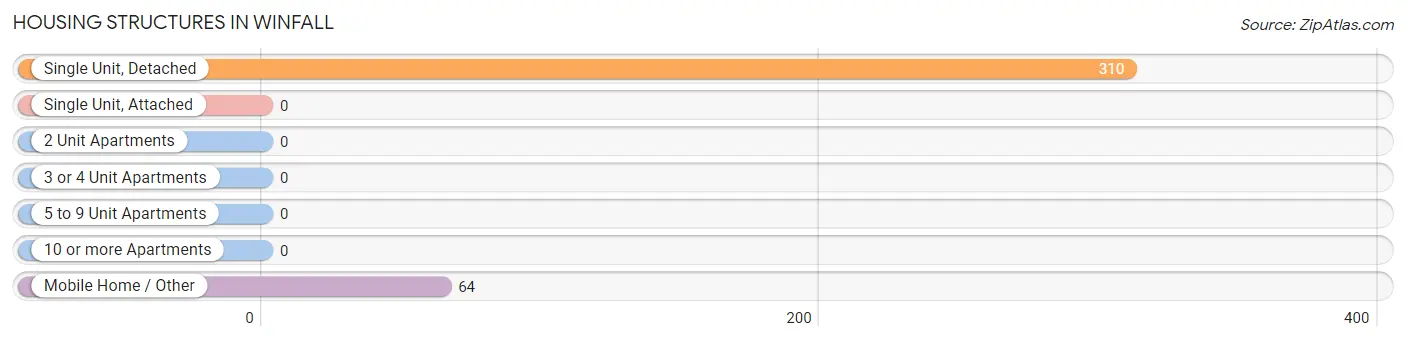
| Structure Type | # Housing Units | % Housing Units |
| Single Unit, Detached | 310 | 82.9% |
| Single Unit, Attached | 0 | 0.0% |
| 2 Unit Apartments | 0 | 0.0% |
| 3 or 4 Unit Apartments | 0 | 0.0% |
| 5 to 9 Unit Apartments | 0 | 0.0% |
| 10 or more Apartments | 0 | 0.0% |
| Mobile Home / Other | 64 | 17.1% |
| Total | 374 | 100.0% |
Housing Structures by Occupancy in Winfall
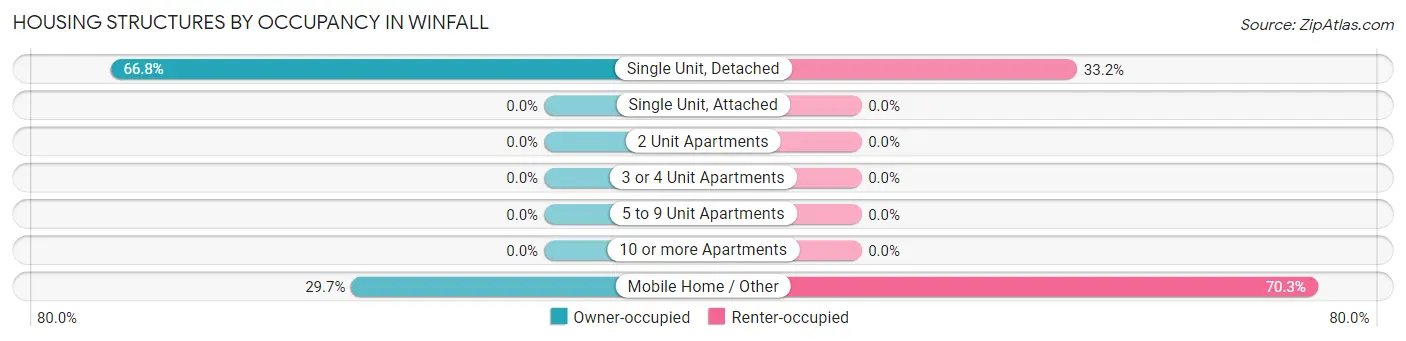
| Structure Type | Owner-occupied | Renter-occupied |
| Single Unit, Detached | 207 (66.8%) | 103 (33.2%) |
| Single Unit, Attached | 0 (0.0%) | 0 (0.0%) |
| 2 Unit Apartments | 0 (0.0%) | 0 (0.0%) |
| 3 or 4 Unit Apartments | 0 (0.0%) | 0 (0.0%) |
| 5 to 9 Unit Apartments | 0 (0.0%) | 0 (0.0%) |
| 10 or more Apartments | 0 (0.0%) | 0 (0.0%) |
| Mobile Home / Other | 19 (29.7%) | 45 (70.3%) |
| Total | 226 (60.4%) | 148 (39.6%) |
Housing Structures by Number of Rooms in Winfall
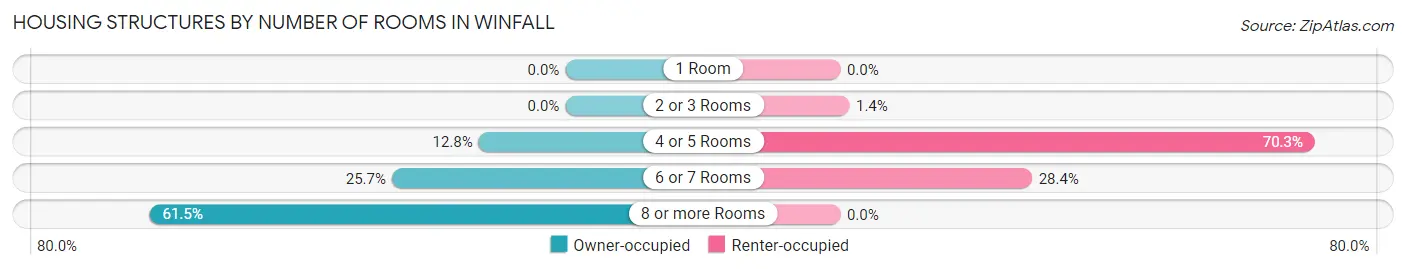
| Number of Rooms | Owner-occupied | Renter-occupied |
| 1 Room | 0 (0.0%) | 0 (0.0%) |
| 2 or 3 Rooms | 0 (0.0%) | 2 (1.3%) |
| 4 or 5 Rooms | 29 (12.8%) | 104 (70.3%) |
| 6 or 7 Rooms | 58 (25.7%) | 42 (28.4%) |
| 8 or more Rooms | 139 (61.5%) | 0 (0.0%) |
| Total | 226 (100.0%) | 148 (100.0%) |
Housing Structure by Heating Type in Winfall
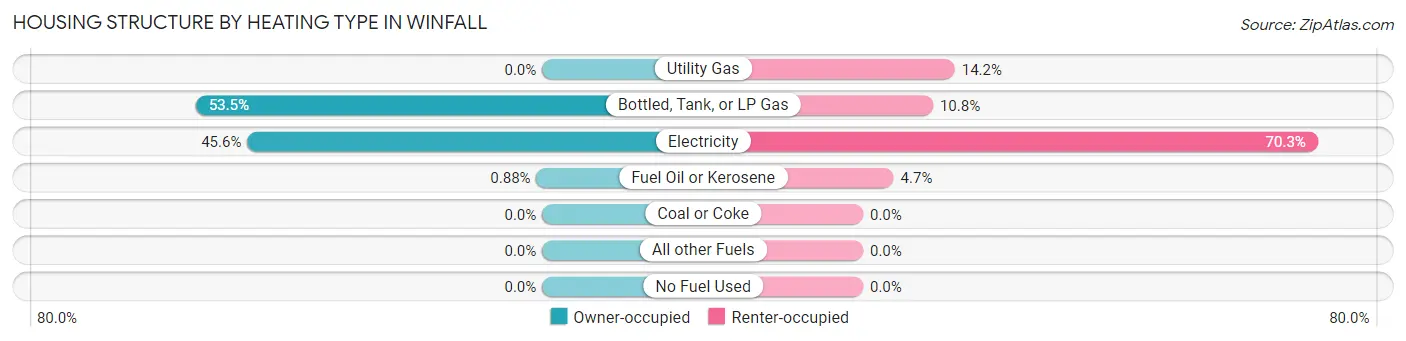
| Heating Type | Owner-occupied | Renter-occupied |
| Utility Gas | 0 (0.0%) | 21 (14.2%) |
| Bottled, Tank, or LP Gas | 121 (53.5%) | 16 (10.8%) |
| Electricity | 103 (45.6%) | 104 (70.3%) |
| Fuel Oil or Kerosene | 2 (0.9%) | 7 (4.7%) |
| Coal or Coke | 0 (0.0%) | 0 (0.0%) |
| All other Fuels | 0 (0.0%) | 0 (0.0%) |
| No Fuel Used | 0 (0.0%) | 0 (0.0%) |
| Total | 226 (100.0%) | 148 (100.0%) |
Household Vehicle Usage in Winfall
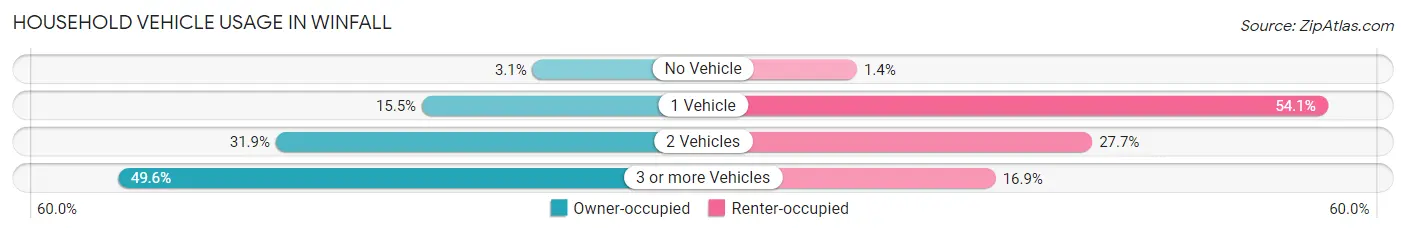
| Vehicles per Household | Owner-occupied | Renter-occupied |
| No Vehicle | 7 (3.1%) | 2 (1.3%) |
| 1 Vehicle | 35 (15.5%) | 80 (54.0%) |
| 2 Vehicles | 72 (31.9%) | 41 (27.7%) |
| 3 or more Vehicles | 112 (49.6%) | 25 (16.9%) |
| Total | 226 (100.0%) | 148 (100.0%) |
Real Estate & Mortgages in Winfall
Real Estate and Mortgage Overview in Winfall
| Characteristic | Without Mortgage | With Mortgage |
| Housing Units | 49 | 177 |
| Median Property Value | - | - |
| Median Household Income | - | - |
| Monthly Housing Costs | $453 | $6 |
| Real Estate Taxes | $1,425 | $0 |
Property Value by Mortgage Status in Winfall
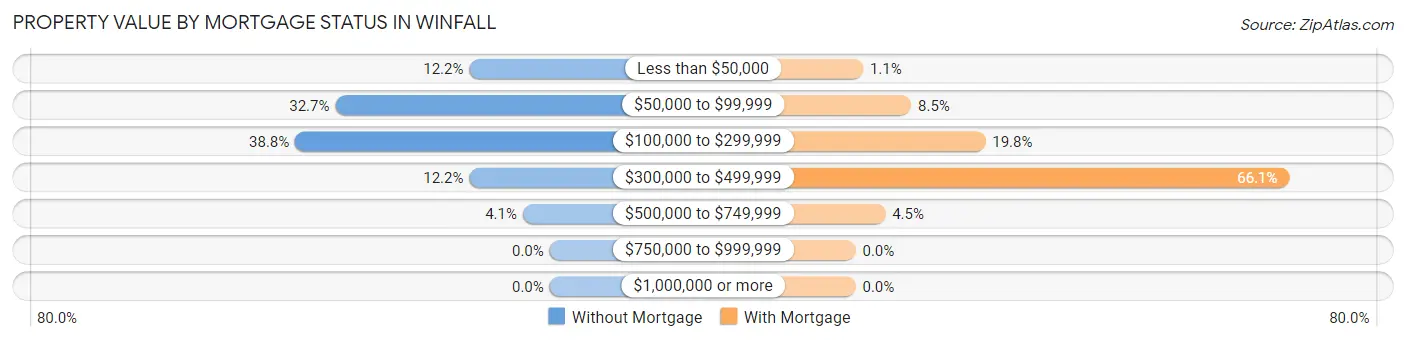
| Property Value | Without Mortgage | With Mortgage |
| Less than $50,000 | 6 (12.2%) | 2 (1.1%) |
| $50,000 to $99,999 | 16 (32.7%) | 15 (8.5%) |
| $100,000 to $299,999 | 19 (38.8%) | 35 (19.8%) |
| $300,000 to $499,999 | 6 (12.2%) | 117 (66.1%) |
| $500,000 to $749,999 | 2 (4.1%) | 8 (4.5%) |
| $750,000 to $999,999 | 0 (0.0%) | 0 (0.0%) |
| $1,000,000 or more | 0 (0.0%) | 0 (0.0%) |
| Total | 49 (100.0%) | 177 (100.0%) |
Household Income by Mortgage Status in Winfall
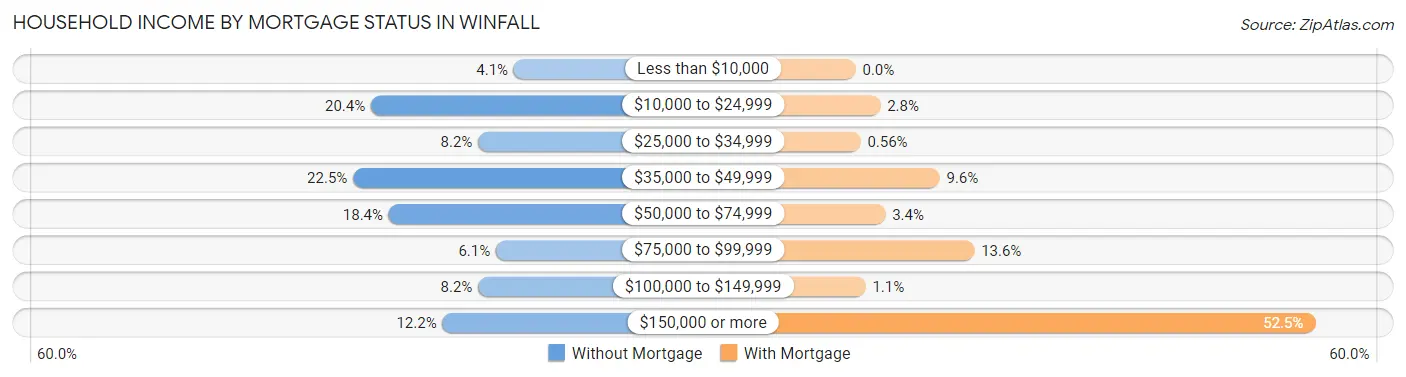
| Household Income | Without Mortgage | With Mortgage |
| Less than $10,000 | 2 (4.1%) | 0 (0.0%) |
| $10,000 to $24,999 | 10 (20.4%) | 5 (2.8%) |
| $25,000 to $34,999 | 4 (8.2%) | 1 (0.6%) |
| $35,000 to $49,999 | 11 (22.5%) | 17 (9.6%) |
| $50,000 to $74,999 | 9 (18.4%) | 6 (3.4%) |
| $75,000 to $99,999 | 3 (6.1%) | 24 (13.6%) |
| $100,000 to $149,999 | 4 (8.2%) | 2 (1.1%) |
| $150,000 or more | 6 (12.2%) | 93 (52.5%) |
| Total | 49 (100.0%) | 177 (100.0%) |
Property Value to Household Income Ratio in Winfall
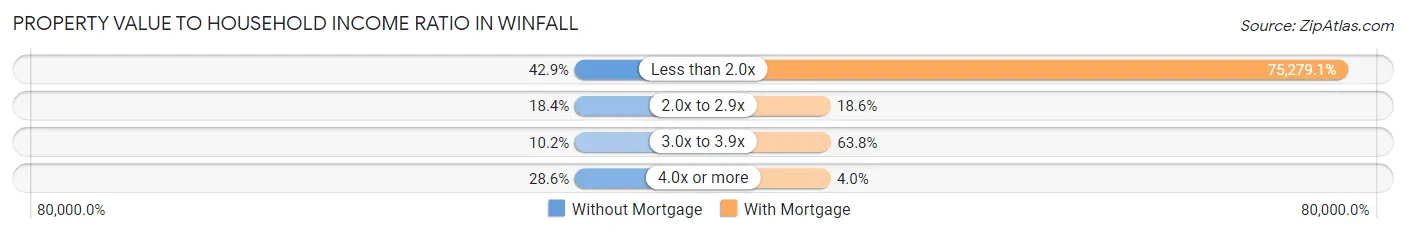
| Value-to-Income Ratio | Without Mortgage | With Mortgage |
| Less than 2.0x | 21 (42.9%) | 133,244 (75,279.1%) |
| 2.0x to 2.9x | 9 (18.4%) | 33 (18.6%) |
| 3.0x to 3.9x | 5 (10.2%) | 113 (63.8%) |
| 4.0x or more | 14 (28.6%) | 7 (4.0%) |
| Total | 49 (100.0%) | 177 (100.0%) |
Real Estate Taxes by Mortgage Status in Winfall
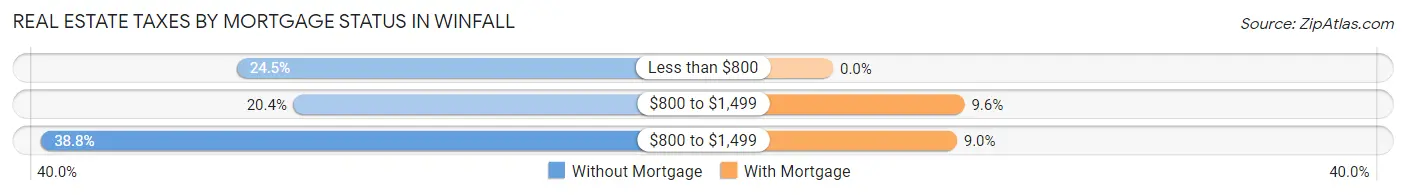
| Property Taxes | Without Mortgage | With Mortgage |
| Less than $800 | 12 (24.5%) | 0 (0.0%) |
| $800 to $1,499 | 10 (20.4%) | 17 (9.6%) |
| $800 to $1,499 | 19 (38.8%) | 16 (9.0%) |
| Total | 49 (100.0%) | 177 (100.0%) |
Health & Disability in Winfall
Health Insurance Coverage by Age in Winfall
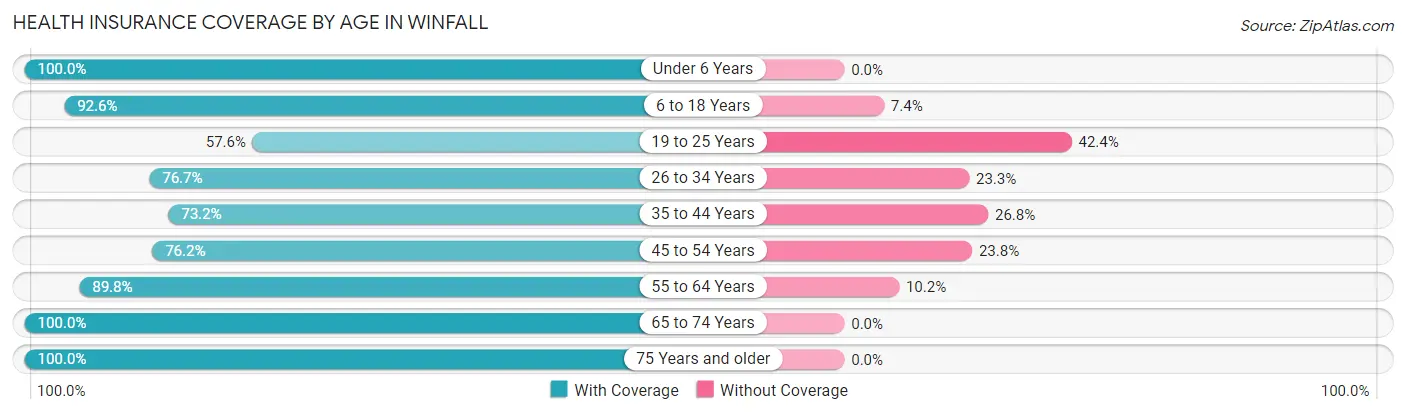
| Age Bracket | With Coverage | Without Coverage |
| Under 6 Years | 64 (100.0%) | 0 (0.0%) |
| 6 to 18 Years | 188 (92.6%) | 15 (7.4%) |
| 19 to 25 Years | 34 (57.6%) | 25 (42.4%) |
| 26 to 34 Years | 33 (76.7%) | 10 (23.3%) |
| 35 to 44 Years | 71 (73.2%) | 26 (26.8%) |
| 45 to 54 Years | 64 (76.2%) | 20 (23.8%) |
| 55 to 64 Years | 88 (89.8%) | 10 (10.2%) |
| 65 to 74 Years | 160 (100.0%) | 0 (0.0%) |
| 75 Years and older | 84 (100.0%) | 0 (0.0%) |
| Total | 786 (88.1%) | 106 (11.9%) |
Health Insurance Coverage by Citizenship Status in Winfall
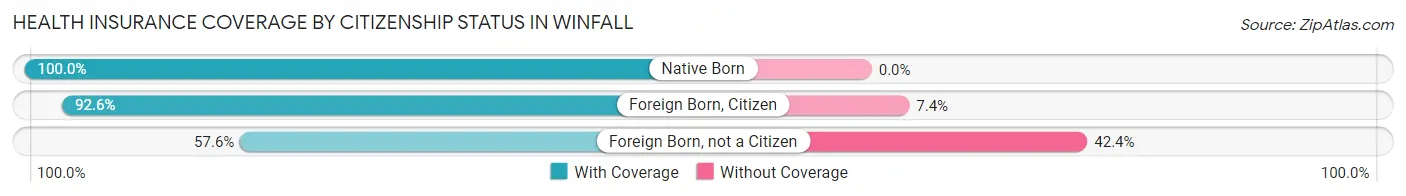
| Citizenship Status | With Coverage | Without Coverage |
| Native Born | 64 (100.0%) | 0 (0.0%) |
| Foreign Born, Citizen | 188 (92.6%) | 15 (7.4%) |
| Foreign Born, not a Citizen | 34 (57.6%) | 25 (42.4%) |
Health Insurance Coverage by Household Income in Winfall
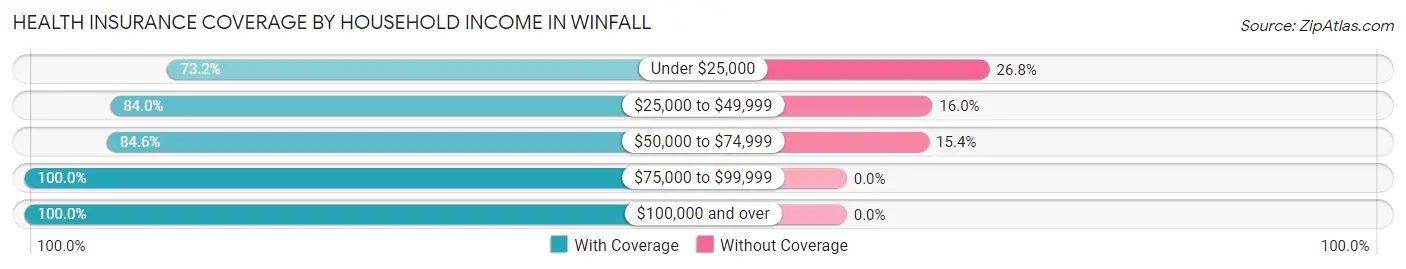
| Household Income | With Coverage | Without Coverage |
| Under $25,000 | 93 (73.2%) | 34 (26.8%) |
| $25,000 to $49,999 | 246 (84.0%) | 47 (16.0%) |
| $50,000 to $74,999 | 137 (84.6%) | 25 (15.4%) |
| $75,000 to $99,999 | 31 (100.0%) | 0 (0.0%) |
| $100,000 and over | 279 (100.0%) | 0 (0.0%) |
Public vs Private Health Insurance Coverage by Age in Winfall
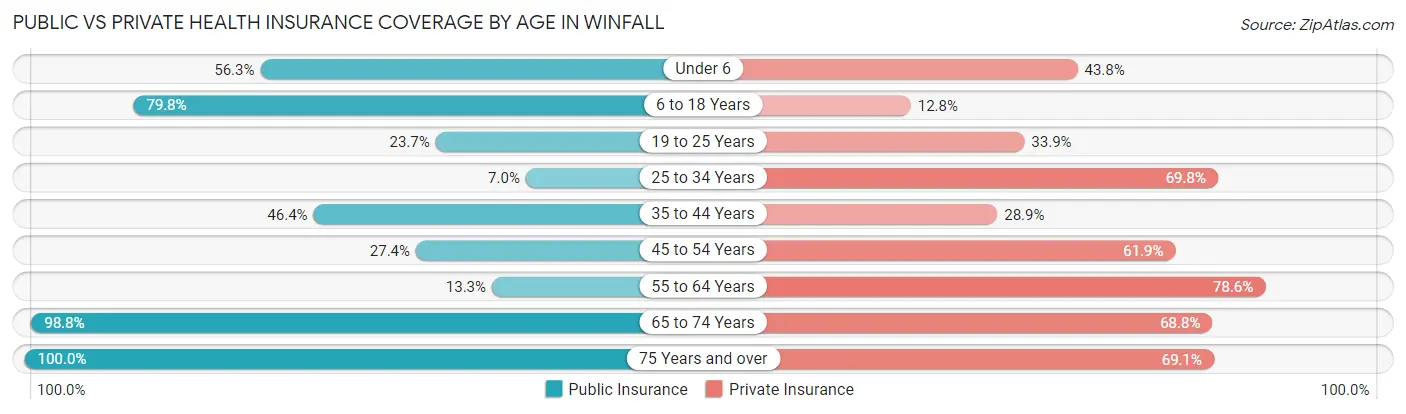
| Age Bracket | Public Insurance | Private Insurance |
| Under 6 | 36 (56.2%) | 28 (43.8%) |
| 6 to 18 Years | 162 (79.8%) | 26 (12.8%) |
| 19 to 25 Years | 14 (23.7%) | 20 (33.9%) |
| 25 to 34 Years | 3 (7.0%) | 30 (69.8%) |
| 35 to 44 Years | 45 (46.4%) | 28 (28.9%) |
| 45 to 54 Years | 23 (27.4%) | 52 (61.9%) |
| 55 to 64 Years | 13 (13.3%) | 77 (78.6%) |
| 65 to 74 Years | 158 (98.8%) | 110 (68.8%) |
| 75 Years and over | 84 (100.0%) | 58 (69.1%) |
| Total | 538 (60.3%) | 429 (48.1%) |
Disability Status by Sex by Age in Winfall
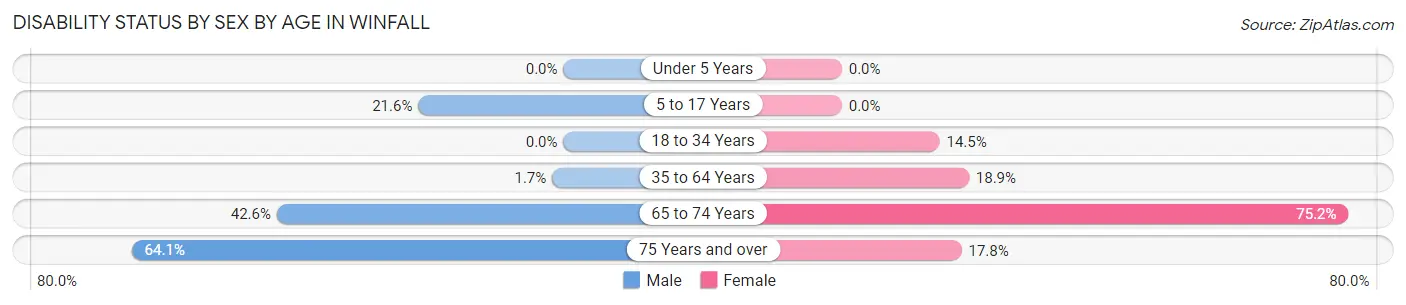
| Age Bracket | Male | Female |
| Under 5 Years | 0 (0.0%) | 0 (0.0%) |
| 5 to 17 Years | 25 (21.5%) | 0 (0.0%) |
| 18 to 34 Years | 0 (0.0%) | 9 (14.5%) |
| 35 to 64 Years | 2 (1.7%) | 30 (18.9%) |
| 65 to 74 Years | 20 (42.5%) | 85 (75.2%) |
| 75 Years and over | 25 (64.1%) | 8 (17.8%) |
Disability Class by Sex by Age in Winfall
Disability Class: Hearing Difficulty
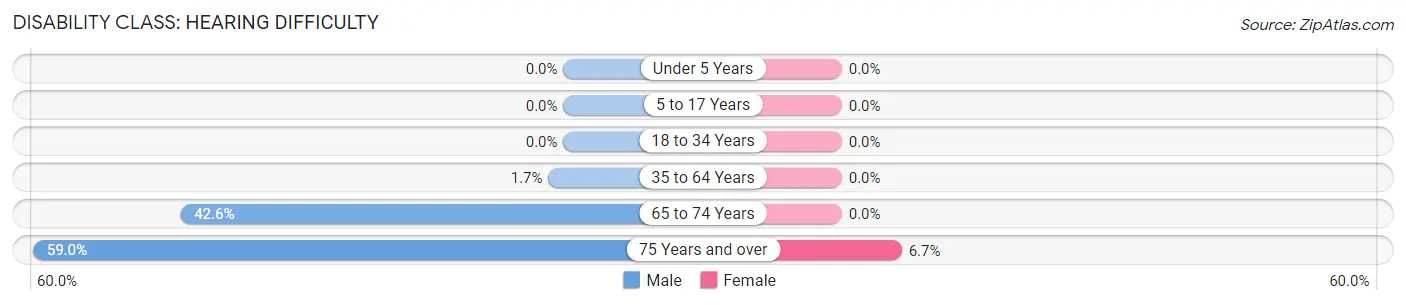
| Age Bracket | Male | Female |
| Under 5 Years | 0 (0.0%) | 0 (0.0%) |
| 5 to 17 Years | 0 (0.0%) | 0 (0.0%) |
| 18 to 34 Years | 0 (0.0%) | 0 (0.0%) |
| 35 to 64 Years | 2 (1.7%) | 0 (0.0%) |
| 65 to 74 Years | 20 (42.5%) | 0 (0.0%) |
| 75 Years and over | 23 (59.0%) | 3 (6.7%) |
Disability Class: Vision Difficulty
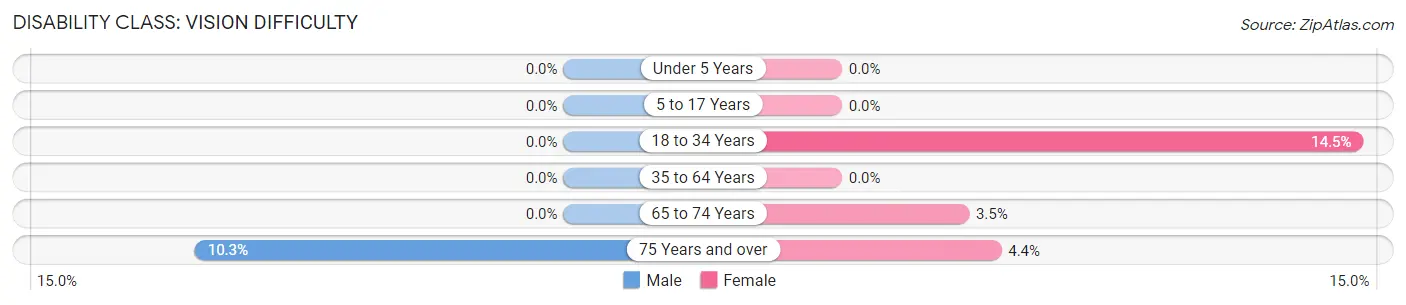
| Age Bracket | Male | Female |
| Under 5 Years | 0 (0.0%) | 0 (0.0%) |
| 5 to 17 Years | 0 (0.0%) | 0 (0.0%) |
| 18 to 34 Years | 0 (0.0%) | 9 (14.5%) |
| 35 to 64 Years | 0 (0.0%) | 0 (0.0%) |
| 65 to 74 Years | 0 (0.0%) | 4 (3.5%) |
| 75 Years and over | 4 (10.3%) | 2 (4.4%) |
Disability Class: Cognitive Difficulty
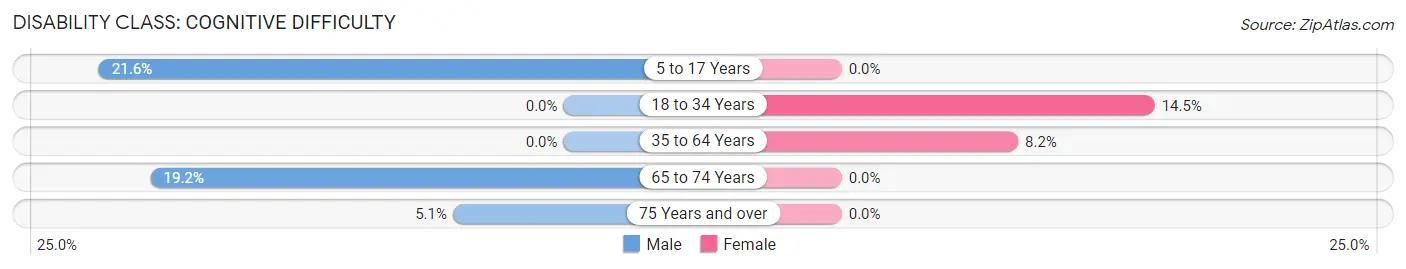
| Age Bracket | Male | Female |
| 5 to 17 Years | 25 (21.5%) | 0 (0.0%) |
| 18 to 34 Years | 0 (0.0%) | 9 (14.5%) |
| 35 to 64 Years | 0 (0.0%) | 13 (8.2%) |
| 65 to 74 Years | 9 (19.2%) | 0 (0.0%) |
| 75 Years and over | 2 (5.1%) | 0 (0.0%) |
Disability Class: Ambulatory Difficulty
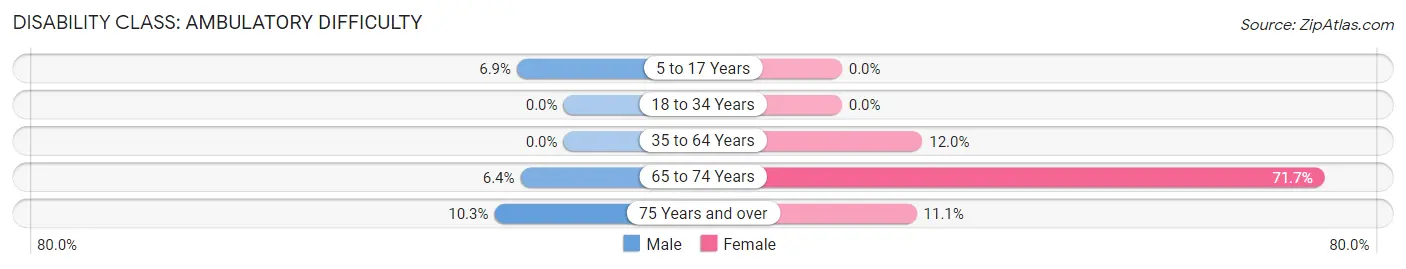
| Age Bracket | Male | Female |
| 5 to 17 Years | 8 (6.9%) | 0 (0.0%) |
| 18 to 34 Years | 0 (0.0%) | 0 (0.0%) |
| 35 to 64 Years | 0 (0.0%) | 19 (11.9%) |
| 65 to 74 Years | 3 (6.4%) | 81 (71.7%) |
| 75 Years and over | 4 (10.3%) | 5 (11.1%) |
Disability Class: Self-Care Difficulty
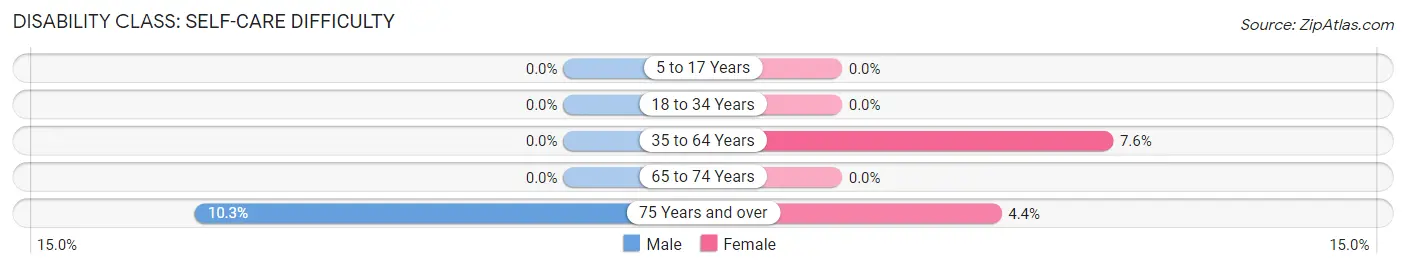
| Age Bracket | Male | Female |
| 5 to 17 Years | 0 (0.0%) | 0 (0.0%) |
| 18 to 34 Years | 0 (0.0%) | 0 (0.0%) |
| 35 to 64 Years | 0 (0.0%) | 12 (7.5%) |
| 65 to 74 Years | 0 (0.0%) | 0 (0.0%) |
| 75 Years and over | 4 (10.3%) | 2 (4.4%) |
Technology Access in Winfall
Computing Device Access in Winfall
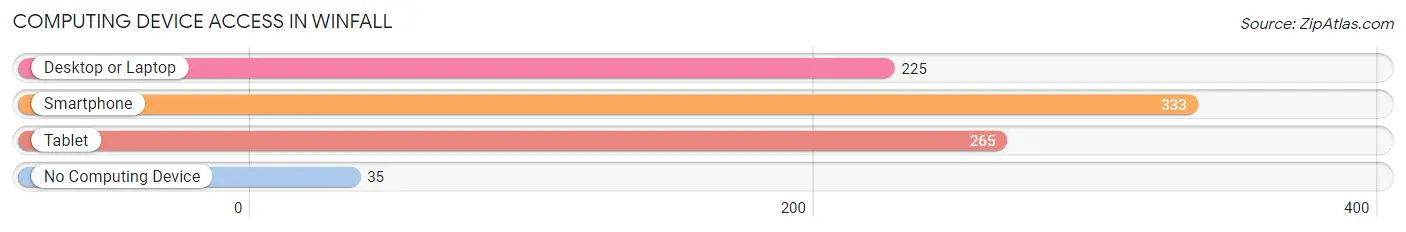
| Device Type | # Households | % Households |
| Desktop or Laptop | 225 | 60.2% |
| Smartphone | 333 | 89.0% |
| Tablet | 265 | 70.9% |
| No Computing Device | 35 | 9.4% |
| Total | 374 | 100.0% |
Internet Access in Winfall
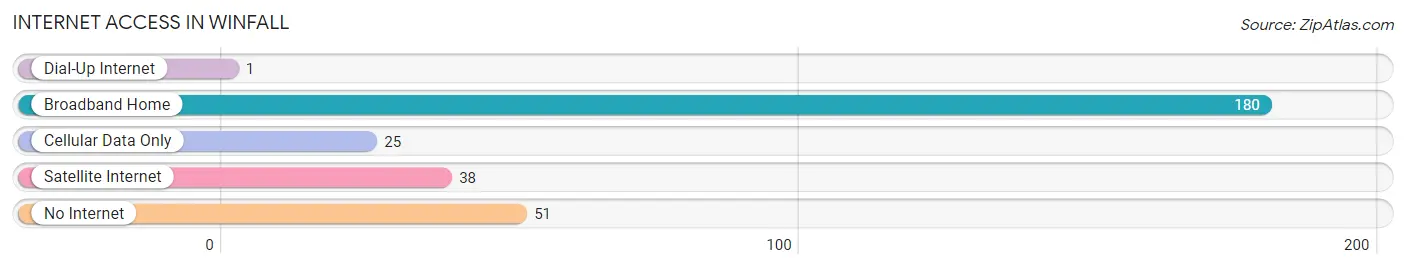
| Internet Type | # Households | % Households |
| Dial-Up Internet | 1 | 0.3% |
| Broadband Home | 180 | 48.1% |
| Cellular Data Only | 25 | 6.7% |
| Satellite Internet | 38 | 10.2% |
| No Internet | 51 | 13.6% |
| Total | 374 | 100.0% |
Winfall Summary
Winfall is a small town located in Perquimans County, North Carolina. It is situated on the banks of the Perquimans River, about 25 miles south of Elizabeth City. The town was founded in 1790 and has a population of approximately 500 people.
Geography
Winfall is located in the Coastal Plain region of North Carolina. The town is situated on the banks of the Perquimans River, which is a tributary of the Albemarle Sound. The town is surrounded by farmland and is located near the Great Dismal Swamp National Wildlife Refuge. The town is also close to the Outer Banks, which is a popular tourist destination.
The climate in Winfall is humid subtropical, with hot, humid summers and mild winters. The average annual temperature is around 70 degrees Fahrenheit. The average annual precipitation is around 45 inches.
Economy
The economy of Winfall is largely based on agriculture. The town is home to several farms, which produce a variety of crops, including corn, soybeans, wheat, and tobacco. The town also has a few small businesses, including a grocery store, a hardware store, and a few restaurants.
Demographics
As of the 2010 census, the population of Winfall was 498 people. The racial makeup of the town was 94.4% White, 3.2% African American, 0.2% Native American, 0.2% Asian, and 1.8% from other races. The median household income was $31,250, and the median family income was $37,500.
The town is served by the Perquimans County School District, which includes two elementary schools, a middle school, and a high school. The town also has a public library and a few churches.
Conclusion
Winfall is a small town located in Perquimans County, North Carolina. It is situated on the banks of the Perquimans River and is surrounded by farmland. The town has a population of approximately 500 people and is largely supported by agriculture. The town is served by the Perquimans County School District and has a public library and a few churches. The town is also close to the Outer Banks, which is a popular tourist destination.
Common Questions
What is Per Capita Income in Winfall?
Per Capita income in Winfall is $29,140.
What is the Median Family Income in Winfall?
Median Family Income in Winfall is $84,375.
What is the Median Household income in Winfall?
Median Household Income in Winfall is $59,732.
What is Family Income Deficit in Winfall?
Family Income Deficit in Winfall is $8,119.
Families that are below poverty line in Winfall earn $8,119 less on average than the poverty threshold level.
What is Inequality or Gini Index in Winfall?
Inequality or Gini Index in Winfall is 0.43.
What is the Total Population of Winfall?
Total Population of Winfall is 900.
What is the Total Male Population of Winfall?
Total Male Population of Winfall is 406.
What is the Total Female Population of Winfall?
Total Female Population of Winfall is 494.
What is the Ratio of Males per 100 Females in Winfall?
There are 82.19 Males per 100 Females in Winfall.
What is the Ratio of Females per 100 Males in Winfall?
There are 121.67 Females per 100 Males in Winfall.
What is the Median Population Age in Winfall?
Median Population Age in Winfall is 39.7 Years.
What is the Average Family Size in Winfall
Average Family Size in Winfall is 2.5 People.
What is the Average Household Size in Winfall
Average Household Size in Winfall is 2.4 People.
How Large is the Labor Force in Winfall?
There are 361 People in the Labor Forcein in Winfall.
What is the Percentage of People in the Labor Force in Winfall?
53.2% of People are in the Labor Force in Winfall.
What is the Unemployment Rate in Winfall?
Unemployment Rate in Winfall is 14.1%.