Wilkesboro, NC Map & Demographics
Wilkesboro Map
Wilkesboro Overview
$28,240
PER CAPITA INCOME
$67,585
AVG FAMILY INCOME
$43,480
AVG HOUSEHOLD INCOME
7.1%
WAGE / INCOME GAP [ % ]
92.9¢/ $1
WAGE / INCOME GAP [ $ ]
0.48
INEQUALITY / GINI INDEX
3,674
TOTAL POPULATION
1,680
MALE POPULATION
1,994
FEMALE POPULATION
84.25
MALES / 100 FEMALES
118.69
FEMALES / 100 MALES
40.0
MEDIAN AGE
3.0
AVG FAMILY SIZE
2.3
AVG HOUSEHOLD SIZE
1,635
LABOR FORCE [ PEOPLE ]
54.4%
PERCENT IN LABOR FORCE
4.8%
UNEMPLOYMENT RATE
Wilkesboro Zip Codes
Wilkesboro Area Codes
Income in Wilkesboro
Income Overview in Wilkesboro
Per Capita Income in Wilkesboro is $28,240, while median incomes of families and households are $67,585 and $43,480 respectively.
| Characteristic | Number | Measure |
| Per Capita Income | 3,674 | $28,240 |
| Median Family Income | 895 | $67,585 |
| Mean Family Income | 895 | $84,765 |
| Median Household Income | 1,452 | $43,480 |
| Mean Household Income | 1,452 | $67,070 |
| Income Deficit | 895 | $0 |
| Wage / Income Gap (%) | 3,674 | 7.09% |
| Wage / Income Gap ($) | 3,674 | 92.91¢ per $1 |
| Gini / Inequality Index | 3,674 | 0.48 |
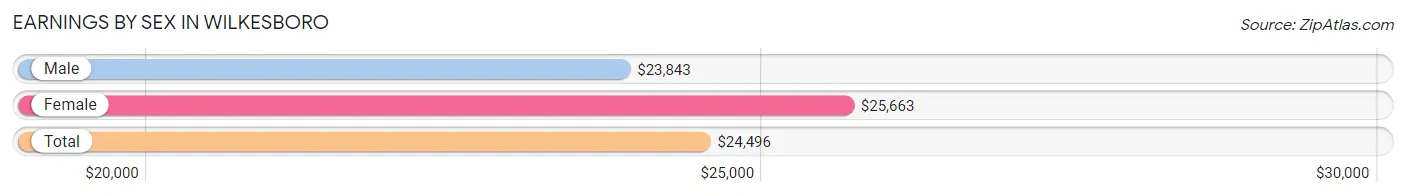
Earnings by Sex in Wilkesboro
Average Earnings in Wilkesboro are $24,496, $23,843 for men and $25,663 for women, a difference of 7.1%.
| Sex | Number | Average Earnings |
| Male | 898 (51.5%) | $23,843 |
| Female | 845 (48.5%) | $25,663 |
| Total | 1,743 (100.0%) | $24,496 |
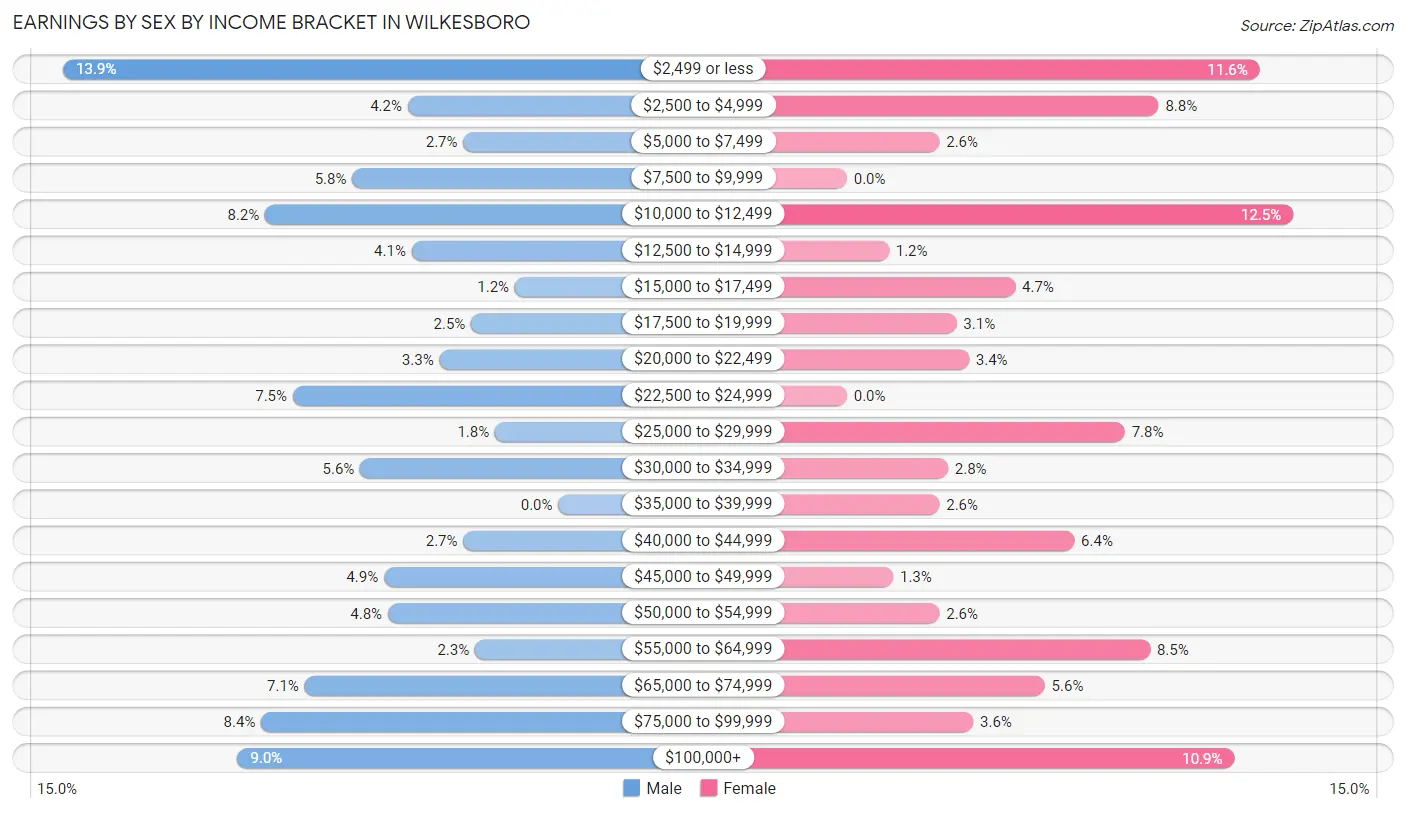
Earnings by Sex by Income Bracket in Wilkesboro
The most common earnings brackets in Wilkesboro are $2,499 or less for men (125 | 13.9%) and $10,000 to $12,499 for women (106 | 12.5%).
| Income | Male | Female |
| $2,499 or less | 125 (13.9%) | 98 (11.6%) |
| $2,500 to $4,999 | 38 (4.2%) | 74 (8.8%) |
| $5,000 to $7,499 | 24 (2.7%) | 22 (2.6%) |
| $7,500 to $9,999 | 52 (5.8%) | 0 (0.0%) |
| $10,000 to $12,499 | 74 (8.2%) | 106 (12.5%) |
| $12,500 to $14,999 | 37 (4.1%) | 10 (1.2%) |
| $15,000 to $17,499 | 11 (1.2%) | 40 (4.7%) |
| $17,500 to $19,999 | 22 (2.5%) | 26 (3.1%) |
| $20,000 to $22,499 | 30 (3.3%) | 29 (3.4%) |
| $22,500 to $24,999 | 67 (7.5%) | 0 (0.0%) |
| $25,000 to $29,999 | 16 (1.8%) | 66 (7.8%) |
| $30,000 to $34,999 | 50 (5.6%) | 24 (2.8%) |
| $35,000 to $39,999 | 0 (0.0%) | 22 (2.6%) |
| $40,000 to $44,999 | 24 (2.7%) | 54 (6.4%) |
| $45,000 to $49,999 | 44 (4.9%) | 11 (1.3%) |
| $50,000 to $54,999 | 43 (4.8%) | 22 (2.6%) |
| $55,000 to $64,999 | 21 (2.3%) | 72 (8.5%) |
| $65,000 to $74,999 | 64 (7.1%) | 47 (5.6%) |
| $75,000 to $99,999 | 75 (8.4%) | 30 (3.5%) |
| $100,000+ | 81 (9.0%) | 92 (10.9%) |
| Total | 898 (100.0%) | 845 (100.0%) |
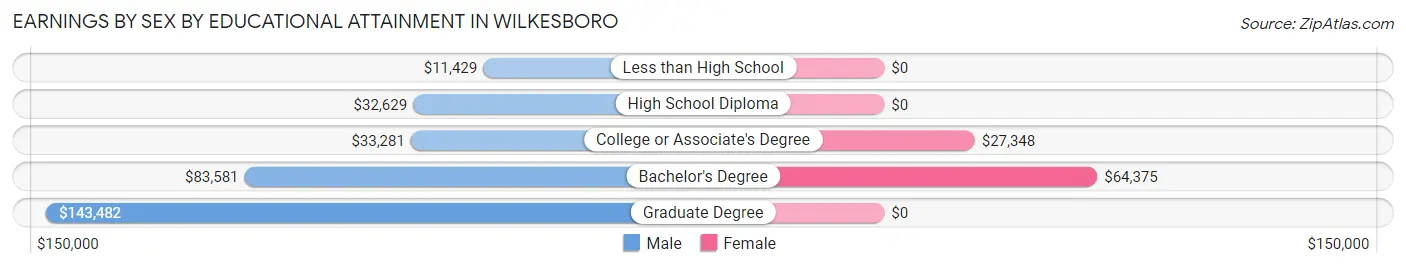
Earnings by Sex by Educational Attainment in Wilkesboro
Average earnings in Wilkesboro are $34,111 for men and $42,801 for women, a difference of 20.3%. Men with an educational attainment of graduate degree enjoy the highest average annual earnings of $143,482, while those with less than high school education earn the least with $11,429. Women with an educational attainment of bachelor's degree earn the most with the average annual earnings of $64,375, while those with college or associate's degree education have the smallest earnings of $27,348.
| Educational Attainment | Male Income | Female Income |
| Less than High School | $11,429 | $0 |
| High School Diploma | $32,629 | $0 |
| College or Associate's Degree | $33,281 | $27,348 |
| Bachelor's Degree | $83,581 | $64,375 |
| Graduate Degree | $143,482 | $0 |
| Total | $34,111 | $42,801 |
Family Income in Wilkesboro
Family Income Brackets in Wilkesboro
According to the Wilkesboro family income data, there are 196 families falling into the $100,000 to $149,999 income range, which is the most common income bracket and makes up 21.9% of all families. Conversely, the $15,000 to $24,999 income bracket is the least frequent group with only 8 families (0.9%) belonging to this category.
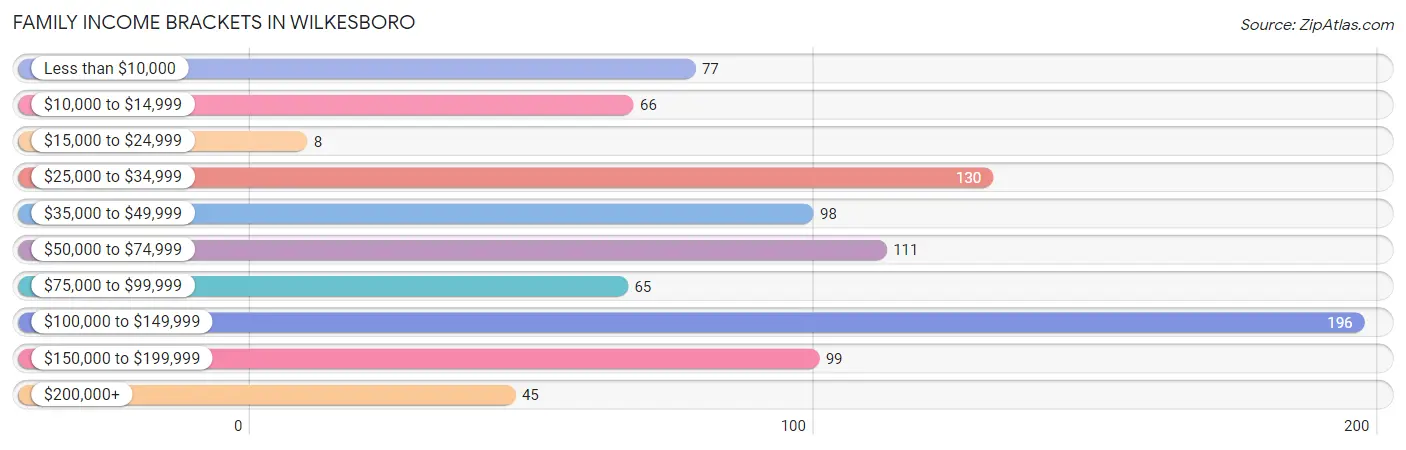
| Income Bracket | # Families | % Families |
| Less than $10,000 | 77 | 8.6% |
| $10,000 to $14,999 | 66 | 7.4% |
| $15,000 to $24,999 | 8 | 0.9% |
| $25,000 to $34,999 | 130 | 14.5% |
| $35,000 to $49,999 | 98 | 10.9% |
| $50,000 to $74,999 | 111 | 12.4% |
| $75,000 to $99,999 | 65 | 7.3% |
| $100,000 to $149,999 | 196 | 21.9% |
| $150,000 to $199,999 | 99 | 11.1% |
| $200,000+ | 45 | 5.0% |
Family Income by Famaliy Size in Wilkesboro
4-person families (127 | 14.2%) account for the highest median family income in Wilkesboro with $119,201 per family, while 2-person families (428 | 47.8%) have the highest median income of $33,807 per family member.
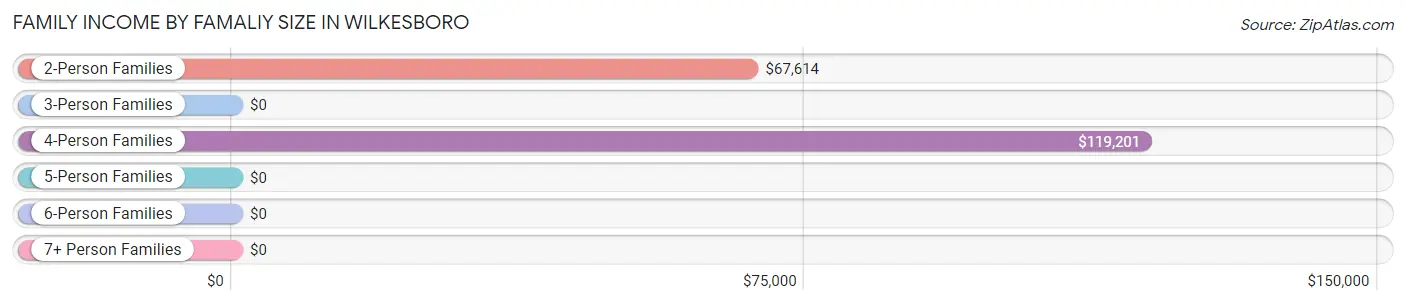
| Income Bracket | # Families | Median Income |
| 2-Person Families | 428 (47.8%) | $67,614 |
| 3-Person Families | 279 (31.2%) | $0 |
| 4-Person Families | 127 (14.2%) | $119,201 |
| 5-Person Families | 22 (2.5%) | $0 |
| 6-Person Families | 38 (4.3%) | $0 |
| 7+ Person Families | 1 (0.1%) | $0 |
| Total | 895 (100.0%) | $67,585 |
Family Income by Number of Earners in Wilkesboro
The median family income in Wilkesboro is $67,585, with families comprising 3+ earners (136) having the highest median family income of $118,450, while families with 1 earner (356) have the lowest median family income of $31,786, accounting for 15.2% and 39.8% of families, respectively.
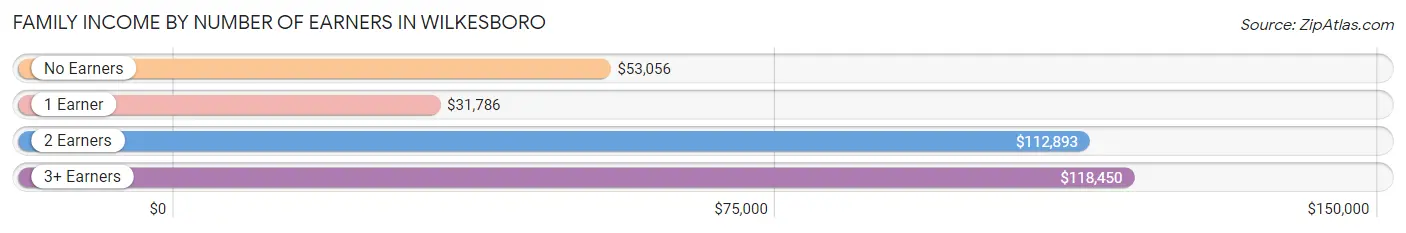
| Number of Earners | # Families | Median Income |
| No Earners | 116 (13.0%) | $53,056 |
| 1 Earner | 356 (39.8%) | $31,786 |
| 2 Earners | 287 (32.1%) | $112,893 |
| 3+ Earners | 136 (15.2%) | $118,450 |
| Total | 895 (100.0%) | $67,585 |
Household Income in Wilkesboro
Household Income Brackets in Wilkesboro
With 254 households falling in the category, the $35,000 to $49,999 income range is the most frequent in Wilkesboro, accounting for 17.5% of all households. In contrast, only 45 households (3.1%) fall into the $200,000+ income bracket, making it the least populous group.
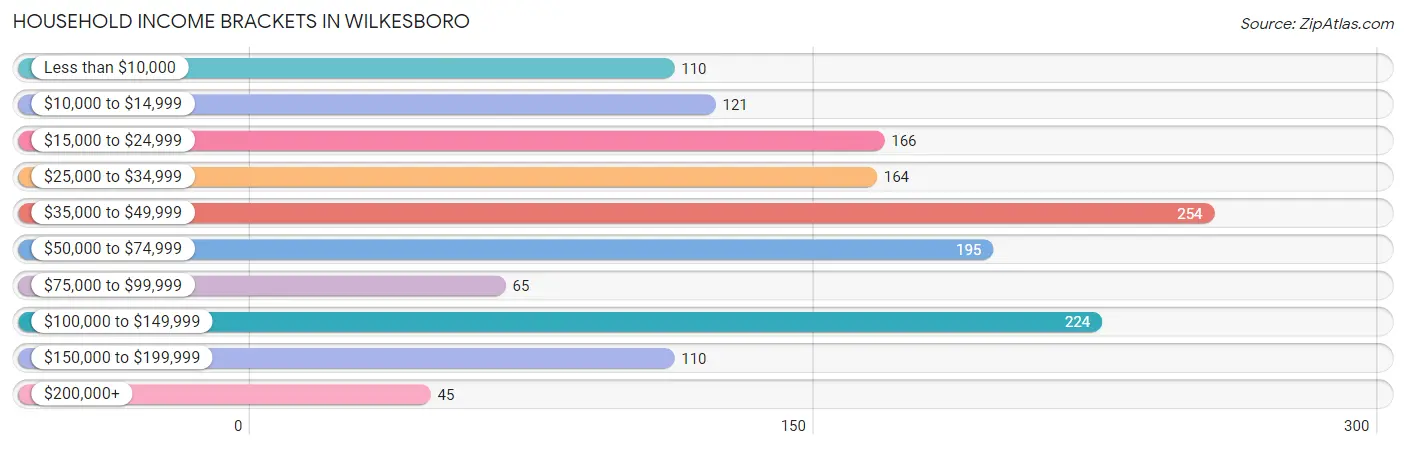
| Income Bracket | # Households | % Households |
| Less than $10,000 | 110 | 7.6% |
| $10,000 to $14,999 | 121 | 8.3% |
| $15,000 to $24,999 | 166 | 11.4% |
| $25,000 to $34,999 | 164 | 11.3% |
| $35,000 to $49,999 | 254 | 17.5% |
| $50,000 to $74,999 | 195 | 13.4% |
| $75,000 to $99,999 | 65 | 4.5% |
| $100,000 to $149,999 | 224 | 15.4% |
| $150,000 to $199,999 | 110 | 7.6% |
| $200,000+ | 45 | 3.1% |
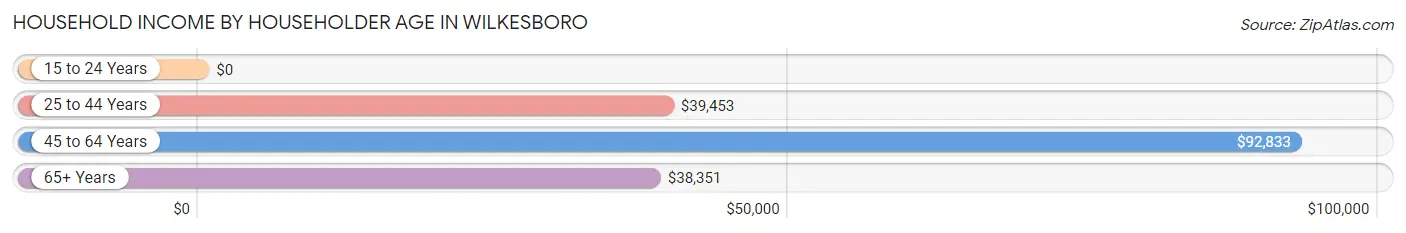
Household Income by Householder Age in Wilkesboro
The median household income in Wilkesboro is $43,480, with the highest median household income of $92,833 found in the 45 to 64 years age bracket for the primary householder. A total of 412 households (28.4%) fall into this category. Meanwhile, the 15 to 24 years age bracket for the primary householder has the lowest median household income of $0, with 120 households (8.3%) in this group.
| Income Bracket | # Households | Median Income |
| 15 to 24 Years | 120 (8.3%) | $0 |
| 25 to 44 Years | 395 (27.2%) | $39,453 |
| 45 to 64 Years | 412 (28.4%) | $92,833 |
| 65+ Years | 525 (36.2%) | $38,351 |
| Total | 1,452 (100.0%) | $43,480 |
Poverty in Wilkesboro
Income Below Poverty by Sex and Age in Wilkesboro
With 19.4% poverty level for males and 24.7% for females among the residents of Wilkesboro, 15 year old males and 6 to 11 year old females are the most vulnerable to poverty, with 38 males (100.0%) and 98 females (62.0%) in their respective age groups living below the poverty level.
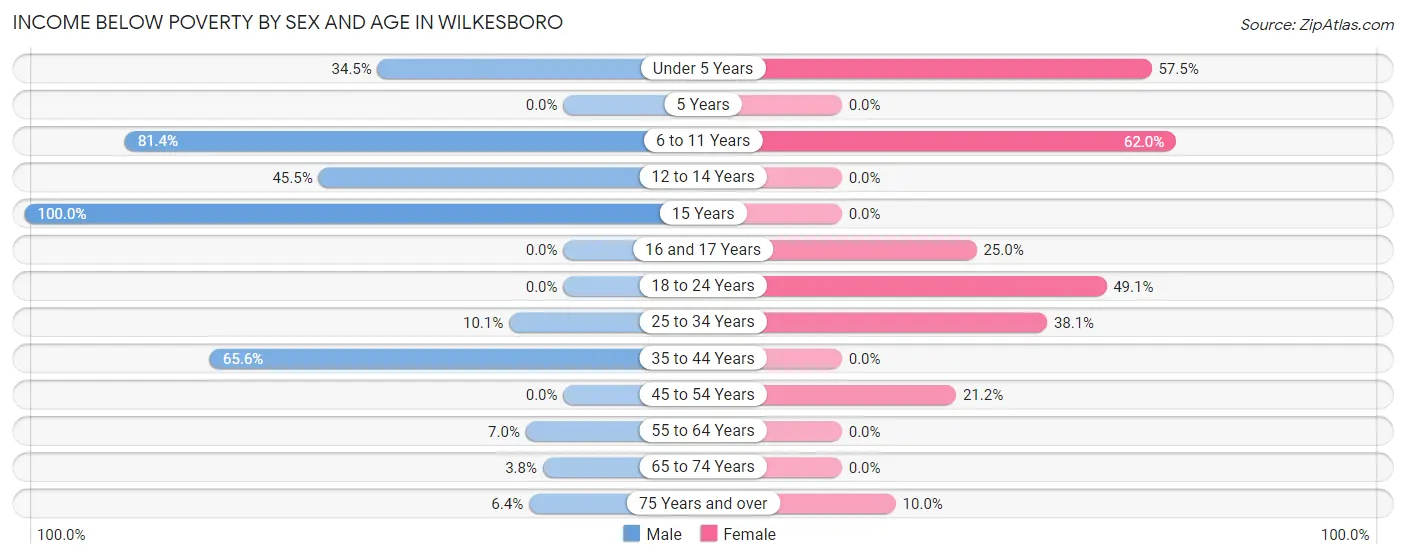
| Age Bracket | Male | Female |
| Under 5 Years | 40 (34.5%) | 73 (57.5%) |
| 5 Years | 0 (0.0%) | 0 (0.0%) |
| 6 to 11 Years | 35 (81.4%) | 98 (62.0%) |
| 12 to 14 Years | 50 (45.5%) | 0 (0.0%) |
| 15 Years | 38 (100.0%) | 0 (0.0%) |
| 16 and 17 Years | 0 (0.0%) | 23 (25.0%) |
| 18 to 24 Years | 0 (0.0%) | 80 (49.1%) |
| 25 to 34 Years | 24 (10.1%) | 107 (38.1%) |
| 35 to 44 Years | 82 (65.6%) | 0 (0.0%) |
| 45 to 54 Years | 0 (0.0%) | 39 (21.2%) |
| 55 to 64 Years | 22 (7.0%) | 0 (0.0%) |
| 65 to 74 Years | 4 (3.8%) | 0 (0.0%) |
| 75 Years and over | 9 (6.4%) | 25 (10.0%) |
| Total | 304 (19.4%) | 445 (24.7%) |
Income Above Poverty by Sex and Age in Wilkesboro
According to the poverty statistics in Wilkesboro, males aged 16 and 17 years and females aged 5 years are the age groups that are most secure financially, with 100.0% of males and 100.0% of females in these age groups living above the poverty line.
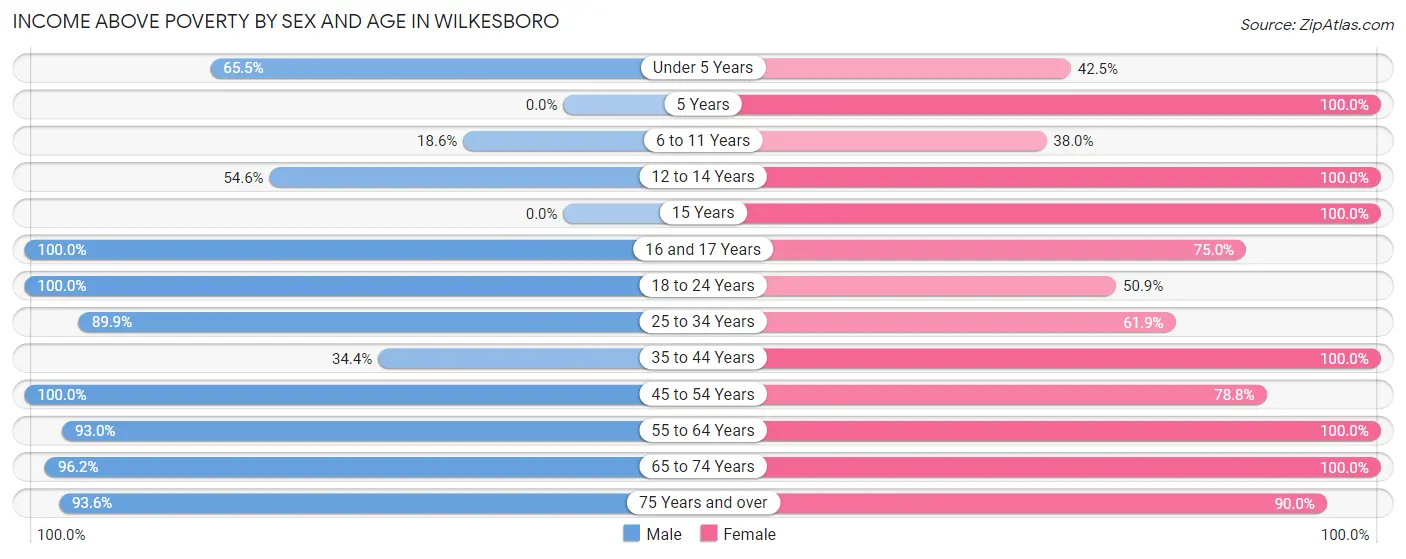
| Age Bracket | Male | Female |
| Under 5 Years | 76 (65.5%) | 54 (42.5%) |
| 5 Years | 0 (0.0%) | 10 (100.0%) |
| 6 to 11 Years | 8 (18.6%) | 60 (38.0%) |
| 12 to 14 Years | 60 (54.5%) | 20 (100.0%) |
| 15 Years | 0 (0.0%) | 43 (100.0%) |
| 16 and 17 Years | 69 (100.0%) | 69 (75.0%) |
| 18 to 24 Years | 200 (100.0%) | 83 (50.9%) |
| 25 to 34 Years | 214 (89.9%) | 174 (61.9%) |
| 35 to 44 Years | 43 (34.4%) | 85 (100.0%) |
| 45 to 54 Years | 68 (100.0%) | 145 (78.8%) |
| 55 to 64 Years | 293 (93.0%) | 176 (100.0%) |
| 65 to 74 Years | 101 (96.2%) | 212 (100.0%) |
| 75 Years and over | 132 (93.6%) | 225 (90.0%) |
| Total | 1,264 (80.6%) | 1,356 (75.3%) |
Income Below Poverty Among Married-Couple Families in Wilkesboro
The poverty statistics for married-couple families in Wilkesboro show that 6.1% or 31 of the total 507 families live below the poverty line. Families with 3 or 4 children have the highest poverty rate of 95.7%, comprising of 22 families. On the other hand, families with 1 or 2 children have the lowest poverty rate of 0.0%, which includes 0 families.
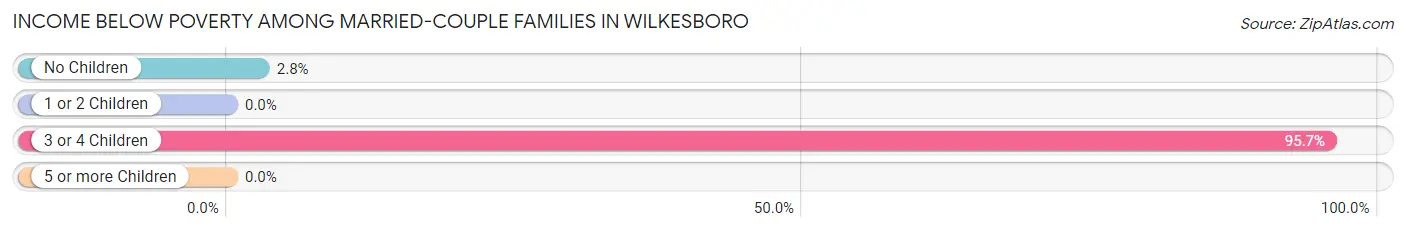
| Children | Above Poverty | Below Poverty |
| No Children | 316 (97.2%) | 9 (2.8%) |
| 1 or 2 Children | 159 (100.0%) | 0 (0.0%) |
| 3 or 4 Children | 1 (4.3%) | 22 (95.7%) |
| 5 or more Children | 0 (0.0%) | 0 (0.0%) |
| Total | 476 (93.9%) | 31 (6.1%) |
Income Below Poverty Among Single-Parent Households in Wilkesboro
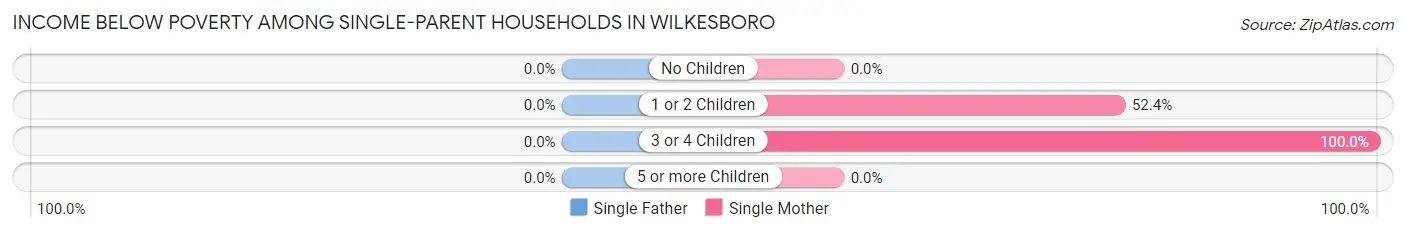
| Children | Single Father | Single Mother |
| No Children | 0 (0.0%) | 0 (0.0%) |
| 1 or 2 Children | 0 (0.0%) | 120 (52.4%) |
| 3 or 4 Children | 0 (0.0%) | 13 (100.0%) |
| 5 or more Children | 0 (0.0%) | 0 (0.0%) |
| Total | 0 (0.0%) | 133 (44.6%) |
Income Below Poverty Among Married-Couple vs Single-Parent Households in Wilkesboro
The poverty data for Wilkesboro shows that 31 of the married-couple family households (6.1%) and 133 of the single-parent households (34.3%) are living below the poverty level. Within the married-couple family households, those with 3 or 4 children have the highest poverty rate, with 22 households (95.7%) falling below the poverty line. Among the single-parent households, those with 3 or 4 children have the highest poverty rate, with 13 household (100.0%) living below poverty.
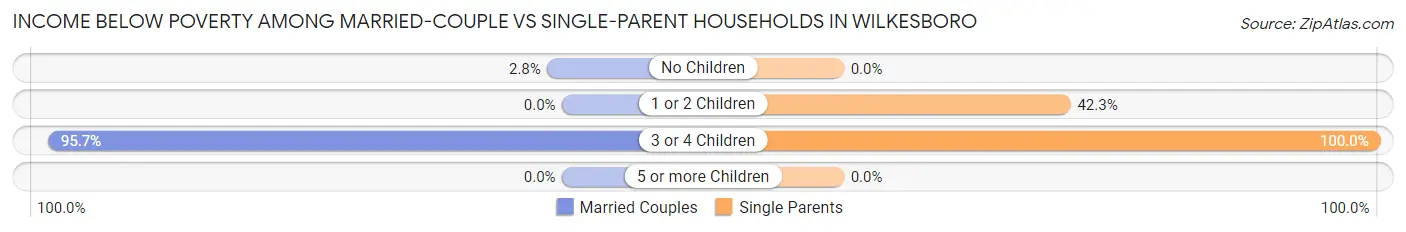
| Children | Married-Couple Families | Single-Parent Households |
| No Children | 9 (2.8%) | 0 (0.0%) |
| 1 or 2 Children | 0 (0.0%) | 120 (42.2%) |
| 3 or 4 Children | 22 (95.7%) | 13 (100.0%) |
| 5 or more Children | 0 (0.0%) | 0 (0.0%) |
| Total | 31 (6.1%) | 133 (34.3%) |
Race in Wilkesboro
The most populous races in Wilkesboro are White / Caucasian (3,134 | 85.3%), Hispanic or Latino (303 | 8.3%), and Black / African American (286 | 7.8%).
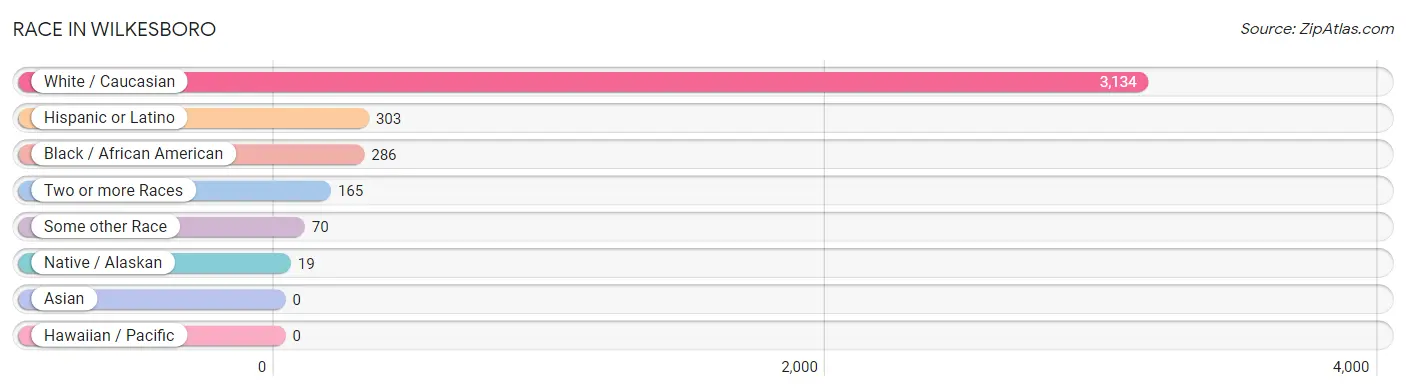
| Race | # Population | % Population |
| Asian | 0 | 0.0% |
| Black / African American | 286 | 7.8% |
| Hawaiian / Pacific | 0 | 0.0% |
| Hispanic or Latino | 303 | 8.3% |
| Native / Alaskan | 19 | 0.5% |
| White / Caucasian | 3,134 | 85.3% |
| Two or more Races | 165 | 4.5% |
| Some other Race | 70 | 1.9% |
| Total | 3,674 | 100.0% |
Ancestry in Wilkesboro
The most populous ancestries reported in Wilkesboro are American (1,672 | 45.5%), English (325 | 8.8%), Irish (216 | 5.9%), German (178 | 4.8%), and Mexican (173 | 4.7%), together accounting for 69.8% of all Wilkesboro residents.
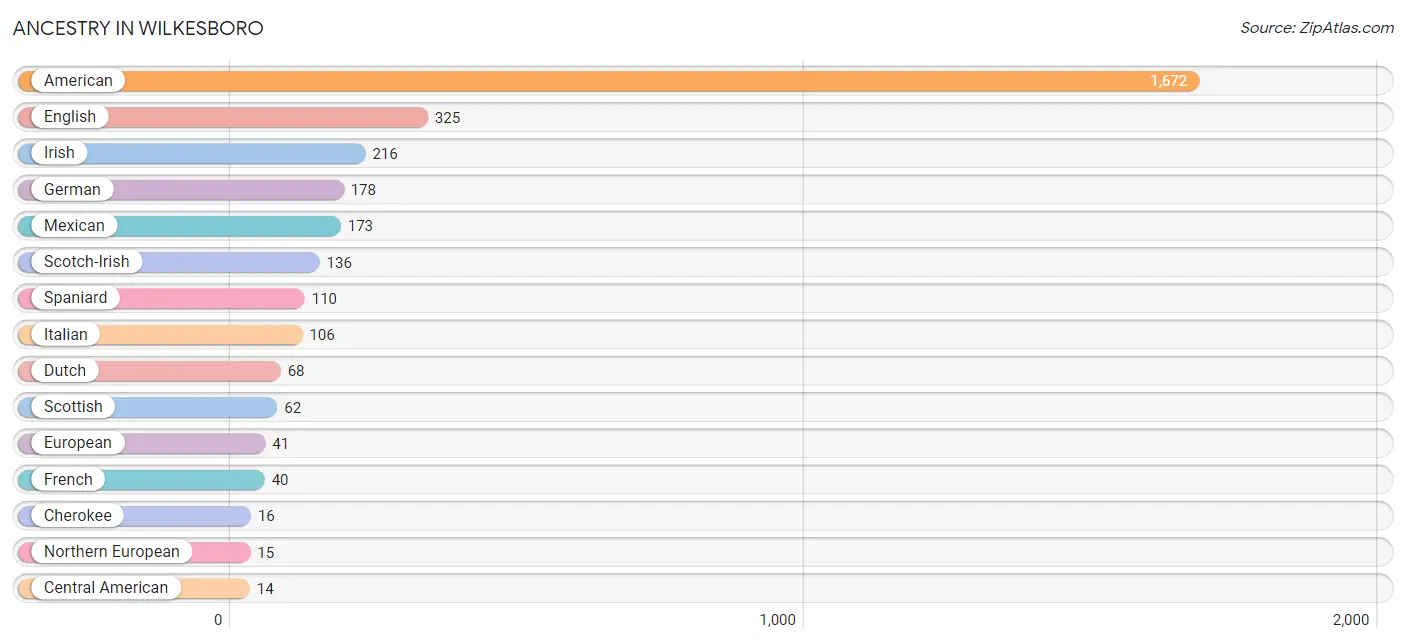
| Ancestry | # Population | % Population |
| American | 1,672 | 45.5% |
| Central American | 14 | 0.4% |
| Central American Indian | 8 | 0.2% |
| Cherokee | 16 | 0.4% |
| Dutch | 68 | 1.8% |
| English | 325 | 8.8% |
| European | 41 | 1.1% |
| French | 40 | 1.1% |
| German | 178 | 4.8% |
| Honduran | 14 | 0.4% |
| Irish | 216 | 5.9% |
| Italian | 106 | 2.9% |
| Lumbee | 3 | 0.1% |
| Mexican | 173 | 4.7% |
| Northern European | 15 | 0.4% |
| Polish | 14 | 0.4% |
| Scotch-Irish | 136 | 3.7% |
| Scottish | 62 | 1.7% |
| Spaniard | 110 | 3.0% |
| Swedish | 7 | 0.2% |
| Turkish | 11 | 0.3% |
| Yugoslavian | 14 | 0.4% | View All 22 Rows |
Immigrants in Wilkesboro
The most numerous immigrant groups reported in Wilkesboro came from Central America (42 | 1.1%), Latin America (42 | 1.1%), Europe (32 | 0.9%), Honduras (22 | 0.6%), and Northern Europe (18 | 0.5%), together accounting for 4.2% of all Wilkesboro residents.
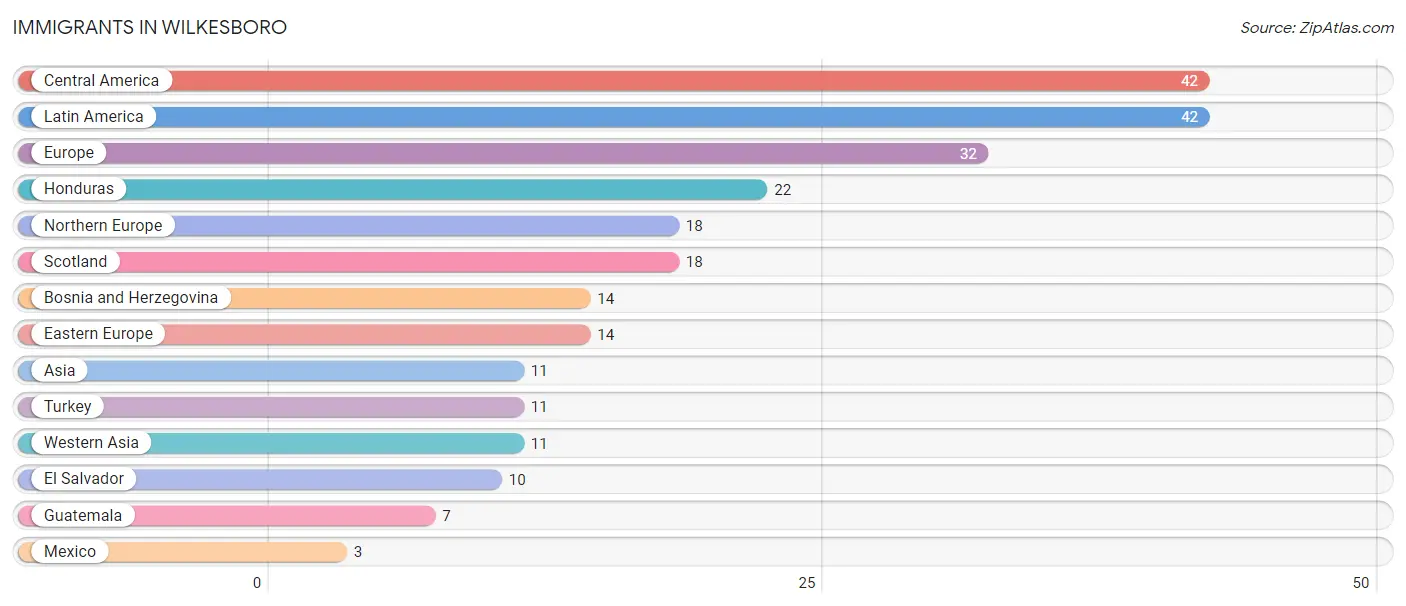
| Immigration Origin | # Population | % Population |
| Asia | 11 | 0.3% |
| Bosnia and Herzegovina | 14 | 0.4% |
| Central America | 42 | 1.1% |
| Eastern Europe | 14 | 0.4% |
| El Salvador | 10 | 0.3% |
| Europe | 32 | 0.9% |
| Guatemala | 7 | 0.2% |
| Honduras | 22 | 0.6% |
| Latin America | 42 | 1.1% |
| Mexico | 3 | 0.1% |
| Northern Europe | 18 | 0.5% |
| Scotland | 18 | 0.5% |
| Turkey | 11 | 0.3% |
| Western Asia | 11 | 0.3% | View All 14 Rows |
Sex and Age in Wilkesboro
Sex and Age in Wilkesboro
The most populous age groups in Wilkesboro are 55 to 59 Years (223 | 13.3%) for men and 85 Years and over (259 | 13.0%) for women.
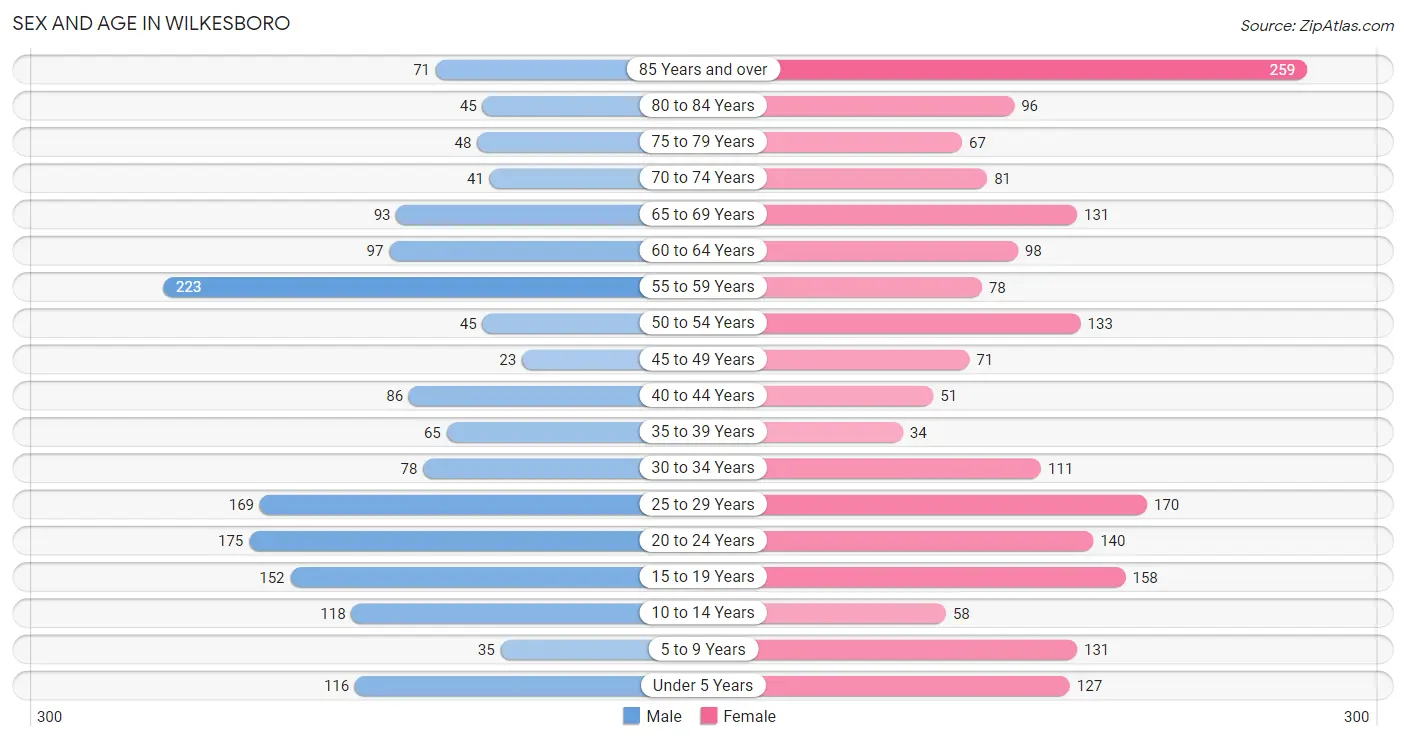
| Age Bracket | Male | Female |
| Under 5 Years | 116 (6.9%) | 127 (6.4%) |
| 5 to 9 Years | 35 (2.1%) | 131 (6.6%) |
| 10 to 14 Years | 118 (7.0%) | 58 (2.9%) |
| 15 to 19 Years | 152 (9.0%) | 158 (7.9%) |
| 20 to 24 Years | 175 (10.4%) | 140 (7.0%) |
| 25 to 29 Years | 169 (10.1%) | 170 (8.5%) |
| 30 to 34 Years | 78 (4.6%) | 111 (5.6%) |
| 35 to 39 Years | 65 (3.9%) | 34 (1.7%) |
| 40 to 44 Years | 86 (5.1%) | 51 (2.6%) |
| 45 to 49 Years | 23 (1.4%) | 71 (3.6%) |
| 50 to 54 Years | 45 (2.7%) | 133 (6.7%) |
| 55 to 59 Years | 223 (13.3%) | 78 (3.9%) |
| 60 to 64 Years | 97 (5.8%) | 98 (4.9%) |
| 65 to 69 Years | 93 (5.5%) | 131 (6.6%) |
| 70 to 74 Years | 41 (2.4%) | 81 (4.1%) |
| 75 to 79 Years | 48 (2.9%) | 67 (3.4%) |
| 80 to 84 Years | 45 (2.7%) | 96 (4.8%) |
| 85 Years and over | 71 (4.2%) | 259 (13.0%) |
| Total | 1,680 (100.0%) | 1,994 (100.0%) |
Families and Households in Wilkesboro
Median Family Size in Wilkesboro
The median family size in Wilkesboro is 3.00 persons per family, with married-couple families (507 | 56.7%) accounting for the largest median family size of 3.06 persons per family. On the other hand, single female/mother families (298 | 33.3%) represent the smallest median family size with 2.90 persons per family.
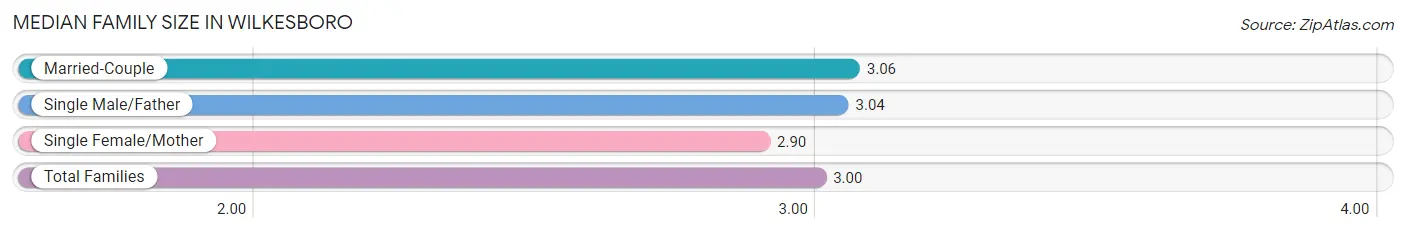
| Family Type | # Families | Family Size |
| Married-Couple | 507 (56.7%) | 3.06 |
| Single Male/Father | 90 (10.1%) | 3.04 |
| Single Female/Mother | 298 (33.3%) | 2.90 |
| Total Families | 895 (100.0%) | 3.00 |
Median Household Size in Wilkesboro
The median household size in Wilkesboro is 2.29 persons per household, with single male/father households (90 | 6.2%) accounting for the largest median household size of 3.48 persons per household. non-family households (557 | 38.4%) represent the smallest median household size with 1.06 persons per household.
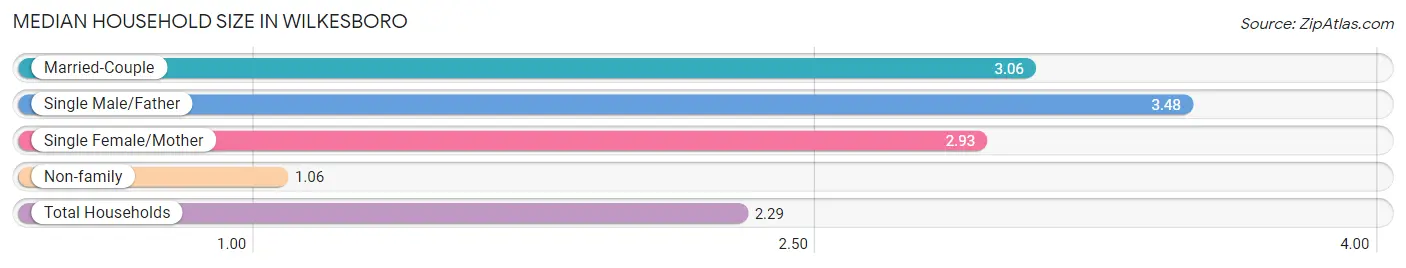
| Household Type | # Households | Household Size |
| Married-Couple | 507 (34.9%) | 3.06 |
| Single Male/Father | 90 (6.2%) | 3.48 |
| Single Female/Mother | 298 (20.5%) | 2.93 |
| Non-family | 557 (38.4%) | 1.06 |
| Total Households | 1,452 (100.0%) | 2.29 |
Household Size by Marriage Status in Wilkesboro
Out of a total of 1,452 households in Wilkesboro, 895 (61.6%) are family households, while 557 (38.4%) are nonfamily households. The most numerous type of family households are 2-person households, comprising 403, and the most common type of nonfamily households are 1-person households, comprising 530.
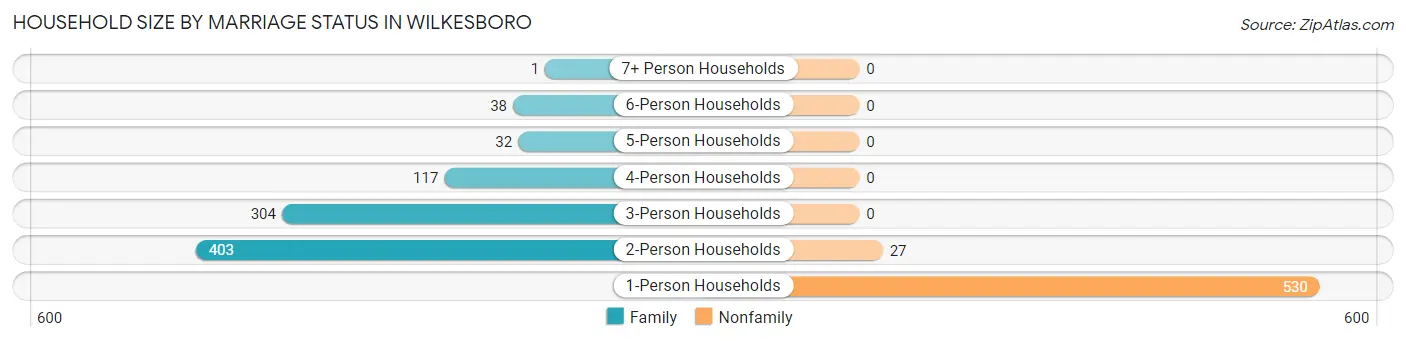
| Household Size | Family Households | Nonfamily Households |
| 1-Person Households | - | 530 (36.5%) |
| 2-Person Households | 403 (27.8%) | 27 (1.9%) |
| 3-Person Households | 304 (20.9%) | 0 (0.0%) |
| 4-Person Households | 117 (8.1%) | 0 (0.0%) |
| 5-Person Households | 32 (2.2%) | 0 (0.0%) |
| 6-Person Households | 38 (2.6%) | 0 (0.0%) |
| 7+ Person Households | 1 (0.1%) | 0 (0.0%) |
| Total | 895 (61.6%) | 557 (38.4%) |
Female Fertility in Wilkesboro
Fertility by Age in Wilkesboro
Average fertility rate in Wilkesboro is 100.0 births per 1,000 women. Women in the age bracket of 20 to 34 years have the highest fertility rate with 185.0 births per 1,000 women. Women in the age bracket of 20 to 34 years acount for 100.0% of all women with births.
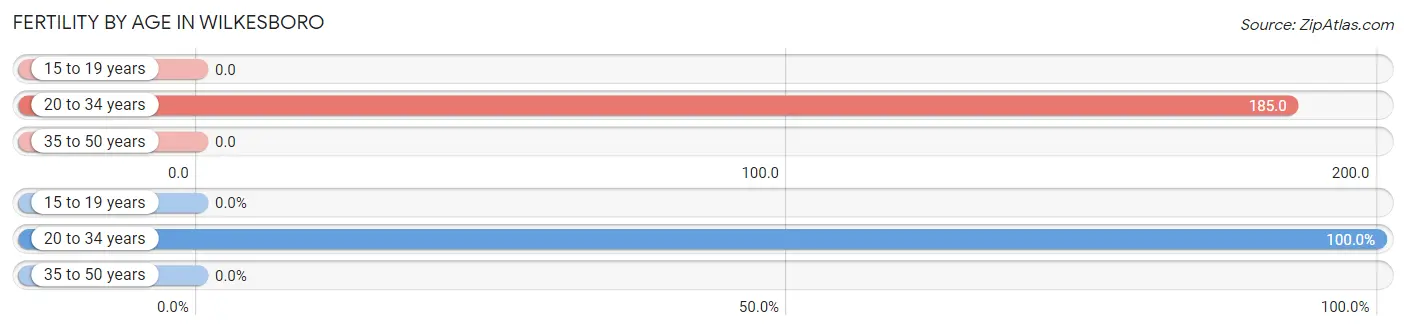
| Age Bracket | Women with Births | Births / 1,000 Women |
| 15 to 19 years | 0 (0.0%) | 0.0 |
| 20 to 34 years | 78 (100.0%) | 185.0 |
| 35 to 50 years | 0 (0.0%) | 0.0 |
| Total | 78 (100.0%) | 100.0 |
Fertility by Age by Marriage Status in Wilkesboro
67.9% of women with births (78) in Wilkesboro are married. The highest percentage of unmarried women with births falls into 20 to 34 years age bracket with 32.1% of them unmarried at the time of birth, while the lowest percentage of unmarried women with births belong to 20 to 34 years age bracket with 32.1% of them unmarried.
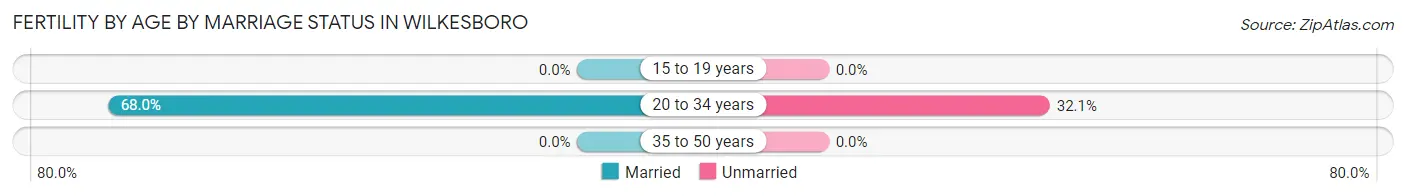
| Age Bracket | Married | Unmarried |
| 15 to 19 years | 0 (0.0%) | 0 (0.0%) |
| 20 to 34 years | 53 (67.9%) | 25 (32.1%) |
| 35 to 50 years | 0 (0.0%) | 0 (0.0%) |
| Total | 53 (67.9%) | 25 (32.1%) |
Fertility by Education in Wilkesboro
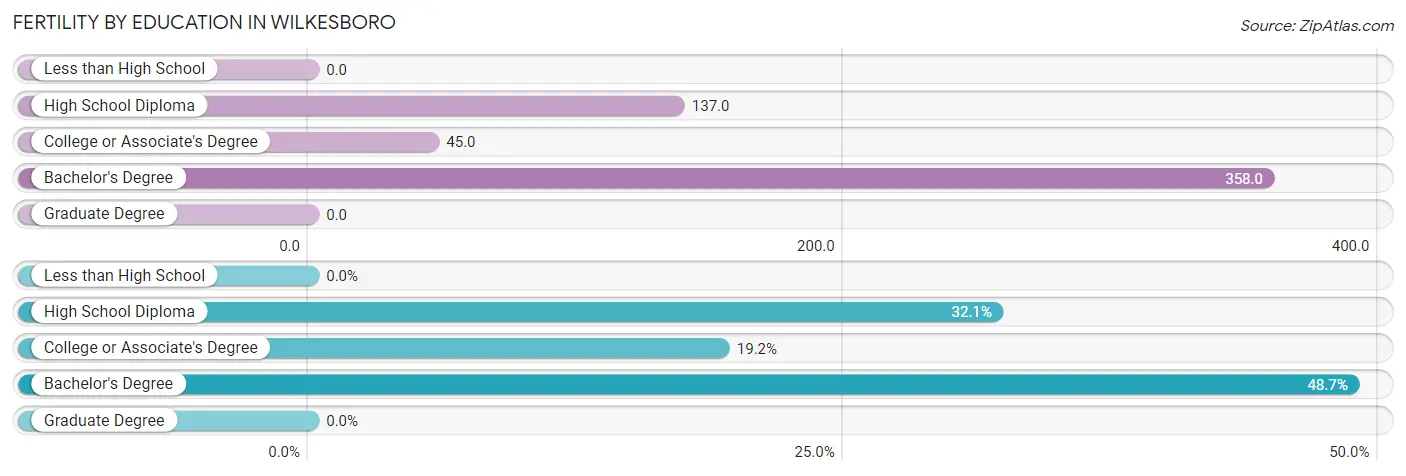
| Educational Attainment | Women with Births | Births / 1,000 Women |
| Less than High School | 0 (0.0%) | 0.0 |
| High School Diploma | 25 (32.1%) | 137.0 |
| College or Associate's Degree | 15 (19.2%) | 45.0 |
| Bachelor's Degree | 38 (48.7%) | 358.0 |
| Graduate Degree | 0 (0.0%) | 0.0 |
| Total | 78 (100.0%) | 100.0 |
Fertility by Education by Marriage Status in Wilkesboro
32.1% of women with births in Wilkesboro are unmarried. Women with the educational attainment of college or associate's degree are most likely to be married with 100.0% of them married at childbirth, while women with the educational attainment of high school diploma are least likely to be married with 100.0% of them unmarried at childbirth.
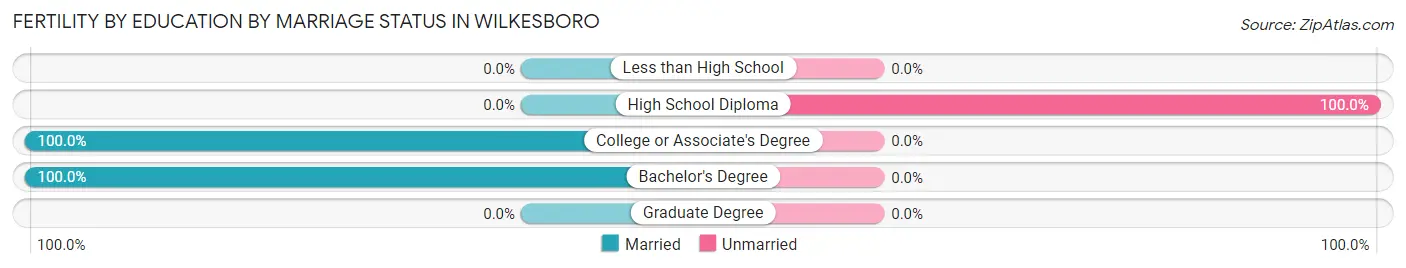
| Educational Attainment | Married | Unmarried |
| Less than High School | 0 (0.0%) | 0 (0.0%) |
| High School Diploma | 0 (0.0%) | 25 (100.0%) |
| College or Associate's Degree | 15 (100.0%) | 0 (0.0%) |
| Bachelor's Degree | 38 (100.0%) | 0 (0.0%) |
| Graduate Degree | 0 (0.0%) | 0 (0.0%) |
| Total | 53 (67.9%) | 25 (32.1%) |
Employment Characteristics in Wilkesboro
Employment by Class of Employer in Wilkesboro
Among the 1,532 employed individuals in Wilkesboro, private company employees (1,124 | 73.4%), self-employed (not incorporated) (135 | 8.8%), and not-for-profit organizations (90 | 5.9%) make up the most common classes of employment.
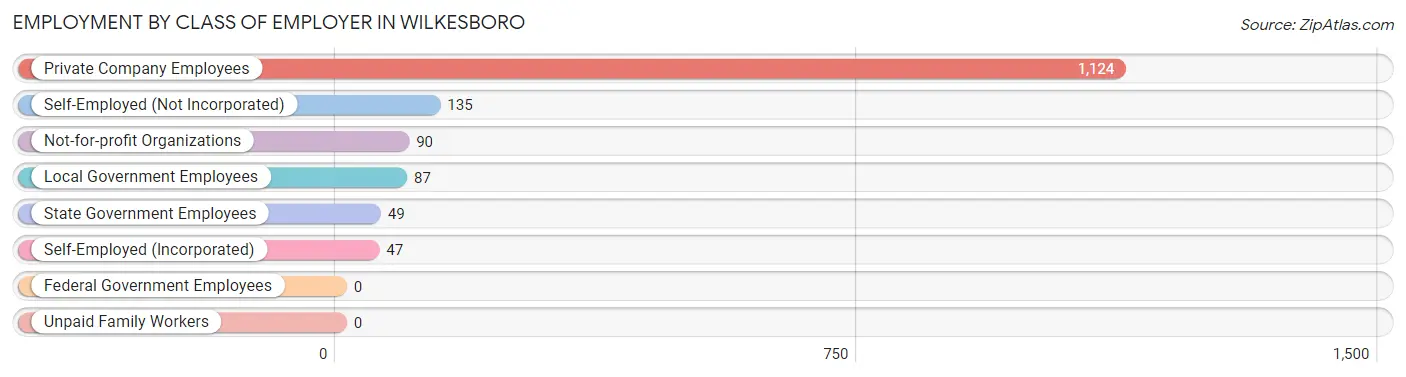
| Employer Class | # Employees | % Employees |
| Private Company Employees | 1,124 | 73.4% |
| Self-Employed (Incorporated) | 47 | 3.1% |
| Self-Employed (Not Incorporated) | 135 | 8.8% |
| Not-for-profit Organizations | 90 | 5.9% |
| Local Government Employees | 87 | 5.7% |
| State Government Employees | 49 | 3.2% |
| Federal Government Employees | 0 | 0.0% |
| Unpaid Family Workers | 0 | 0.0% |
| Total | 1,532 | 100.0% |
Employment Status by Age in Wilkesboro
According to the labor force statistics for Wilkesboro, out of the total population over 16 years of age (3,006), 54.4% or 1,635 individuals are in the labor force, with 4.8% or 78 of them unemployed. The age group with the highest labor force participation rate is 30 to 34 years, with 95.2% or 180 individuals in the labor force. Within the labor force, the 30 to 34 years age range has the highest percentage of unemployed individuals, with 30.6% or 55 of them being unemployed.
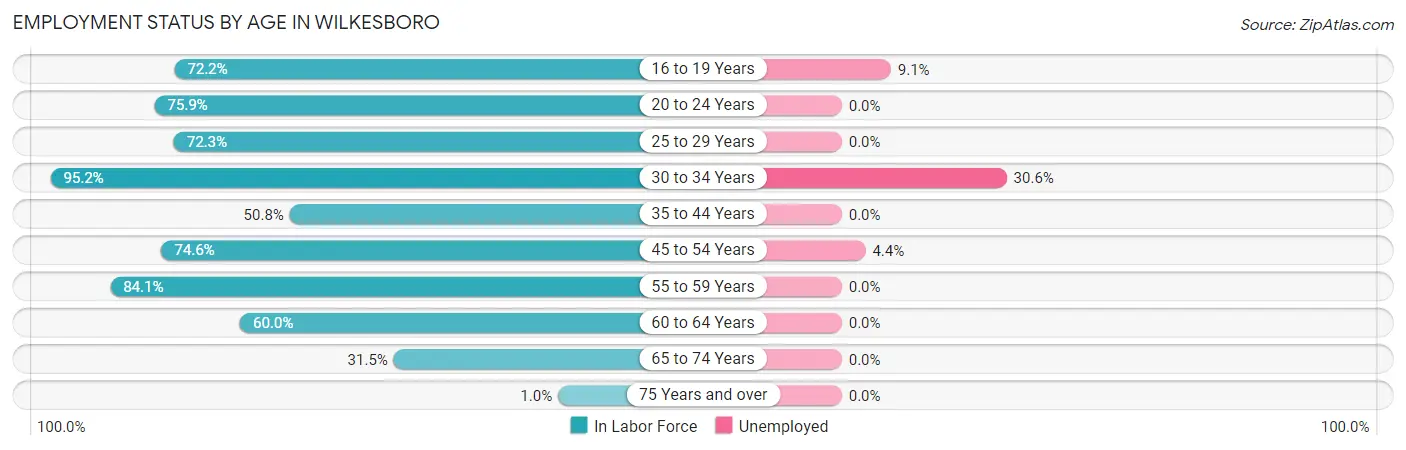
| Age Bracket | In Labor Force | Unemployed |
| 16 to 19 Years | 164 (72.2%) | 15 (9.1%) |
| 20 to 24 Years | 239 (75.9%) | 0 (0.0%) |
| 25 to 29 Years | 245 (72.3%) | 0 (0.0%) |
| 30 to 34 Years | 180 (95.2%) | 55 (30.6%) |
| 35 to 44 Years | 120 (50.8%) | 0 (0.0%) |
| 45 to 54 Years | 203 (74.6%) | 9 (4.4%) |
| 55 to 59 Years | 253 (84.1%) | 0 (0.0%) |
| 60 to 64 Years | 117 (60.0%) | 0 (0.0%) |
| 65 to 74 Years | 109 (31.5%) | 0 (0.0%) |
| 75 Years and over | 6 (1.0%) | 0 (0.0%) |
| Total | 1,635 (54.4%) | 78 (4.8%) |
Employment Status by Educational Attainment in Wilkesboro
According to labor force statistics for Wilkesboro, 73.0% of individuals (1,118) out of the total population between 25 and 64 years of age (1,532) are in the labor force, with 5.7% or 64 of them being unemployed. The group with the highest labor force participation rate are those with the educational attainment of bachelor's degree or higher, with 90.1% or 390 individuals in the labor force. Within the labor force, individuals with high school diploma education have the highest percentage of unemployment, with 34.8% or 64 of them being unemployed.
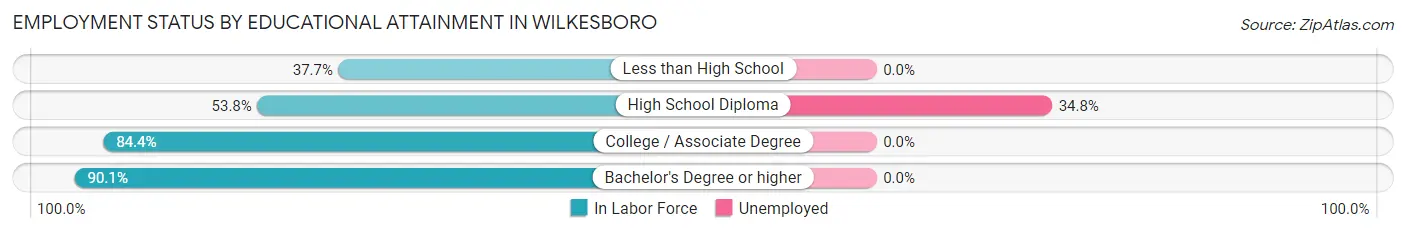
| Educational Attainment | In Labor Force | Unemployed |
| Less than High School | 77 (37.7%) | 0 (0.0%) |
| High School Diploma | 184 (53.8%) | 119 (34.8%) |
| College / Associate Degree | 467 (84.4%) | 0 (0.0%) |
| Bachelor's Degree or higher | 390 (90.1%) | 0 (0.0%) |
| Total | 1,118 (73.0%) | 87 (5.7%) |
Employment Occupations by Sex in Wilkesboro
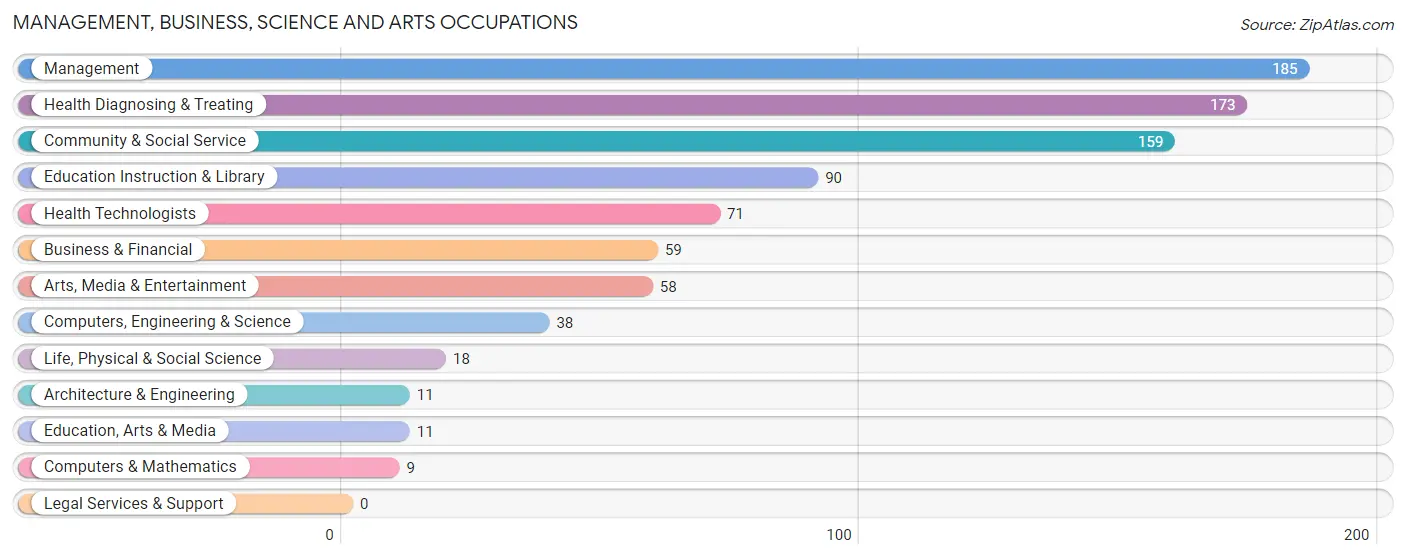
Management, Business, Science and Arts Occupations
The most common Management, Business, Science and Arts occupations in Wilkesboro are Management (185 | 11.9%), Health Diagnosing & Treating (173 | 11.1%), Community & Social Service (159 | 10.2%), Education Instruction & Library (90 | 5.8%), and Health Technologists (71 | 4.6%).
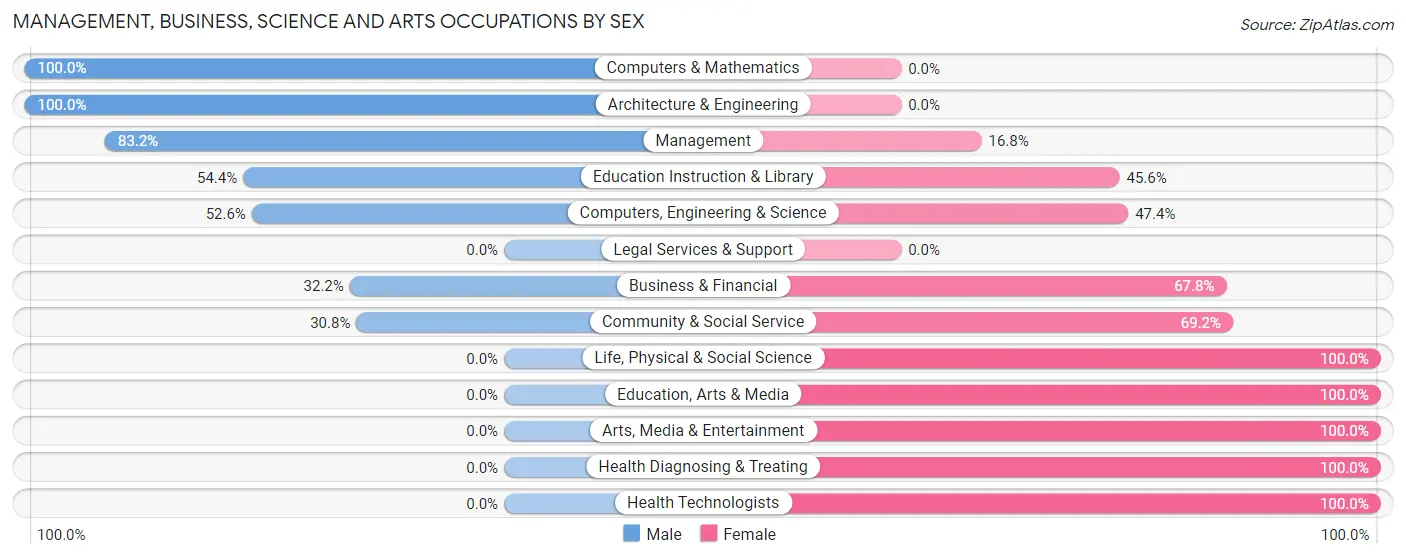
Management, Business, Science and Arts Occupations by Sex
Within the Management, Business, Science and Arts occupations in Wilkesboro, the most male-oriented occupations are Computers & Mathematics (100.0%), Architecture & Engineering (100.0%), and Management (83.2%), while the most female-oriented occupations are Life, Physical & Social Science (100.0%), Education, Arts & Media (100.0%), and Arts, Media & Entertainment (100.0%).
| Occupation | Male | Female |
| Management | 154 (83.2%) | 31 (16.8%) |
| Business & Financial | 19 (32.2%) | 40 (67.8%) |
| Computers, Engineering & Science | 20 (52.6%) | 18 (47.4%) |
| Computers & Mathematics | 9 (100.0%) | 0 (0.0%) |
| Architecture & Engineering | 11 (100.0%) | 0 (0.0%) |
| Life, Physical & Social Science | 0 (0.0%) | 18 (100.0%) |
| Community & Social Service | 49 (30.8%) | 110 (69.2%) |
| Education, Arts & Media | 0 (0.0%) | 11 (100.0%) |
| Legal Services & Support | 0 (0.0%) | 0 (0.0%) |
| Education Instruction & Library | 49 (54.4%) | 41 (45.6%) |
| Arts, Media & Entertainment | 0 (0.0%) | 58 (100.0%) |
| Health Diagnosing & Treating | 0 (0.0%) | 173 (100.0%) |
| Health Technologists | 0 (0.0%) | 71 (100.0%) |
| Total (Category) | 242 (39.4%) | 372 (60.6%) |
| Total (Overall) | 832 (53.4%) | 725 (46.6%) |
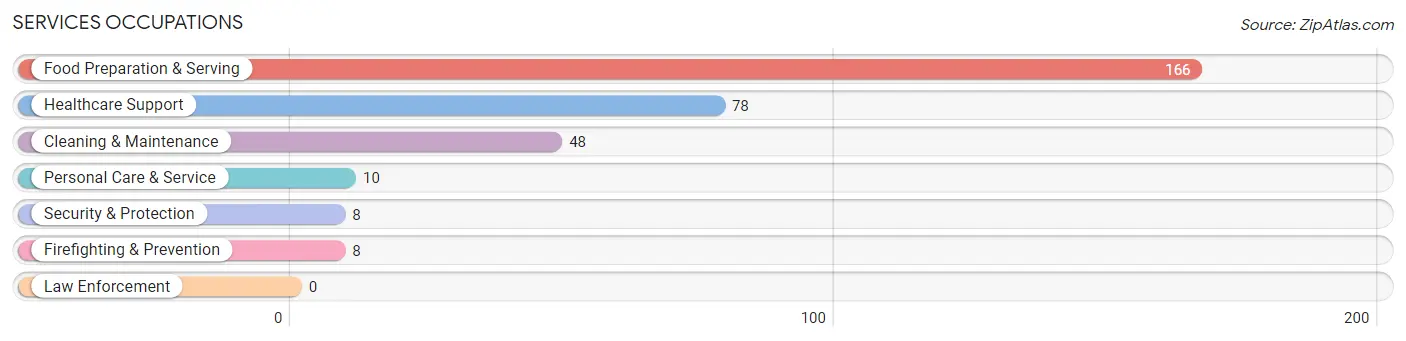
Services Occupations
The most common Services occupations in Wilkesboro are Food Preparation & Serving (166 | 10.7%), Healthcare Support (78 | 5.0%), Cleaning & Maintenance (48 | 3.1%), Personal Care & Service (10 | 0.6%), and Security & Protection (8 | 0.5%).
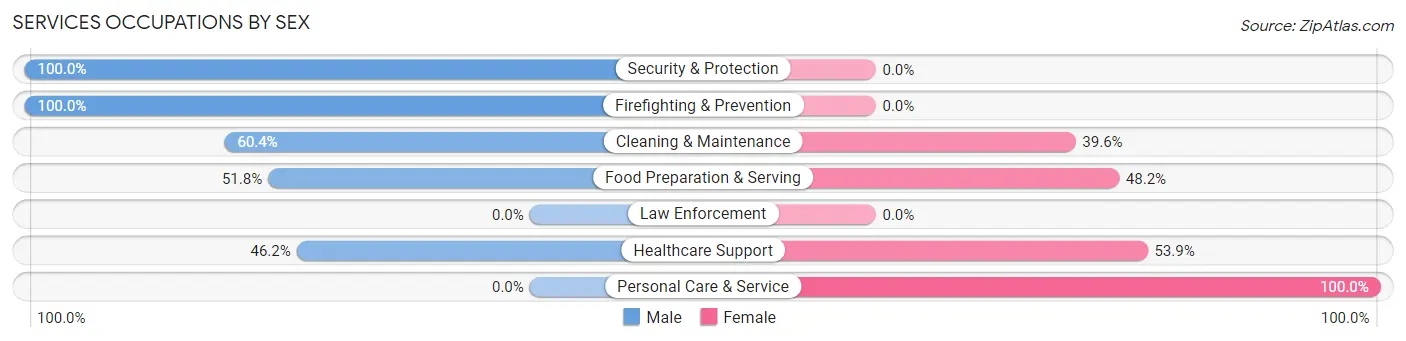
Services Occupations by Sex
Within the Services occupations in Wilkesboro, the most male-oriented occupations are Security & Protection (100.0%), Firefighting & Prevention (100.0%), and Cleaning & Maintenance (60.4%), while the most female-oriented occupations are Personal Care & Service (100.0%), Healthcare Support (53.8%), and Food Preparation & Serving (48.2%).
| Occupation | Male | Female |
| Healthcare Support | 36 (46.2%) | 42 (53.8%) |
| Security & Protection | 8 (100.0%) | 0 (0.0%) |
| Firefighting & Prevention | 8 (100.0%) | 0 (0.0%) |
| Law Enforcement | 0 (0.0%) | 0 (0.0%) |
| Food Preparation & Serving | 86 (51.8%) | 80 (48.2%) |
| Cleaning & Maintenance | 29 (60.4%) | 19 (39.6%) |
| Personal Care & Service | 0 (0.0%) | 10 (100.0%) |
| Total (Category) | 159 (51.3%) | 151 (48.7%) |
| Total (Overall) | 832 (53.4%) | 725 (46.6%) |
Sales and Office Occupations
The most common Sales and Office occupations in Wilkesboro are Sales & Related (184 | 11.8%), and Office & Administration (134 | 8.6%).
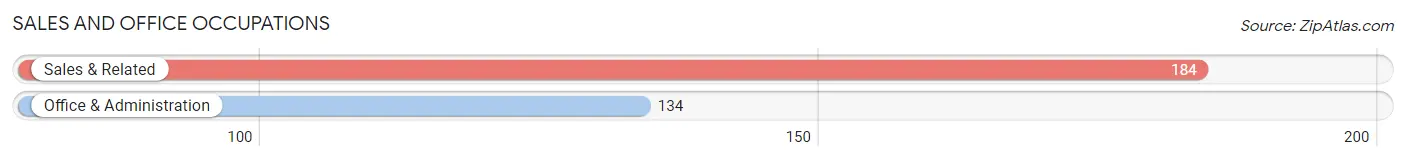
Sales and Office Occupations by Sex

| Occupation | Male | Female |
| Sales & Related | 106 (57.6%) | 78 (42.4%) |
| Office & Administration | 67 (50.0%) | 67 (50.0%) |
| Total (Category) | 173 (54.4%) | 145 (45.6%) |
| Total (Overall) | 832 (53.4%) | 725 (46.6%) |
Natural Resources, Construction and Maintenance Occupations
The most common Natural Resources, Construction and Maintenance occupations in Wilkesboro are Construction & Extraction (69 | 4.4%), and Installation, Maintenance & Repair (27 | 1.7%).

Natural Resources, Construction and Maintenance Occupations by Sex

| Occupation | Male | Female |
| Farming, Fishing & Forestry | 0 (0.0%) | 0 (0.0%) |
| Construction & Extraction | 69 (100.0%) | 0 (0.0%) |
| Installation, Maintenance & Repair | 27 (100.0%) | 0 (0.0%) |
| Total (Category) | 96 (100.0%) | 0 (0.0%) |
| Total (Overall) | 832 (53.4%) | 725 (46.6%) |
Production, Transportation and Moving Occupations
The most common Production, Transportation and Moving occupations in Wilkesboro are Production (142 | 9.1%), and Material Moving (77 | 5.0%).
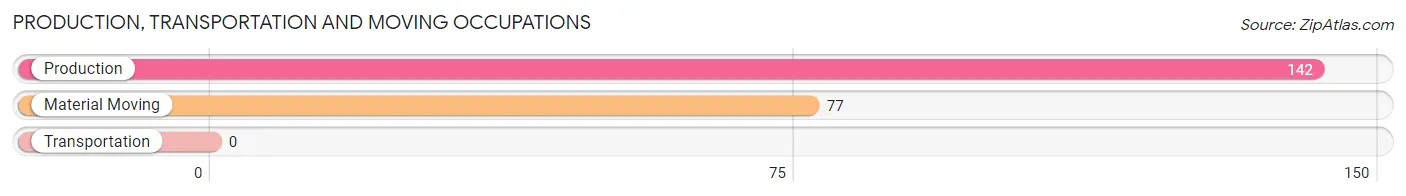
Production, Transportation and Moving Occupations by Sex
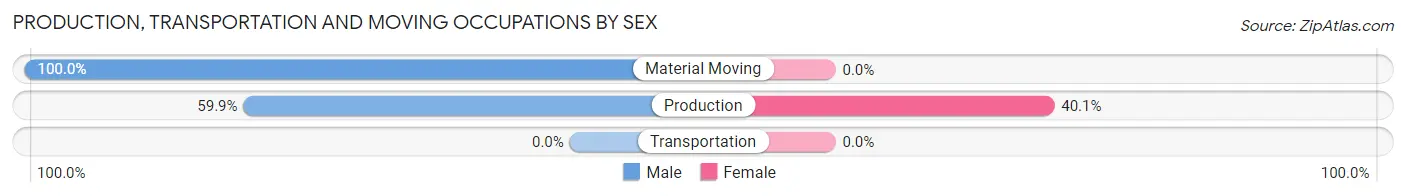
| Occupation | Male | Female |
| Production | 85 (59.9%) | 57 (40.1%) |
| Transportation | 0 (0.0%) | 0 (0.0%) |
| Material Moving | 77 (100.0%) | 0 (0.0%) |
| Total (Category) | 162 (74.0%) | 57 (26.0%) |
| Total (Overall) | 832 (53.4%) | 725 (46.6%) |
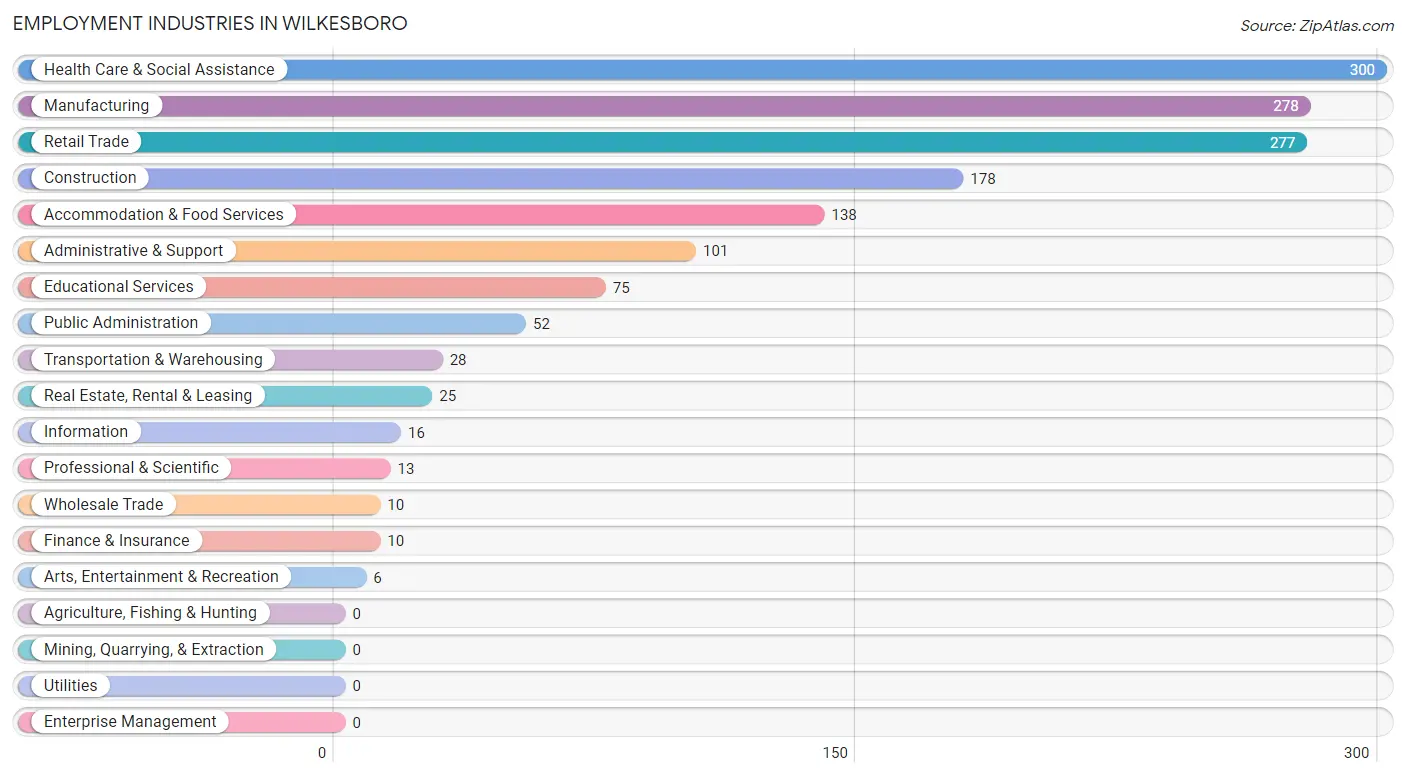
Employment Industries by Sex in Wilkesboro
Employment Industries in Wilkesboro
The major employment industries in Wilkesboro include Health Care & Social Assistance (300 | 19.3%), Manufacturing (278 | 17.8%), Retail Trade (277 | 17.8%), Construction (178 | 11.4%), and Accommodation & Food Services (138 | 8.9%).
Employment Industries by Sex in Wilkesboro
The Wilkesboro industries that see more men than women are Wholesale Trade (100.0%), Transportation & Warehousing (100.0%), and Finance & Insurance (100.0%), whereas the industries that tend to have a higher number of women are Information (100.0%), Real Estate, Rental & Leasing (100.0%), and Professional & Scientific (100.0%).
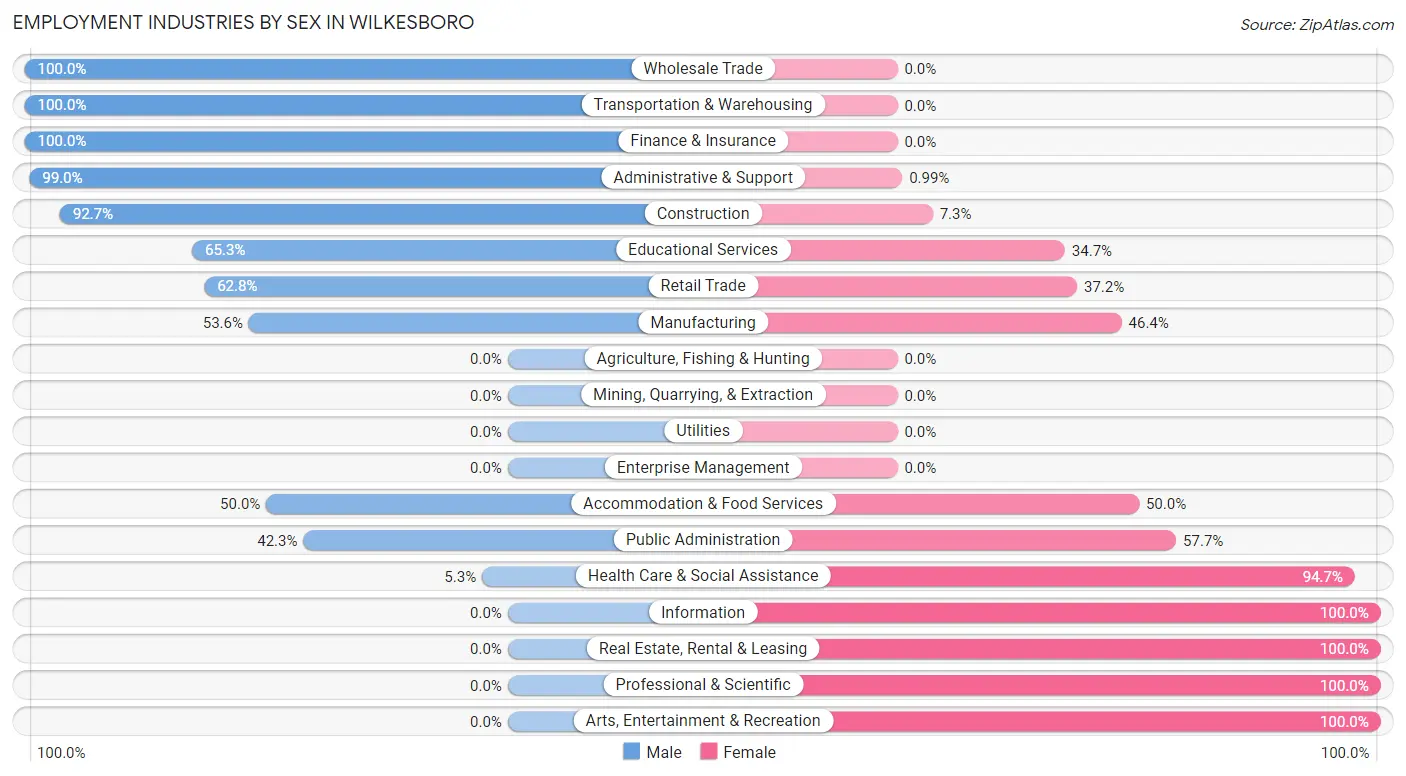
| Industry | Male | Female |
| Agriculture, Fishing & Hunting | 0 (0.0%) | 0 (0.0%) |
| Mining, Quarrying, & Extraction | 0 (0.0%) | 0 (0.0%) |
| Construction | 165 (92.7%) | 13 (7.3%) |
| Manufacturing | 149 (53.6%) | 129 (46.4%) |
| Wholesale Trade | 10 (100.0%) | 0 (0.0%) |
| Retail Trade | 174 (62.8%) | 103 (37.2%) |
| Transportation & Warehousing | 28 (100.0%) | 0 (0.0%) |
| Utilities | 0 (0.0%) | 0 (0.0%) |
| Information | 0 (0.0%) | 16 (100.0%) |
| Finance & Insurance | 10 (100.0%) | 0 (0.0%) |
| Real Estate, Rental & Leasing | 0 (0.0%) | 25 (100.0%) |
| Professional & Scientific | 0 (0.0%) | 13 (100.0%) |
| Enterprise Management | 0 (0.0%) | 0 (0.0%) |
| Administrative & Support | 100 (99.0%) | 1 (1.0%) |
| Educational Services | 49 (65.3%) | 26 (34.7%) |
| Health Care & Social Assistance | 16 (5.3%) | 284 (94.7%) |
| Arts, Entertainment & Recreation | 0 (0.0%) | 6 (100.0%) |
| Accommodation & Food Services | 69 (50.0%) | 69 (50.0%) |
| Public Administration | 22 (42.3%) | 30 (57.7%) |
| Total | 832 (53.4%) | 725 (46.6%) |
Education in Wilkesboro
School Enrollment in Wilkesboro
The most common levels of schooling among the 704 students in Wilkesboro are high school (272 | 38.6%), elementary school (147 | 20.9%), and middle school (123 | 17.5%).
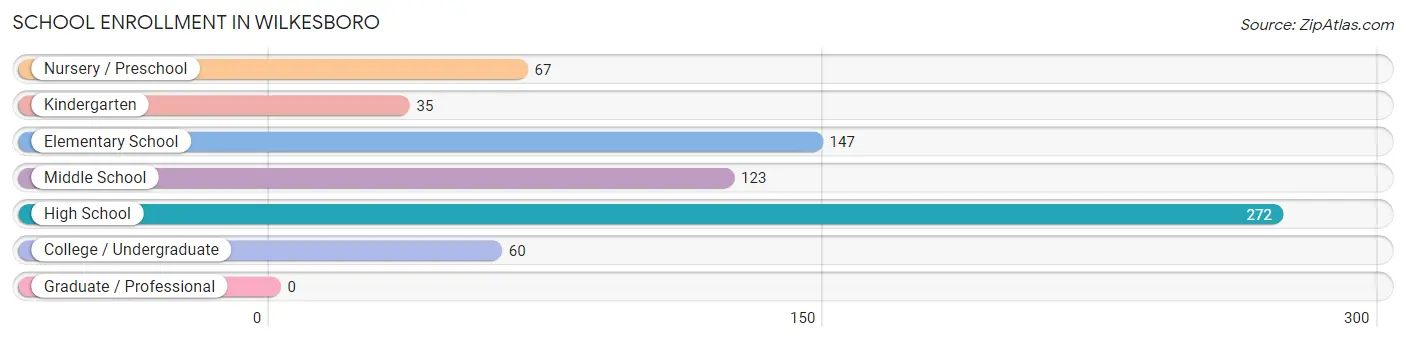
| School Level | # Students | % Students |
| Nursery / Preschool | 67 | 9.5% |
| Kindergarten | 35 | 5.0% |
| Elementary School | 147 | 20.9% |
| Middle School | 123 | 17.5% |
| High School | 272 | 38.6% |
| College / Undergraduate | 60 | 8.5% |
| Graduate / Professional | 0 | 0.0% |
| Total | 704 | 100.0% |
School Enrollment by Age by Funding Source in Wilkesboro
Out of a total of 704 students who are enrolled in schools in Wilkesboro, 151 (21.4%) attend a private institution, while the remaining 553 (78.6%) are enrolled in public schools. The age group of 35 years and over has the highest likelihood of being enrolled in private schools, with 10 (100.0% in the age bracket) enrolled. Conversely, the age group of 10 to 14 year olds has the lowest likelihood of being enrolled in a private school, with 176 (100.0% in the age bracket) attending a public institution.
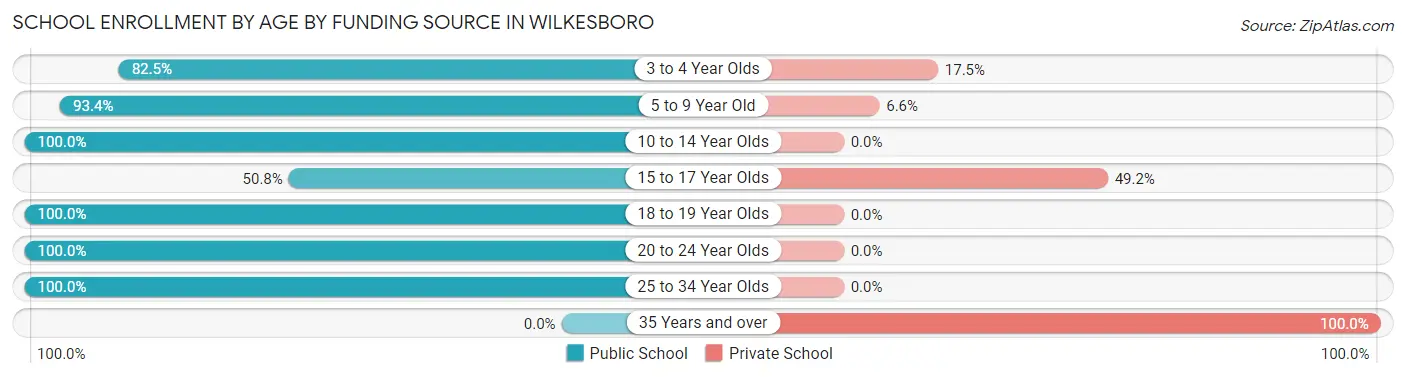
| Age Bracket | Public School | Private School |
| 3 to 4 Year Olds | 47 (82.5%) | 10 (17.5%) |
| 5 to 9 Year Old | 155 (93.4%) | 11 (6.6%) |
| 10 to 14 Year Olds | 176 (100.0%) | 0 (0.0%) |
| 15 to 17 Year Olds | 124 (50.8%) | 120 (49.2%) |
| 18 to 19 Year Olds | 1 (100.0%) | 0 (0.0%) |
| 20 to 24 Year Olds | 12 (100.0%) | 0 (0.0%) |
| 25 to 34 Year Olds | 38 (100.0%) | 0 (0.0%) |
| 35 Years and over | 0 (0.0%) | 10 (100.0%) |
| Total | 553 (78.6%) | 151 (21.4%) |
Educational Attainment by Field of Study in Wilkesboro
Education (217 | 29.2%), business (115 | 15.5%), science & technology (100 | 13.4%), liberal arts & history (67 | 9.0%), and bio, nature & agricultural (45 | 6.0%) are the most common fields of study among 744 individuals in Wilkesboro who have obtained a bachelor's degree or higher.
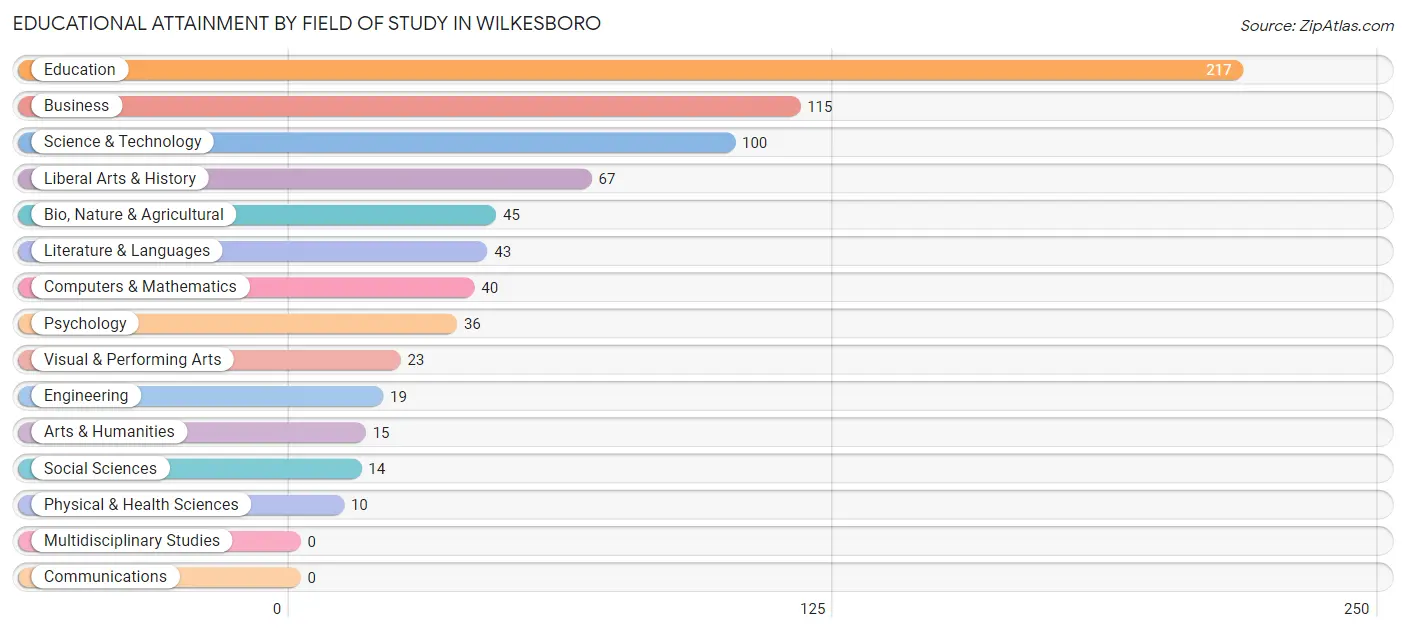
| Field of Study | # Graduates | % Graduates |
| Computers & Mathematics | 40 | 5.4% |
| Bio, Nature & Agricultural | 45 | 6.0% |
| Physical & Health Sciences | 10 | 1.3% |
| Psychology | 36 | 4.8% |
| Social Sciences | 14 | 1.9% |
| Engineering | 19 | 2.5% |
| Multidisciplinary Studies | 0 | 0.0% |
| Science & Technology | 100 | 13.4% |
| Business | 115 | 15.5% |
| Education | 217 | 29.2% |
| Literature & Languages | 43 | 5.8% |
| Liberal Arts & History | 67 | 9.0% |
| Visual & Performing Arts | 23 | 3.1% |
| Communications | 0 | 0.0% |
| Arts & Humanities | 15 | 2.0% |
| Total | 744 | 100.0% |
Transportation & Commute in Wilkesboro
Vehicle Availability by Sex in Wilkesboro
The most prevalent vehicle ownership categories in Wilkesboro are males with 3 vehicles (382, accounting for 45.9%) and females with 3 vehicles (64, making up 54.6%).
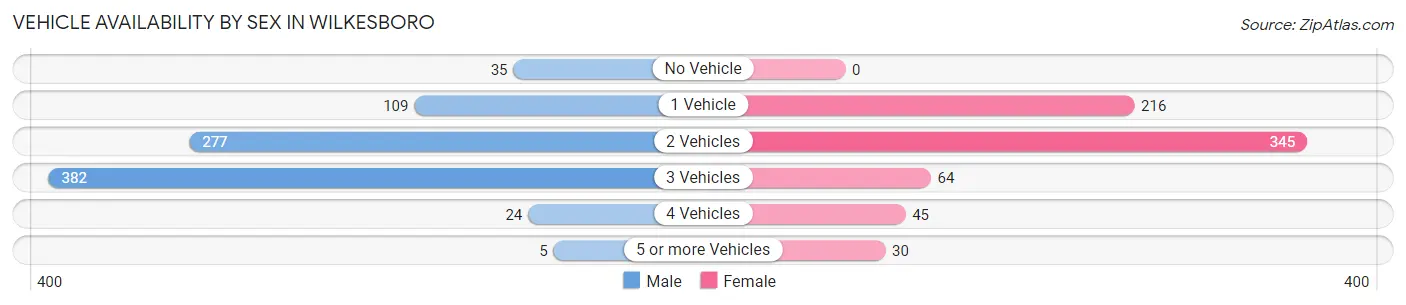
| Vehicles Available | Male | Female |
| No Vehicle | 35 (4.2%) | 0 (0.0%) |
| 1 Vehicle | 109 (13.1%) | 216 (30.9%) |
| 2 Vehicles | 277 (33.3%) | 345 (49.3%) |
| 3 Vehicles | 382 (45.9%) | 64 (9.1%) |
| 4 Vehicles | 24 (2.9%) | 45 (6.4%) |
| 5 or more Vehicles | 5 (0.6%) | 30 (4.3%) |
| Total | 832 (100.0%) | 700 (100.0%) |
Commute Time in Wilkesboro
The most frequently occuring commute durations in Wilkesboro are 10 to 14 minutes (406 commuters, 28.5%), 5 to 9 minutes (345 commuters, 24.2%), and 15 to 19 minutes (165 commuters, 11.6%).
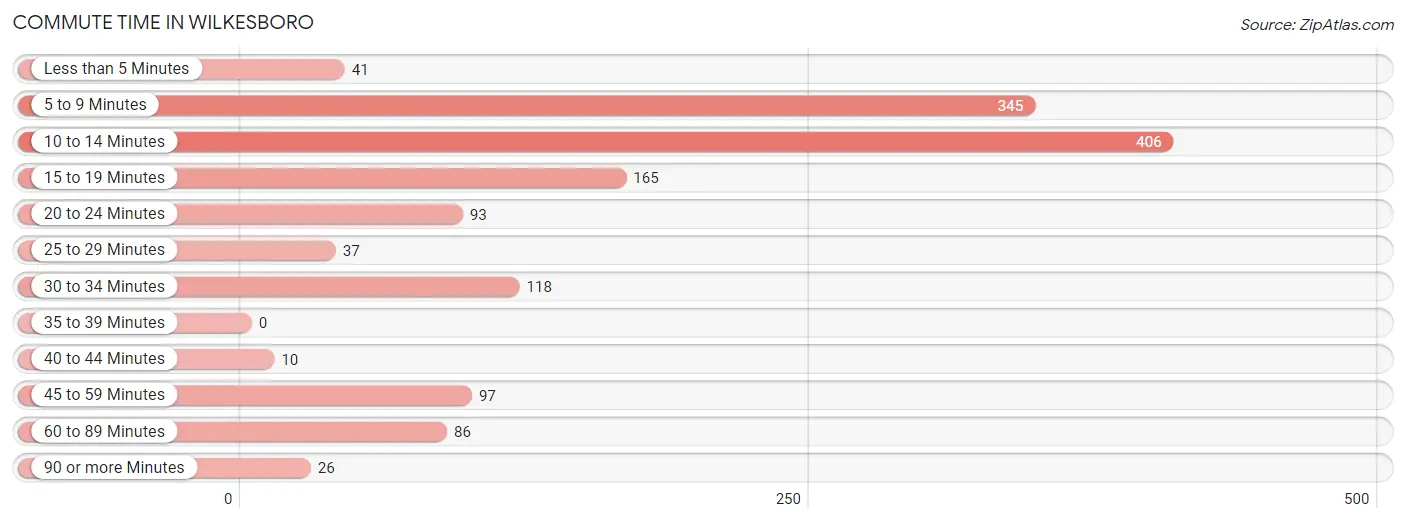
| Commute Time | # Commuters | % Commuters |
| Less than 5 Minutes | 41 | 2.9% |
| 5 to 9 Minutes | 345 | 24.2% |
| 10 to 14 Minutes | 406 | 28.5% |
| 15 to 19 Minutes | 165 | 11.6% |
| 20 to 24 Minutes | 93 | 6.5% |
| 25 to 29 Minutes | 37 | 2.6% |
| 30 to 34 Minutes | 118 | 8.3% |
| 35 to 39 Minutes | 0 | 0.0% |
| 40 to 44 Minutes | 10 | 0.7% |
| 45 to 59 Minutes | 97 | 6.8% |
| 60 to 89 Minutes | 86 | 6.0% |
| 90 or more Minutes | 26 | 1.8% |
Commute Time by Sex in Wilkesboro
The most common commute times in Wilkesboro are 10 to 14 minutes (235 commuters, 28.5%) for males and 5 to 9 minutes (177 commuters, 29.4%) for females.
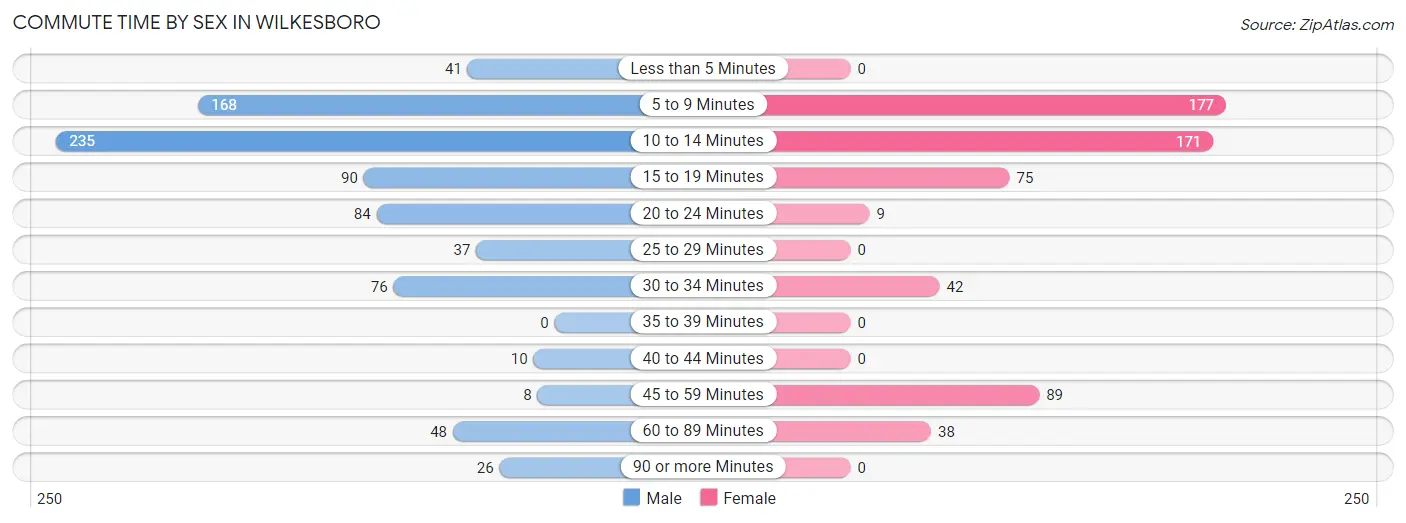
| Commute Time | Male | Female |
| Less than 5 Minutes | 41 (5.0%) | 0 (0.0%) |
| 5 to 9 Minutes | 168 (20.4%) | 177 (29.4%) |
| 10 to 14 Minutes | 235 (28.5%) | 171 (28.4%) |
| 15 to 19 Minutes | 90 (10.9%) | 75 (12.5%) |
| 20 to 24 Minutes | 84 (10.2%) | 9 (1.5%) |
| 25 to 29 Minutes | 37 (4.5%) | 0 (0.0%) |
| 30 to 34 Minutes | 76 (9.2%) | 42 (7.0%) |
| 35 to 39 Minutes | 0 (0.0%) | 0 (0.0%) |
| 40 to 44 Minutes | 10 (1.2%) | 0 (0.0%) |
| 45 to 59 Minutes | 8 (1.0%) | 89 (14.8%) |
| 60 to 89 Minutes | 48 (5.8%) | 38 (6.3%) |
| 90 or more Minutes | 26 (3.2%) | 0 (0.0%) |
Time of Departure to Work by Sex in Wilkesboro
The most frequent times of departure to work in Wilkesboro are 8:00 AM to 8:29 AM (141, 17.1%) for males and 7:30 AM to 7:59 AM (119, 19.8%) for females.
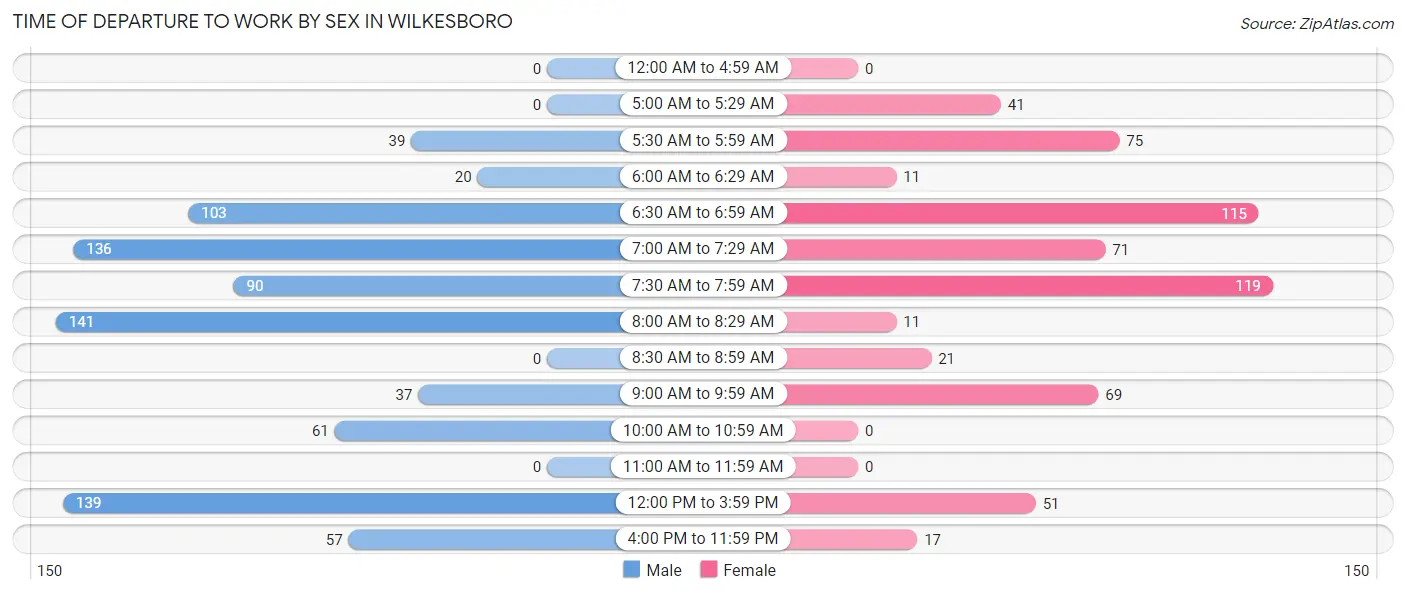
| Time of Departure | Male | Female |
| 12:00 AM to 4:59 AM | 0 (0.0%) | 0 (0.0%) |
| 5:00 AM to 5:29 AM | 0 (0.0%) | 41 (6.8%) |
| 5:30 AM to 5:59 AM | 39 (4.7%) | 75 (12.5%) |
| 6:00 AM to 6:29 AM | 20 (2.4%) | 11 (1.8%) |
| 6:30 AM to 6:59 AM | 103 (12.5%) | 115 (19.1%) |
| 7:00 AM to 7:29 AM | 136 (16.5%) | 71 (11.8%) |
| 7:30 AM to 7:59 AM | 90 (10.9%) | 119 (19.8%) |
| 8:00 AM to 8:29 AM | 141 (17.1%) | 11 (1.8%) |
| 8:30 AM to 8:59 AM | 0 (0.0%) | 21 (3.5%) |
| 9:00 AM to 9:59 AM | 37 (4.5%) | 69 (11.5%) |
| 10:00 AM to 10:59 AM | 61 (7.4%) | 0 (0.0%) |
| 11:00 AM to 11:59 AM | 0 (0.0%) | 0 (0.0%) |
| 12:00 PM to 3:59 PM | 139 (16.9%) | 51 (8.5%) |
| 4:00 PM to 11:59 PM | 57 (6.9%) | 17 (2.8%) |
| Total | 823 (100.0%) | 601 (100.0%) |
Housing Occupancy in Wilkesboro
Occupancy by Ownership in Wilkesboro
Of the total 1,452 dwellings in Wilkesboro, owner-occupied units account for 744 (51.2%), while renter-occupied units make up 708 (48.8%).
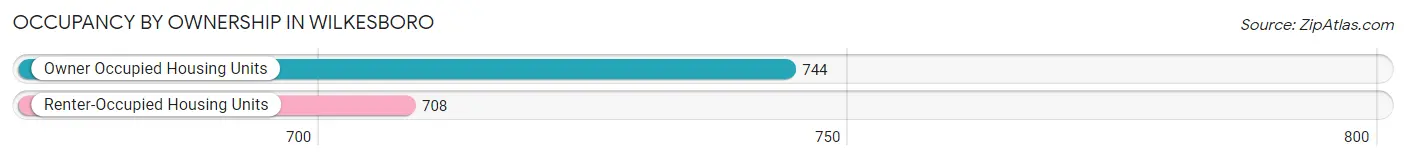
| Occupancy | # Housing Units | % Housing Units |
| Owner Occupied Housing Units | 744 | 51.2% |
| Renter-Occupied Housing Units | 708 | 48.8% |
| Total Occupied Housing Units | 1,452 | 100.0% |
Occupancy by Household Size in Wilkesboro
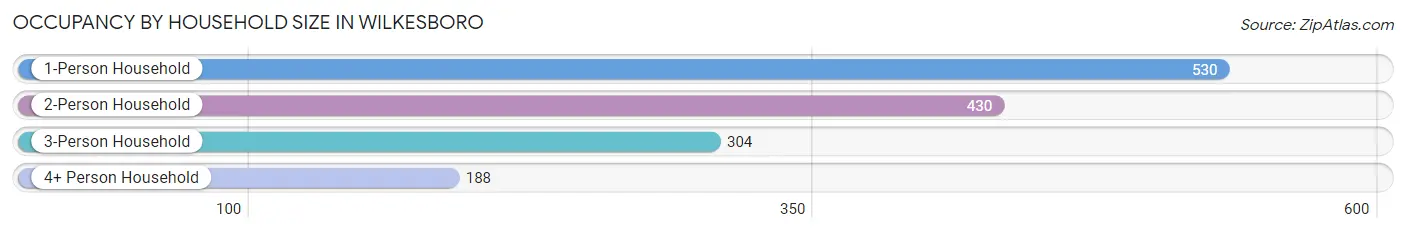
| Household Size | # Housing Units | % Housing Units |
| 1-Person Household | 530 | 36.5% |
| 2-Person Household | 430 | 29.6% |
| 3-Person Household | 304 | 20.9% |
| 4+ Person Household | 188 | 13.0% |
| Total Housing Units | 1,452 | 100.0% |
Occupancy by Ownership by Household Size in Wilkesboro
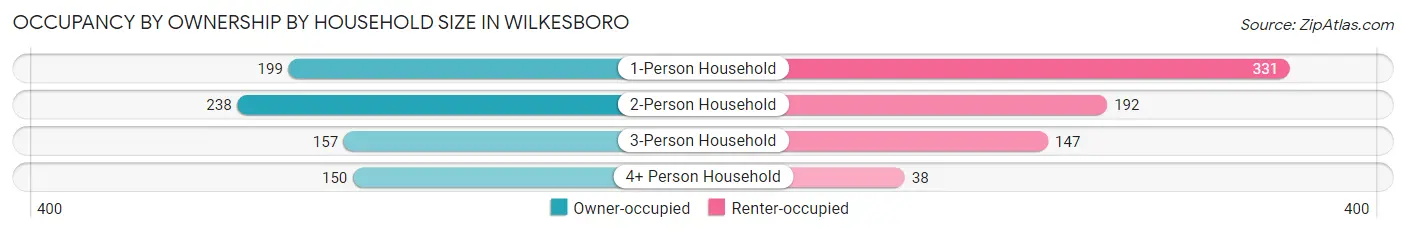
| Household Size | Owner-occupied | Renter-occupied |
| 1-Person Household | 199 (37.6%) | 331 (62.5%) |
| 2-Person Household | 238 (55.3%) | 192 (44.7%) |
| 3-Person Household | 157 (51.6%) | 147 (48.4%) |
| 4+ Person Household | 150 (79.8%) | 38 (20.2%) |
| Total Housing Units | 744 (51.2%) | 708 (48.8%) |
Occupancy by Educational Attainment in Wilkesboro
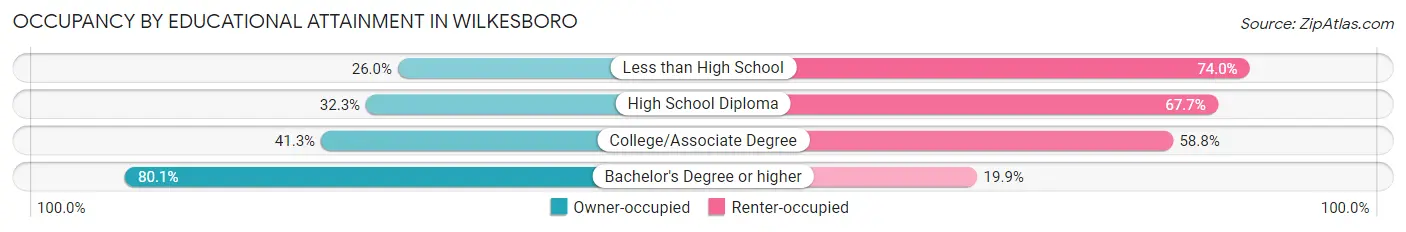
| Household Size | Owner-occupied | Renter-occupied |
| Less than High School | 13 (26.0%) | 37 (74.0%) |
| High School Diploma | 118 (32.3%) | 247 (67.7%) |
| College/Associate Degree | 231 (41.2%) | 329 (58.8%) |
| Bachelor's Degree or higher | 382 (80.1%) | 95 (19.9%) |
Occupancy by Age of Householder in Wilkesboro
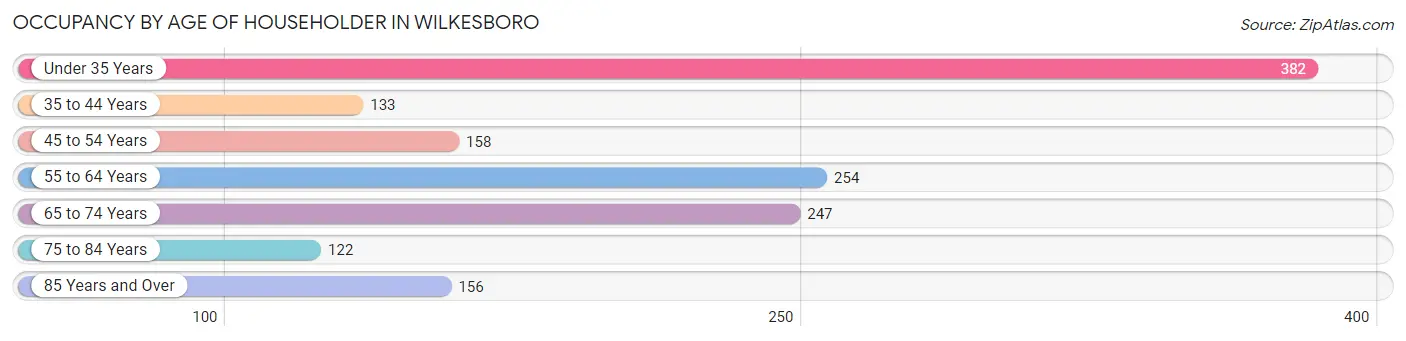
| Age Bracket | # Households | % Households |
| Under 35 Years | 382 | 26.3% |
| 35 to 44 Years | 133 | 9.2% |
| 45 to 54 Years | 158 | 10.9% |
| 55 to 64 Years | 254 | 17.5% |
| 65 to 74 Years | 247 | 17.0% |
| 75 to 84 Years | 122 | 8.4% |
| 85 Years and Over | 156 | 10.7% |
| Total | 1,452 | 100.0% |
Housing Finances in Wilkesboro
Median Income by Occupancy in Wilkesboro
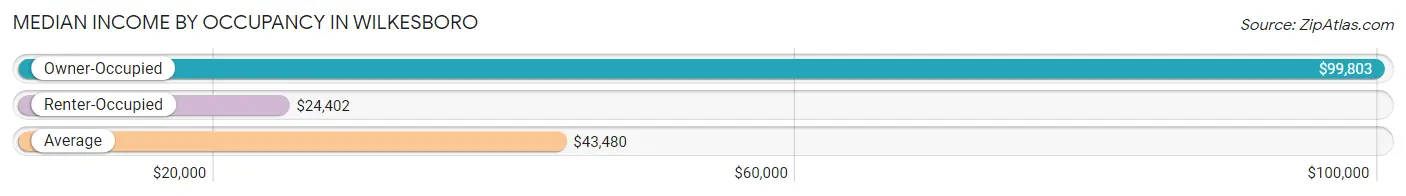
| Occupancy Type | # Households | Median Income |
| Owner-Occupied | 744 (51.2%) | $99,803 |
| Renter-Occupied | 708 (48.8%) | $24,402 |
| Average | 1,452 (100.0%) | $43,480 |
Occupancy by Householder Income Bracket in Wilkesboro
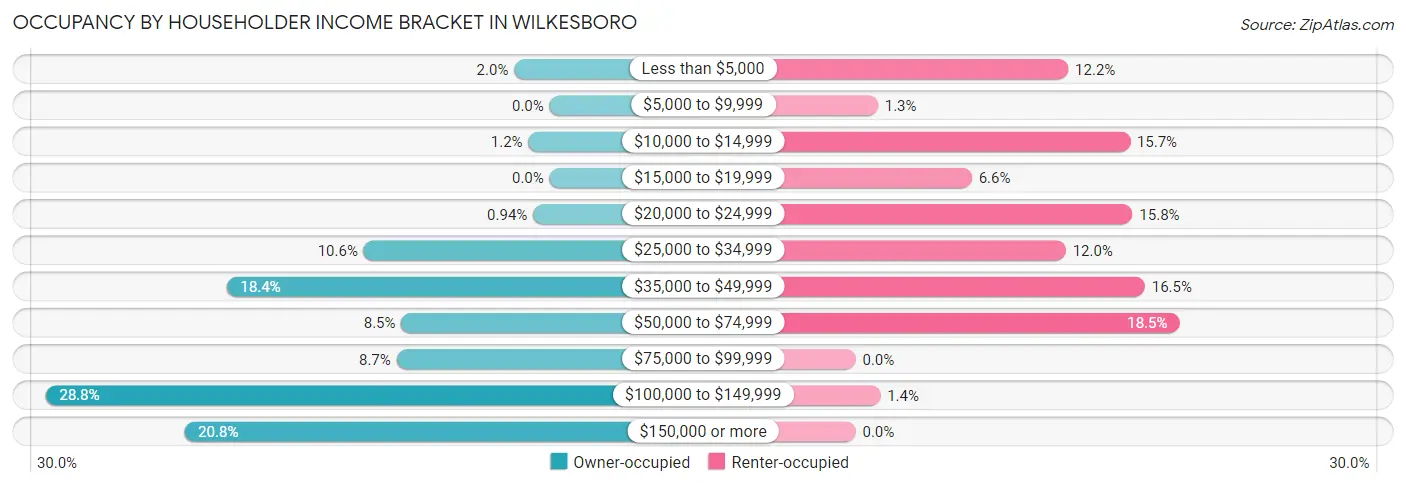
| Income Bracket | Owner-occupied | Renter-occupied |
| Less than $5,000 | 15 (2.0%) | 86 (12.1%) |
| $5,000 to $9,999 | 0 (0.0%) | 9 (1.3%) |
| $10,000 to $14,999 | 9 (1.2%) | 111 (15.7%) |
| $15,000 to $19,999 | 0 (0.0%) | 47 (6.6%) |
| $20,000 to $24,999 | 7 (0.9%) | 112 (15.8%) |
| $25,000 to $34,999 | 79 (10.6%) | 85 (12.0%) |
| $35,000 to $49,999 | 137 (18.4%) | 117 (16.5%) |
| $50,000 to $74,999 | 63 (8.5%) | 131 (18.5%) |
| $75,000 to $99,999 | 65 (8.7%) | 0 (0.0%) |
| $100,000 to $149,999 | 214 (28.8%) | 10 (1.4%) |
| $150,000 or more | 155 (20.8%) | 0 (0.0%) |
| Total | 744 (100.0%) | 708 (100.0%) |
Monthly Housing Cost Tiers in Wilkesboro
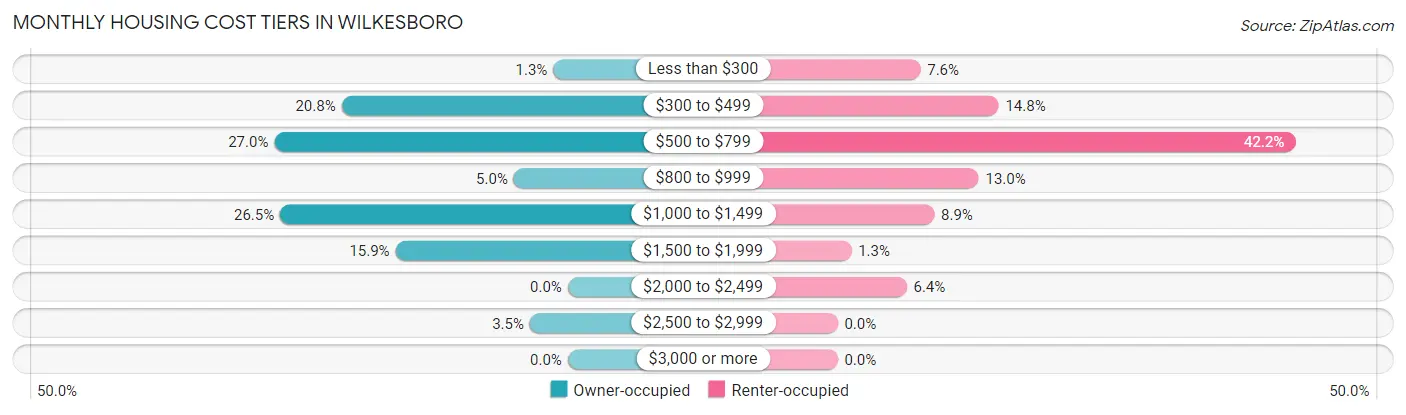
| Monthly Cost | Owner-occupied | Renter-occupied |
| Less than $300 | 10 (1.3%) | 54 (7.6%) |
| $300 to $499 | 155 (20.8%) | 105 (14.8%) |
| $500 to $799 | 201 (27.0%) | 299 (42.2%) |
| $800 to $999 | 37 (5.0%) | 92 (13.0%) |
| $1,000 to $1,499 | 197 (26.5%) | 63 (8.9%) |
| $1,500 to $1,999 | 118 (15.9%) | 9 (1.3%) |
| $2,000 to $2,499 | 0 (0.0%) | 45 (6.4%) |
| $2,500 to $2,999 | 26 (3.5%) | 0 (0.0%) |
| $3,000 or more | 0 (0.0%) | 0 (0.0%) |
| Total | 744 (100.0%) | 708 (100.0%) |
Physical Housing Characteristics in Wilkesboro
Housing Structures in Wilkesboro
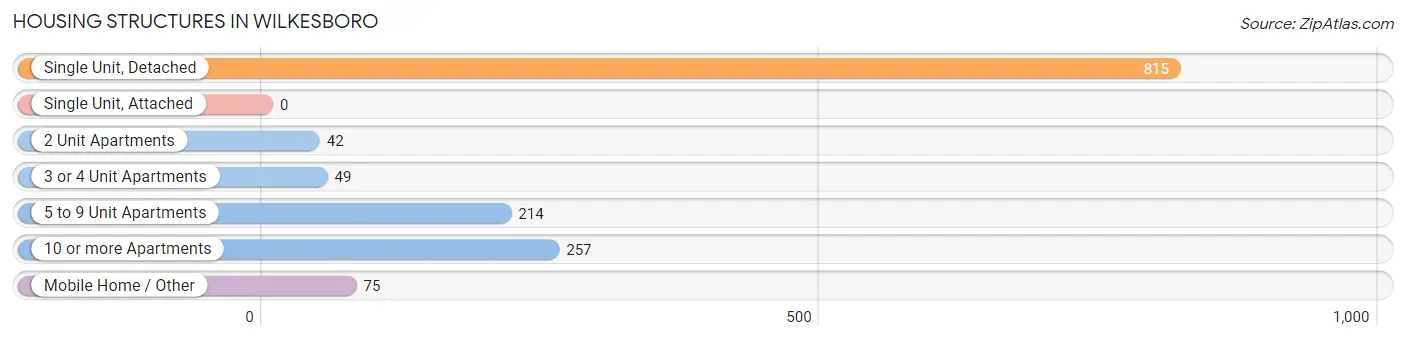
| Structure Type | # Housing Units | % Housing Units |
| Single Unit, Detached | 815 | 56.1% |
| Single Unit, Attached | 0 | 0.0% |
| 2 Unit Apartments | 42 | 2.9% |
| 3 or 4 Unit Apartments | 49 | 3.4% |
| 5 to 9 Unit Apartments | 214 | 14.7% |
| 10 or more Apartments | 257 | 17.7% |
| Mobile Home / Other | 75 | 5.2% |
| Total | 1,452 | 100.0% |
Housing Structures by Occupancy in Wilkesboro
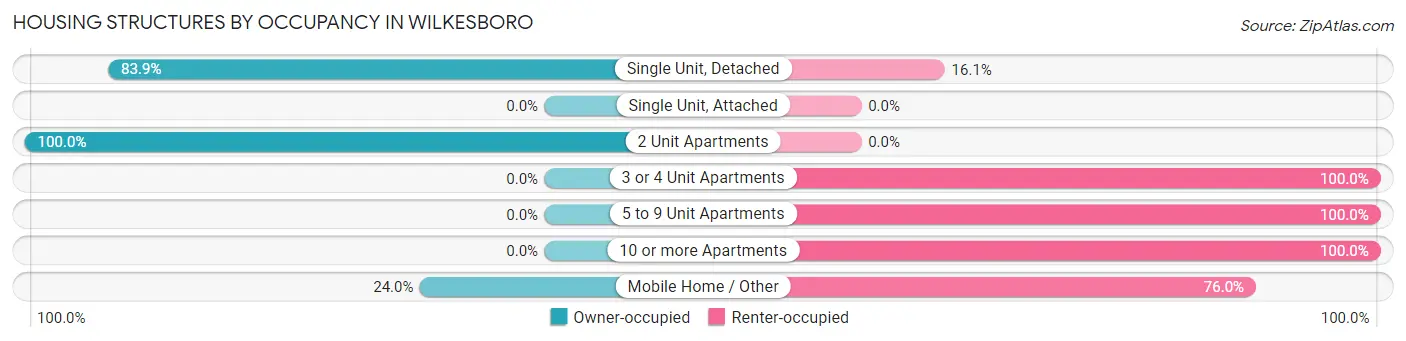
| Structure Type | Owner-occupied | Renter-occupied |
| Single Unit, Detached | 684 (83.9%) | 131 (16.1%) |
| Single Unit, Attached | 0 (0.0%) | 0 (0.0%) |
| 2 Unit Apartments | 42 (100.0%) | 0 (0.0%) |
| 3 or 4 Unit Apartments | 0 (0.0%) | 49 (100.0%) |
| 5 to 9 Unit Apartments | 0 (0.0%) | 214 (100.0%) |
| 10 or more Apartments | 0 (0.0%) | 257 (100.0%) |
| Mobile Home / Other | 18 (24.0%) | 57 (76.0%) |
| Total | 744 (51.2%) | 708 (48.8%) |
Housing Structures by Number of Rooms in Wilkesboro
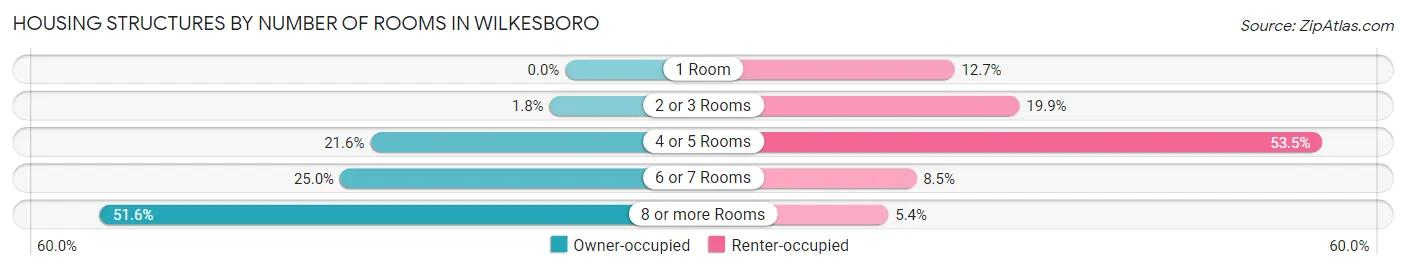
| Number of Rooms | Owner-occupied | Renter-occupied |
| 1 Room | 0 (0.0%) | 90 (12.7%) |
| 2 or 3 Rooms | 13 (1.8%) | 141 (19.9%) |
| 4 or 5 Rooms | 161 (21.6%) | 379 (53.5%) |
| 6 or 7 Rooms | 186 (25.0%) | 60 (8.5%) |
| 8 or more Rooms | 384 (51.6%) | 38 (5.4%) |
| Total | 744 (100.0%) | 708 (100.0%) |
Housing Structure by Heating Type in Wilkesboro
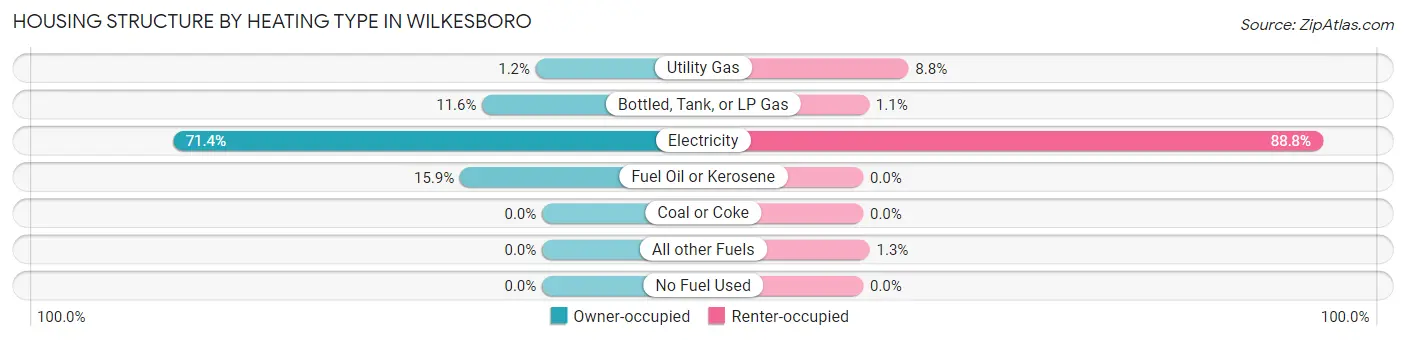
| Heating Type | Owner-occupied | Renter-occupied |
| Utility Gas | 9 (1.2%) | 62 (8.8%) |
| Bottled, Tank, or LP Gas | 86 (11.6%) | 8 (1.1%) |
| Electricity | 531 (71.4%) | 629 (88.8%) |
| Fuel Oil or Kerosene | 118 (15.9%) | 0 (0.0%) |
| Coal or Coke | 0 (0.0%) | 0 (0.0%) |
| All other Fuels | 0 (0.0%) | 9 (1.3%) |
| No Fuel Used | 0 (0.0%) | 0 (0.0%) |
| Total | 744 (100.0%) | 708 (100.0%) |
Household Vehicle Usage in Wilkesboro
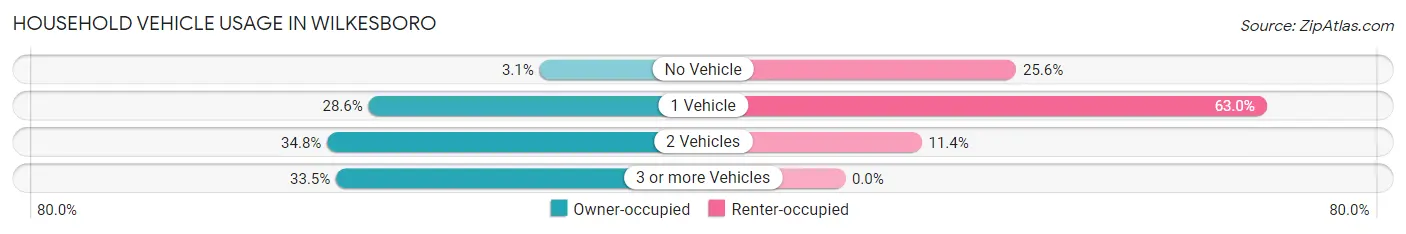
| Vehicles per Household | Owner-occupied | Renter-occupied |
| No Vehicle | 23 (3.1%) | 181 (25.6%) |
| 1 Vehicle | 213 (28.6%) | 446 (63.0%) |
| 2 Vehicles | 259 (34.8%) | 81 (11.4%) |
| 3 or more Vehicles | 249 (33.5%) | 0 (0.0%) |
| Total | 744 (100.0%) | 708 (100.0%) |
Real Estate & Mortgages in Wilkesboro
Real Estate and Mortgage Overview in Wilkesboro
| Characteristic | Without Mortgage | With Mortgage |
| Housing Units | 289 | 455 |
| Median Property Value | $179,300 | $174,400 |
| Median Household Income | $53,092 | $100 |
| Monthly Housing Costs | $481 | $0 |
| Real Estate Taxes | $1,693 | $0 |
Property Value by Mortgage Status in Wilkesboro
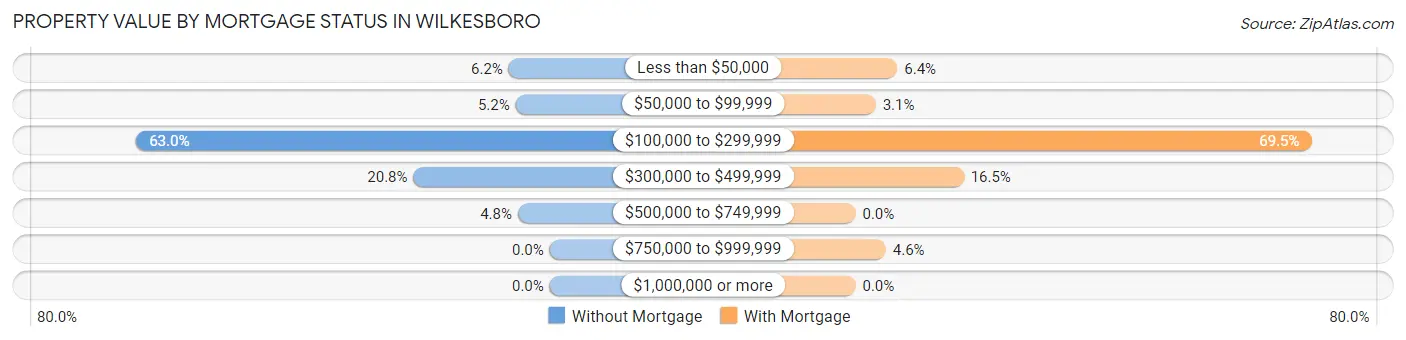
| Property Value | Without Mortgage | With Mortgage |
| Less than $50,000 | 18 (6.2%) | 29 (6.4%) |
| $50,000 to $99,999 | 15 (5.2%) | 14 (3.1%) |
| $100,000 to $299,999 | 182 (63.0%) | 316 (69.5%) |
| $300,000 to $499,999 | 60 (20.8%) | 75 (16.5%) |
| $500,000 to $749,999 | 14 (4.8%) | 0 (0.0%) |
| $750,000 to $999,999 | 0 (0.0%) | 21 (4.6%) |
| $1,000,000 or more | 0 (0.0%) | 0 (0.0%) |
| Total | 289 (100.0%) | 455 (100.0%) |
Household Income by Mortgage Status in Wilkesboro
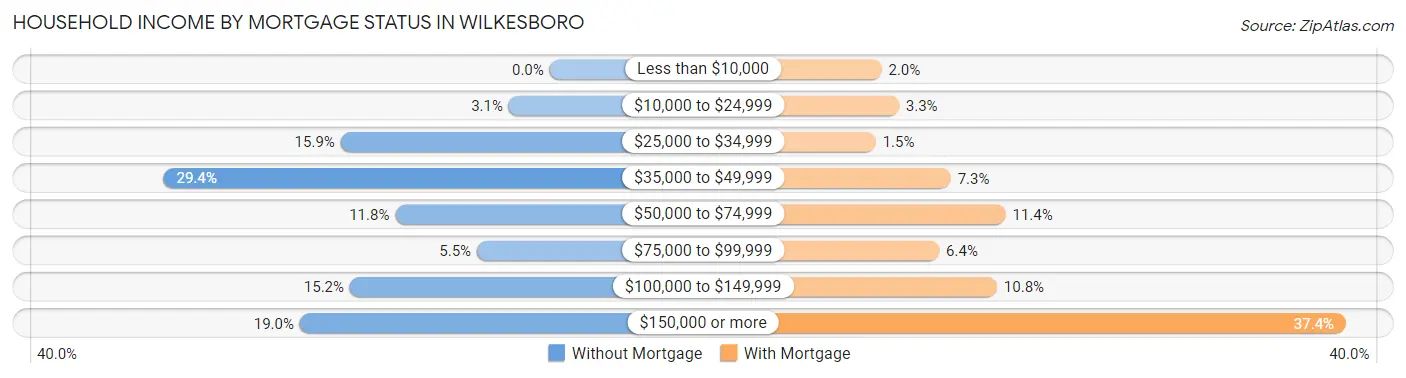
| Household Income | Without Mortgage | With Mortgage |
| Less than $10,000 | 0 (0.0%) | 9 (2.0%) |
| $10,000 to $24,999 | 9 (3.1%) | 15 (3.3%) |
| $25,000 to $34,999 | 46 (15.9%) | 7 (1.5%) |
| $35,000 to $49,999 | 85 (29.4%) | 33 (7.2%) |
| $50,000 to $74,999 | 34 (11.8%) | 52 (11.4%) |
| $75,000 to $99,999 | 16 (5.5%) | 29 (6.4%) |
| $100,000 to $149,999 | 44 (15.2%) | 49 (10.8%) |
| $150,000 or more | 55 (19.0%) | 170 (37.4%) |
| Total | 289 (100.0%) | 455 (100.0%) |
Property Value to Household Income Ratio in Wilkesboro
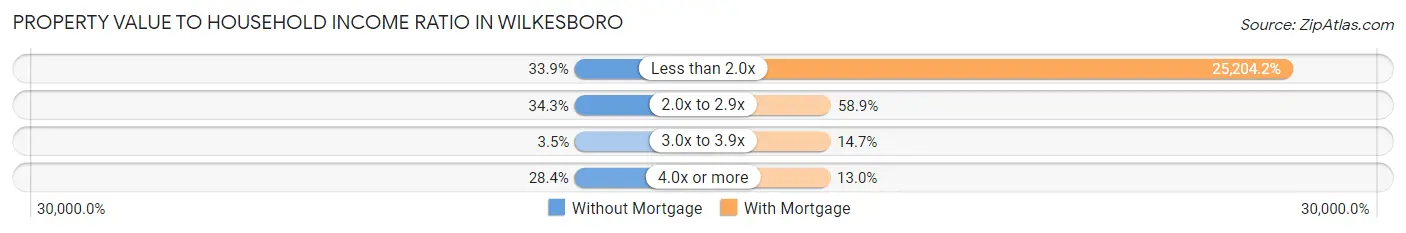
| Value-to-Income Ratio | Without Mortgage | With Mortgage |
| Less than 2.0x | 98 (33.9%) | 114,679 (25,204.2%) |
| 2.0x to 2.9x | 99 (34.3%) | 268 (58.9%) |
| 3.0x to 3.9x | 10 (3.5%) | 67 (14.7%) |
| 4.0x or more | 82 (28.4%) | 59 (13.0%) |
| Total | 289 (100.0%) | 455 (100.0%) |
Real Estate Taxes by Mortgage Status in Wilkesboro
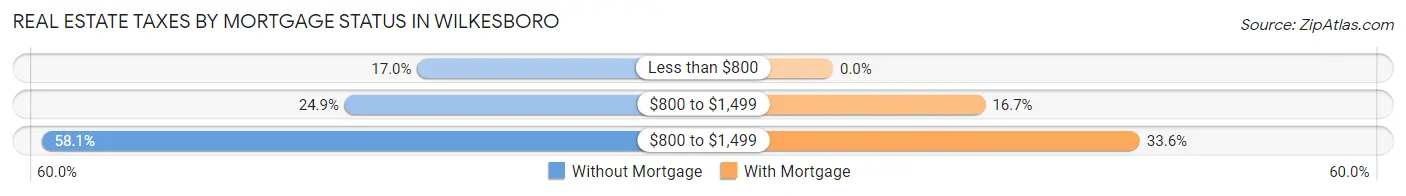
| Property Taxes | Without Mortgage | With Mortgage |
| Less than $800 | 49 (17.0%) | 0 (0.0%) |
| $800 to $1,499 | 72 (24.9%) | 76 (16.7%) |
| $800 to $1,499 | 168 (58.1%) | 153 (33.6%) |
| Total | 289 (100.0%) | 455 (100.0%) |
Health & Disability in Wilkesboro
Health Insurance Coverage by Age in Wilkesboro
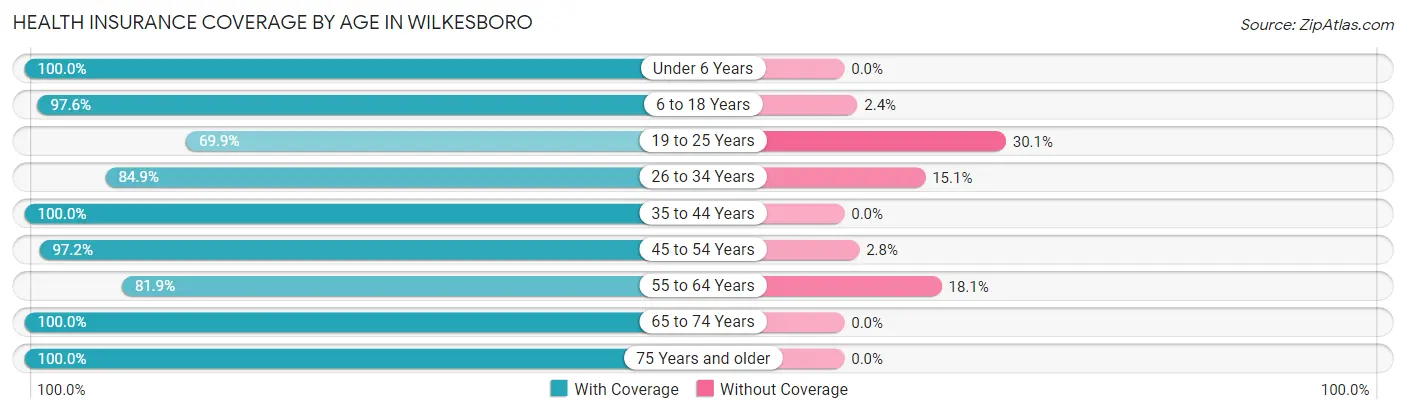
| Age Bracket | With Coverage | Without Coverage |
| Under 6 Years | 253 (100.0%) | 0 (0.0%) |
| 6 to 18 Years | 559 (97.6%) | 14 (2.4%) |
| 19 to 25 Years | 283 (69.9%) | 122 (30.1%) |
| 26 to 34 Years | 405 (84.9%) | 72 (15.1%) |
| 35 to 44 Years | 210 (100.0%) | 0 (0.0%) |
| 45 to 54 Years | 245 (97.2%) | 7 (2.8%) |
| 55 to 64 Years | 402 (81.9%) | 89 (18.1%) |
| 65 to 74 Years | 317 (100.0%) | 0 (0.0%) |
| 75 Years and older | 391 (100.0%) | 0 (0.0%) |
| Total | 3,065 (91.0%) | 304 (9.0%) |
Health Insurance Coverage by Citizenship Status in Wilkesboro

| Citizenship Status | With Coverage | Without Coverage |
| Native Born | 253 (100.0%) | 0 (0.0%) |
| Foreign Born, Citizen | 559 (97.6%) | 14 (2.4%) |
| Foreign Born, not a Citizen | 283 (69.9%) | 122 (30.1%) |
Health Insurance Coverage by Household Income in Wilkesboro
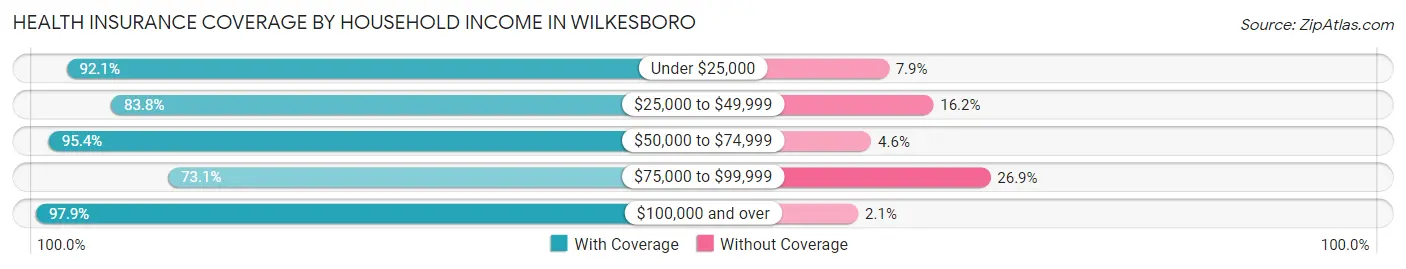
| Household Income | With Coverage | Without Coverage |
| Under $25,000 | 668 (92.1%) | 57 (7.9%) |
| $25,000 to $49,999 | 579 (83.8%) | 112 (16.2%) |
| $50,000 to $74,999 | 377 (95.4%) | 18 (4.6%) |
| $75,000 to $99,999 | 250 (73.1%) | 92 (26.9%) |
| $100,000 and over | 1,147 (97.9%) | 25 (2.1%) |
Public vs Private Health Insurance Coverage by Age in Wilkesboro
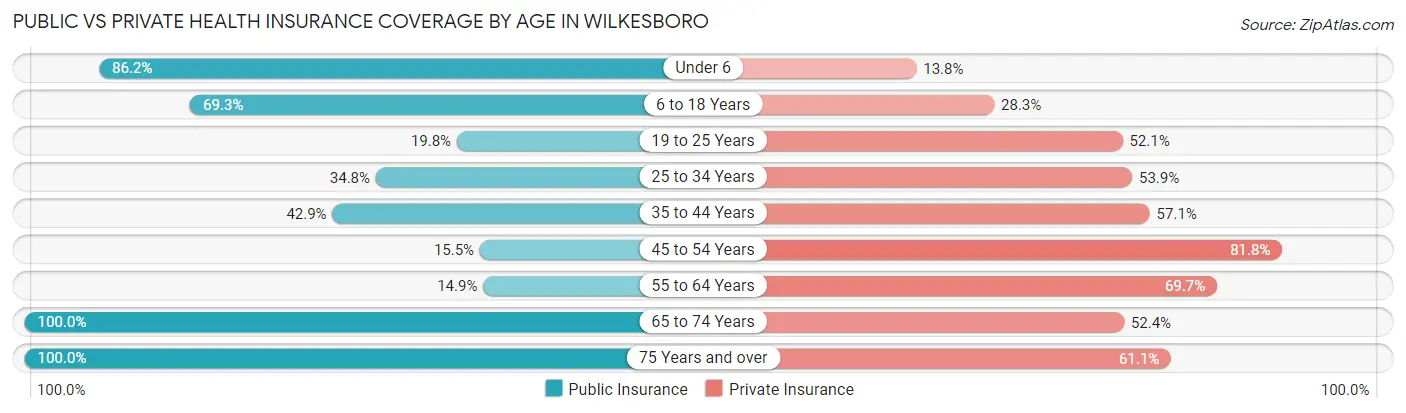
| Age Bracket | Public Insurance | Private Insurance |
| Under 6 | 218 (86.2%) | 35 (13.8%) |
| 6 to 18 Years | 397 (69.3%) | 162 (28.3%) |
| 19 to 25 Years | 80 (19.8%) | 211 (52.1%) |
| 25 to 34 Years | 166 (34.8%) | 257 (53.9%) |
| 35 to 44 Years | 90 (42.9%) | 120 (57.1%) |
| 45 to 54 Years | 39 (15.5%) | 206 (81.8%) |
| 55 to 64 Years | 73 (14.9%) | 342 (69.7%) |
| 65 to 74 Years | 317 (100.0%) | 166 (52.4%) |
| 75 Years and over | 391 (100.0%) | 239 (61.1%) |
| Total | 1,771 (52.6%) | 1,738 (51.6%) |
Disability Status by Sex by Age in Wilkesboro
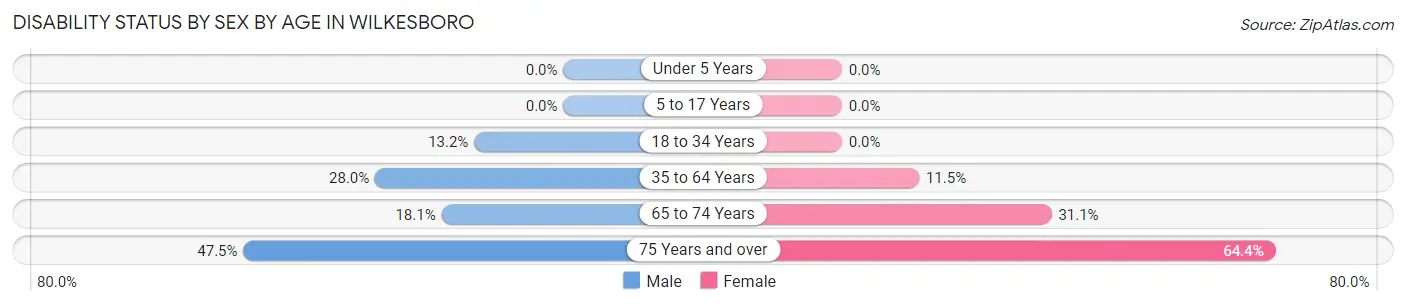
| Age Bracket | Male | Female |
| Under 5 Years | 0 (0.0%) | 0 (0.0%) |
| 5 to 17 Years | 0 (0.0%) | 0 (0.0%) |
| 18 to 34 Years | 58 (13.2%) | 0 (0.0%) |
| 35 to 64 Years | 142 (28.0%) | 51 (11.5%) |
| 65 to 74 Years | 19 (18.1%) | 66 (31.1%) |
| 75 Years and over | 67 (47.5%) | 161 (64.4%) |
Disability Class by Sex by Age in Wilkesboro
Disability Class: Hearing Difficulty
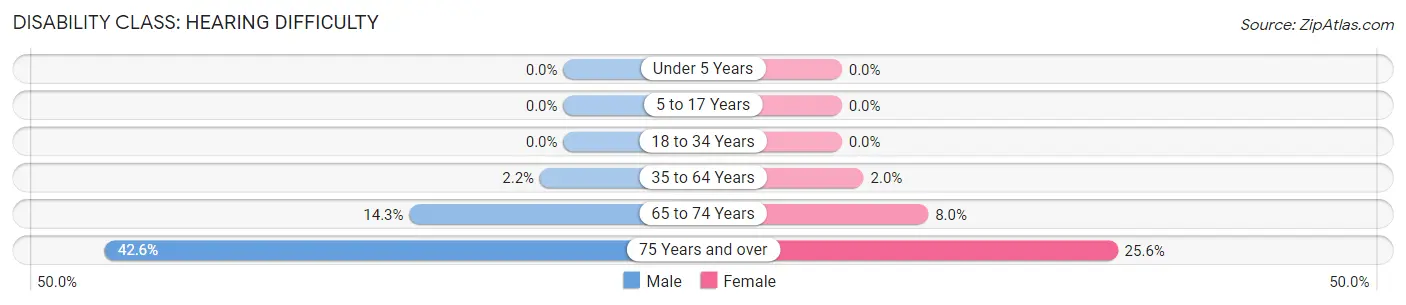
| Age Bracket | Male | Female |
| Under 5 Years | 0 (0.0%) | 0 (0.0%) |
| 5 to 17 Years | 0 (0.0%) | 0 (0.0%) |
| 18 to 34 Years | 0 (0.0%) | 0 (0.0%) |
| 35 to 64 Years | 11 (2.2%) | 9 (2.0%) |
| 65 to 74 Years | 15 (14.3%) | 17 (8.0%) |
| 75 Years and over | 60 (42.5%) | 64 (25.6%) |
Disability Class: Vision Difficulty
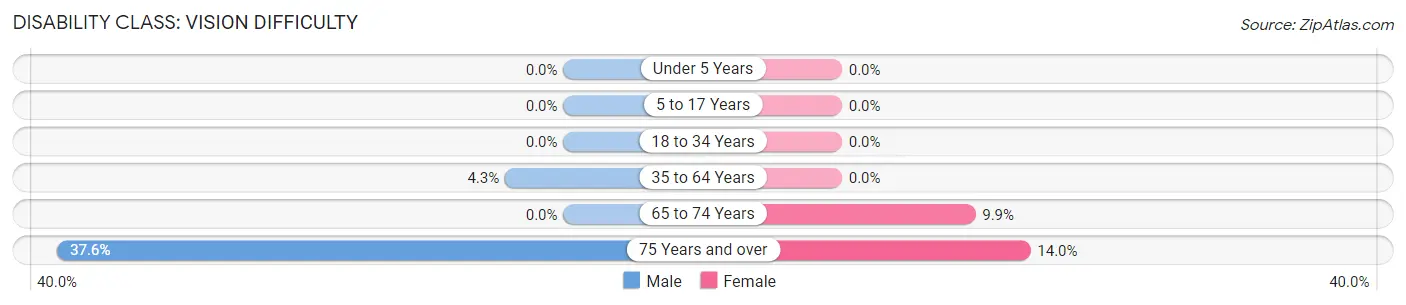
| Age Bracket | Male | Female |
| Under 5 Years | 0 (0.0%) | 0 (0.0%) |
| 5 to 17 Years | 0 (0.0%) | 0 (0.0%) |
| 18 to 34 Years | 0 (0.0%) | 0 (0.0%) |
| 35 to 64 Years | 22 (4.3%) | 0 (0.0%) |
| 65 to 74 Years | 0 (0.0%) | 21 (9.9%) |
| 75 Years and over | 53 (37.6%) | 35 (14.0%) |
Disability Class: Cognitive Difficulty
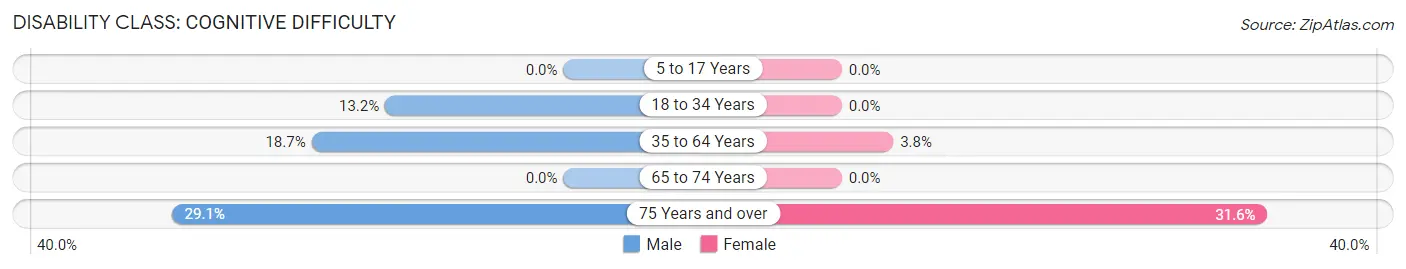
| Age Bracket | Male | Female |
| 5 to 17 Years | 0 (0.0%) | 0 (0.0%) |
| 18 to 34 Years | 58 (13.2%) | 0 (0.0%) |
| 35 to 64 Years | 95 (18.7%) | 17 (3.8%) |
| 65 to 74 Years | 0 (0.0%) | 0 (0.0%) |
| 75 Years and over | 41 (29.1%) | 79 (31.6%) |
Disability Class: Ambulatory Difficulty
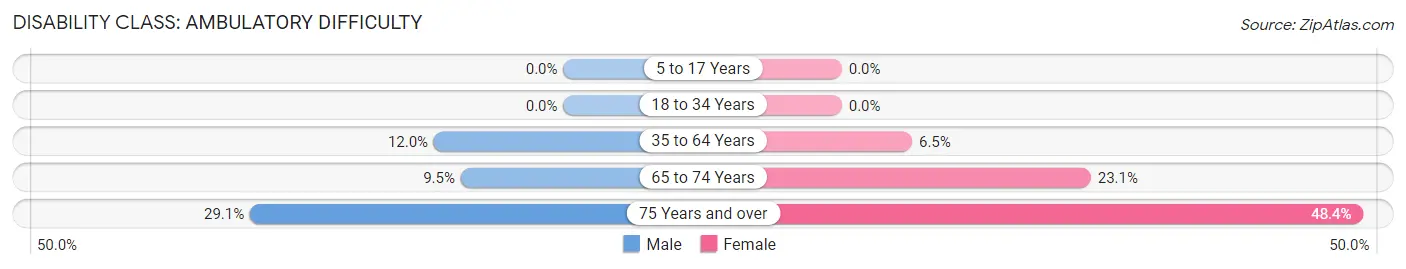
| Age Bracket | Male | Female |
| 5 to 17 Years | 0 (0.0%) | 0 (0.0%) |
| 18 to 34 Years | 0 (0.0%) | 0 (0.0%) |
| 35 to 64 Years | 61 (12.0%) | 29 (6.5%) |
| 65 to 74 Years | 10 (9.5%) | 49 (23.1%) |
| 75 Years and over | 41 (29.1%) | 121 (48.4%) |
Disability Class: Self-Care Difficulty
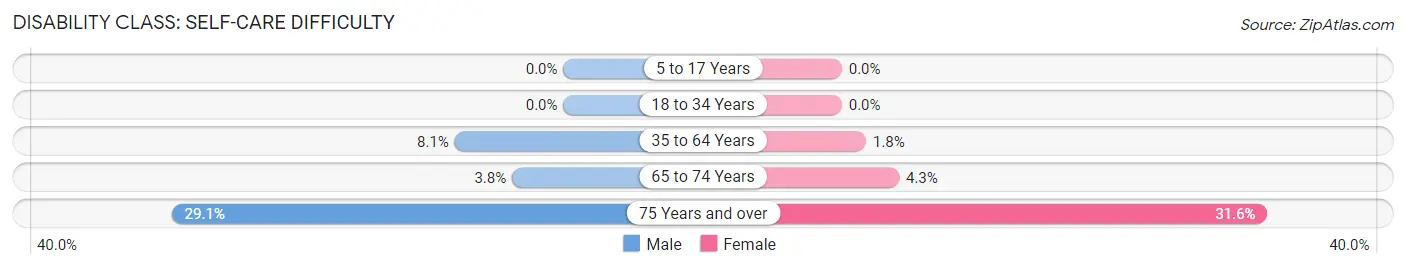
| Age Bracket | Male | Female |
| 5 to 17 Years | 0 (0.0%) | 0 (0.0%) |
| 18 to 34 Years | 0 (0.0%) | 0 (0.0%) |
| 35 to 64 Years | 41 (8.1%) | 8 (1.8%) |
| 65 to 74 Years | 4 (3.8%) | 9 (4.3%) |
| 75 Years and over | 41 (29.1%) | 79 (31.6%) |
Technology Access in Wilkesboro
Computing Device Access in Wilkesboro
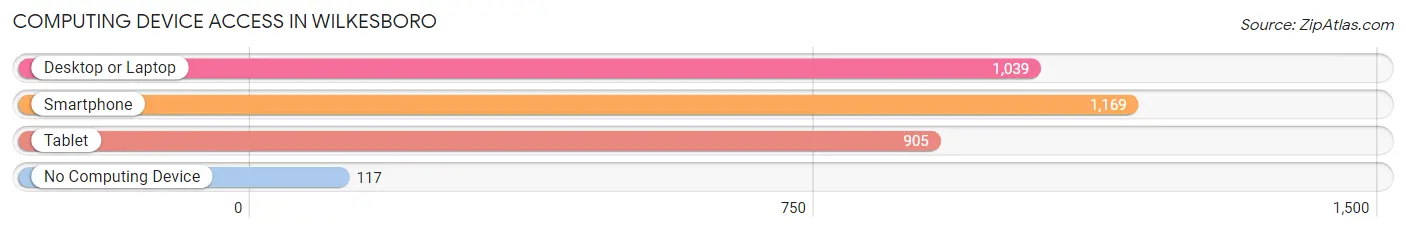
| Device Type | # Households | % Households |
| Desktop or Laptop | 1,039 | 71.6% |
| Smartphone | 1,169 | 80.5% |
| Tablet | 905 | 62.3% |
| No Computing Device | 117 | 8.1% |
| Total | 1,452 | 100.0% |
Internet Access in Wilkesboro
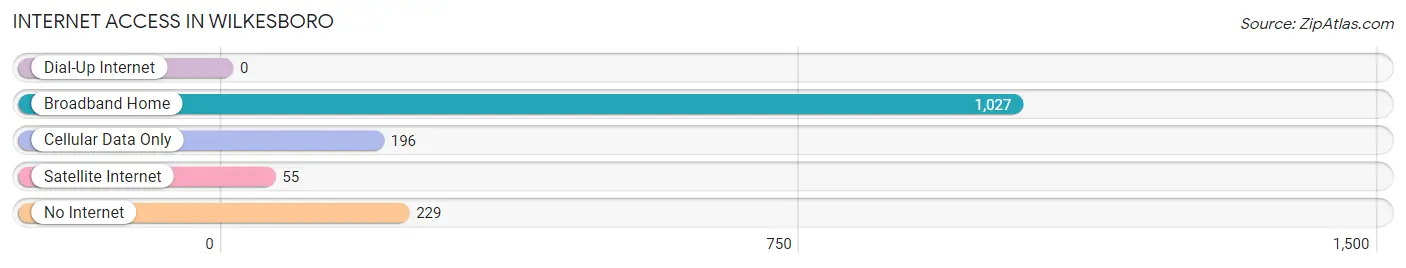
| Internet Type | # Households | % Households |
| Dial-Up Internet | 0 | 0.0% |
| Broadband Home | 1,027 | 70.7% |
| Cellular Data Only | 196 | 13.5% |
| Satellite Internet | 55 | 3.8% |
| No Internet | 229 | 15.8% |
| Total | 1,452 | 100.0% |
Wilkesboro Summary
Wilkesboro, NC is a small town located in the foothills of the Blue Ridge Mountains in Wilkes County, North Carolina. It is the county seat of Wilkes County and is located approximately 50 miles northwest of Winston-Salem. The town has a population of approximately 3,000 people and is the home of Wilkes Community College.
Geography
Wilkesboro is located in the foothills of the Blue Ridge Mountains in Wilkes County, North Carolina. The town is situated at an elevation of 1,000 feet and is surrounded by rolling hills and lush forests. The Yadkin River runs through the town and is a popular spot for fishing and boating. The town is also home to several parks, including Wilkesboro Town Park, which features a playground, picnic area, and walking trails.
Climate
Wilkesboro has a humid subtropical climate, with hot, humid summers and mild winters. The average high temperature in the summer is around 90 degrees Fahrenheit, while the average low temperature in the winter is around 30 degrees Fahrenheit. The town receives an average of 45 inches of precipitation per year, with most of it falling in the form of rain.
Economy
Wilkesboro’s economy is largely based on agriculture and tourism. The town is home to several farms, including apple orchards, vineyards, and dairy farms. The town is also home to several wineries, which attract tourists from all over the region. In addition, Wilkesboro is home to several manufacturing companies, including furniture and textile manufacturers.
Demographics
As of the 2010 census, Wilkesboro had a population of 3,073 people. The racial makeup of the town was 94.3% White, 2.7% African American, 0.3% Native American, 0.7% Asian, 0.1% Pacific Islander, and 1.9% from other races. The median household income was $30,938, and the median family income was $37,917.
Wilkesboro is a small town with a rich history and a vibrant economy. The town is home to several farms, wineries, and manufacturing companies, and is a popular tourist destination. The town is also home to Wilkes Community College, which provides educational opportunities to the residents of Wilkesboro and the surrounding area.
Common Questions
What is Per Capita Income in Wilkesboro?
Per Capita income in Wilkesboro is $28,240.
What is the Median Family Income in Wilkesboro?
Median Family Income in Wilkesboro is $67,585.
What is the Median Household income in Wilkesboro?
Median Household Income in Wilkesboro is $43,480.
What is Income or Wage Gap in Wilkesboro?
Income or Wage Gap in Wilkesboro is 7.1%.
Women in Wilkesboro earn 92.9 cents for every dollar earned by a man.
What is Inequality or Gini Index in Wilkesboro?
Inequality or Gini Index in Wilkesboro is 0.48.
What is the Total Population of Wilkesboro?
Total Population of Wilkesboro is 3,674.
What is the Total Male Population of Wilkesboro?
Total Male Population of Wilkesboro is 1,680.
What is the Total Female Population of Wilkesboro?
Total Female Population of Wilkesboro is 1,994.
What is the Ratio of Males per 100 Females in Wilkesboro?
There are 84.25 Males per 100 Females in Wilkesboro.
What is the Ratio of Females per 100 Males in Wilkesboro?
There are 118.69 Females per 100 Males in Wilkesboro.
What is the Median Population Age in Wilkesboro?
Median Population Age in Wilkesboro is 40.0 Years.
What is the Average Family Size in Wilkesboro
Average Family Size in Wilkesboro is 3.0 People.
What is the Average Household Size in Wilkesboro
Average Household Size in Wilkesboro is 2.3 People.
How Large is the Labor Force in Wilkesboro?
There are 1,635 People in the Labor Forcein in Wilkesboro.
What is the Percentage of People in the Labor Force in Wilkesboro?
54.4% of People are in the Labor Force in Wilkesboro.
What is the Unemployment Rate in Wilkesboro?
Unemployment Rate in Wilkesboro is 4.8%.