Weldon, NC Map & Demographics
Weldon Map
Weldon Overview
$20,453
PER CAPITA INCOME
$43,421
AVG FAMILY INCOME
$37,330
AVG HOUSEHOLD INCOME
20.1%
WAGE / INCOME GAP [ % ]
79.9¢/ $1
WAGE / INCOME GAP [ $ ]
0.46
INEQUALITY / GINI INDEX
1,536
TOTAL POPULATION
765
MALE POPULATION
771
FEMALE POPULATION
99.22
MALES / 100 FEMALES
100.78
FEMALES / 100 MALES
33.4
MEDIAN AGE
3.3
AVG FAMILY SIZE
2.8
AVG HOUSEHOLD SIZE
586
LABOR FORCE [ PEOPLE ]
48.7%
PERCENT IN LABOR FORCE
12.3%
UNEMPLOYMENT RATE
Weldon Zip Codes
Weldon Area Codes
Income in Weldon
Income Overview in Weldon
Per Capita Income in Weldon is $20,453, while median incomes of families and households are $43,421 and $37,330 respectively.
| Characteristic | Number | Measure |
| Per Capita Income | 1,536 | $20,453 |
| Median Family Income | 376 | $43,421 |
| Mean Family Income | 376 | $60,195 |
| Median Household Income | 542 | $37,330 |
| Mean Household Income | 542 | $52,282 |
| Income Deficit | 376 | $0 |
| Wage / Income Gap (%) | 1,536 | 20.07% |
| Wage / Income Gap ($) | 1,536 | 79.93¢ per $1 |
| Gini / Inequality Index | 1,536 | 0.46 |
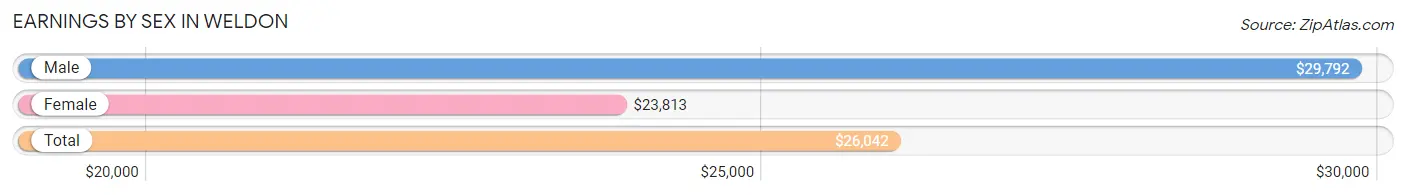
Earnings by Sex in Weldon
Average Earnings in Weldon are $26,042, $29,792 for men and $23,813 for women, a difference of 20.1%.
| Sex | Number | Average Earnings |
| Male | 272 (46.0%) | $29,792 |
| Female | 319 (54.0%) | $23,813 |
| Total | 591 (100.0%) | $26,042 |
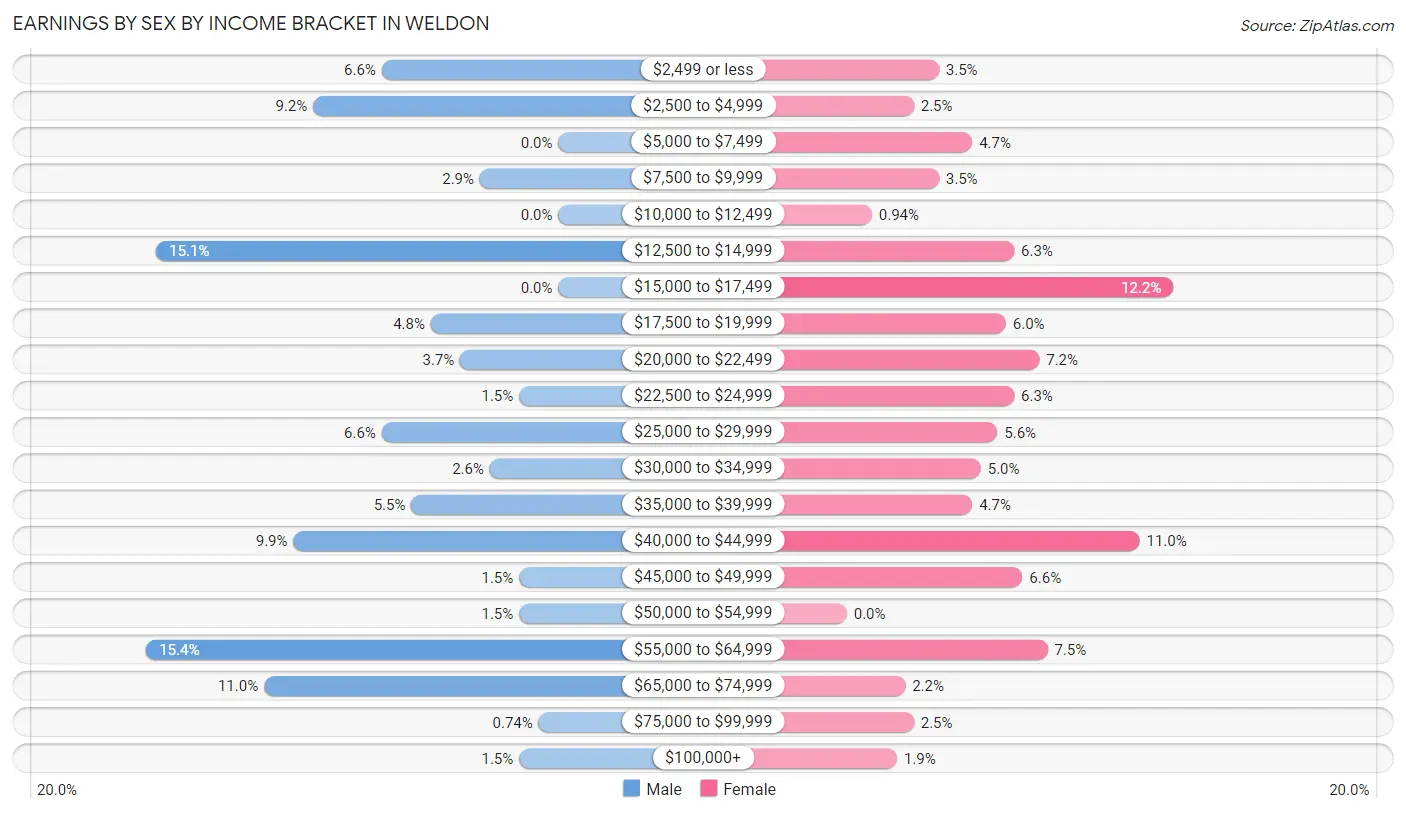
Earnings by Sex by Income Bracket in Weldon
The most common earnings brackets in Weldon are $55,000 to $64,999 for men (42 | 15.4%) and $15,000 to $17,499 for women (39 | 12.2%).
| Income | Male | Female |
| $2,499 or less | 18 (6.6%) | 11 (3.5%) |
| $2,500 to $4,999 | 25 (9.2%) | 8 (2.5%) |
| $5,000 to $7,499 | 0 (0.0%) | 15 (4.7%) |
| $7,500 to $9,999 | 8 (2.9%) | 11 (3.5%) |
| $10,000 to $12,499 | 0 (0.0%) | 3 (0.9%) |
| $12,500 to $14,999 | 41 (15.1%) | 20 (6.3%) |
| $15,000 to $17,499 | 0 (0.0%) | 39 (12.2%) |
| $17,500 to $19,999 | 13 (4.8%) | 19 (6.0%) |
| $20,000 to $22,499 | 10 (3.7%) | 23 (7.2%) |
| $22,500 to $24,999 | 4 (1.5%) | 20 (6.3%) |
| $25,000 to $29,999 | 18 (6.6%) | 18 (5.6%) |
| $30,000 to $34,999 | 7 (2.6%) | 16 (5.0%) |
| $35,000 to $39,999 | 15 (5.5%) | 15 (4.7%) |
| $40,000 to $44,999 | 27 (9.9%) | 35 (11.0%) |
| $45,000 to $49,999 | 4 (1.5%) | 21 (6.6%) |
| $50,000 to $54,999 | 4 (1.5%) | 0 (0.0%) |
| $55,000 to $64,999 | 42 (15.4%) | 24 (7.5%) |
| $65,000 to $74,999 | 30 (11.0%) | 7 (2.2%) |
| $75,000 to $99,999 | 2 (0.7%) | 8 (2.5%) |
| $100,000+ | 4 (1.5%) | 6 (1.9%) |
| Total | 272 (100.0%) | 319 (100.0%) |
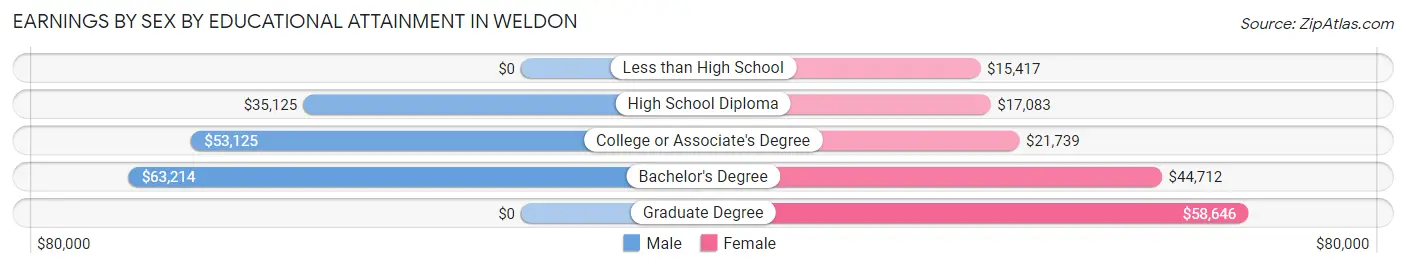
Earnings by Sex by Educational Attainment in Weldon
Average earnings in Weldon are $40,313 for men and $26,042 for women, a difference of 35.4%. Men with an educational attainment of bachelor's degree enjoy the highest average annual earnings of $63,214, while those with high school diploma education earn the least with $35,125. Women with an educational attainment of graduate degree earn the most with the average annual earnings of $58,646, while those with less than high school education have the smallest earnings of $15,417.
| Educational Attainment | Male Income | Female Income |
| Less than High School | - | - |
| High School Diploma | $35,125 | $17,083 |
| College or Associate's Degree | $53,125 | $21,739 |
| Bachelor's Degree | $63,214 | $44,712 |
| Graduate Degree | - | - |
| Total | $40,313 | $26,042 |
Family Income in Weldon
Family Income Brackets in Weldon
According to the Weldon family income data, there are 99 families falling into the $35,000 to $49,999 income range, which is the most common income bracket and makes up 26.3% of all families. Conversely, the $200,000+ income bracket is the least frequent group with only 7 families (1.9%) belonging to this category.
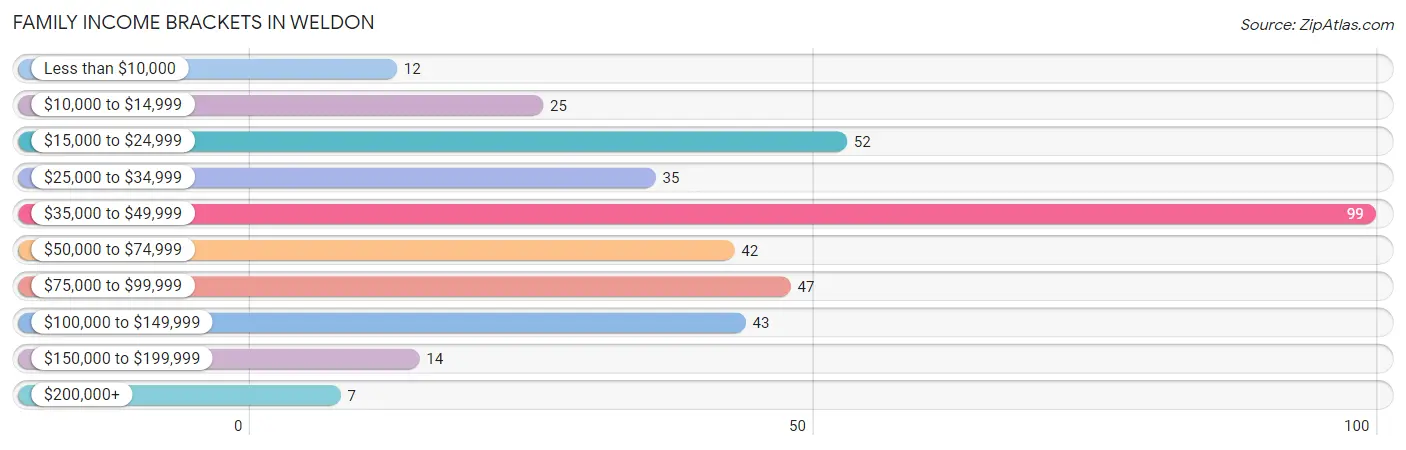
| Income Bracket | # Families | % Families |
| Less than $10,000 | 12 | 3.2% |
| $10,000 to $14,999 | 25 | 6.6% |
| $15,000 to $24,999 | 52 | 13.8% |
| $25,000 to $34,999 | 35 | 9.3% |
| $35,000 to $49,999 | 99 | 26.3% |
| $50,000 to $74,999 | 42 | 11.2% |
| $75,000 to $99,999 | 47 | 12.5% |
| $100,000 to $149,999 | 43 | 11.4% |
| $150,000 to $199,999 | 14 | 3.7% |
| $200,000+ | 7 | 1.9% |
Family Income by Famaliy Size in Weldon
2-person families (181 | 48.1%) account for the highest median family income in Weldon with $49,028 per family, while 2-person families (181 | 48.1%) have the highest median income of $24,514 per family member.
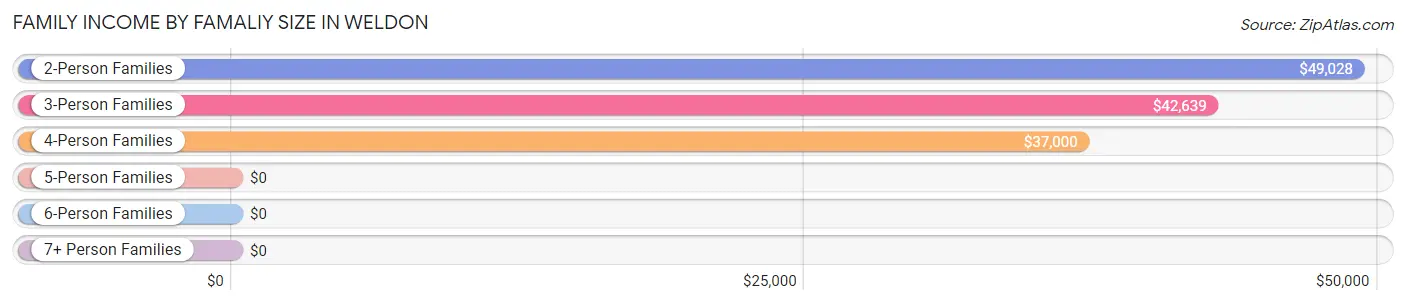
| Income Bracket | # Families | Median Income |
| 2-Person Families | 181 (48.1%) | $49,028 |
| 3-Person Families | 93 (24.7%) | $42,639 |
| 4-Person Families | 80 (21.3%) | $37,000 |
| 5-Person Families | 12 (3.2%) | $0 |
| 6-Person Families | 3 (0.8%) | $0 |
| 7+ Person Families | 7 (1.9%) | $0 |
| Total | 376 (100.0%) | $43,421 |
Family Income by Number of Earners in Weldon
The median family income in Weldon is $43,421, with families comprising 3+ earners (31) having the highest median family income of $113,438, while families with no earners (100) have the lowest median family income of $31,750, accounting for 8.2% and 26.6% of families, respectively.
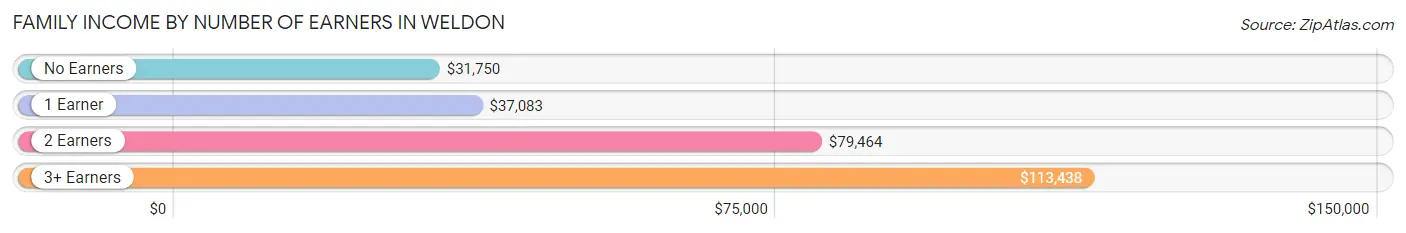
| Number of Earners | # Families | Median Income |
| No Earners | 100 (26.6%) | $31,750 |
| 1 Earner | 156 (41.5%) | $37,083 |
| 2 Earners | 89 (23.7%) | $79,464 |
| 3+ Earners | 31 (8.2%) | $113,438 |
| Total | 376 (100.0%) | $43,421 |
Household Income in Weldon
Household Income Brackets in Weldon
With 125 households falling in the category, the $35,000 to $49,999 income range is the most frequent in Weldon, accounting for 23.1% of all households. In contrast, only 7 households (1.3%) fall into the $200,000+ income bracket, making it the least populous group.
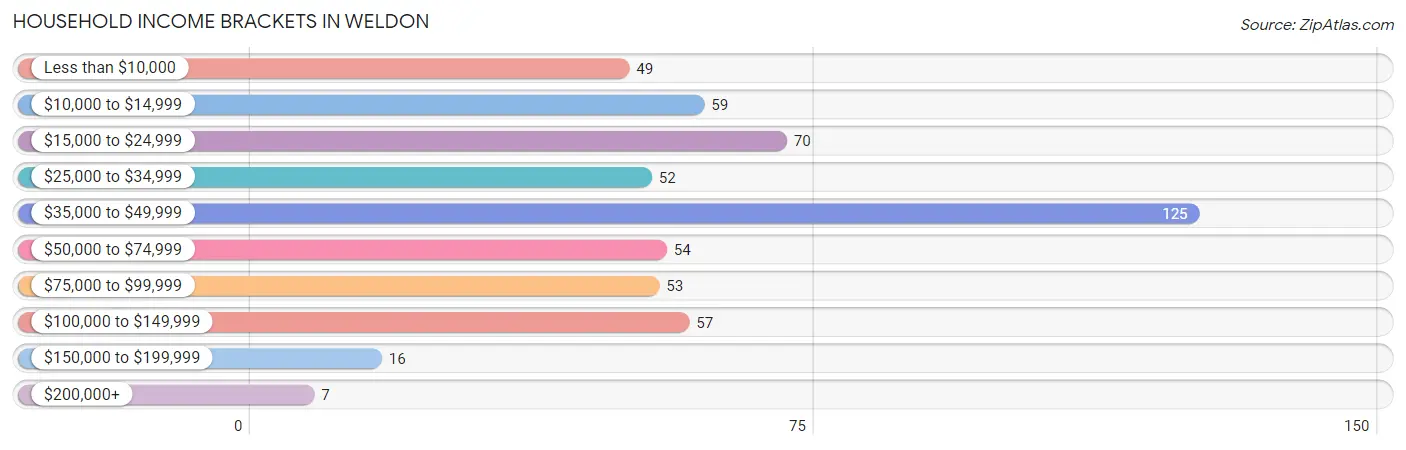
| Income Bracket | # Households | % Households |
| Less than $10,000 | 49 | 9.0% |
| $10,000 to $14,999 | 59 | 10.9% |
| $15,000 to $24,999 | 70 | 12.9% |
| $25,000 to $34,999 | 52 | 9.6% |
| $35,000 to $49,999 | 125 | 23.1% |
| $50,000 to $74,999 | 54 | 10.0% |
| $75,000 to $99,999 | 53 | 9.8% |
| $100,000 to $149,999 | 57 | 10.5% |
| $150,000 to $199,999 | 16 | 3.0% |
| $200,000+ | 7 | 1.3% |
Household Income by Householder Age in Weldon
The median household income in Weldon is $37,330, with the highest median household income of $57,578 found in the 65+ years age bracket for the primary householder. A total of 153 households (28.2%) fall into this category. Meanwhile, the 15 to 24 years age bracket for the primary householder has the lowest median household income of $0, with 13 households (2.4%) in this group.
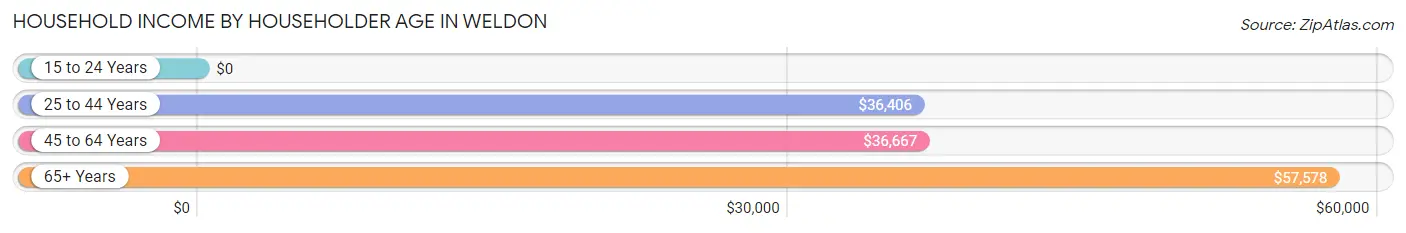
| Income Bracket | # Households | Median Income |
| 15 to 24 Years | 13 (2.4%) | $0 |
| 25 to 44 Years | 154 (28.4%) | $36,406 |
| 45 to 64 Years | 222 (41.0%) | $36,667 |
| 65+ Years | 153 (28.2%) | $57,578 |
| Total | 542 (100.0%) | $37,330 |
Poverty in Weldon
Income Below Poverty by Sex and Age in Weldon
With 28.7% poverty level for males and 30.1% for females among the residents of Weldon, 6 to 11 year old males and 6 to 11 year old females are the most vulnerable to poverty, with 27 males (100.0%) and 19 females (100.0%) in their respective age groups living below the poverty level.
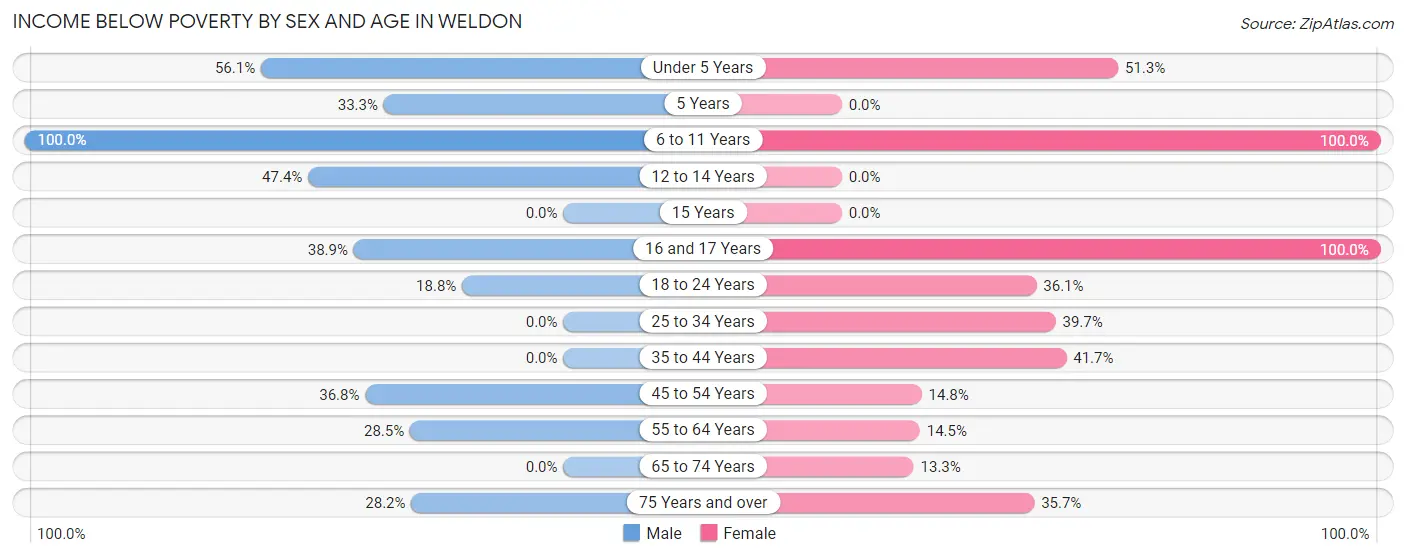
| Age Bracket | Male | Female |
| Under 5 Years | 55 (56.1%) | 40 (51.3%) |
| 5 Years | 3 (33.3%) | 0 (0.0%) |
| 6 to 11 Years | 27 (100.0%) | 19 (100.0%) |
| 12 to 14 Years | 9 (47.4%) | 0 (0.0%) |
| 15 Years | 0 (0.0%) | 0 (0.0%) |
| 16 and 17 Years | 14 (38.9%) | 15 (100.0%) |
| 18 to 24 Years | 37 (18.8%) | 13 (36.1%) |
| 25 to 34 Years | 0 (0.0%) | 48 (39.7%) |
| 35 to 44 Years | 0 (0.0%) | 30 (41.7%) |
| 45 to 54 Years | 25 (36.8%) | 8 (14.8%) |
| 55 to 64 Years | 35 (28.5%) | 21 (14.5%) |
| 65 to 74 Years | 0 (0.0%) | 8 (13.3%) |
| 75 Years and over | 11 (28.2%) | 20 (35.7%) |
| Total | 216 (28.7%) | 222 (30.1%) |
Income Above Poverty by Sex and Age in Weldon
According to the poverty statistics in Weldon, males aged 25 to 34 years and females aged 5 years are the age groups that are most secure financially, with 100.0% of males and 100.0% of females in these age groups living above the poverty line.
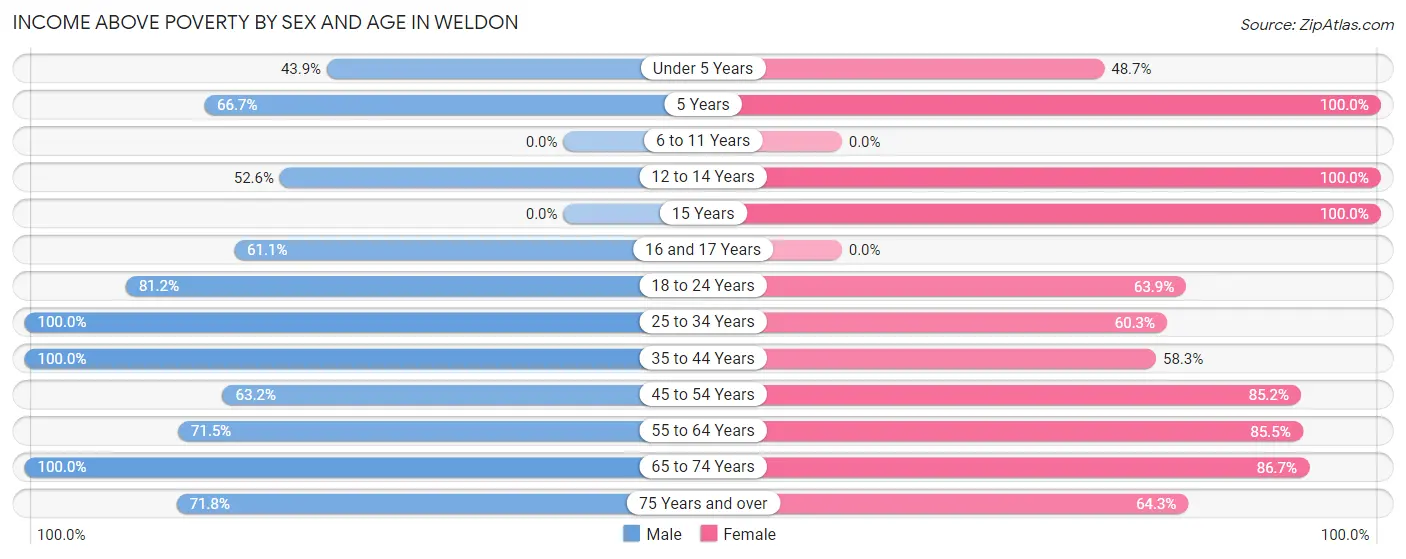
| Age Bracket | Male | Female |
| Under 5 Years | 43 (43.9%) | 38 (48.7%) |
| 5 Years | 6 (66.7%) | 9 (100.0%) |
| 6 to 11 Years | 0 (0.0%) | 0 (0.0%) |
| 12 to 14 Years | 10 (52.6%) | 14 (100.0%) |
| 15 Years | 0 (0.0%) | 59 (100.0%) |
| 16 and 17 Years | 22 (61.1%) | 0 (0.0%) |
| 18 to 24 Years | 160 (81.2%) | 23 (63.9%) |
| 25 to 34 Years | 44 (100.0%) | 73 (60.3%) |
| 35 to 44 Years | 47 (100.0%) | 42 (58.3%) |
| 45 to 54 Years | 43 (63.2%) | 46 (85.2%) |
| 55 to 64 Years | 88 (71.5%) | 124 (85.5%) |
| 65 to 74 Years | 45 (100.0%) | 52 (86.7%) |
| 75 Years and over | 28 (71.8%) | 36 (64.3%) |
| Total | 536 (71.3%) | 516 (69.9%) |
Income Below Poverty Among Married-Couple Families in Weldon
The poverty statistics for married-couple families in Weldon show that 4.1% or 7 of the total 171 families live below the poverty line. Families with 3 or 4 children have the highest poverty rate of 50.0%, comprising of 7 families. On the other hand, families with no children have the lowest poverty rate of 0.0%, which includes 0 families.
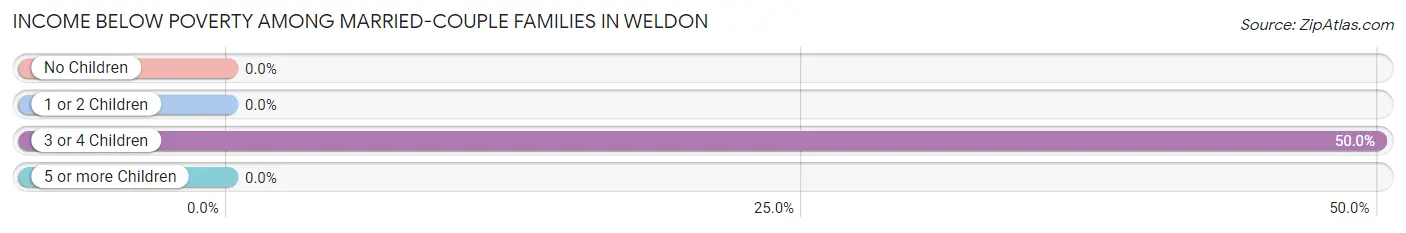
| Children | Above Poverty | Below Poverty |
| No Children | 128 (100.0%) | 0 (0.0%) |
| 1 or 2 Children | 29 (100.0%) | 0 (0.0%) |
| 3 or 4 Children | 7 (50.0%) | 7 (50.0%) |
| 5 or more Children | 0 (0.0%) | 0 (0.0%) |
| Total | 164 (95.9%) | 7 (4.1%) |
Income Below Poverty Among Single-Parent Households in Weldon
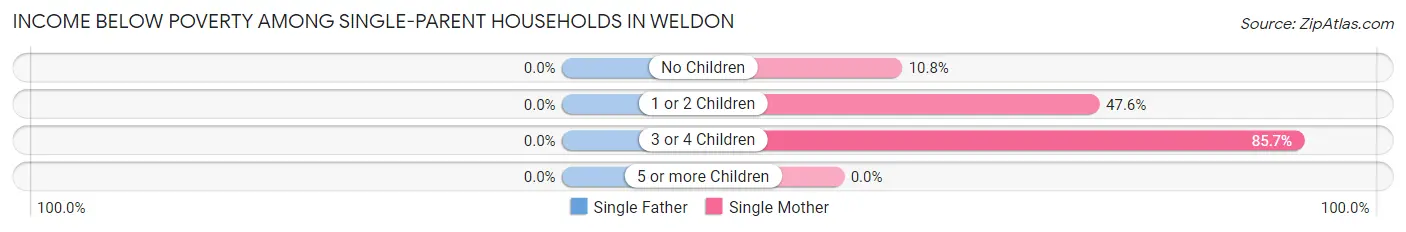
| Children | Single Father | Single Mother |
| No Children | 0 (0.0%) | 4 (10.8%) |
| 1 or 2 Children | 0 (0.0%) | 59 (47.6%) |
| 3 or 4 Children | 0 (0.0%) | 24 (85.7%) |
| 5 or more Children | 0 (0.0%) | 0 (0.0%) |
| Total | 0 (0.0%) | 87 (46.0%) |
Income Below Poverty Among Married-Couple vs Single-Parent Households in Weldon
The poverty data for Weldon shows that 7 of the married-couple family households (4.1%) and 87 of the single-parent households (42.4%) are living below the poverty level. Within the married-couple family households, those with 3 or 4 children have the highest poverty rate, with 7 households (50.0%) falling below the poverty line. Among the single-parent households, those with 3 or 4 children have the highest poverty rate, with 24 household (85.7%) living below poverty.
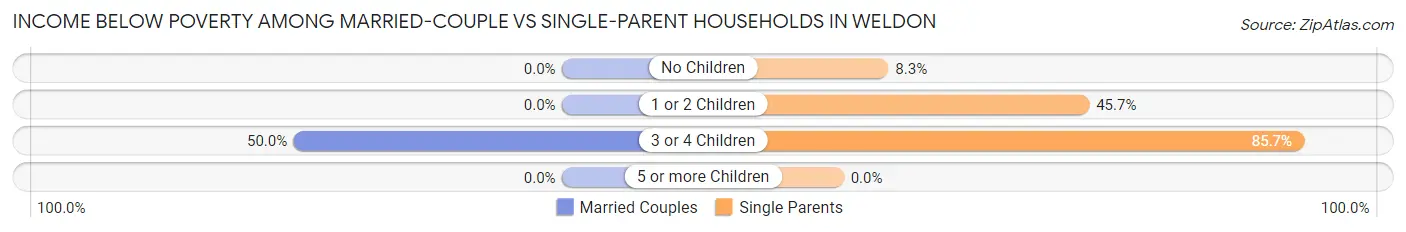
| Children | Married-Couple Families | Single-Parent Households |
| No Children | 0 (0.0%) | 4 (8.3%) |
| 1 or 2 Children | 0 (0.0%) | 59 (45.7%) |
| 3 or 4 Children | 7 (50.0%) | 24 (85.7%) |
| 5 or more Children | 0 (0.0%) | 0 (0.0%) |
| Total | 7 (4.1%) | 87 (42.4%) |
Race in Weldon
The most populous races in Weldon are Black / African American (1,172 | 76.3%), White / Caucasian (331 | 21.5%), and Some other Race (22 | 1.4%).
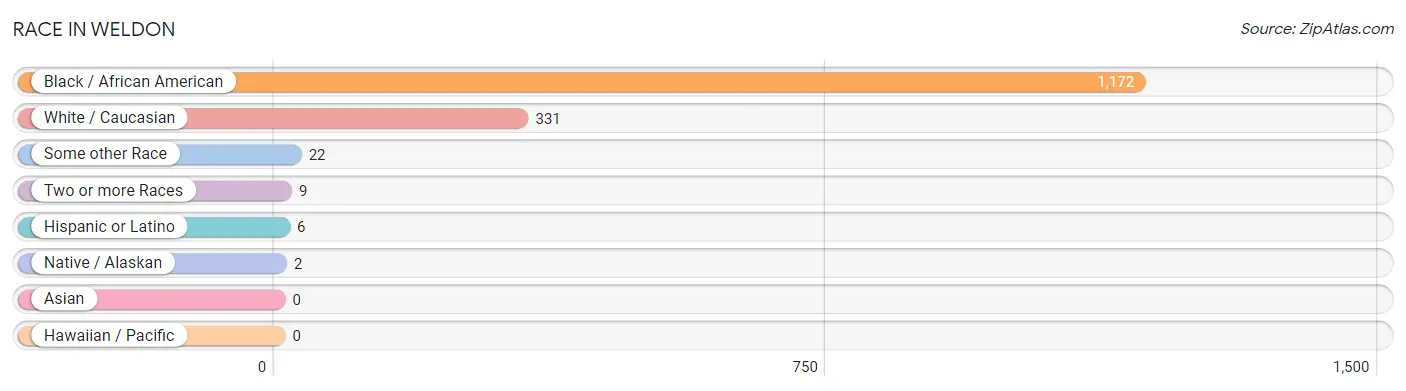
| Race | # Population | % Population |
| Asian | 0 | 0.0% |
| Black / African American | 1,172 | 76.3% |
| Hawaiian / Pacific | 0 | 0.0% |
| Hispanic or Latino | 6 | 0.4% |
| Native / Alaskan | 2 | 0.1% |
| White / Caucasian | 331 | 21.5% |
| Two or more Races | 9 | 0.6% |
| Some other Race | 22 | 1.4% |
| Total | 1,536 | 100.0% |
Ancestry in Weldon
The most populous ancestries reported in Weldon are American (350 | 22.8%), Irish (99 | 6.5%), German (72 | 4.7%), English (65 | 4.2%), and Scotch-Irish (18 | 1.2%), together accounting for 39.3% of all Weldon residents.
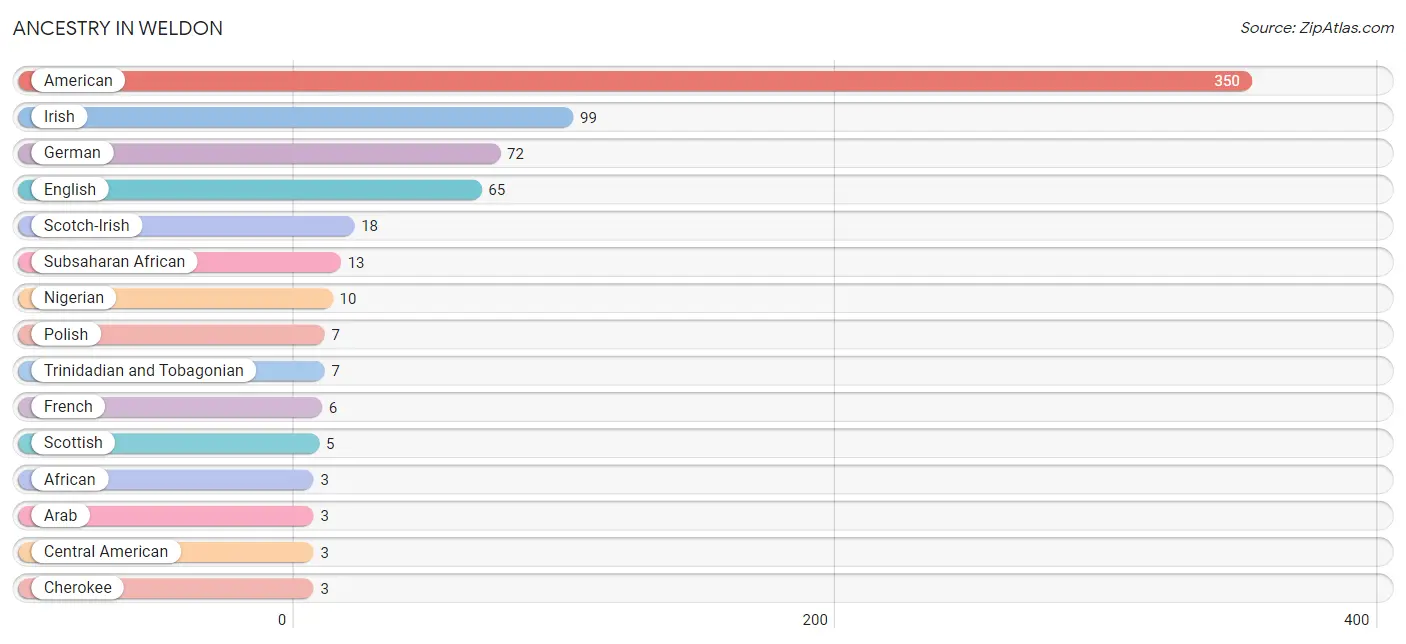
| Ancestry | # Population | % Population |
| African | 3 | 0.2% |
| American | 350 | 22.8% |
| Arab | 3 | 0.2% |
| Central American | 3 | 0.2% |
| Cherokee | 3 | 0.2% |
| Cuban | 3 | 0.2% |
| English | 65 | 4.2% |
| French | 6 | 0.4% |
| German | 72 | 4.7% |
| Honduran | 3 | 0.2% |
| Irish | 99 | 6.5% |
| Italian | 1 | 0.1% |
| Lebanese | 3 | 0.2% |
| Nigerian | 10 | 0.6% |
| Polish | 7 | 0.5% |
| Portuguese | 2 | 0.1% |
| Scotch-Irish | 18 | 1.2% |
| Scottish | 5 | 0.3% |
| Subsaharan African | 13 | 0.9% |
| Trinidadian and Tobagonian | 7 | 0.5% |
| Welsh | 2 | 0.1% | View All 21 Rows |
Immigrants in Weldon
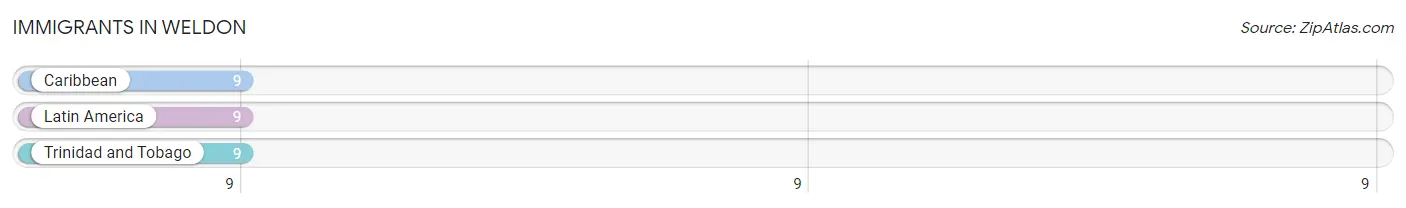
The most numerous immigrant groups reported in Weldon came from Caribbean (9 | 0.6%), Latin America (9 | 0.6%), and Trinidad and Tobago (9 | 0.6%), together accounting for 1.8% of all Weldon residents.
| Immigration Origin | # Population | % Population |
| Caribbean | 9 | 0.6% |
| Latin America | 9 | 0.6% |
| Trinidad and Tobago | 9 | 0.6% | View All 3 Rows |
Sex and Age in Weldon
Sex and Age in Weldon
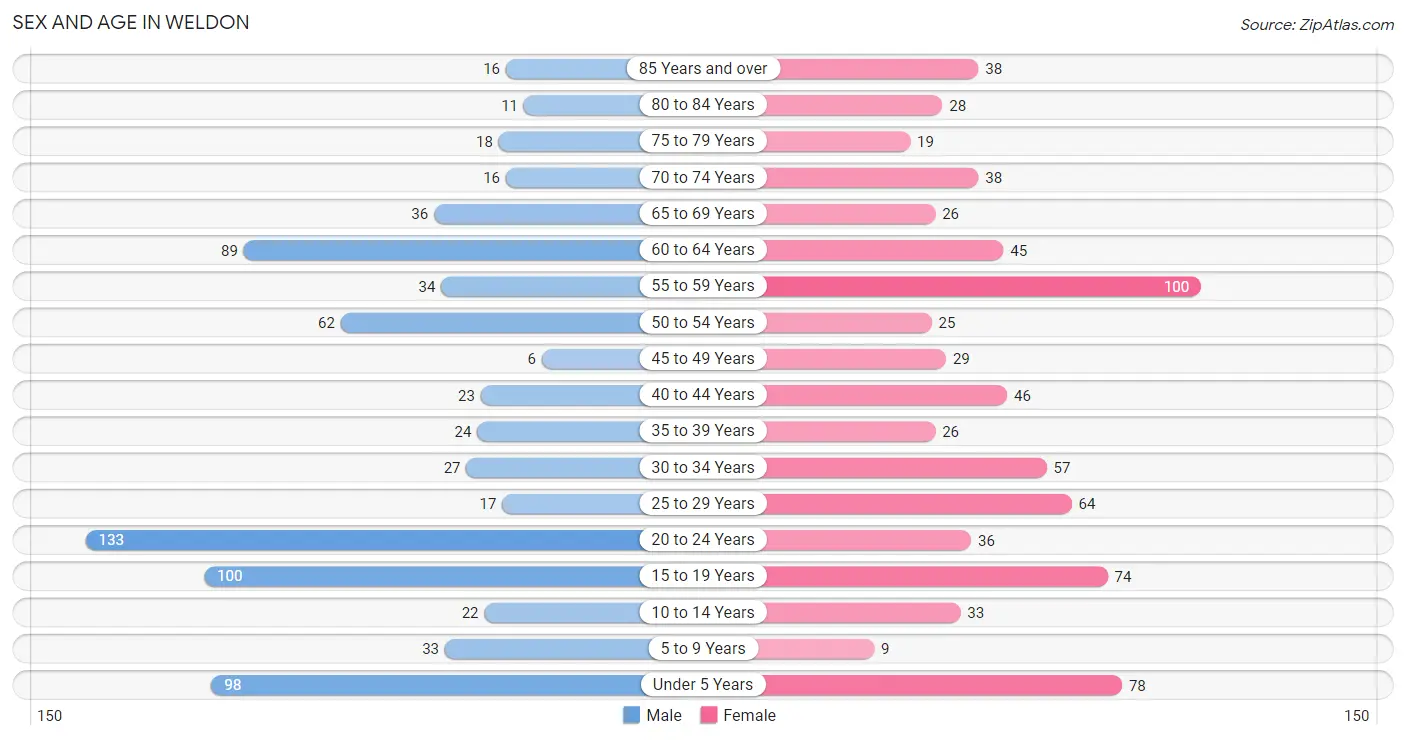
The most populous age groups in Weldon are 20 to 24 Years (133 | 17.4%) for men and 55 to 59 Years (100 | 13.0%) for women.
| Age Bracket | Male | Female |
| Under 5 Years | 98 (12.8%) | 78 (10.1%) |
| 5 to 9 Years | 33 (4.3%) | 9 (1.2%) |
| 10 to 14 Years | 22 (2.9%) | 33 (4.3%) |
| 15 to 19 Years | 100 (13.1%) | 74 (9.6%) |
| 20 to 24 Years | 133 (17.4%) | 36 (4.7%) |
| 25 to 29 Years | 17 (2.2%) | 64 (8.3%) |
| 30 to 34 Years | 27 (3.5%) | 57 (7.4%) |
| 35 to 39 Years | 24 (3.1%) | 26 (3.4%) |
| 40 to 44 Years | 23 (3.0%) | 46 (6.0%) |
| 45 to 49 Years | 6 (0.8%) | 29 (3.8%) |
| 50 to 54 Years | 62 (8.1%) | 25 (3.2%) |
| 55 to 59 Years | 34 (4.4%) | 100 (13.0%) |
| 60 to 64 Years | 89 (11.6%) | 45 (5.8%) |
| 65 to 69 Years | 36 (4.7%) | 26 (3.4%) |
| 70 to 74 Years | 16 (2.1%) | 38 (4.9%) |
| 75 to 79 Years | 18 (2.4%) | 19 (2.5%) |
| 80 to 84 Years | 11 (1.4%) | 28 (3.6%) |
| 85 Years and over | 16 (2.1%) | 38 (4.9%) |
| Total | 765 (100.0%) | 771 (100.0%) |
Families and Households in Weldon
Median Family Size in Weldon
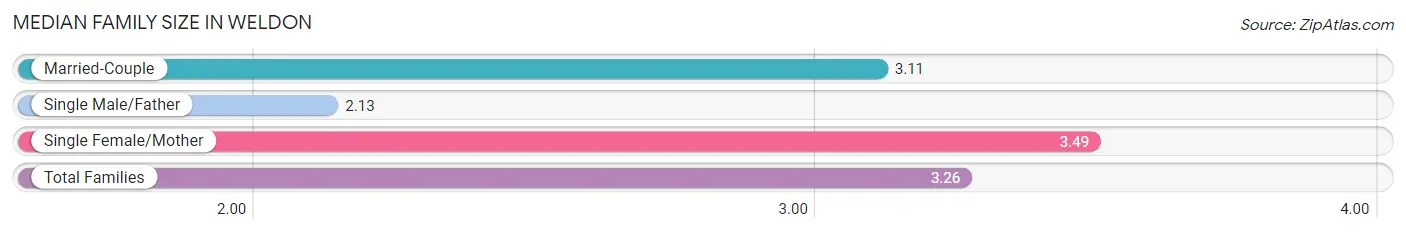
The median family size in Weldon is 3.26 persons per family, with single female/mother families (189 | 50.3%) accounting for the largest median family size of 3.49 persons per family. On the other hand, single male/father families (16 | 4.3%) represent the smallest median family size with 2.13 persons per family.
| Family Type | # Families | Family Size |
| Married-Couple | 171 (45.5%) | 3.11 |
| Single Male/Father | 16 (4.3%) | 2.13 |
| Single Female/Mother | 189 (50.3%) | 3.49 |
| Total Families | 376 (100.0%) | 3.26 |
Median Household Size in Weldon
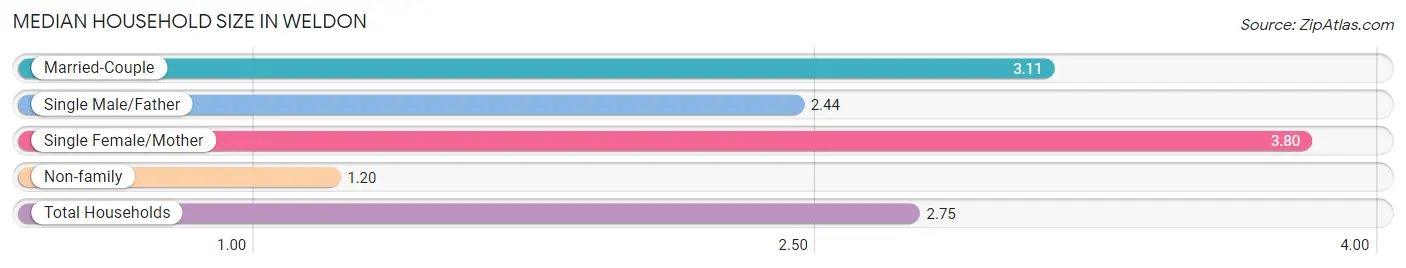
The median household size in Weldon is 2.75 persons per household, with single female/mother households (189 | 34.9%) accounting for the largest median household size of 3.8 persons per household. non-family households (166 | 30.6%) represent the smallest median household size with 1.20 persons per household.
| Household Type | # Households | Household Size |
| Married-Couple | 171 (31.6%) | 3.11 |
| Single Male/Father | 16 (2.9%) | 2.44 |
| Single Female/Mother | 189 (34.9%) | 3.80 |
| Non-family | 166 (30.6%) | 1.20 |
| Total Households | 542 (100.0%) | 2.75 |
Household Size by Marriage Status in Weldon
Out of a total of 542 households in Weldon, 376 (69.4%) are family households, while 166 (30.6%) are nonfamily households. The most numerous type of family households are 2-person households, comprising 168, and the most common type of nonfamily households are 1-person households, comprising 124.
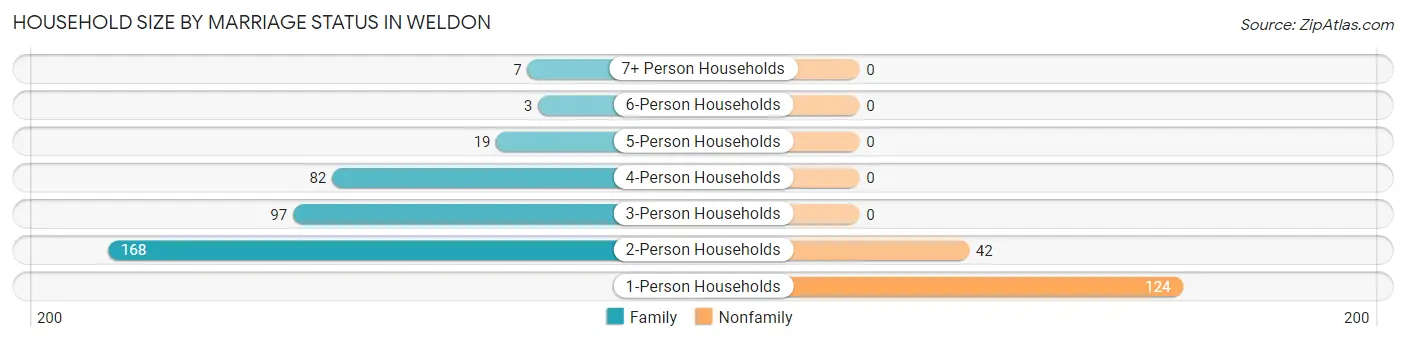
| Household Size | Family Households | Nonfamily Households |
| 1-Person Households | - | 124 (22.9%) |
| 2-Person Households | 168 (31.0%) | 42 (7.7%) |
| 3-Person Households | 97 (17.9%) | 0 (0.0%) |
| 4-Person Households | 82 (15.1%) | 0 (0.0%) |
| 5-Person Households | 19 (3.5%) | 0 (0.0%) |
| 6-Person Households | 3 (0.5%) | 0 (0.0%) |
| 7+ Person Households | 7 (1.3%) | 0 (0.0%) |
| Total | 376 (69.4%) | 166 (30.6%) |
Female Fertility in Weldon
Fertility by Age in Weldon
Average fertility rate in Weldon is 196.0 births per 1,000 women. Women in the age bracket of 20 to 34 years have the highest fertility rate with 420.0 births per 1,000 women. Women in the age bracket of 20 to 34 years acount for 100.0% of all women with births.
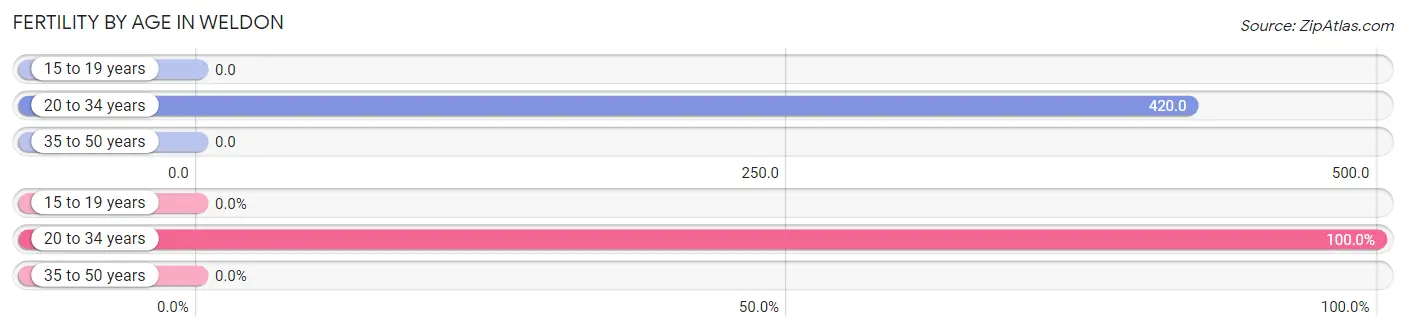
| Age Bracket | Women with Births | Births / 1,000 Women |
| 15 to 19 years | 0 (0.0%) | 0.0 |
| 20 to 34 years | 66 (100.0%) | 420.0 |
| 35 to 50 years | 0 (0.0%) | 0.0 |
| Total | 66 (100.0%) | 196.0 |
Fertility by Age by Marriage Status in Weldon
6.1% of women with births (66) in Weldon are married. The highest percentage of unmarried women with births falls into 20 to 34 years age bracket with 93.9% of them unmarried at the time of birth, while the lowest percentage of unmarried women with births belong to 20 to 34 years age bracket with 93.9% of them unmarried.
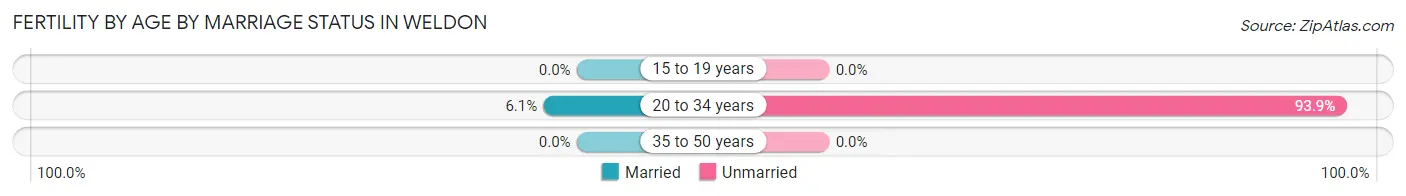
| Age Bracket | Married | Unmarried |
| 15 to 19 years | 0 (0.0%) | 0 (0.0%) |
| 20 to 34 years | 4 (6.1%) | 62 (93.9%) |
| 35 to 50 years | 0 (0.0%) | 0 (0.0%) |
| Total | 4 (6.1%) | 62 (93.9%) |
Fertility by Education in Weldon
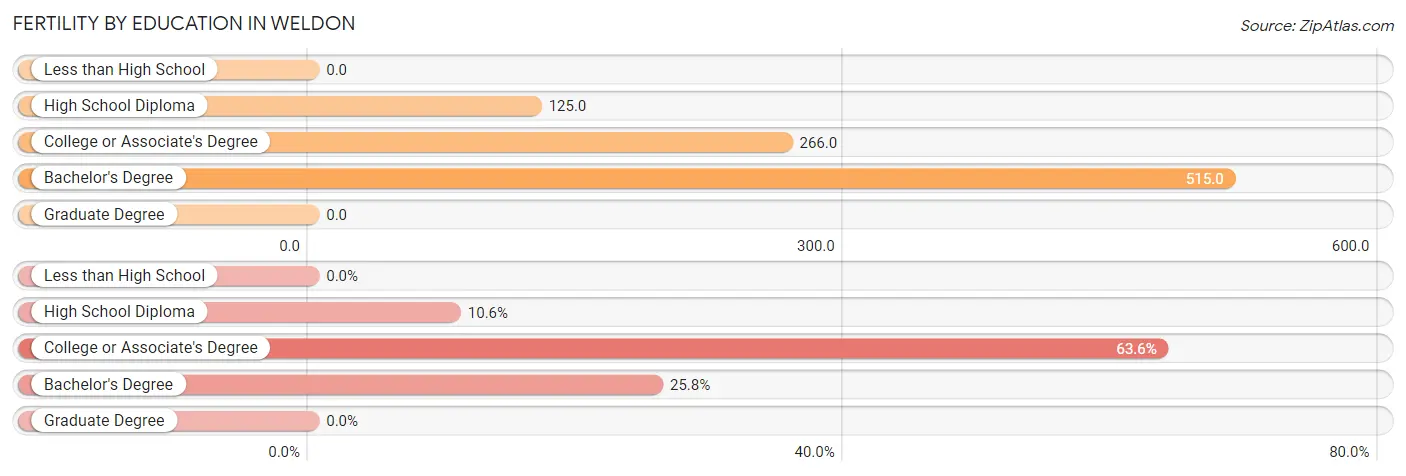
| Educational Attainment | Women with Births | Births / 1,000 Women |
| Less than High School | 0 (0.0%) | 0.0 |
| High School Diploma | 7 (10.6%) | 125.0 |
| College or Associate's Degree | 42 (63.6%) | 266.0 |
| Bachelor's Degree | 17 (25.8%) | 515.0 |
| Graduate Degree | 0 (0.0%) | 0.0 |
| Total | 66 (100.0%) | 196.0 |
Fertility by Education by Marriage Status in Weldon
93.9% of women with births in Weldon are unmarried. Women with the educational attainment of bachelor's degree are most likely to be married with 23.5% of them married at childbirth, while women with the educational attainment of high school diploma are least likely to be married with 100.0% of them unmarried at childbirth.
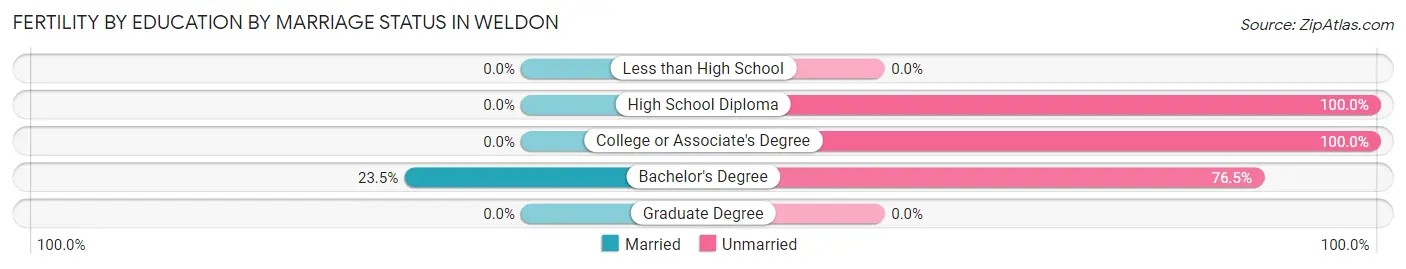
| Educational Attainment | Married | Unmarried |
| Less than High School | 0 (0.0%) | 0 (0.0%) |
| High School Diploma | 0 (0.0%) | 7 (100.0%) |
| College or Associate's Degree | 0 (0.0%) | 42 (100.0%) |
| Bachelor's Degree | 4 (23.5%) | 13 (76.5%) |
| Graduate Degree | 0 (0.0%) | 0 (0.0%) |
| Total | 4 (6.1%) | 62 (93.9%) |
Employment Characteristics in Weldon
Employment by Class of Employer in Weldon
Among the 514 employed individuals in Weldon, private company employees (319 | 62.1%), local government employees (90 | 17.5%), and state government employees (36 | 7.0%) make up the most common classes of employment.
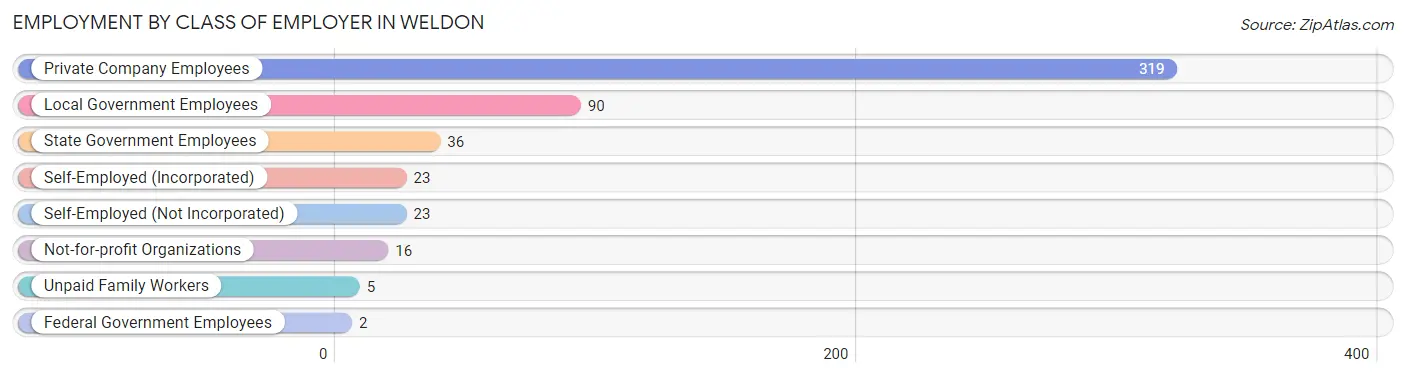
| Employer Class | # Employees | % Employees |
| Private Company Employees | 319 | 62.1% |
| Self-Employed (Incorporated) | 23 | 4.5% |
| Self-Employed (Not Incorporated) | 23 | 4.5% |
| Not-for-profit Organizations | 16 | 3.1% |
| Local Government Employees | 90 | 17.5% |
| State Government Employees | 36 | 7.0% |
| Federal Government Employees | 2 | 0.4% |
| Unpaid Family Workers | 5 | 1.0% |
| Total | 514 | 100.0% |
Employment Status by Age in Weldon
According to the labor force statistics for Weldon, out of the total population over 16 years of age (1,204), 48.7% or 586 individuals are in the labor force, with 12.3% or 72 of them unemployed. The age group with the highest labor force participation rate is 25 to 29 years, with 100.0% or 81 individuals in the labor force. Within the labor force, the 20 to 24 years age range has the highest percentage of unemployed individuals, with 32.6% or 30 of them being unemployed.
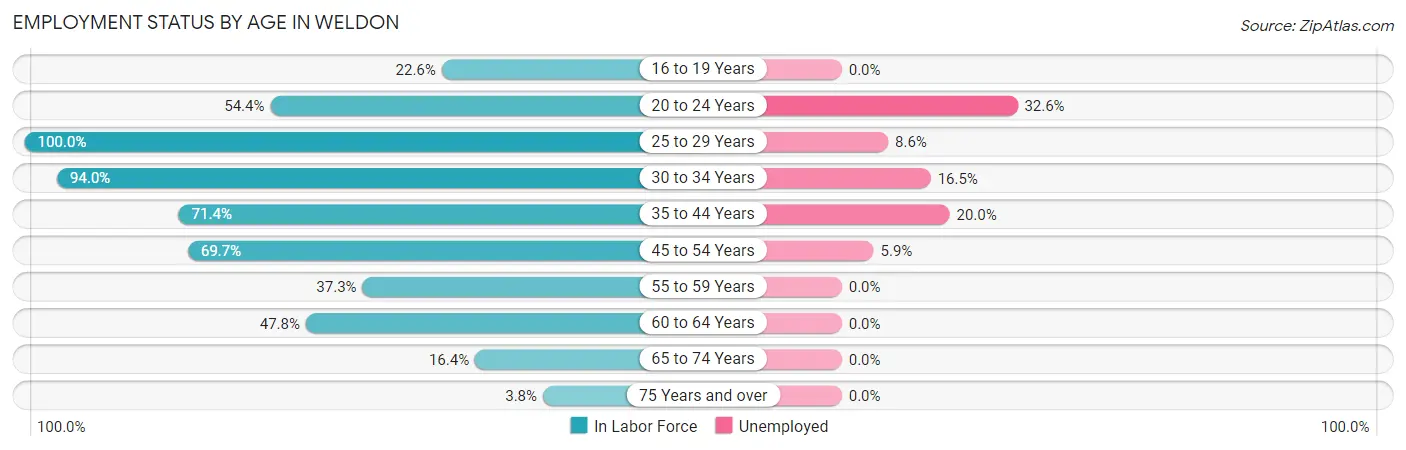
| Age Bracket | In Labor Force | Unemployed |
| 16 to 19 Years | 26 (22.6%) | 0 (0.0%) |
| 20 to 24 Years | 92 (54.4%) | 30 (32.6%) |
| 25 to 29 Years | 81 (100.0%) | 7 (8.6%) |
| 30 to 34 Years | 79 (94.0%) | 13 (16.5%) |
| 35 to 44 Years | 85 (71.4%) | 17 (20.0%) |
| 45 to 54 Years | 85 (69.7%) | 5 (5.9%) |
| 55 to 59 Years | 50 (37.3%) | 0 (0.0%) |
| 60 to 64 Years | 64 (47.8%) | 0 (0.0%) |
| 65 to 74 Years | 19 (16.4%) | 0 (0.0%) |
| 75 Years and over | 5 (3.8%) | 0 (0.0%) |
| Total | 586 (48.7%) | 72 (12.3%) |
Employment Status by Educational Attainment in Weldon
According to labor force statistics for Weldon, 65.9% of individuals (444) out of the total population between 25 and 64 years of age (674) are in the labor force, with 9.5% or 42 of them being unemployed. The group with the highest labor force participation rate are those with the educational attainment of bachelor's degree or higher, with 82.0% or 100 individuals in the labor force. Within the labor force, individuals with less than high school education have the highest percentage of unemployment, with 56.3% or 9 of them being unemployed.
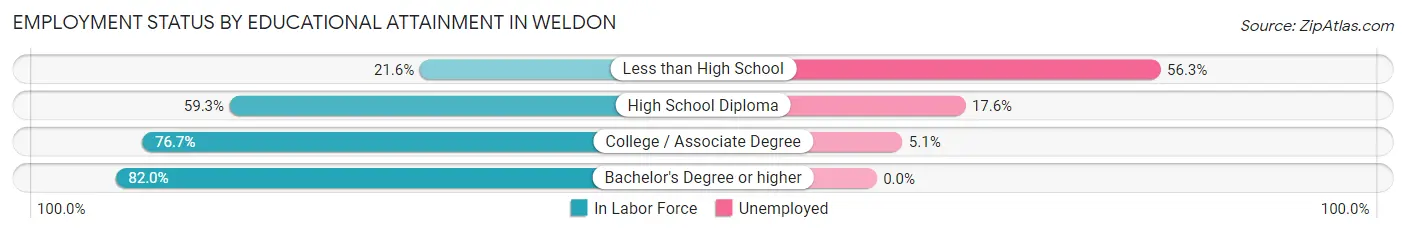
| Educational Attainment | In Labor Force | Unemployed |
| Less than High School | 16 (21.6%) | 42 (56.3%) |
| High School Diploma | 131 (59.3%) | 39 (17.6%) |
| College / Associate Degree | 197 (76.7%) | 13 (5.1%) |
| Bachelor's Degree or higher | 100 (82.0%) | 0 (0.0%) |
| Total | 444 (65.9%) | 64 (9.5%) |
Employment Occupations by Sex in Weldon
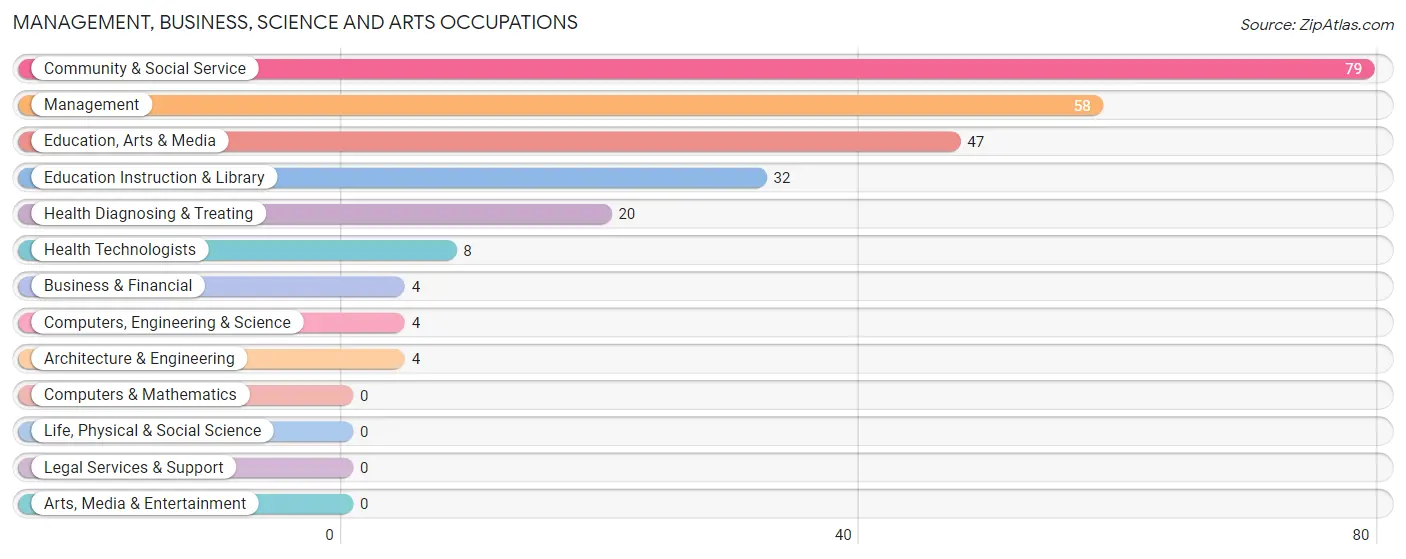
Management, Business, Science and Arts Occupations
The most common Management, Business, Science and Arts occupations in Weldon are Community & Social Service (79 | 15.4%), Management (58 | 11.3%), Education, Arts & Media (47 | 9.1%), Education Instruction & Library (32 | 6.2%), and Health Diagnosing & Treating (20 | 3.9%).
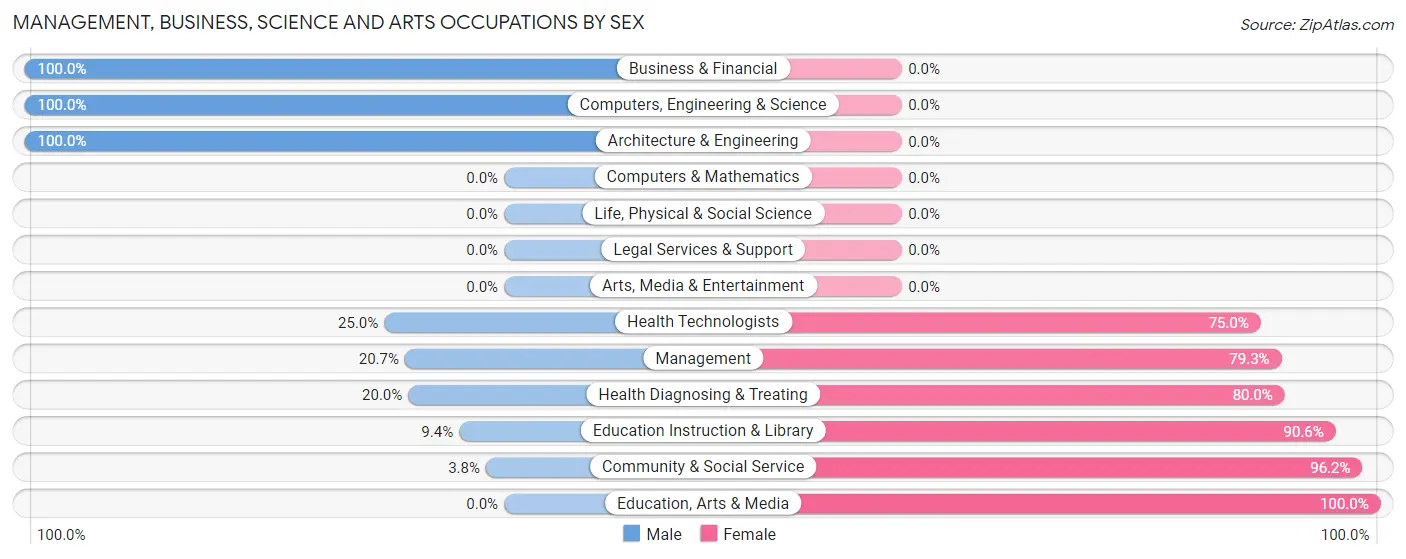
Management, Business, Science and Arts Occupations by Sex
Within the Management, Business, Science and Arts occupations in Weldon, the most male-oriented occupations are Business & Financial (100.0%), Computers, Engineering & Science (100.0%), and Architecture & Engineering (100.0%), while the most female-oriented occupations are Education, Arts & Media (100.0%), Community & Social Service (96.2%), and Education Instruction & Library (90.6%).
| Occupation | Male | Female |
| Management | 12 (20.7%) | 46 (79.3%) |
| Business & Financial | 4 (100.0%) | 0 (0.0%) |
| Computers, Engineering & Science | 4 (100.0%) | 0 (0.0%) |
| Computers & Mathematics | 0 (0.0%) | 0 (0.0%) |
| Architecture & Engineering | 4 (100.0%) | 0 (0.0%) |
| Life, Physical & Social Science | 0 (0.0%) | 0 (0.0%) |
| Community & Social Service | 3 (3.8%) | 76 (96.2%) |
| Education, Arts & Media | 0 (0.0%) | 47 (100.0%) |
| Legal Services & Support | 0 (0.0%) | 0 (0.0%) |
| Education Instruction & Library | 3 (9.4%) | 29 (90.6%) |
| Arts, Media & Entertainment | 0 (0.0%) | 0 (0.0%) |
| Health Diagnosing & Treating | 4 (20.0%) | 16 (80.0%) |
| Health Technologists | 2 (25.0%) | 6 (75.0%) |
| Total (Category) | 27 (16.4%) | 138 (83.6%) |
| Total (Overall) | 231 (44.9%) | 283 (55.1%) |
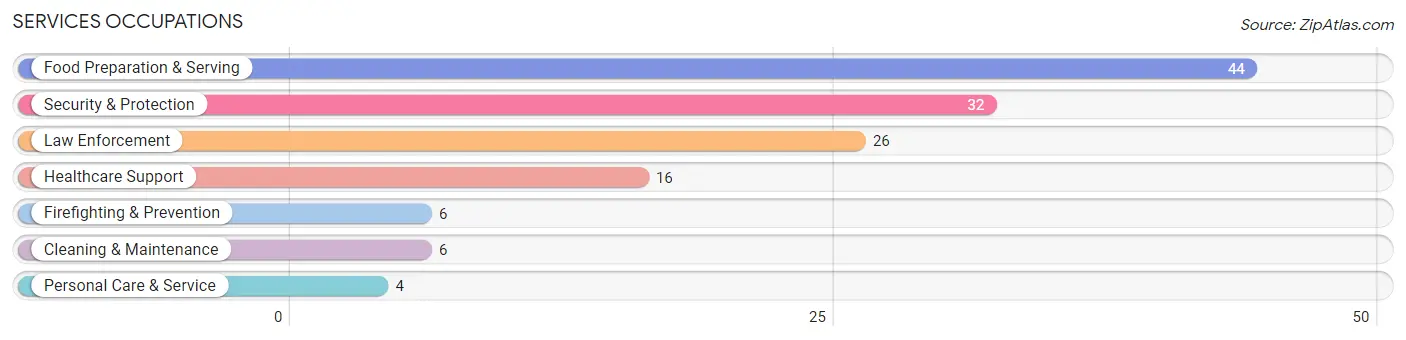
Services Occupations
The most common Services occupations in Weldon are Food Preparation & Serving (44 | 8.6%), Security & Protection (32 | 6.2%), Law Enforcement (26 | 5.1%), Healthcare Support (16 | 3.1%), and Firefighting & Prevention (6 | 1.2%).
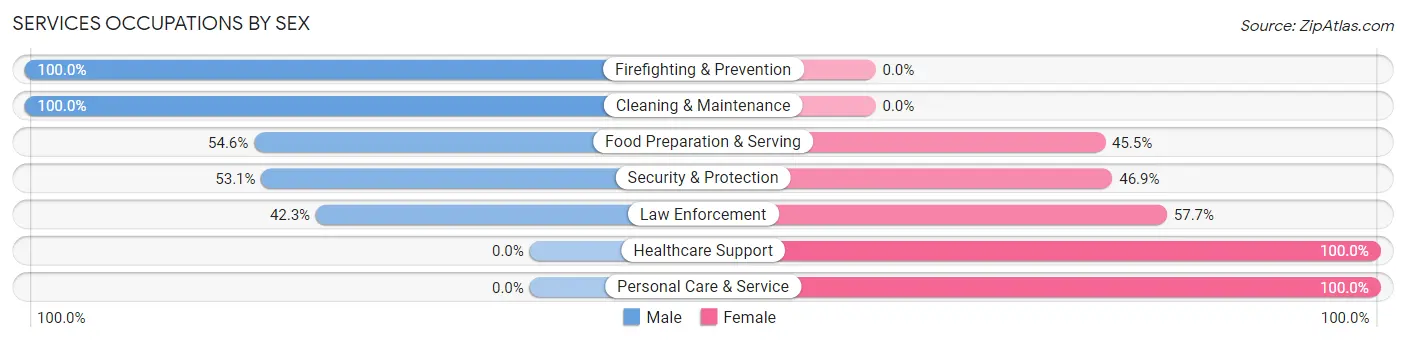
Services Occupations by Sex
Within the Services occupations in Weldon, the most male-oriented occupations are Firefighting & Prevention (100.0%), Cleaning & Maintenance (100.0%), and Food Preparation & Serving (54.5%), while the most female-oriented occupations are Healthcare Support (100.0%), Personal Care & Service (100.0%), and Law Enforcement (57.7%).
| Occupation | Male | Female |
| Healthcare Support | 0 (0.0%) | 16 (100.0%) |
| Security & Protection | 17 (53.1%) | 15 (46.9%) |
| Firefighting & Prevention | 6 (100.0%) | 0 (0.0%) |
| Law Enforcement | 11 (42.3%) | 15 (57.7%) |
| Food Preparation & Serving | 24 (54.5%) | 20 (45.5%) |
| Cleaning & Maintenance | 6 (100.0%) | 0 (0.0%) |
| Personal Care & Service | 0 (0.0%) | 4 (100.0%) |
| Total (Category) | 47 (46.1%) | 55 (53.9%) |
| Total (Overall) | 231 (44.9%) | 283 (55.1%) |
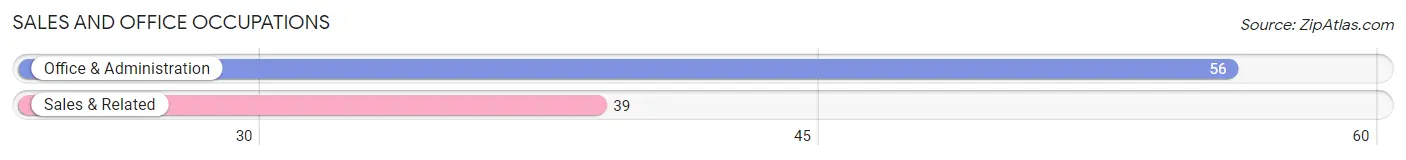
Sales and Office Occupations
The most common Sales and Office occupations in Weldon are Office & Administration (56 | 10.9%), and Sales & Related (39 | 7.6%).
Sales and Office Occupations by Sex
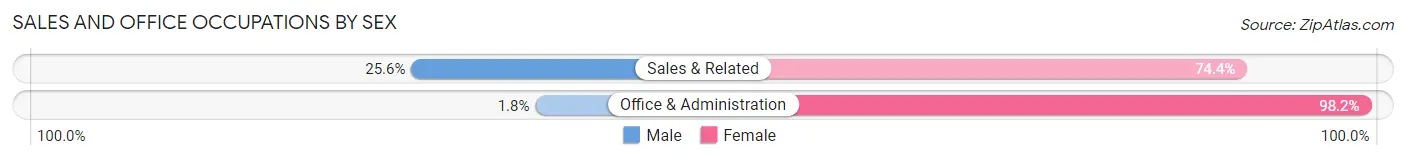
| Occupation | Male | Female |
| Sales & Related | 10 (25.6%) | 29 (74.4%) |
| Office & Administration | 1 (1.8%) | 55 (98.2%) |
| Total (Category) | 11 (11.6%) | 84 (88.4%) |
| Total (Overall) | 231 (44.9%) | 283 (55.1%) |
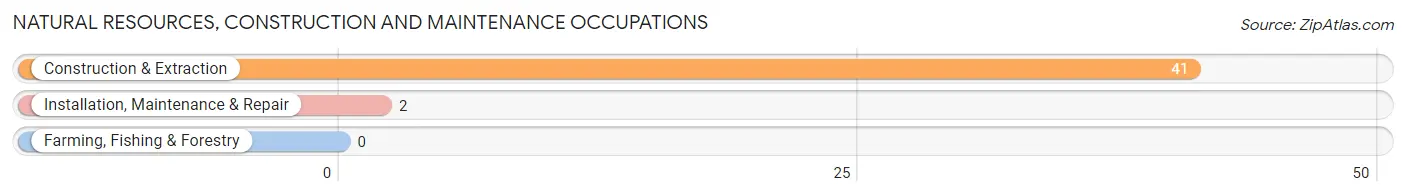
Natural Resources, Construction and Maintenance Occupations
The most common Natural Resources, Construction and Maintenance occupations in Weldon are Construction & Extraction (41 | 8.0%), and Installation, Maintenance & Repair (2 | 0.4%).
Natural Resources, Construction and Maintenance Occupations by Sex
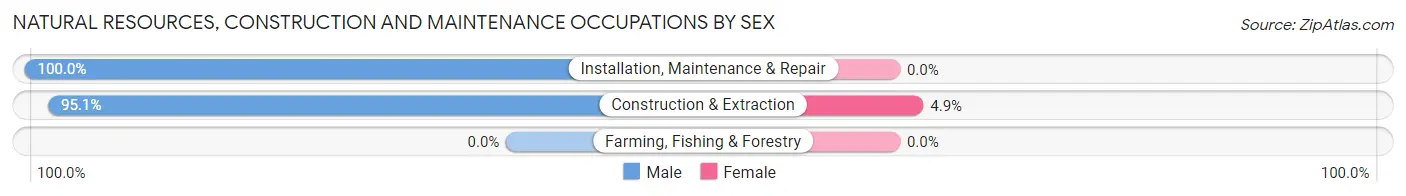
| Occupation | Male | Female |
| Farming, Fishing & Forestry | 0 (0.0%) | 0 (0.0%) |
| Construction & Extraction | 39 (95.1%) | 2 (4.9%) |
| Installation, Maintenance & Repair | 2 (100.0%) | 0 (0.0%) |
| Total (Category) | 41 (95.4%) | 2 (4.6%) |
| Total (Overall) | 231 (44.9%) | 283 (55.1%) |
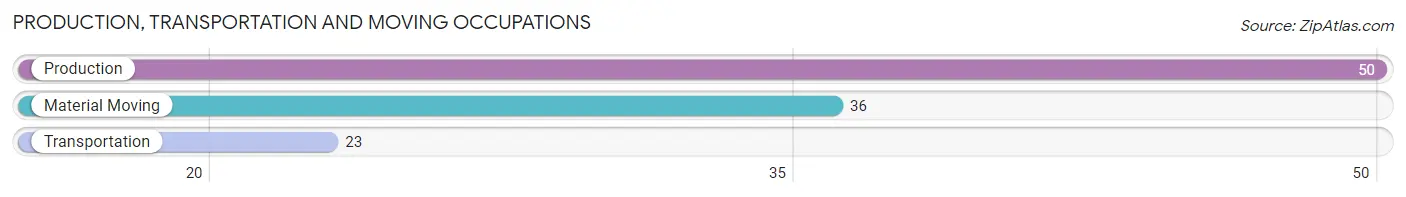
Production, Transportation and Moving Occupations
The most common Production, Transportation and Moving occupations in Weldon are Production (50 | 9.7%), Material Moving (36 | 7.0%), and Transportation (23 | 4.5%).
Production, Transportation and Moving Occupations by Sex
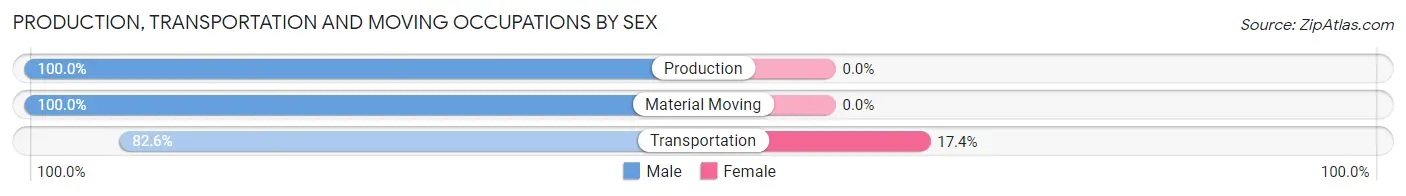
| Occupation | Male | Female |
| Production | 50 (100.0%) | 0 (0.0%) |
| Transportation | 19 (82.6%) | 4 (17.4%) |
| Material Moving | 36 (100.0%) | 0 (0.0%) |
| Total (Category) | 105 (96.3%) | 4 (3.7%) |
| Total (Overall) | 231 (44.9%) | 283 (55.1%) |
Employment Industries by Sex in Weldon
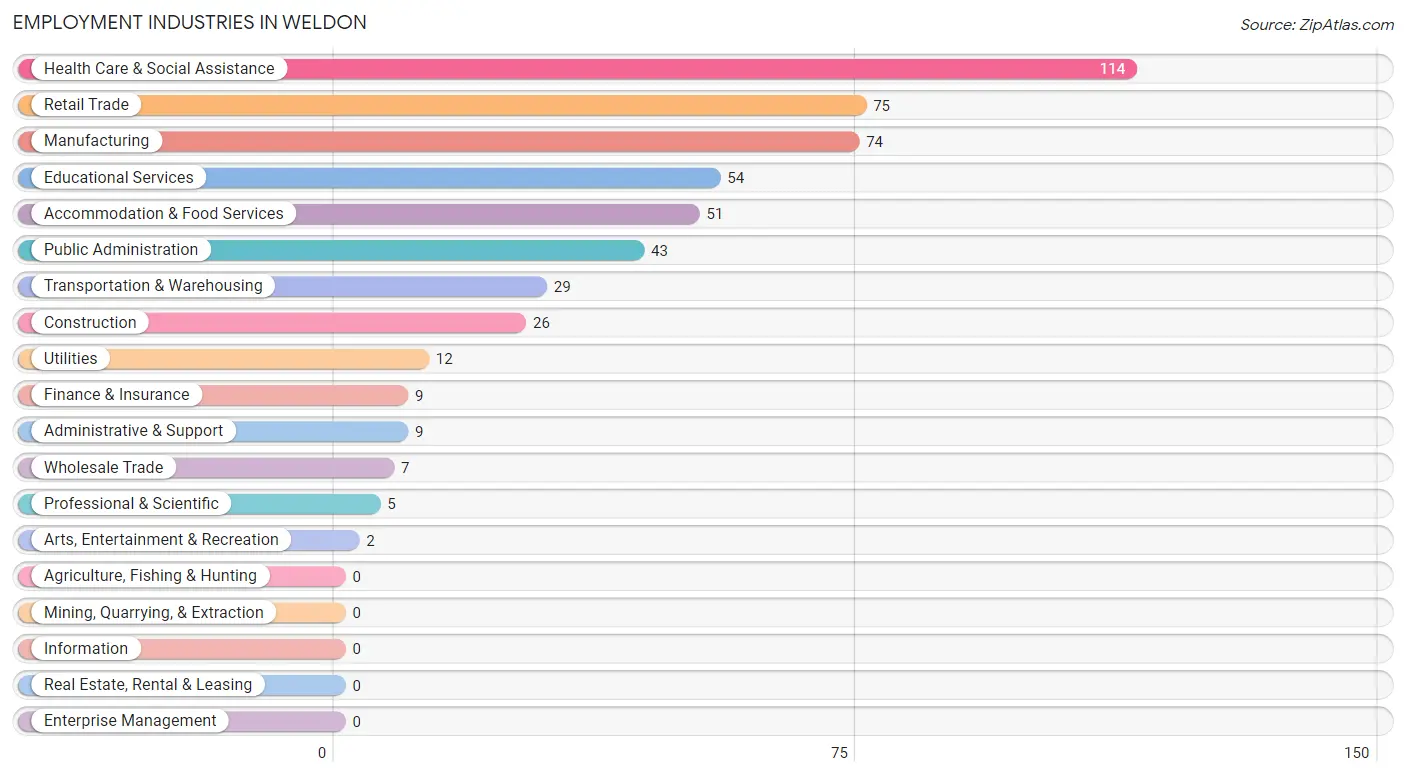
Employment Industries in Weldon
The major employment industries in Weldon include Health Care & Social Assistance (114 | 22.2%), Retail Trade (75 | 14.6%), Manufacturing (74 | 14.4%), Educational Services (54 | 10.5%), and Accommodation & Food Services (51 | 9.9%).
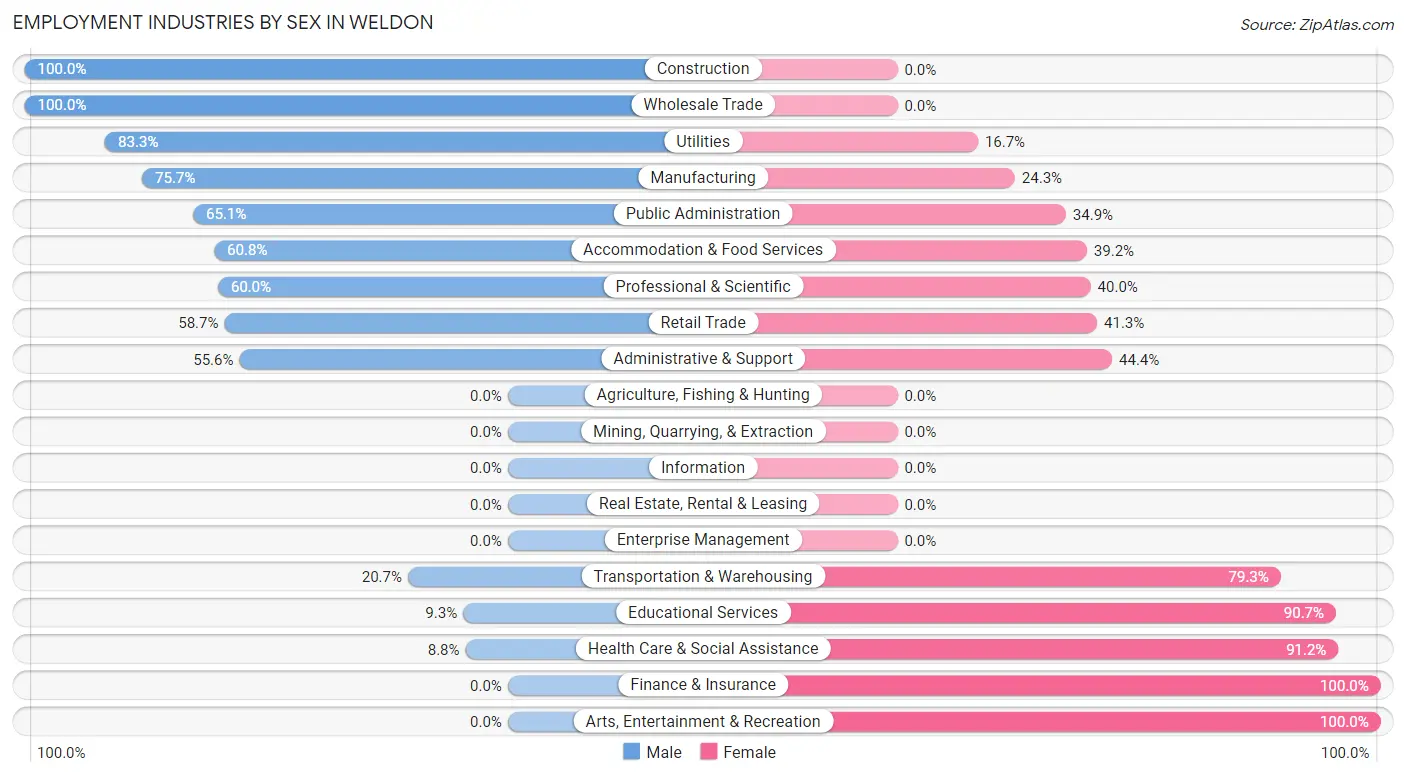
Employment Industries by Sex in Weldon
The Weldon industries that see more men than women are Construction (100.0%), Wholesale Trade (100.0%), and Utilities (83.3%), whereas the industries that tend to have a higher number of women are Finance & Insurance (100.0%), Arts, Entertainment & Recreation (100.0%), and Health Care & Social Assistance (91.2%).
| Industry | Male | Female |
| Agriculture, Fishing & Hunting | 0 (0.0%) | 0 (0.0%) |
| Mining, Quarrying, & Extraction | 0 (0.0%) | 0 (0.0%) |
| Construction | 26 (100.0%) | 0 (0.0%) |
| Manufacturing | 56 (75.7%) | 18 (24.3%) |
| Wholesale Trade | 7 (100.0%) | 0 (0.0%) |
| Retail Trade | 44 (58.7%) | 31 (41.3%) |
| Transportation & Warehousing | 6 (20.7%) | 23 (79.3%) |
| Utilities | 10 (83.3%) | 2 (16.7%) |
| Information | 0 (0.0%) | 0 (0.0%) |
| Finance & Insurance | 0 (0.0%) | 9 (100.0%) |
| Real Estate, Rental & Leasing | 0 (0.0%) | 0 (0.0%) |
| Professional & Scientific | 3 (60.0%) | 2 (40.0%) |
| Enterprise Management | 0 (0.0%) | 0 (0.0%) |
| Administrative & Support | 5 (55.6%) | 4 (44.4%) |
| Educational Services | 5 (9.3%) | 49 (90.7%) |
| Health Care & Social Assistance | 10 (8.8%) | 104 (91.2%) |
| Arts, Entertainment & Recreation | 0 (0.0%) | 2 (100.0%) |
| Accommodation & Food Services | 31 (60.8%) | 20 (39.2%) |
| Public Administration | 28 (65.1%) | 15 (34.9%) |
| Total | 231 (44.9%) | 283 (55.1%) |
Education in Weldon
School Enrollment in Weldon
The most common levels of schooling among the 373 students in Weldon are high school (111 | 29.8%), college / undergraduate (107 | 28.7%), and middle school (85 | 22.8%).
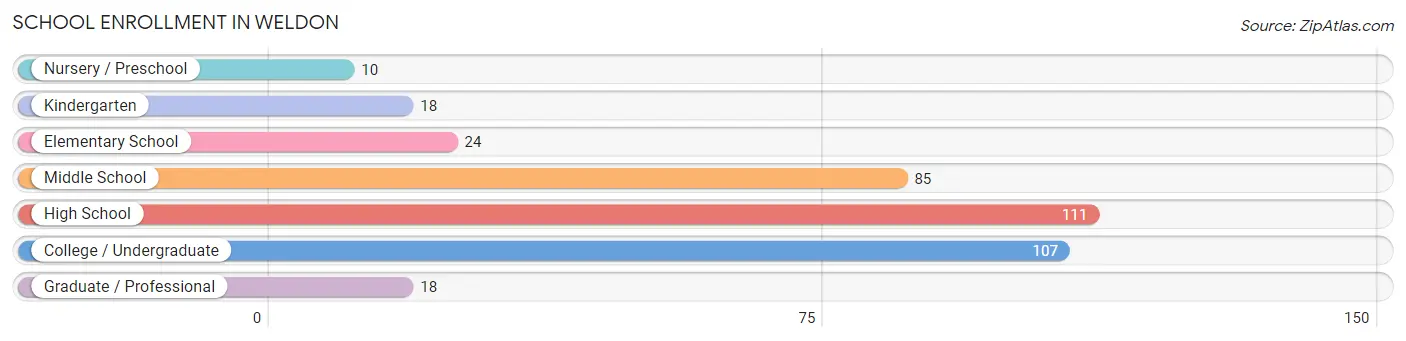
| School Level | # Students | % Students |
| Nursery / Preschool | 10 | 2.7% |
| Kindergarten | 18 | 4.8% |
| Elementary School | 24 | 6.4% |
| Middle School | 85 | 22.8% |
| High School | 111 | 29.8% |
| College / Undergraduate | 107 | 28.7% |
| Graduate / Professional | 18 | 4.8% |
| Total | 373 | 100.0% |
School Enrollment by Age by Funding Source in Weldon
Out of a total of 373 students who are enrolled in schools in Weldon, 41 (11.0%) attend a private institution, while the remaining 332 (89.0%) are enrolled in public schools. The age group of 25 to 34 year olds has the highest likelihood of being enrolled in private schools, with 20 (38.5% in the age bracket) enrolled. Conversely, the age group of 3 to 4 year olds has the lowest likelihood of being enrolled in a private school, with 7 (100.0% in the age bracket) attending a public institution.
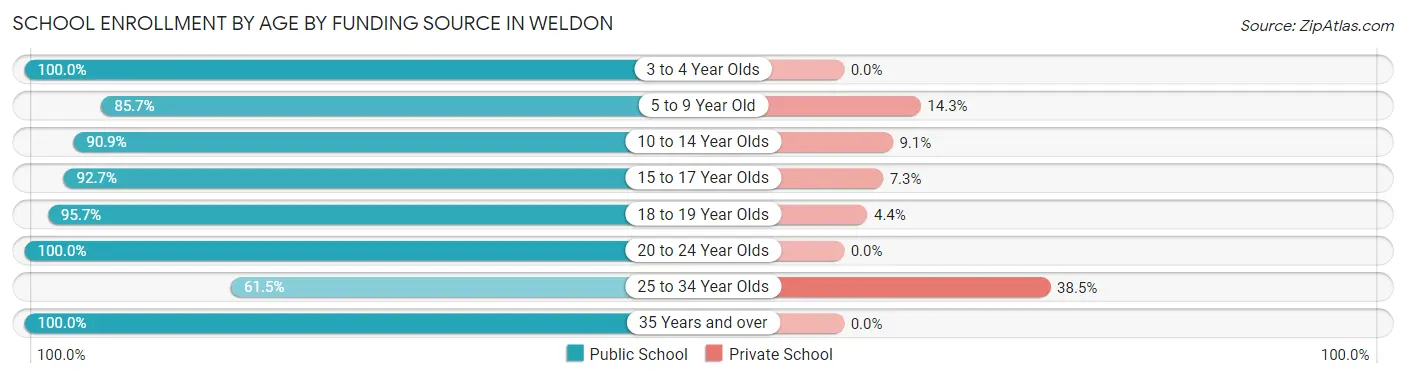
| Age Bracket | Public School | Private School |
| 3 to 4 Year Olds | 7 (100.0%) | 0 (0.0%) |
| 5 to 9 Year Old | 36 (85.7%) | 6 (14.3%) |
| 10 to 14 Year Olds | 50 (90.9%) | 5 (9.1%) |
| 15 to 17 Year Olds | 102 (92.7%) | 8 (7.3%) |
| 18 to 19 Year Olds | 44 (95.7%) | 2 (4.3%) |
| 20 to 24 Year Olds | 52 (100.0%) | 0 (0.0%) |
| 25 to 34 Year Olds | 32 (61.5%) | 20 (38.5%) |
| 35 Years and over | 9 (100.0%) | 0 (0.0%) |
| Total | 332 (89.0%) | 41 (11.0%) |
Educational Attainment by Field of Study in Weldon
Education (81 | 41.5%), arts & humanities (27 | 13.9%), business (19 | 9.7%), science & technology (16 | 8.2%), and bio, nature & agricultural (11 | 5.6%) are the most common fields of study among 195 individuals in Weldon who have obtained a bachelor's degree or higher.
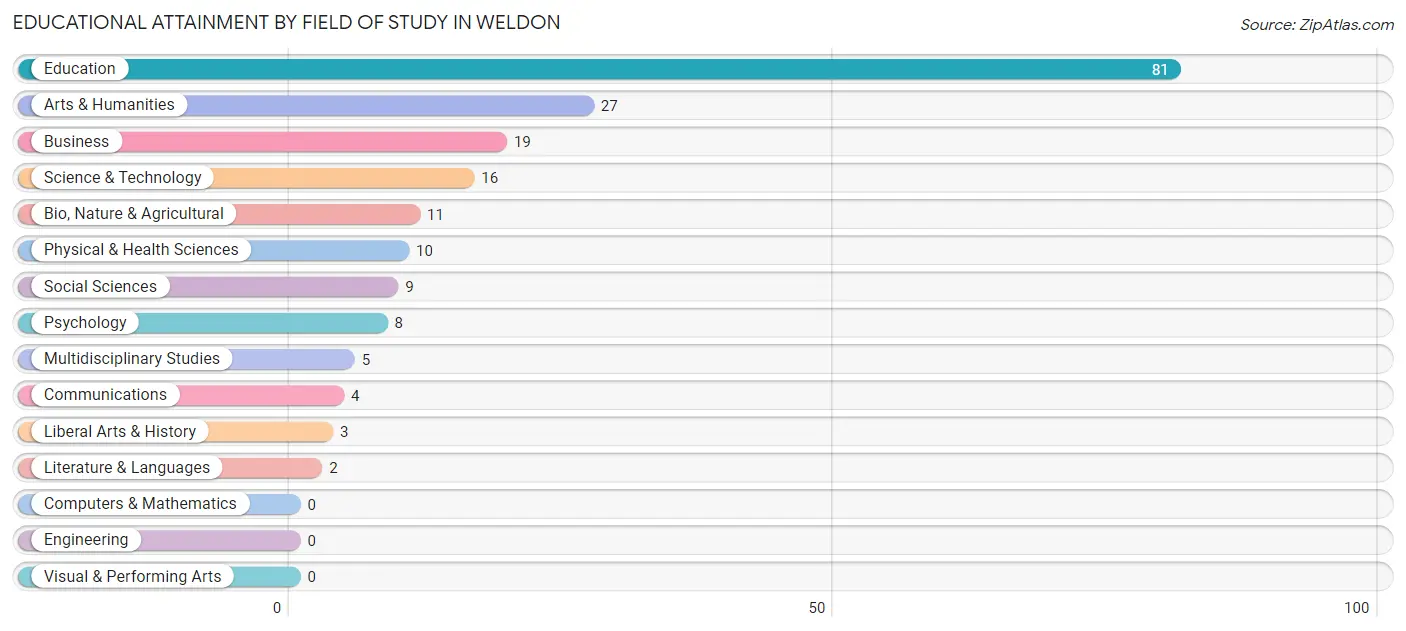
| Field of Study | # Graduates | % Graduates |
| Computers & Mathematics | 0 | 0.0% |
| Bio, Nature & Agricultural | 11 | 5.6% |
| Physical & Health Sciences | 10 | 5.1% |
| Psychology | 8 | 4.1% |
| Social Sciences | 9 | 4.6% |
| Engineering | 0 | 0.0% |
| Multidisciplinary Studies | 5 | 2.6% |
| Science & Technology | 16 | 8.2% |
| Business | 19 | 9.7% |
| Education | 81 | 41.5% |
| Literature & Languages | 2 | 1.0% |
| Liberal Arts & History | 3 | 1.5% |
| Visual & Performing Arts | 0 | 0.0% |
| Communications | 4 | 2.1% |
| Arts & Humanities | 27 | 13.9% |
| Total | 195 | 100.0% |
Transportation & Commute in Weldon
Vehicle Availability by Sex in Weldon
The most prevalent vehicle ownership categories in Weldon are males with 2 vehicles (85, accounting for 36.8%) and females with 2 vehicles (66, making up 30.0%).
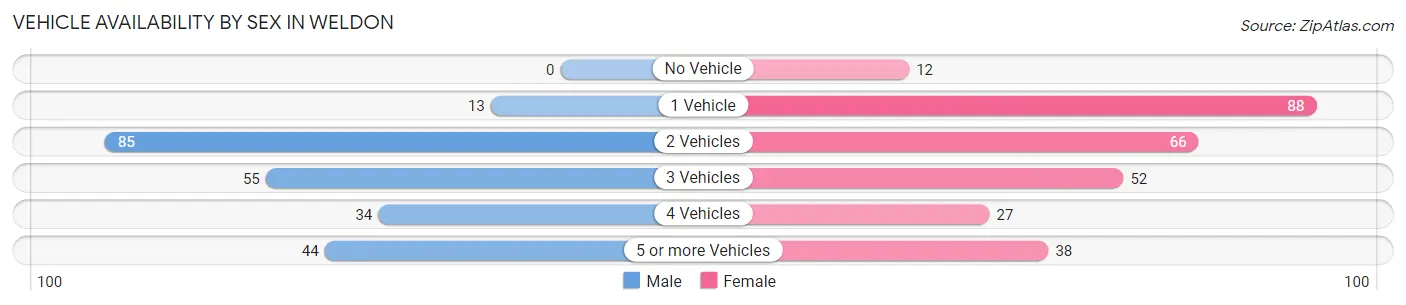
| Vehicles Available | Male | Female |
| No Vehicle | 0 (0.0%) | 12 (4.2%) |
| 1 Vehicle | 13 (5.6%) | 88 (31.1%) |
| 2 Vehicles | 85 (36.8%) | 66 (23.3%) |
| 3 Vehicles | 55 (23.8%) | 52 (18.4%) |
| 4 Vehicles | 34 (14.7%) | 27 (9.5%) |
| 5 or more Vehicles | 44 (19.1%) | 38 (13.4%) |
| Total | 231 (100.0%) | 283 (100.0%) |
Commute Time in Weldon
The most frequently occuring commute durations in Weldon are 10 to 14 minutes (144 commuters, 28.2%), 5 to 9 minutes (112 commuters, 21.9%), and less than 5 minutes (59 commuters, 11.6%).
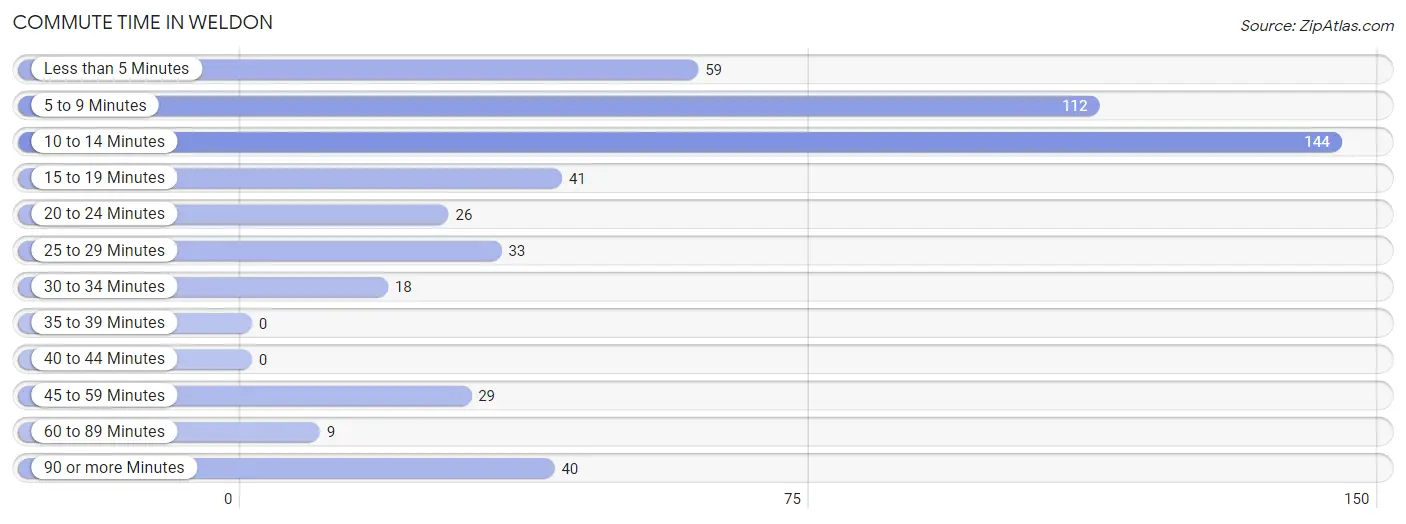
| Commute Time | # Commuters | % Commuters |
| Less than 5 Minutes | 59 | 11.6% |
| 5 to 9 Minutes | 112 | 21.9% |
| 10 to 14 Minutes | 144 | 28.2% |
| 15 to 19 Minutes | 41 | 8.0% |
| 20 to 24 Minutes | 26 | 5.1% |
| 25 to 29 Minutes | 33 | 6.5% |
| 30 to 34 Minutes | 18 | 3.5% |
| 35 to 39 Minutes | 0 | 0.0% |
| 40 to 44 Minutes | 0 | 0.0% |
| 45 to 59 Minutes | 29 | 5.7% |
| 60 to 89 Minutes | 9 | 1.8% |
| 90 or more Minutes | 40 | 7.8% |
Commute Time by Sex in Weldon
The most common commute times in Weldon are 10 to 14 minutes (76 commuters, 33.3%) for males and 5 to 9 minutes (80 commuters, 28.3%) for females.
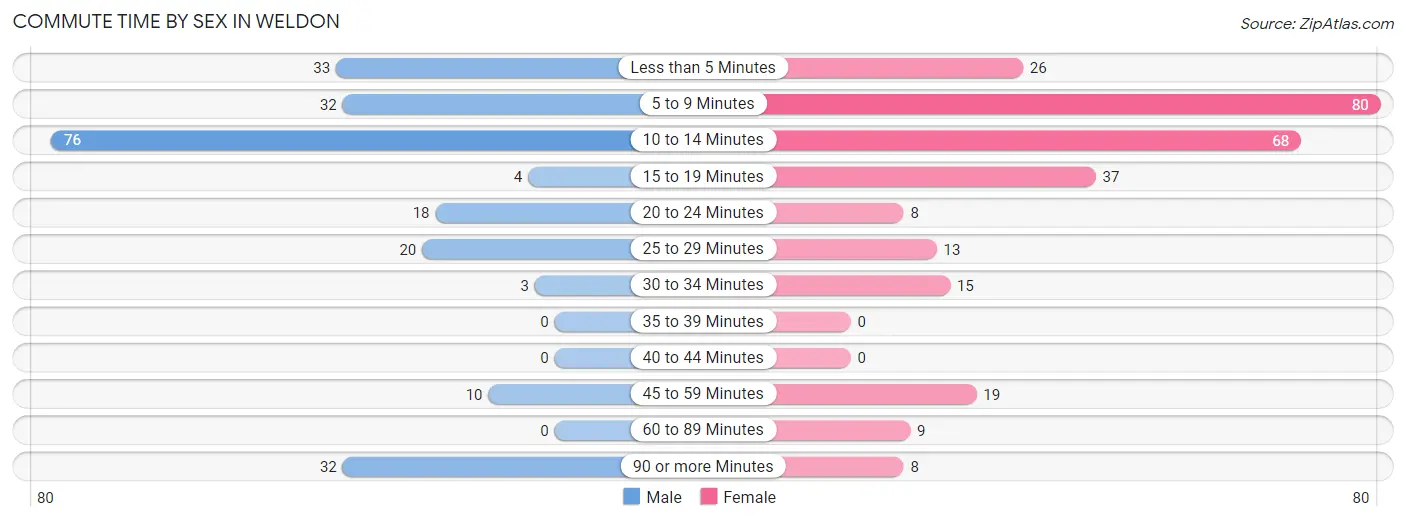
| Commute Time | Male | Female |
| Less than 5 Minutes | 33 (14.5%) | 26 (9.2%) |
| 5 to 9 Minutes | 32 (14.0%) | 80 (28.3%) |
| 10 to 14 Minutes | 76 (33.3%) | 68 (24.0%) |
| 15 to 19 Minutes | 4 (1.8%) | 37 (13.1%) |
| 20 to 24 Minutes | 18 (7.9%) | 8 (2.8%) |
| 25 to 29 Minutes | 20 (8.8%) | 13 (4.6%) |
| 30 to 34 Minutes | 3 (1.3%) | 15 (5.3%) |
| 35 to 39 Minutes | 0 (0.0%) | 0 (0.0%) |
| 40 to 44 Minutes | 0 (0.0%) | 0 (0.0%) |
| 45 to 59 Minutes | 10 (4.4%) | 19 (6.7%) |
| 60 to 89 Minutes | 0 (0.0%) | 9 (3.2%) |
| 90 or more Minutes | 32 (14.0%) | 8 (2.8%) |
Time of Departure to Work by Sex in Weldon
The most frequent times of departure to work in Weldon are 6:30 AM to 6:59 AM (55, 24.1%) for males and 8:00 AM to 8:29 AM (82, 29.0%) for females.
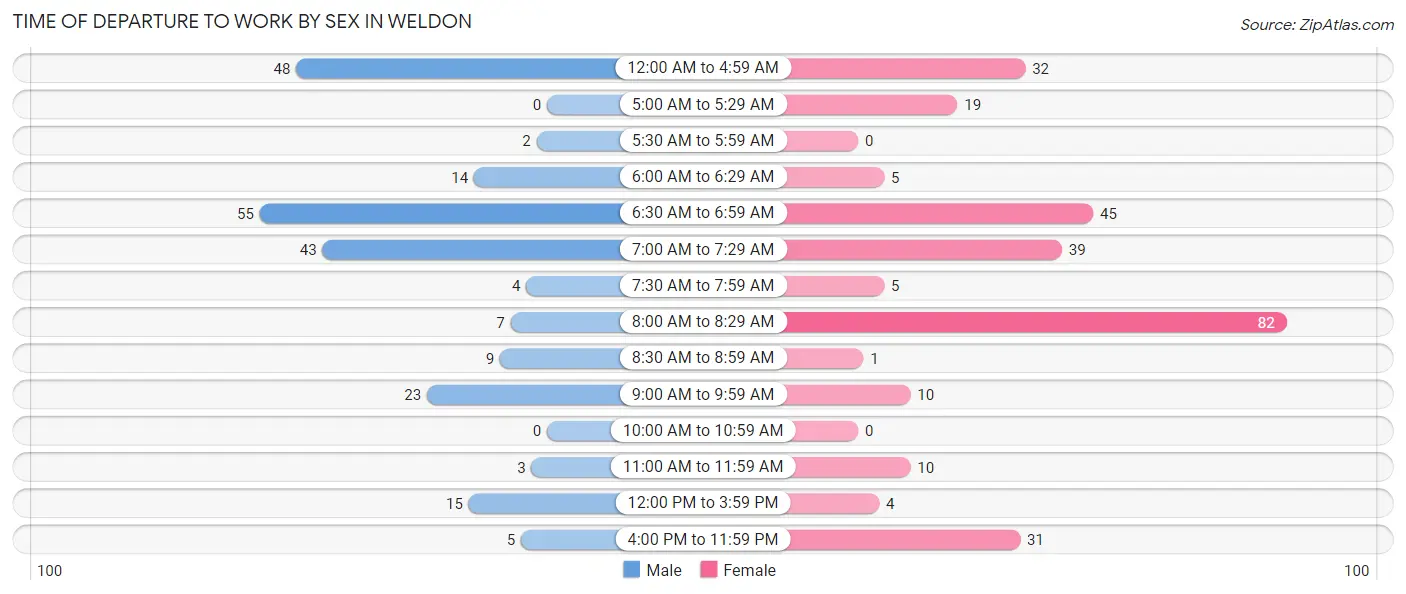
| Time of Departure | Male | Female |
| 12:00 AM to 4:59 AM | 48 (21.0%) | 32 (11.3%) |
| 5:00 AM to 5:29 AM | 0 (0.0%) | 19 (6.7%) |
| 5:30 AM to 5:59 AM | 2 (0.9%) | 0 (0.0%) |
| 6:00 AM to 6:29 AM | 14 (6.1%) | 5 (1.8%) |
| 6:30 AM to 6:59 AM | 55 (24.1%) | 45 (15.9%) |
| 7:00 AM to 7:29 AM | 43 (18.9%) | 39 (13.8%) |
| 7:30 AM to 7:59 AM | 4 (1.8%) | 5 (1.8%) |
| 8:00 AM to 8:29 AM | 7 (3.1%) | 82 (29.0%) |
| 8:30 AM to 8:59 AM | 9 (4.0%) | 1 (0.4%) |
| 9:00 AM to 9:59 AM | 23 (10.1%) | 10 (3.5%) |
| 10:00 AM to 10:59 AM | 0 (0.0%) | 0 (0.0%) |
| 11:00 AM to 11:59 AM | 3 (1.3%) | 10 (3.5%) |
| 12:00 PM to 3:59 PM | 15 (6.6%) | 4 (1.4%) |
| 4:00 PM to 11:59 PM | 5 (2.2%) | 31 (11.0%) |
| Total | 228 (100.0%) | 283 (100.0%) |
Housing Occupancy in Weldon
Occupancy by Ownership in Weldon
Of the total 542 dwellings in Weldon, owner-occupied units account for 283 (52.2%), while renter-occupied units make up 259 (47.8%).
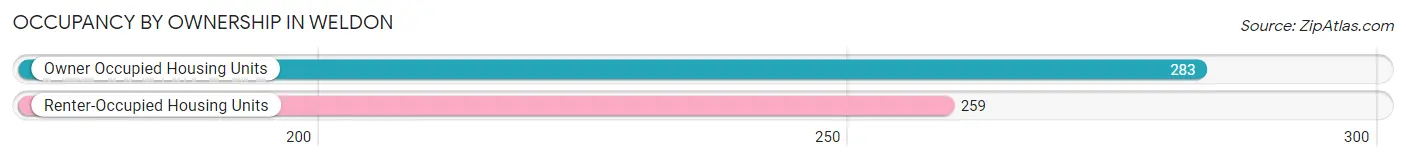
| Occupancy | # Housing Units | % Housing Units |
| Owner Occupied Housing Units | 283 | 52.2% |
| Renter-Occupied Housing Units | 259 | 47.8% |
| Total Occupied Housing Units | 542 | 100.0% |
Occupancy by Household Size in Weldon
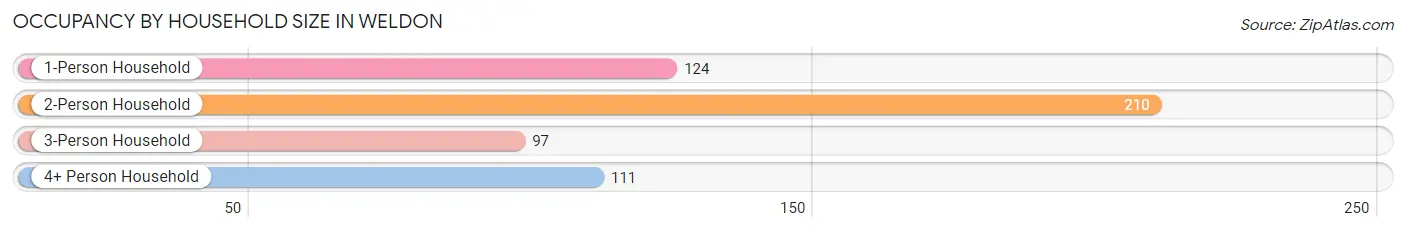
| Household Size | # Housing Units | % Housing Units |
| 1-Person Household | 124 | 22.9% |
| 2-Person Household | 210 | 38.8% |
| 3-Person Household | 97 | 17.9% |
| 4+ Person Household | 111 | 20.5% |
| Total Housing Units | 542 | 100.0% |
Occupancy by Ownership by Household Size in Weldon
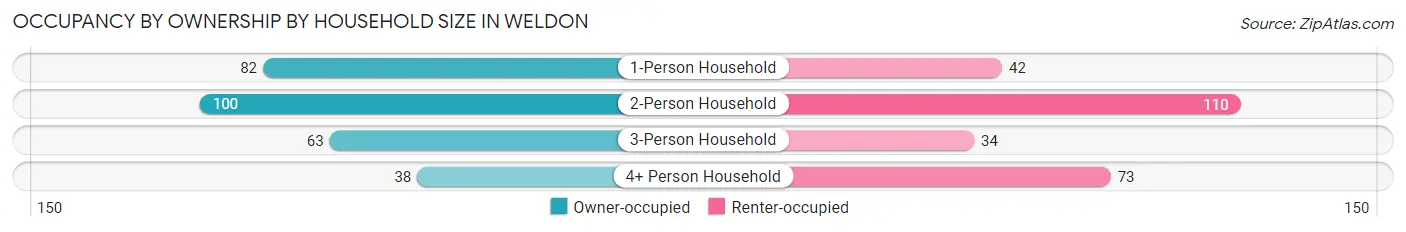
| Household Size | Owner-occupied | Renter-occupied |
| 1-Person Household | 82 (66.1%) | 42 (33.9%) |
| 2-Person Household | 100 (47.6%) | 110 (52.4%) |
| 3-Person Household | 63 (64.9%) | 34 (35.0%) |
| 4+ Person Household | 38 (34.2%) | 73 (65.8%) |
| Total Housing Units | 283 (52.2%) | 259 (47.8%) |
Occupancy by Educational Attainment in Weldon
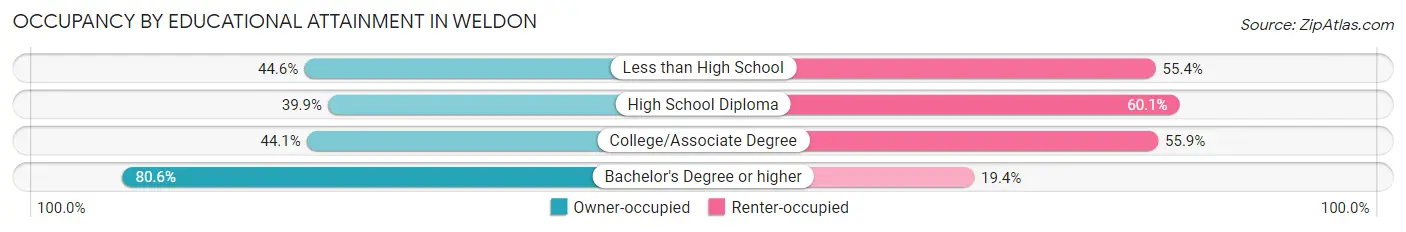
| Household Size | Owner-occupied | Renter-occupied |
| Less than High School | 33 (44.6%) | 41 (55.4%) |
| High School Diploma | 67 (39.9%) | 101 (60.1%) |
| College/Associate Degree | 71 (44.1%) | 90 (55.9%) |
| Bachelor's Degree or higher | 112 (80.6%) | 27 (19.4%) |
Occupancy by Age of Householder in Weldon
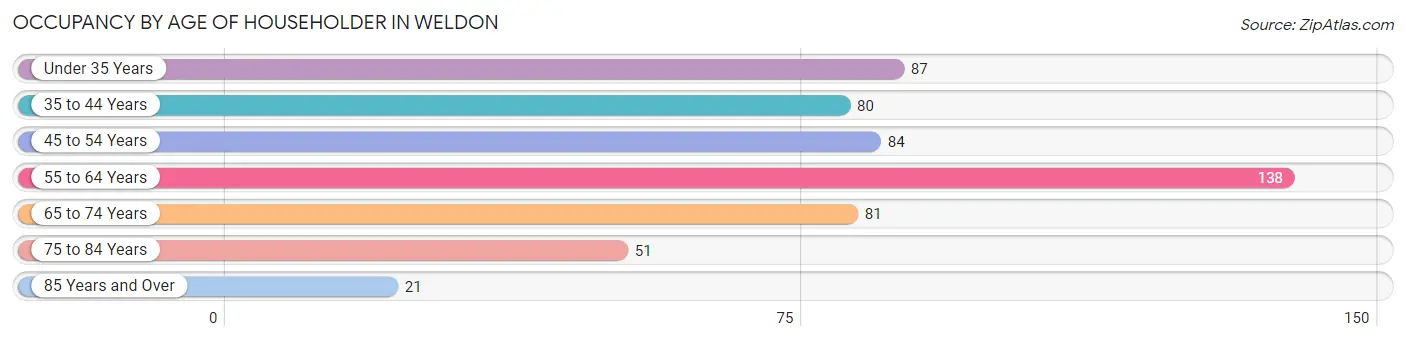
| Age Bracket | # Households | % Households |
| Under 35 Years | 87 | 16.1% |
| 35 to 44 Years | 80 | 14.8% |
| 45 to 54 Years | 84 | 15.5% |
| 55 to 64 Years | 138 | 25.5% |
| 65 to 74 Years | 81 | 14.9% |
| 75 to 84 Years | 51 | 9.4% |
| 85 Years and Over | 21 | 3.9% |
| Total | 542 | 100.0% |
Housing Finances in Weldon
Median Income by Occupancy in Weldon
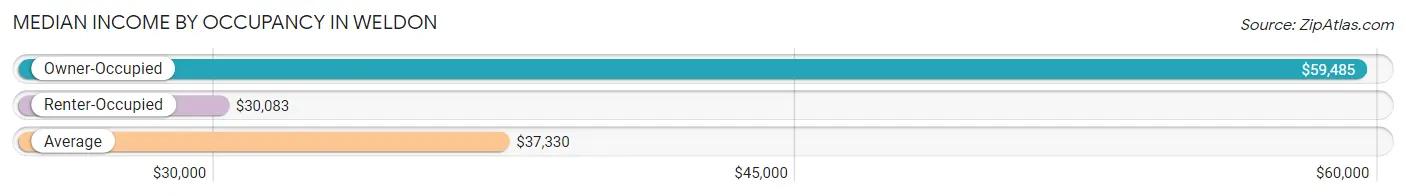
| Occupancy Type | # Households | Median Income |
| Owner-Occupied | 283 (52.2%) | $59,485 |
| Renter-Occupied | 259 (47.8%) | $30,083 |
| Average | 542 (100.0%) | $37,330 |
Occupancy by Householder Income Bracket in Weldon
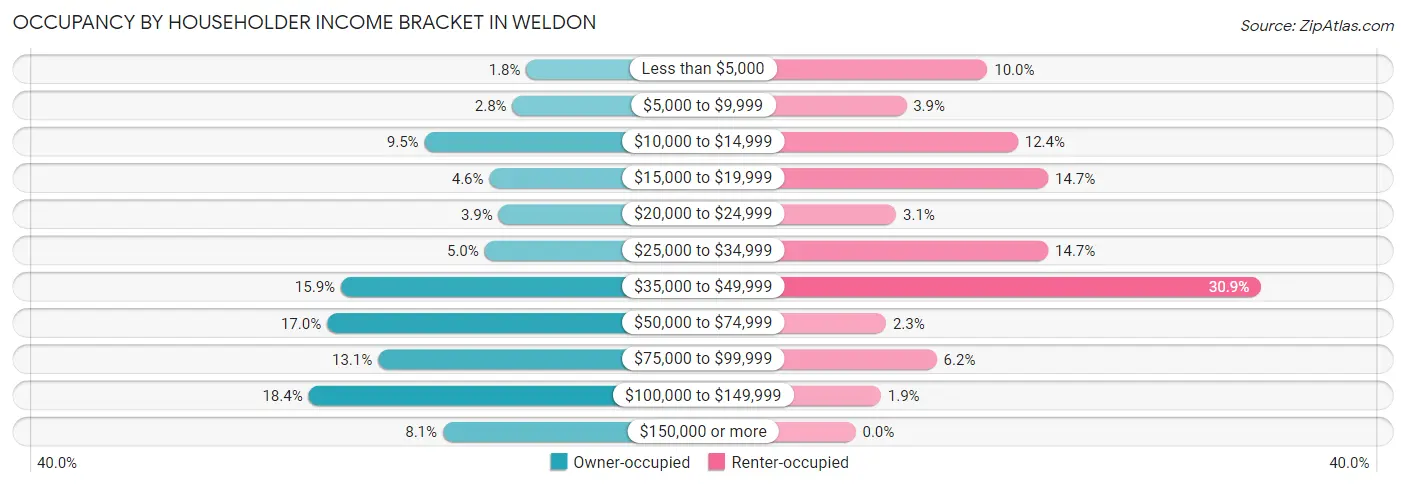
| Income Bracket | Owner-occupied | Renter-occupied |
| Less than $5,000 | 5 (1.8%) | 26 (10.0%) |
| $5,000 to $9,999 | 8 (2.8%) | 10 (3.9%) |
| $10,000 to $14,999 | 27 (9.5%) | 32 (12.4%) |
| $15,000 to $19,999 | 13 (4.6%) | 38 (14.7%) |
| $20,000 to $24,999 | 11 (3.9%) | 8 (3.1%) |
| $25,000 to $34,999 | 14 (5.0%) | 38 (14.7%) |
| $35,000 to $49,999 | 45 (15.9%) | 80 (30.9%) |
| $50,000 to $74,999 | 48 (17.0%) | 6 (2.3%) |
| $75,000 to $99,999 | 37 (13.1%) | 16 (6.2%) |
| $100,000 to $149,999 | 52 (18.4%) | 5 (1.9%) |
| $150,000 or more | 23 (8.1%) | 0 (0.0%) |
| Total | 283 (100.0%) | 259 (100.0%) |
Monthly Housing Cost Tiers in Weldon
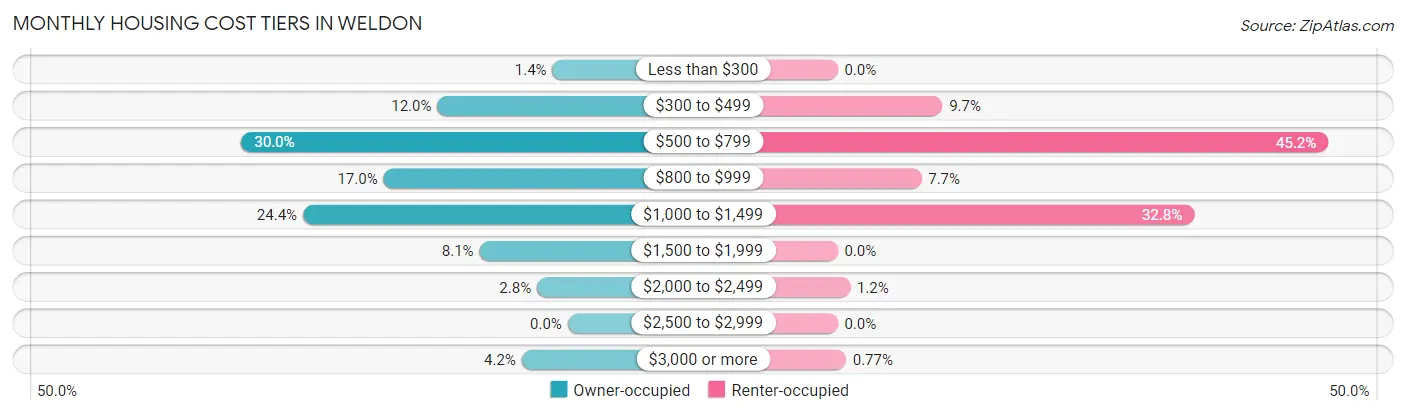
| Monthly Cost | Owner-occupied | Renter-occupied |
| Less than $300 | 4 (1.4%) | 0 (0.0%) |
| $300 to $499 | 34 (12.0%) | 25 (9.7%) |
| $500 to $799 | 85 (30.0%) | 117 (45.2%) |
| $800 to $999 | 48 (17.0%) | 20 (7.7%) |
| $1,000 to $1,499 | 69 (24.4%) | 85 (32.8%) |
| $1,500 to $1,999 | 23 (8.1%) | 0 (0.0%) |
| $2,000 to $2,499 | 8 (2.8%) | 3 (1.2%) |
| $2,500 to $2,999 | 0 (0.0%) | 0 (0.0%) |
| $3,000 or more | 12 (4.2%) | 2 (0.8%) |
| Total | 283 (100.0%) | 259 (100.0%) |
Physical Housing Characteristics in Weldon
Housing Structures in Weldon
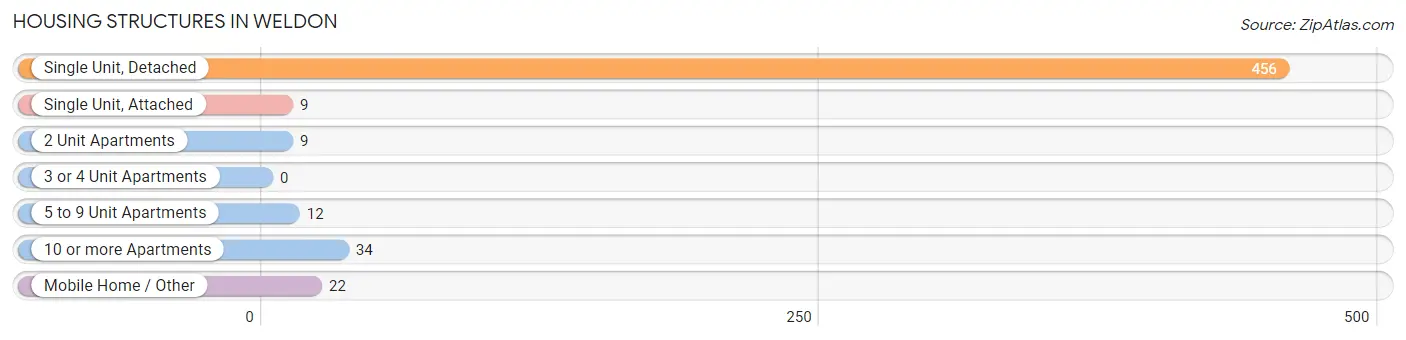
| Structure Type | # Housing Units | % Housing Units |
| Single Unit, Detached | 456 | 84.1% |
| Single Unit, Attached | 9 | 1.7% |
| 2 Unit Apartments | 9 | 1.7% |
| 3 or 4 Unit Apartments | 0 | 0.0% |
| 5 to 9 Unit Apartments | 12 | 2.2% |
| 10 or more Apartments | 34 | 6.3% |
| Mobile Home / Other | 22 | 4.1% |
| Total | 542 | 100.0% |
Housing Structures by Occupancy in Weldon
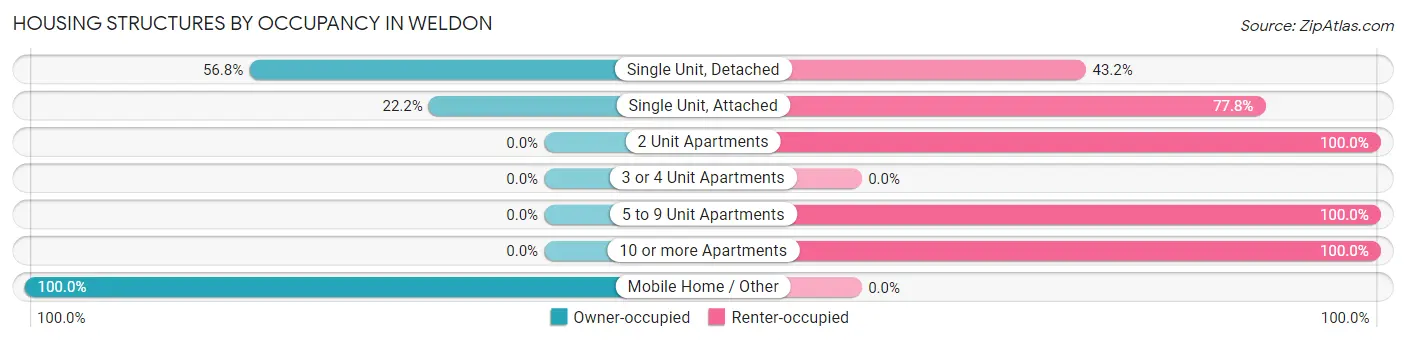
| Structure Type | Owner-occupied | Renter-occupied |
| Single Unit, Detached | 259 (56.8%) | 197 (43.2%) |
| Single Unit, Attached | 2 (22.2%) | 7 (77.8%) |
| 2 Unit Apartments | 0 (0.0%) | 9 (100.0%) |
| 3 or 4 Unit Apartments | 0 (0.0%) | 0 (0.0%) |
| 5 to 9 Unit Apartments | 0 (0.0%) | 12 (100.0%) |
| 10 or more Apartments | 0 (0.0%) | 34 (100.0%) |
| Mobile Home / Other | 22 (100.0%) | 0 (0.0%) |
| Total | 283 (52.2%) | 259 (47.8%) |
Housing Structures by Number of Rooms in Weldon
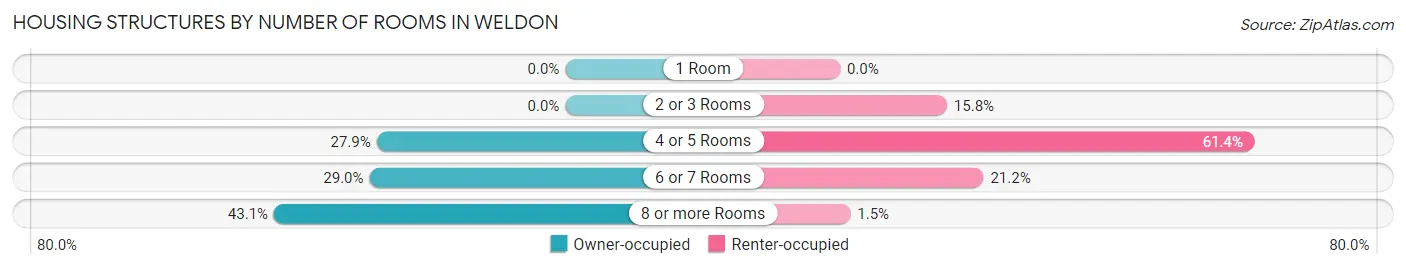
| Number of Rooms | Owner-occupied | Renter-occupied |
| 1 Room | 0 (0.0%) | 0 (0.0%) |
| 2 or 3 Rooms | 0 (0.0%) | 41 (15.8%) |
| 4 or 5 Rooms | 79 (27.9%) | 159 (61.4%) |
| 6 or 7 Rooms | 82 (29.0%) | 55 (21.2%) |
| 8 or more Rooms | 122 (43.1%) | 4 (1.5%) |
| Total | 283 (100.0%) | 259 (100.0%) |
Housing Structure by Heating Type in Weldon
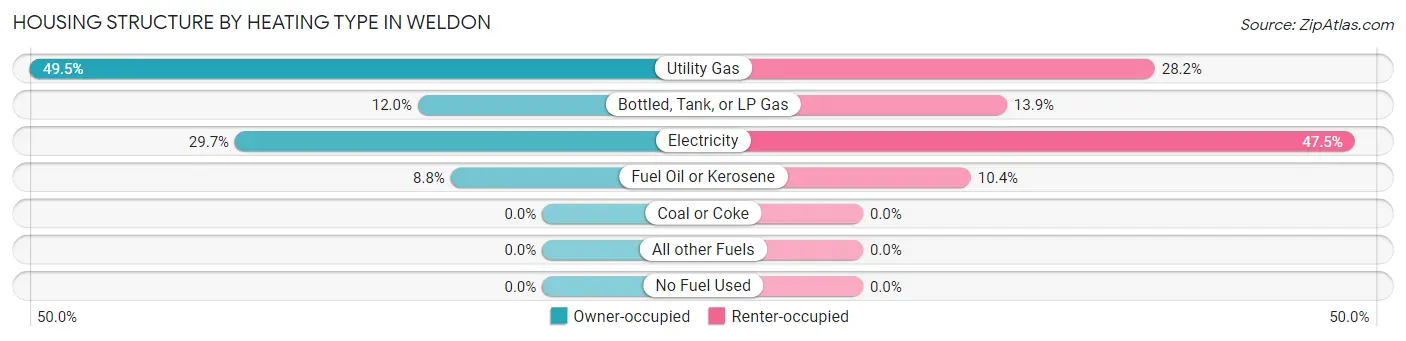
| Heating Type | Owner-occupied | Renter-occupied |
| Utility Gas | 140 (49.5%) | 73 (28.2%) |
| Bottled, Tank, or LP Gas | 34 (12.0%) | 36 (13.9%) |
| Electricity | 84 (29.7%) | 123 (47.5%) |
| Fuel Oil or Kerosene | 25 (8.8%) | 27 (10.4%) |
| Coal or Coke | 0 (0.0%) | 0 (0.0%) |
| All other Fuels | 0 (0.0%) | 0 (0.0%) |
| No Fuel Used | 0 (0.0%) | 0 (0.0%) |
| Total | 283 (100.0%) | 259 (100.0%) |
Household Vehicle Usage in Weldon
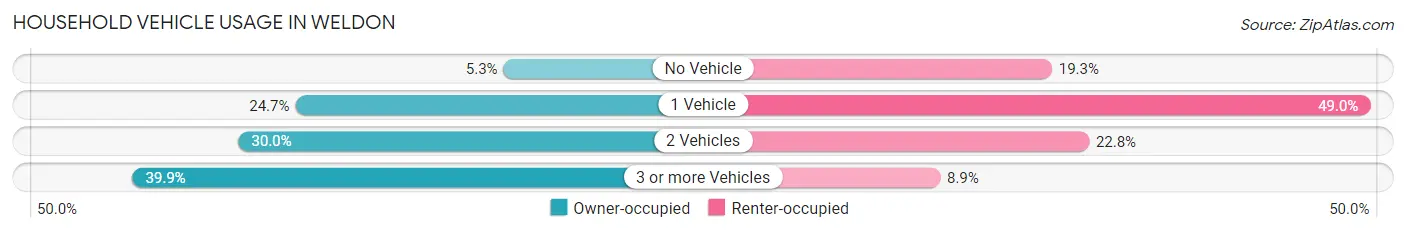
| Vehicles per Household | Owner-occupied | Renter-occupied |
| No Vehicle | 15 (5.3%) | 50 (19.3%) |
| 1 Vehicle | 70 (24.7%) | 127 (49.0%) |
| 2 Vehicles | 85 (30.0%) | 59 (22.8%) |
| 3 or more Vehicles | 113 (39.9%) | 23 (8.9%) |
| Total | 283 (100.0%) | 259 (100.0%) |
Real Estate & Mortgages in Weldon
Real Estate and Mortgage Overview in Weldon
| Characteristic | Without Mortgage | With Mortgage |
| Housing Units | 153 | 130 |
| Median Property Value | $80,400 | $98,800 |
| Median Household Income | $59,044 | $16 |
| Monthly Housing Costs | $573 | $12 |
| Real Estate Taxes | $1,328 | $0 |
Property Value by Mortgage Status in Weldon
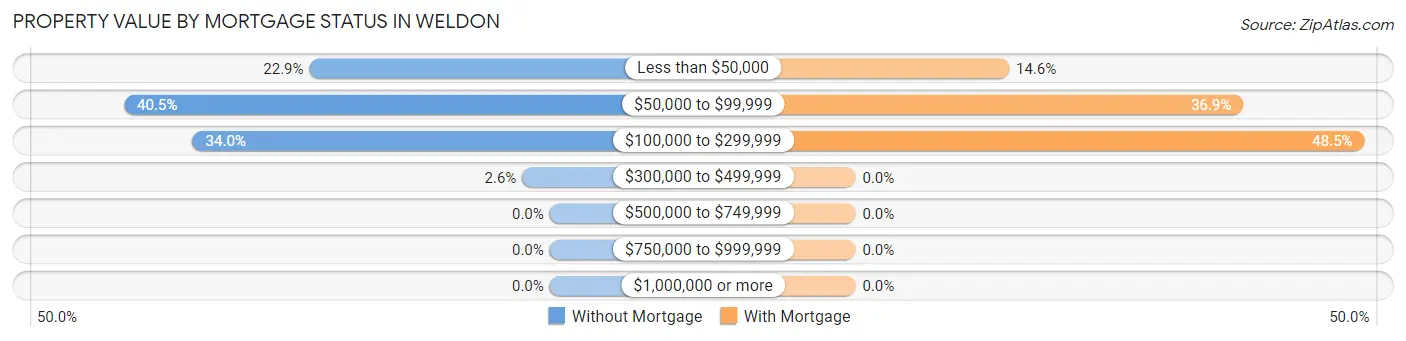
| Property Value | Without Mortgage | With Mortgage |
| Less than $50,000 | 35 (22.9%) | 19 (14.6%) |
| $50,000 to $99,999 | 62 (40.5%) | 48 (36.9%) |
| $100,000 to $299,999 | 52 (34.0%) | 63 (48.5%) |
| $300,000 to $499,999 | 4 (2.6%) | 0 (0.0%) |
| $500,000 to $749,999 | 0 (0.0%) | 0 (0.0%) |
| $750,000 to $999,999 | 0 (0.0%) | 0 (0.0%) |
| $1,000,000 or more | 0 (0.0%) | 0 (0.0%) |
| Total | 153 (100.0%) | 130 (100.0%) |
Household Income by Mortgage Status in Weldon
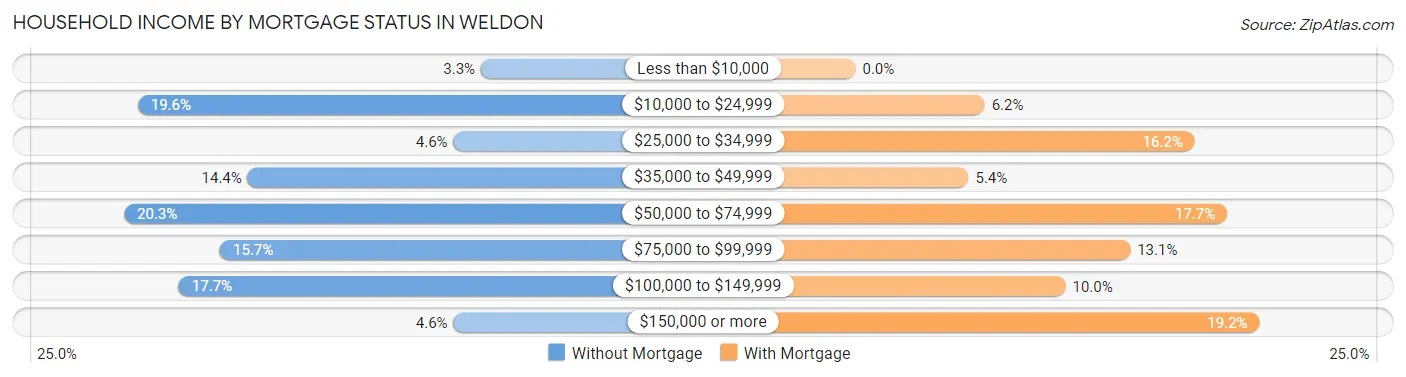
| Household Income | Without Mortgage | With Mortgage |
| Less than $10,000 | 5 (3.3%) | 0 (0.0%) |
| $10,000 to $24,999 | 30 (19.6%) | 8 (6.1%) |
| $25,000 to $34,999 | 7 (4.6%) | 21 (16.2%) |
| $35,000 to $49,999 | 22 (14.4%) | 7 (5.4%) |
| $50,000 to $74,999 | 31 (20.3%) | 23 (17.7%) |
| $75,000 to $99,999 | 24 (15.7%) | 17 (13.1%) |
| $100,000 to $149,999 | 27 (17.6%) | 13 (10.0%) |
| $150,000 or more | 7 (4.6%) | 25 (19.2%) |
| Total | 153 (100.0%) | 130 (100.0%) |
Property Value to Household Income Ratio in Weldon
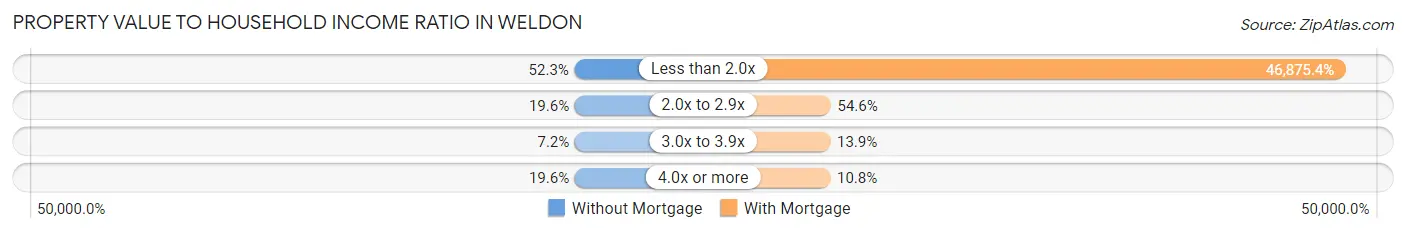
| Value-to-Income Ratio | Without Mortgage | With Mortgage |
| Less than 2.0x | 80 (52.3%) | 60,938 (46,875.4%) |
| 2.0x to 2.9x | 30 (19.6%) | 71 (54.6%) |
| 3.0x to 3.9x | 11 (7.2%) | 18 (13.9%) |
| 4.0x or more | 30 (19.6%) | 14 (10.8%) |
| Total | 153 (100.0%) | 130 (100.0%) |
Real Estate Taxes by Mortgage Status in Weldon
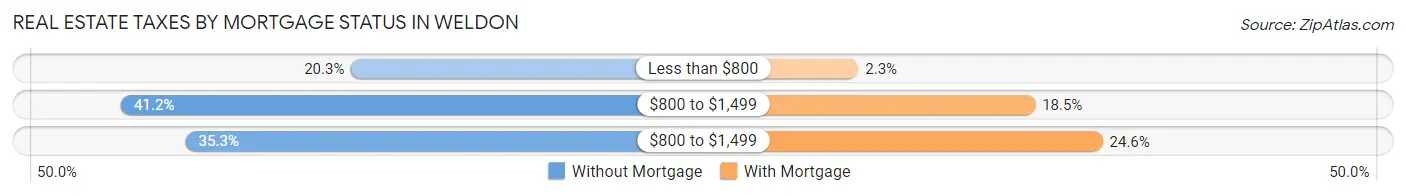
| Property Taxes | Without Mortgage | With Mortgage |
| Less than $800 | 31 (20.3%) | 3 (2.3%) |
| $800 to $1,499 | 63 (41.2%) | 24 (18.5%) |
| $800 to $1,499 | 54 (35.3%) | 32 (24.6%) |
| Total | 153 (100.0%) | 130 (100.0%) |
Health & Disability in Weldon
Health Insurance Coverage by Age in Weldon
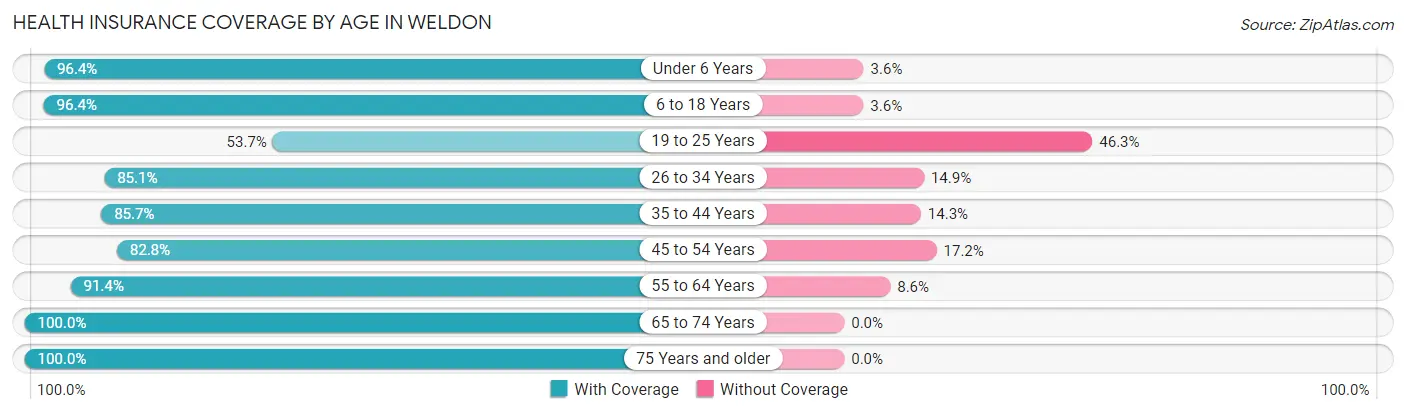
| Age Bracket | With Coverage | Without Coverage |
| Under 6 Years | 187 (96.4%) | 7 (3.6%) |
| 6 to 18 Years | 217 (96.4%) | 8 (3.6%) |
| 19 to 25 Years | 115 (53.7%) | 99 (46.3%) |
| 26 to 34 Years | 126 (85.1%) | 22 (14.9%) |
| 35 to 44 Years | 102 (85.7%) | 17 (14.3%) |
| 45 to 54 Years | 101 (82.8%) | 21 (17.2%) |
| 55 to 64 Years | 245 (91.4%) | 23 (8.6%) |
| 65 to 74 Years | 105 (100.0%) | 0 (0.0%) |
| 75 Years and older | 95 (100.0%) | 0 (0.0%) |
| Total | 1,293 (86.8%) | 197 (13.2%) |
Health Insurance Coverage by Citizenship Status in Weldon
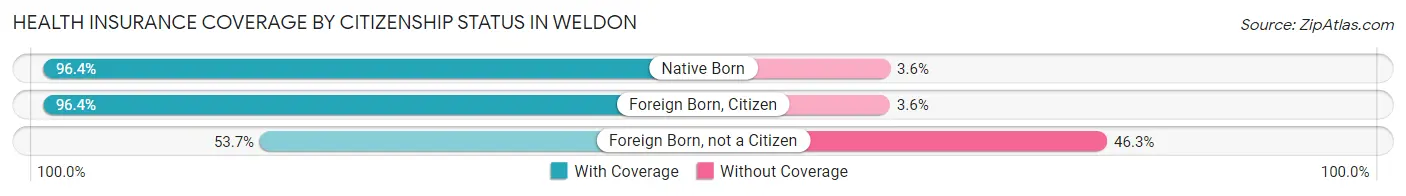
| Citizenship Status | With Coverage | Without Coverage |
| Native Born | 187 (96.4%) | 7 (3.6%) |
| Foreign Born, Citizen | 217 (96.4%) | 8 (3.6%) |
| Foreign Born, not a Citizen | 115 (53.7%) | 99 (46.3%) |
Health Insurance Coverage by Household Income in Weldon
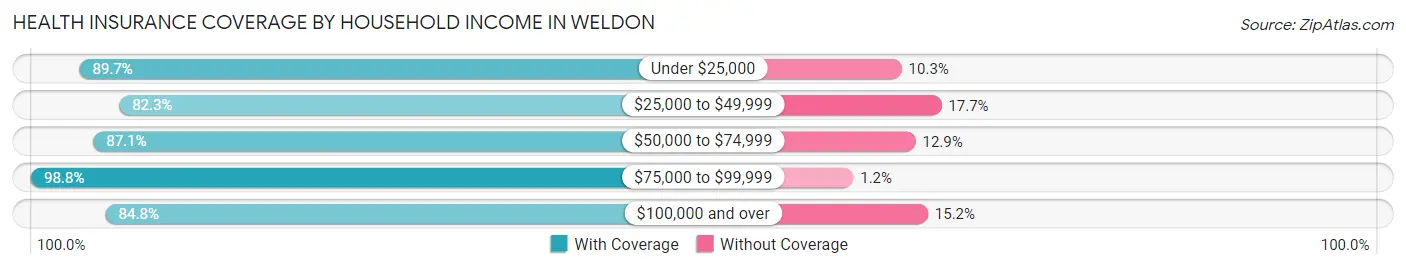
| Household Income | With Coverage | Without Coverage |
| Under $25,000 | 323 (89.7%) | 37 (10.3%) |
| $25,000 to $49,999 | 464 (82.3%) | 100 (17.7%) |
| $50,000 to $74,999 | 115 (87.1%) | 17 (12.9%) |
| $75,000 to $99,999 | 162 (98.8%) | 2 (1.2%) |
| $100,000 and over | 229 (84.8%) | 41 (15.2%) |
Public vs Private Health Insurance Coverage by Age in Weldon
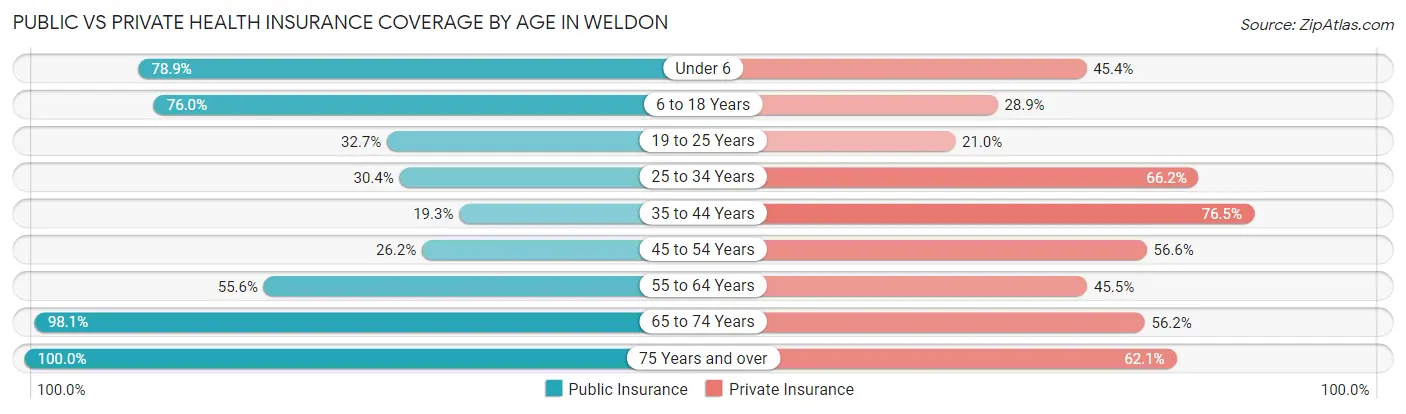
| Age Bracket | Public Insurance | Private Insurance |
| Under 6 | 153 (78.9%) | 88 (45.4%) |
| 6 to 18 Years | 171 (76.0%) | 65 (28.9%) |
| 19 to 25 Years | 70 (32.7%) | 45 (21.0%) |
| 25 to 34 Years | 45 (30.4%) | 98 (66.2%) |
| 35 to 44 Years | 23 (19.3%) | 91 (76.5%) |
| 45 to 54 Years | 32 (26.2%) | 69 (56.6%) |
| 55 to 64 Years | 149 (55.6%) | 122 (45.5%) |
| 65 to 74 Years | 103 (98.1%) | 59 (56.2%) |
| 75 Years and over | 95 (100.0%) | 59 (62.1%) |
| Total | 841 (56.4%) | 696 (46.7%) |
Disability Status by Sex by Age in Weldon
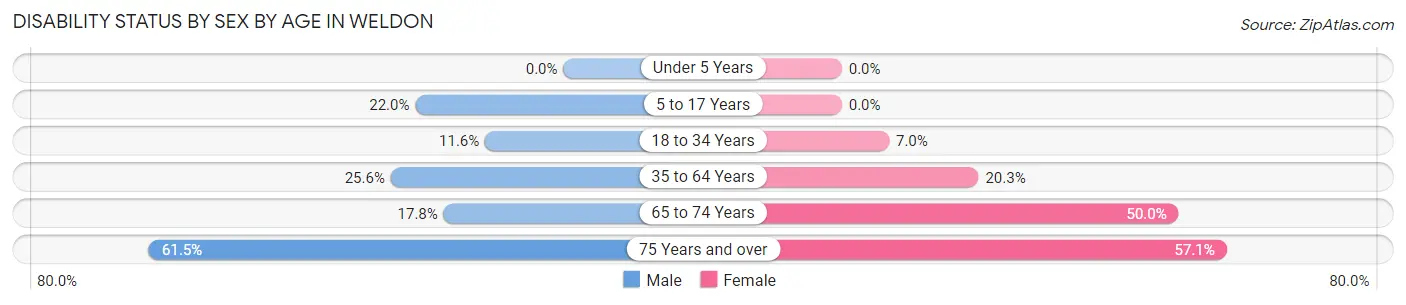
| Age Bracket | Male | Female |
| Under 5 Years | 0 (0.0%) | 0 (0.0%) |
| 5 to 17 Years | 20 (22.0%) | 0 (0.0%) |
| 18 to 34 Years | 28 (11.6%) | 11 (7.0%) |
| 35 to 64 Years | 61 (25.6%) | 55 (20.3%) |
| 65 to 74 Years | 8 (17.8%) | 30 (50.0%) |
| 75 Years and over | 24 (61.5%) | 32 (57.1%) |
Disability Class by Sex by Age in Weldon
Disability Class: Hearing Difficulty
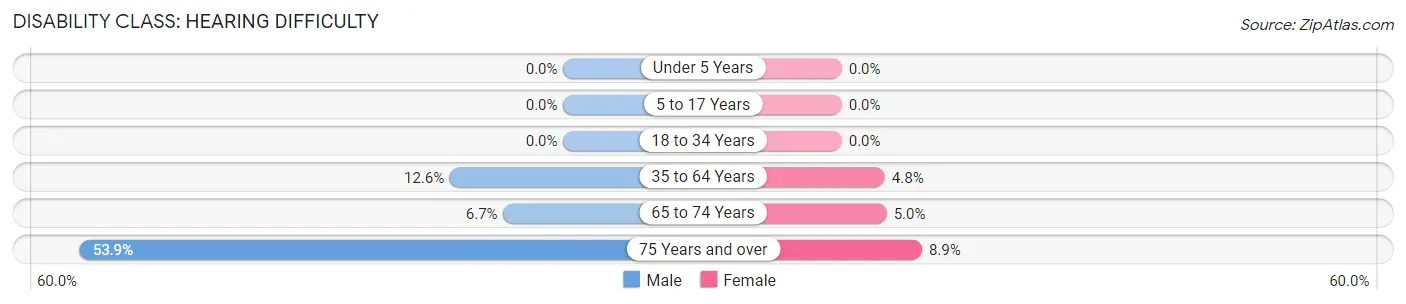
| Age Bracket | Male | Female |
| Under 5 Years | 0 (0.0%) | 0 (0.0%) |
| 5 to 17 Years | 0 (0.0%) | 0 (0.0%) |
| 18 to 34 Years | 0 (0.0%) | 0 (0.0%) |
| 35 to 64 Years | 30 (12.6%) | 13 (4.8%) |
| 65 to 74 Years | 3 (6.7%) | 3 (5.0%) |
| 75 Years and over | 21 (53.8%) | 5 (8.9%) |
Disability Class: Vision Difficulty
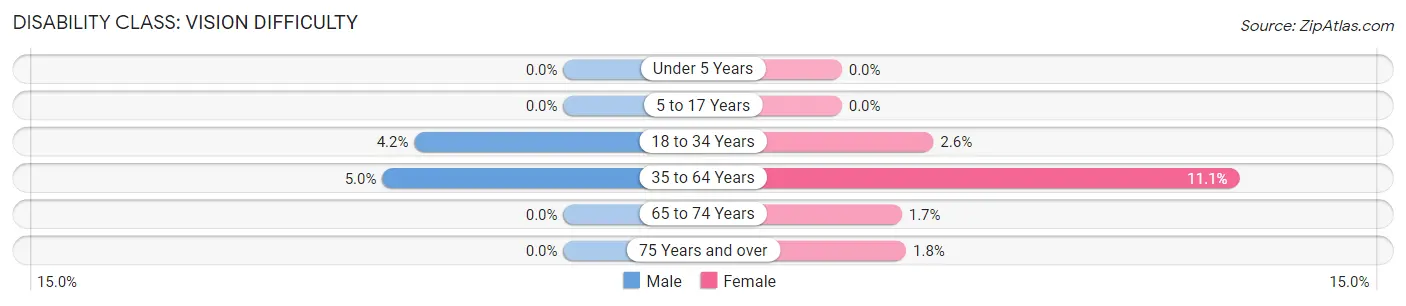
| Age Bracket | Male | Female |
| Under 5 Years | 0 (0.0%) | 0 (0.0%) |
| 5 to 17 Years | 0 (0.0%) | 0 (0.0%) |
| 18 to 34 Years | 10 (4.2%) | 4 (2.5%) |
| 35 to 64 Years | 12 (5.0%) | 30 (11.1%) |
| 65 to 74 Years | 0 (0.0%) | 1 (1.7%) |
| 75 Years and over | 0 (0.0%) | 1 (1.8%) |
Disability Class: Cognitive Difficulty
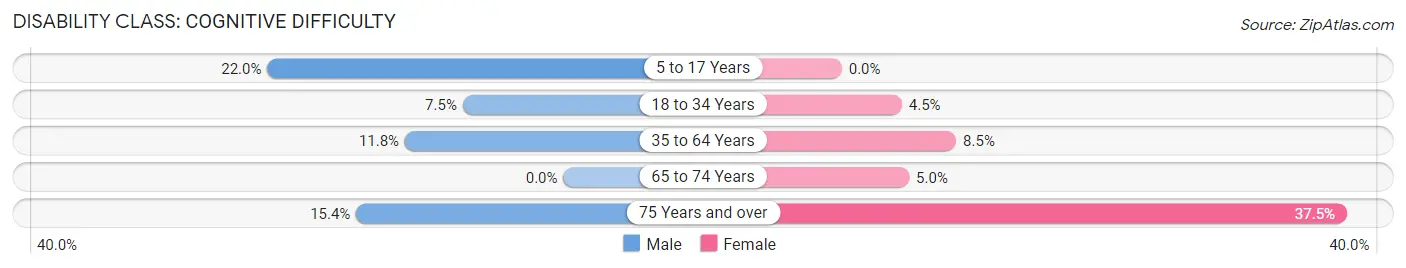
| Age Bracket | Male | Female |
| 5 to 17 Years | 20 (22.0%) | 0 (0.0%) |
| 18 to 34 Years | 18 (7.5%) | 7 (4.5%) |
| 35 to 64 Years | 28 (11.8%) | 23 (8.5%) |
| 65 to 74 Years | 0 (0.0%) | 3 (5.0%) |
| 75 Years and over | 6 (15.4%) | 21 (37.5%) |
Disability Class: Ambulatory Difficulty
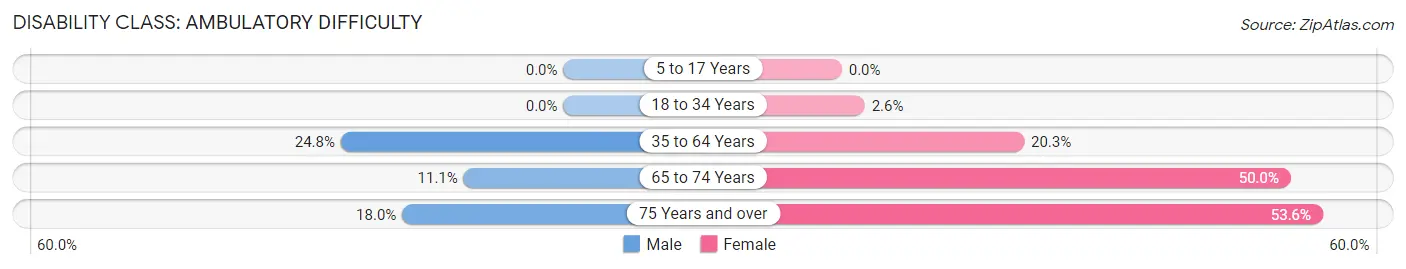
| Age Bracket | Male | Female |
| 5 to 17 Years | 0 (0.0%) | 0 (0.0%) |
| 18 to 34 Years | 0 (0.0%) | 4 (2.5%) |
| 35 to 64 Years | 59 (24.8%) | 55 (20.3%) |
| 65 to 74 Years | 5 (11.1%) | 30 (50.0%) |
| 75 Years and over | 7 (17.9%) | 30 (53.6%) |
Disability Class: Self-Care Difficulty
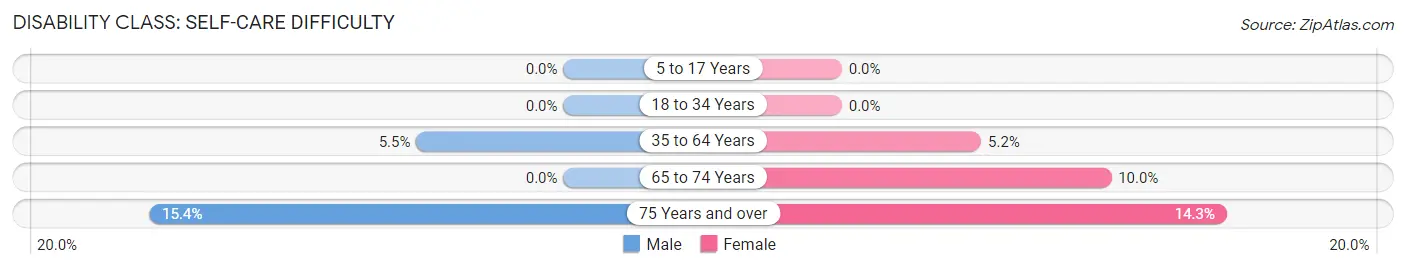
| Age Bracket | Male | Female |
| 5 to 17 Years | 0 (0.0%) | 0 (0.0%) |
| 18 to 34 Years | 0 (0.0%) | 0 (0.0%) |
| 35 to 64 Years | 13 (5.5%) | 14 (5.2%) |
| 65 to 74 Years | 0 (0.0%) | 6 (10.0%) |
| 75 Years and over | 6 (15.4%) | 8 (14.3%) |
Technology Access in Weldon
Computing Device Access in Weldon
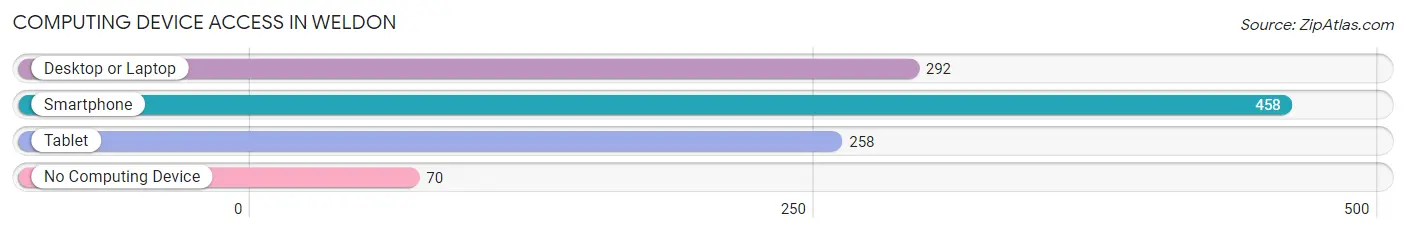
| Device Type | # Households | % Households |
| Desktop or Laptop | 292 | 53.9% |
| Smartphone | 458 | 84.5% |
| Tablet | 258 | 47.6% |
| No Computing Device | 70 | 12.9% |
| Total | 542 | 100.0% |
Internet Access in Weldon
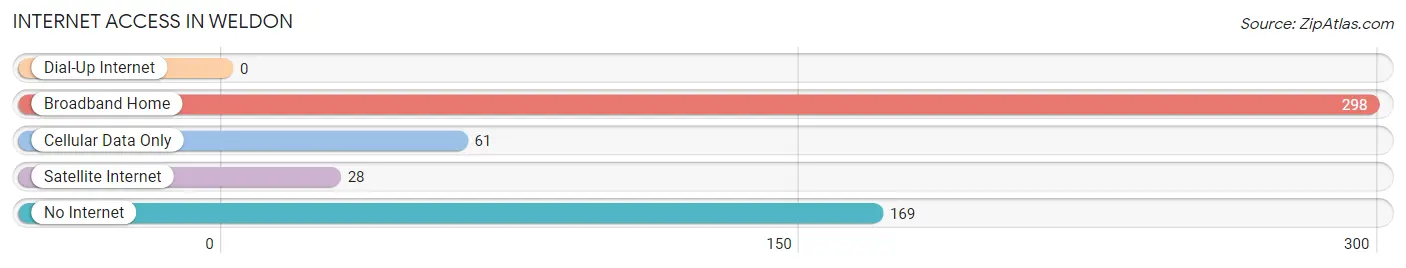
| Internet Type | # Households | % Households |
| Dial-Up Internet | 0 | 0.0% |
| Broadband Home | 298 | 55.0% |
| Cellular Data Only | 61 | 11.3% |
| Satellite Internet | 28 | 5.2% |
| No Internet | 169 | 31.2% |
| Total | 542 | 100.0% |
Weldon Summary
Weldon, North Carolina is a small town located in Halifax County, North Carolina. It is situated on the Roanoke River, approximately 30 miles northeast of Raleigh. The town has a population of approximately 2,000 people and is part of the Roanoke Rapids Micropolitan Statistical Area.
History
Weldon was founded in 1790 by William Weldon, a Revolutionary War veteran. The town was originally known as Weldon’s Crossroads, and was a stop on the stagecoach route between Petersburg, Virginia and Raleigh, North Carolina. In 1810, the town was officially incorporated as Weldon.
During the Civil War, Weldon was a major railroad junction and was the site of several battles. In 1864, the Battle of Weldon Railroad was fought here, resulting in a Confederate victory. The town was also the site of the Battle of Weldon Road in 1865, which resulted in a Union victory.
Geography
Weldon is located in Halifax County, North Carolina, approximately 30 miles northeast of Raleigh. The town is situated on the Roanoke River, and is part of the Roanoke Rapids Micropolitan Statistical Area. The town has a total area of 1.3 square miles, all of which is land.
Economy
Weldon’s economy is largely based on agriculture and manufacturing. The town is home to several large farms, as well as several small businesses. The town is also home to a number of manufacturing companies, including a furniture factory, a textile mill, and a paper mill.
Demographics
As of the 2010 census, Weldon had a population of 2,000 people. The racial makeup of the town was 57.2% White, 37.2% African American, 0.3% Native American, 0.2% Asian, 0.1% Pacific Islander, and 4.2% from other races. The median household income was $25,000, and the median family income was $30,000.
Conclusion
Weldon, North Carolina is a small town located in Halifax County, North Carolina. It is situated on the Roanoke River, approximately 30 miles northeast of Raleigh. The town has a population of approximately 2,000 people and is part of the Roanoke Rapids Micropolitan Statistical Area. Weldon was founded in 1790 and has a rich history, including several battles during the Civil War. The town’s economy is largely based on agriculture and manufacturing, and the town has a diverse population.
Common Questions
What is Per Capita Income in Weldon?
Per Capita income in Weldon is $20,453.
What is the Median Family Income in Weldon?
Median Family Income in Weldon is $43,421.
What is the Median Household income in Weldon?
Median Household Income in Weldon is $37,330.
What is Income or Wage Gap in Weldon?
Income or Wage Gap in Weldon is 20.1%.
Women in Weldon earn 79.9 cents for every dollar earned by a man.
What is Inequality or Gini Index in Weldon?
Inequality or Gini Index in Weldon is 0.46.
What is the Total Population of Weldon?
Total Population of Weldon is 1,536.
What is the Total Male Population of Weldon?
Total Male Population of Weldon is 765.
What is the Total Female Population of Weldon?
Total Female Population of Weldon is 771.
What is the Ratio of Males per 100 Females in Weldon?
There are 99.22 Males per 100 Females in Weldon.
What is the Ratio of Females per 100 Males in Weldon?
There are 100.78 Females per 100 Males in Weldon.
What is the Median Population Age in Weldon?
Median Population Age in Weldon is 33.4 Years.
What is the Average Family Size in Weldon
Average Family Size in Weldon is 3.3 People.
What is the Average Household Size in Weldon
Average Household Size in Weldon is 2.8 People.
How Large is the Labor Force in Weldon?
There are 586 People in the Labor Forcein in Weldon.
What is the Percentage of People in the Labor Force in Weldon?
48.7% of People are in the Labor Force in Weldon.
What is the Unemployment Rate in Weldon?
Unemployment Rate in Weldon is 12.3%.