Walnut Cove, NC Map & Demographics
Walnut Cove Map
Walnut Cove Overview
$22,873
PER CAPITA INCOME
$61,324
AVG FAMILY INCOME
$42,398
AVG HOUSEHOLD INCOME
51.4%
WAGE / INCOME GAP [ % ]
48.6¢/ $1
WAGE / INCOME GAP [ $ ]
0.44
INEQUALITY / GINI INDEX
2,028
TOTAL POPULATION
1,029
MALE POPULATION
999
FEMALE POPULATION
103.00
MALES / 100 FEMALES
97.08
FEMALES / 100 MALES
40.5
MEDIAN AGE
3.7
AVG FAMILY SIZE
2.8
AVG HOUSEHOLD SIZE
955
LABOR FORCE [ PEOPLE ]
56.6%
PERCENT IN LABOR FORCE
4.2%
UNEMPLOYMENT RATE
Walnut Cove Zip Codes
Walnut Cove Area Codes
Income in Walnut Cove
Income Overview in Walnut Cove
Per Capita Income in Walnut Cove is $22,873, while median incomes of families and households are $61,324 and $42,398 respectively.
| Characteristic | Number | Measure |
| Per Capita Income | 2,028 | $22,873 |
| Median Family Income | 452 | $61,324 |
| Mean Family Income | 452 | $72,708 |
| Median Household Income | 686 | $42,398 |
| Mean Household Income | 686 | $57,361 |
| Income Deficit | 452 | $0 |
| Wage / Income Gap (%) | 2,028 | 51.37% |
| Wage / Income Gap ($) | 2,028 | 48.63¢ per $1 |
| Gini / Inequality Index | 2,028 | 0.44 |
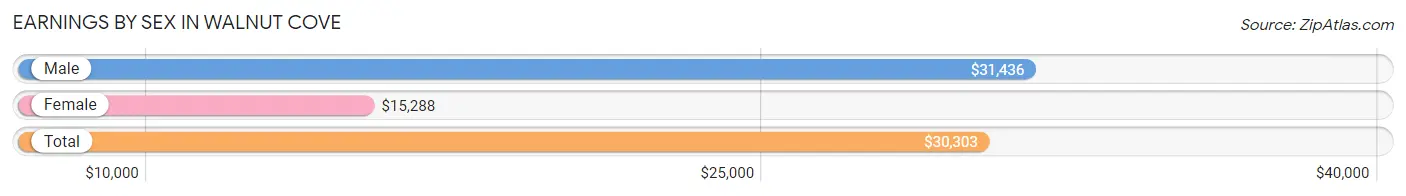
Earnings by Sex in Walnut Cove
Average Earnings in Walnut Cove are $30,303, $31,436 for men and $15,288 for women, a difference of 51.4%.
| Sex | Number | Average Earnings |
| Male | 539 (53.0%) | $31,436 |
| Female | 478 (47.0%) | $15,288 |
| Total | 1,017 (100.0%) | $30,303 |
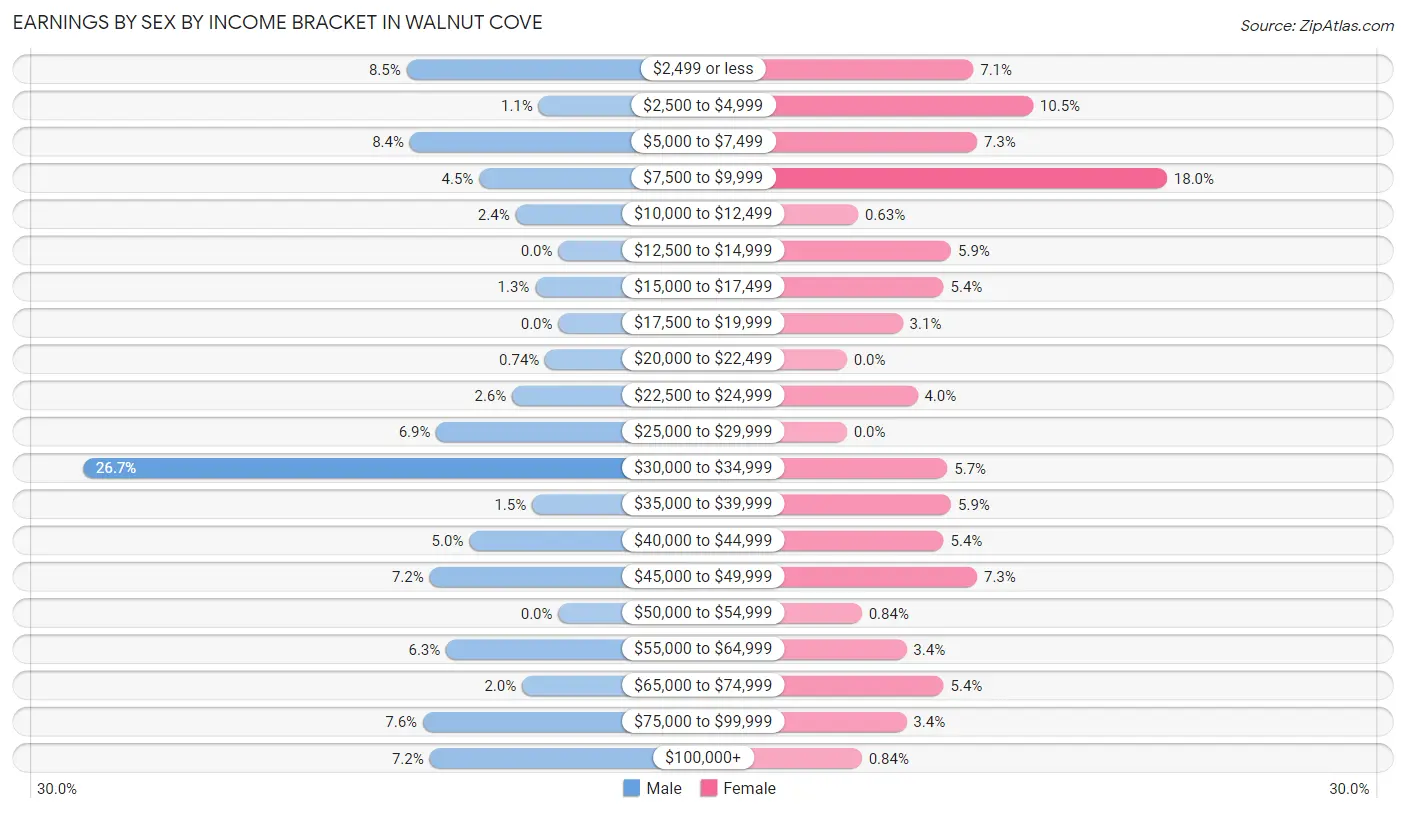
Earnings by Sex by Income Bracket in Walnut Cove
The most common earnings brackets in Walnut Cove are $30,000 to $34,999 for men (144 | 26.7%) and $7,500 to $9,999 for women (86 | 18.0%).
| Income | Male | Female |
| $2,499 or less | 46 (8.5%) | 34 (7.1%) |
| $2,500 to $4,999 | 6 (1.1%) | 50 (10.5%) |
| $5,000 to $7,499 | 45 (8.4%) | 35 (7.3%) |
| $7,500 to $9,999 | 24 (4.4%) | 86 (18.0%) |
| $10,000 to $12,499 | 13 (2.4%) | 3 (0.6%) |
| $12,500 to $14,999 | 0 (0.0%) | 28 (5.9%) |
| $15,000 to $17,499 | 7 (1.3%) | 26 (5.4%) |
| $17,500 to $19,999 | 0 (0.0%) | 15 (3.1%) |
| $20,000 to $22,499 | 4 (0.7%) | 0 (0.0%) |
| $22,500 to $24,999 | 14 (2.6%) | 19 (4.0%) |
| $25,000 to $29,999 | 37 (6.9%) | 0 (0.0%) |
| $30,000 to $34,999 | 144 (26.7%) | 27 (5.7%) |
| $35,000 to $39,999 | 8 (1.5%) | 28 (5.9%) |
| $40,000 to $44,999 | 27 (5.0%) | 26 (5.4%) |
| $45,000 to $49,999 | 39 (7.2%) | 35 (7.3%) |
| $50,000 to $54,999 | 0 (0.0%) | 4 (0.8%) |
| $55,000 to $64,999 | 34 (6.3%) | 16 (3.4%) |
| $65,000 to $74,999 | 11 (2.0%) | 26 (5.4%) |
| $75,000 to $99,999 | 41 (7.6%) | 16 (3.4%) |
| $100,000+ | 39 (7.2%) | 4 (0.8%) |
| Total | 539 (100.0%) | 478 (100.0%) |
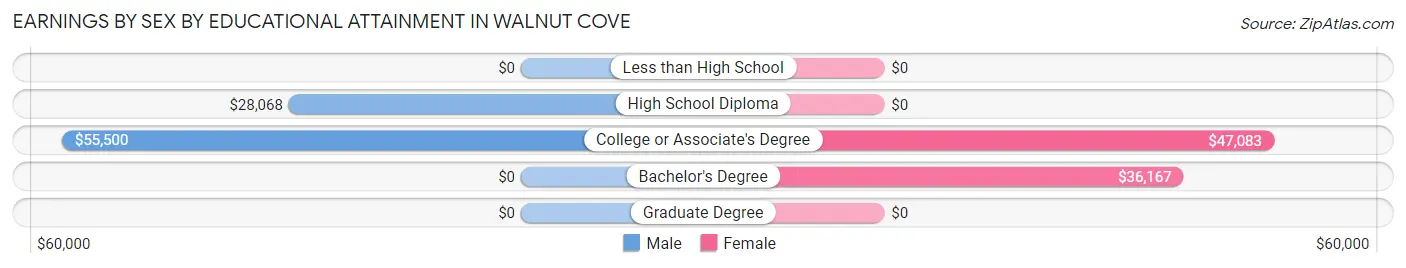
Earnings by Sex by Educational Attainment in Walnut Cove
Average earnings in Walnut Cove are $42,917 for men and $36,442 for women, a difference of 15.1%. Men with an educational attainment of college or associate's degree enjoy the highest average annual earnings of $55,500, while those with high school diploma education earn the least with $28,068. Women with an educational attainment of college or associate's degree earn the most with the average annual earnings of $47,083, while those with bachelor's degree education have the smallest earnings of $36,167.
| Educational Attainment | Male Income | Female Income |
| Less than High School | - | - |
| High School Diploma | $28,068 | $0 |
| College or Associate's Degree | $55,500 | $47,083 |
| Bachelor's Degree | - | - |
| Graduate Degree | - | - |
| Total | $42,917 | $36,442 |
Family Income in Walnut Cove
Family Income Brackets in Walnut Cove
According to the Walnut Cove family income data, there are 98 families falling into the $75,000 to $99,999 income range, which is the most common income bracket and makes up 21.7% of all families. Conversely, the $200,000+ income bracket is the least frequent group with only 5 families (1.1%) belonging to this category.
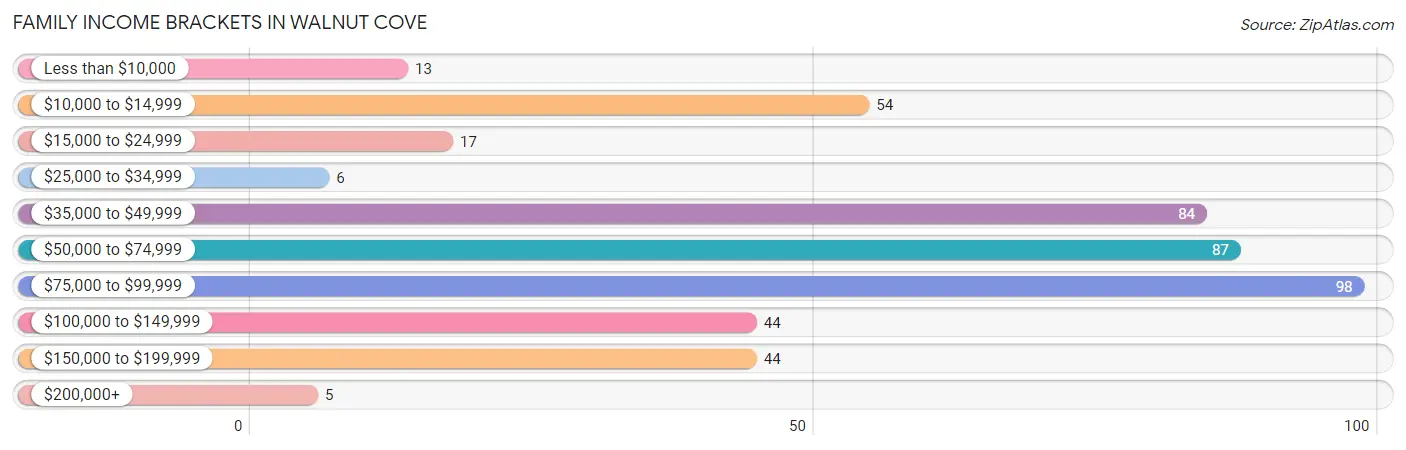
| Income Bracket | # Families | % Families |
| Less than $10,000 | 13 | 2.9% |
| $10,000 to $14,999 | 54 | 11.9% |
| $15,000 to $24,999 | 17 | 3.8% |
| $25,000 to $34,999 | 6 | 1.3% |
| $35,000 to $49,999 | 84 | 18.6% |
| $50,000 to $74,999 | 87 | 19.2% |
| $75,000 to $99,999 | 98 | 21.7% |
| $100,000 to $149,999 | 44 | 9.7% |
| $150,000 to $199,999 | 44 | 9.7% |
| $200,000+ | 5 | 1.1% |
Family Income by Famaliy Size in Walnut Cove
4-person families (95 | 21.0%) account for the highest median family income in Walnut Cove with $95,391 per family, while 2-person families (153 | 33.9%) have the highest median income of $29,896 per family member.
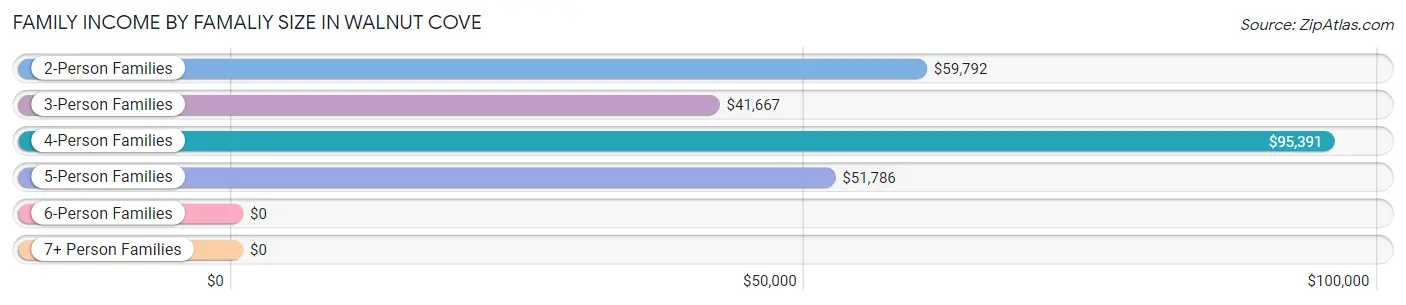
| Income Bracket | # Families | Median Income |
| 2-Person Families | 153 (33.9%) | $59,792 |
| 3-Person Families | 144 (31.9%) | $41,667 |
| 4-Person Families | 95 (21.0%) | $95,391 |
| 5-Person Families | 40 (8.8%) | $51,786 |
| 6-Person Families | 12 (2.6%) | $0 |
| 7+ Person Families | 8 (1.8%) | $0 |
| Total | 452 (100.0%) | $61,324 |
Family Income by Number of Earners in Walnut Cove
The median family income in Walnut Cove is $61,324, with families comprising 3+ earners (120) having the highest median family income of $95,625, while families with 1 earner (187) have the lowest median family income of $42,454, accounting for 26.6% and 41.4% of families, respectively.
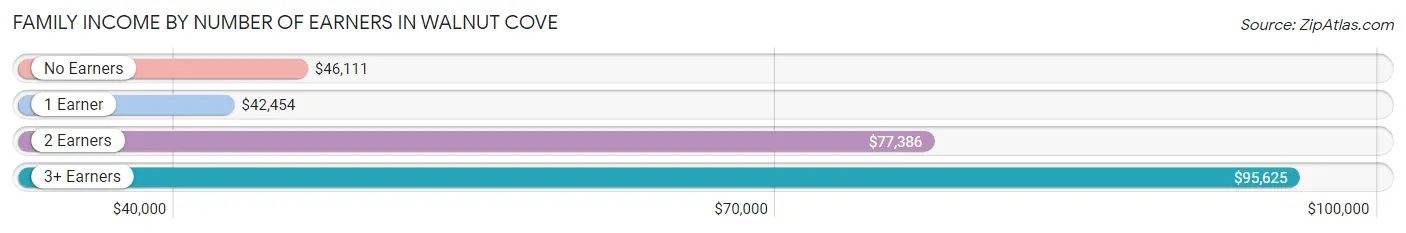
| Number of Earners | # Families | Median Income |
| No Earners | 58 (12.8%) | $46,111 |
| 1 Earner | 187 (41.4%) | $42,454 |
| 2 Earners | 87 (19.3%) | $77,386 |
| 3+ Earners | 120 (26.6%) | $95,625 |
| Total | 452 (100.0%) | $61,324 |
Household Income in Walnut Cove
Household Income Brackets in Walnut Cove
With 115 households falling in the category, the $15,000 to $24,999 income range is the most frequent in Walnut Cove, accounting for 16.8% of all households. In contrast, only 5 households (0.7%) fall into the $200,000+ income bracket, making it the least populous group.
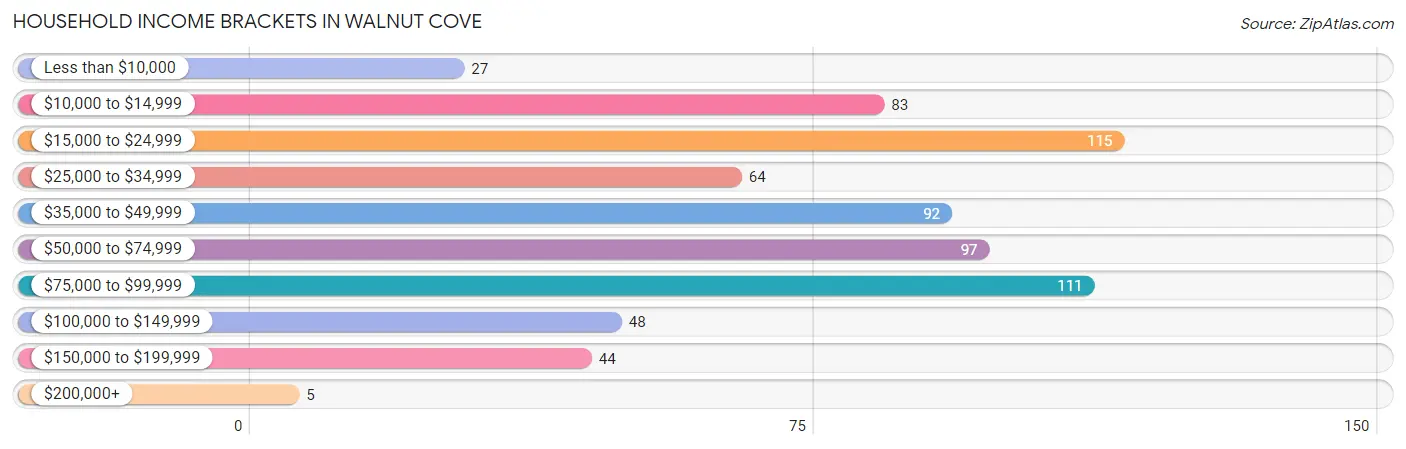
| Income Bracket | # Households | % Households |
| Less than $10,000 | 27 | 3.9% |
| $10,000 to $14,999 | 83 | 12.1% |
| $15,000 to $24,999 | 115 | 16.8% |
| $25,000 to $34,999 | 64 | 9.3% |
| $35,000 to $49,999 | 92 | 13.4% |
| $50,000 to $74,999 | 97 | 14.1% |
| $75,000 to $99,999 | 111 | 16.2% |
| $100,000 to $149,999 | 48 | 7.0% |
| $150,000 to $199,999 | 44 | 6.4% |
| $200,000+ | 5 | 0.7% |
Household Income by Householder Age in Walnut Cove
The median household income in Walnut Cove is $42,398, with the highest median household income of $68,646 found in the 25 to 44 years age bracket for the primary householder. A total of 125 households (18.2%) fall into this category. Meanwhile, the 15 to 24 years age bracket for the primary householder has the lowest median household income of $13,917, with 51 households (7.4%) in this group.
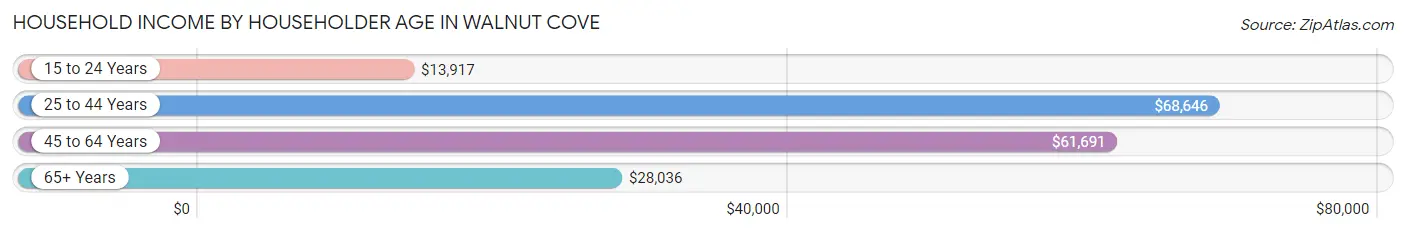
| Income Bracket | # Households | Median Income |
| 15 to 24 Years | 51 (7.4%) | $13,917 |
| 25 to 44 Years | 125 (18.2%) | $68,646 |
| 45 to 64 Years | 303 (44.2%) | $61,691 |
| 65+ Years | 207 (30.2%) | $28,036 |
| Total | 686 (100.0%) | $42,398 |
Poverty in Walnut Cove
Income Below Poverty by Sex and Age in Walnut Cove
With 12.0% poverty level for males and 13.4% for females among the residents of Walnut Cove, under 5 year old males and 5 year old females are the most vulnerable to poverty, with 58 males (69.9%) and 7 females (100.0%) in their respective age groups living below the poverty level.
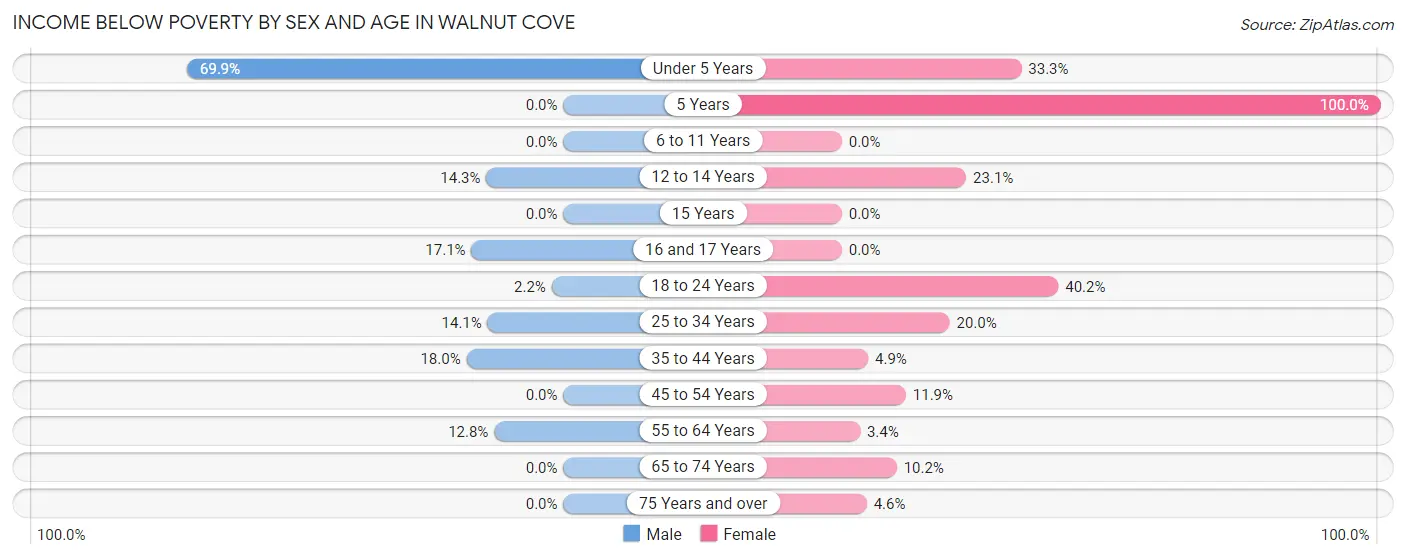
| Age Bracket | Male | Female |
| Under 5 Years | 58 (69.9%) | 10 (33.3%) |
| 5 Years | 0 (0.0%) | 7 (100.0%) |
| 6 to 11 Years | 0 (0.0%) | 0 (0.0%) |
| 12 to 14 Years | 7 (14.3%) | 12 (23.1%) |
| 15 Years | 0 (0.0%) | 0 (0.0%) |
| 16 and 17 Years | 7 (17.1%) | 0 (0.0%) |
| 18 to 24 Years | 5 (2.2%) | 45 (40.2%) |
| 25 to 34 Years | 9 (14.1%) | 8 (20.0%) |
| 35 to 44 Years | 16 (18.0%) | 4 (4.9%) |
| 45 to 54 Years | 0 (0.0%) | 17 (11.9%) |
| 55 to 64 Years | 19 (12.8%) | 3 (3.4%) |
| 65 to 74 Years | 0 (0.0%) | 11 (10.2%) |
| 75 Years and over | 0 (0.0%) | 6 (4.6%) |
| Total | 121 (12.0%) | 123 (13.4%) |
Income Above Poverty by Sex and Age in Walnut Cove
According to the poverty statistics in Walnut Cove, males aged 5 years and females aged 6 to 11 years are the age groups that are most secure financially, with 100.0% of males and 100.0% of females in these age groups living above the poverty line.
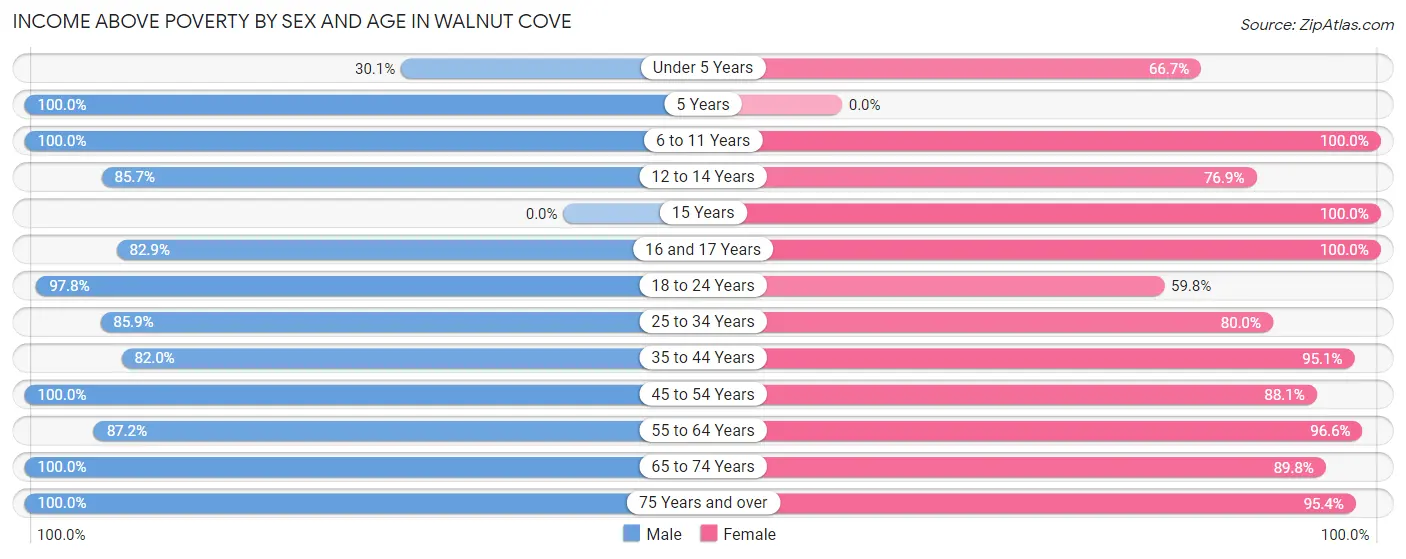
| Age Bracket | Male | Female |
| Under 5 Years | 25 (30.1%) | 20 (66.7%) |
| 5 Years | 16 (100.0%) | 0 (0.0%) |
| 6 to 11 Years | 83 (100.0%) | 16 (100.0%) |
| 12 to 14 Years | 42 (85.7%) | 40 (76.9%) |
| 15 Years | 0 (0.0%) | 5 (100.0%) |
| 16 and 17 Years | 34 (82.9%) | 107 (100.0%) |
| 18 to 24 Years | 225 (97.8%) | 67 (59.8%) |
| 25 to 34 Years | 55 (85.9%) | 32 (80.0%) |
| 35 to 44 Years | 73 (82.0%) | 78 (95.1%) |
| 45 to 54 Years | 144 (100.0%) | 126 (88.1%) |
| 55 to 64 Years | 129 (87.2%) | 86 (96.6%) |
| 65 to 74 Years | 47 (100.0%) | 97 (89.8%) |
| 75 Years and over | 18 (100.0%) | 124 (95.4%) |
| Total | 891 (88.0%) | 798 (86.6%) |
Income Below Poverty Among Married-Couple Families in Walnut Cove
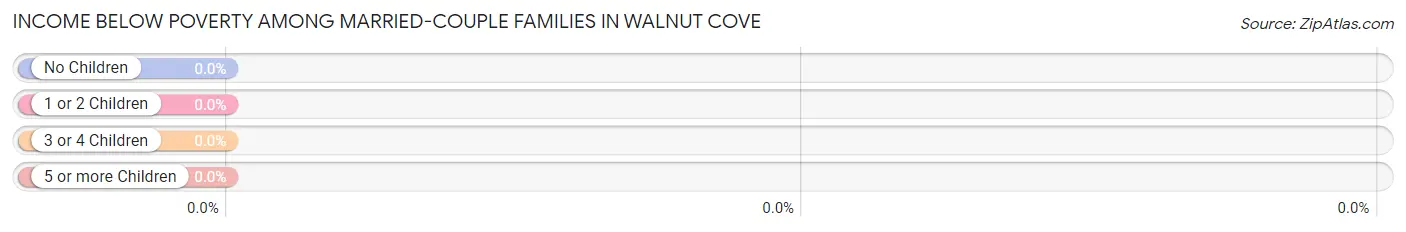
| Children | Above Poverty | Below Poverty |
| No Children | 169 (100.0%) | 0 (0.0%) |
| 1 or 2 Children | 92 (100.0%) | 0 (0.0%) |
| 3 or 4 Children | 13 (100.0%) | 0 (0.0%) |
| 5 or more Children | 0 (0.0%) | 0 (0.0%) |
| Total | 274 (100.0%) | 0 (0.0%) |
Income Below Poverty Among Single-Parent Households in Walnut Cove
According to the poverty data in Walnut Cove, 32.1% or 9 single-father households and 45.3% or 68 single-mother households are living below the poverty line. Among single-father households, those with 1 or 2 children have the highest poverty rate, with 9 households (45.0%) experiencing poverty. Likewise, among single-mother households, those with 1 or 2 children have the highest poverty rate, with 64 households (64.6%) falling below the poverty line.
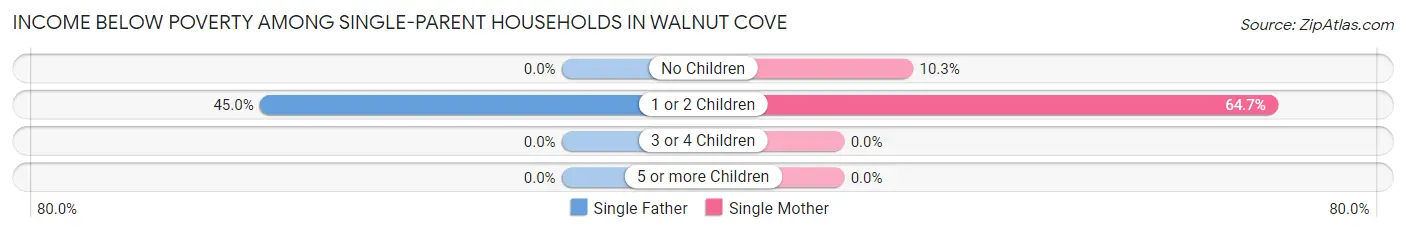
| Children | Single Father | Single Mother |
| No Children | 0 (0.0%) | 4 (10.3%) |
| 1 or 2 Children | 9 (45.0%) | 64 (64.6%) |
| 3 or 4 Children | 0 (0.0%) | 0 (0.0%) |
| 5 or more Children | 0 (0.0%) | 0 (0.0%) |
| Total | 9 (32.1%) | 68 (45.3%) |
Income Below Poverty Among Married-Couple vs Single-Parent Households in Walnut Cove
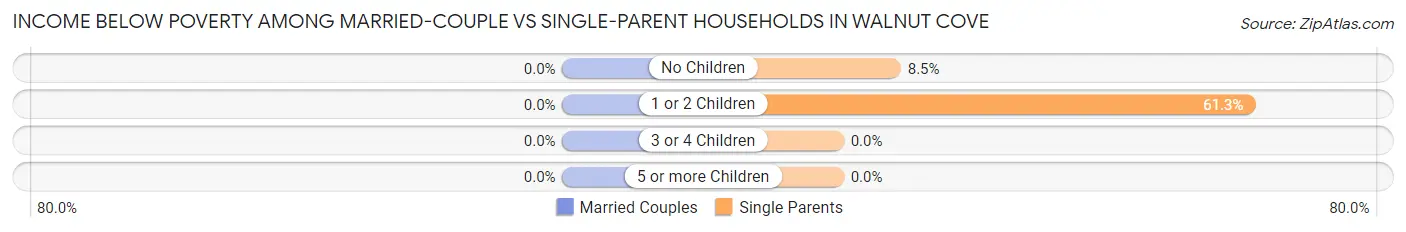
| Children | Married-Couple Families | Single-Parent Households |
| No Children | 0 (0.0%) | 4 (8.5%) |
| 1 or 2 Children | 0 (0.0%) | 73 (61.3%) |
| 3 or 4 Children | 0 (0.0%) | 0 (0.0%) |
| 5 or more Children | 0 (0.0%) | 0 (0.0%) |
| Total | 0 (0.0%) | 77 (43.3%) |
Race in Walnut Cove
The most populous races in Walnut Cove are White / Caucasian (1,200 | 59.2%), Black / African American (599 | 29.5%), and Two or more Races (224 | 11.1%).
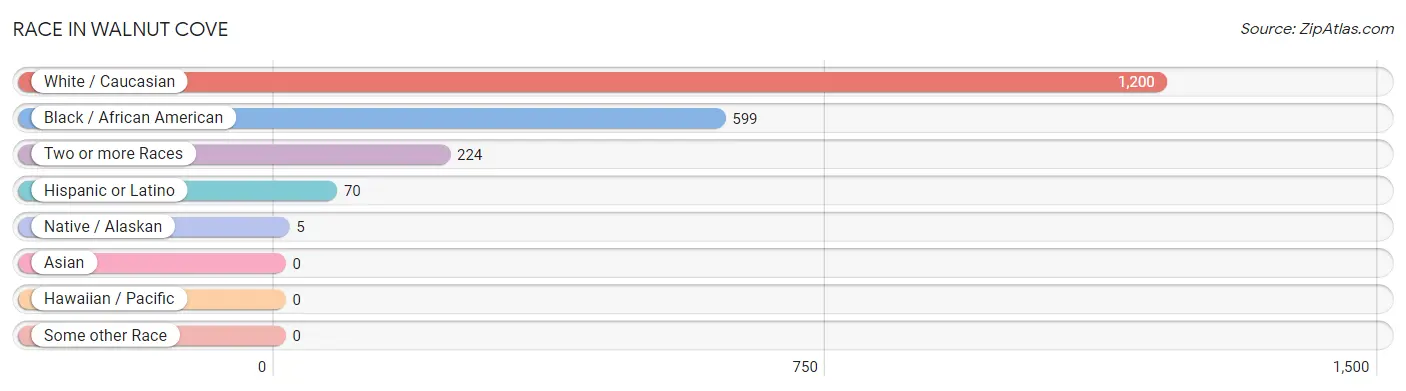
| Race | # Population | % Population |
| Asian | 0 | 0.0% |
| Black / African American | 599 | 29.5% |
| Hawaiian / Pacific | 0 | 0.0% |
| Hispanic or Latino | 70 | 3.5% |
| Native / Alaskan | 5 | 0.3% |
| White / Caucasian | 1,200 | 59.2% |
| Two or more Races | 224 | 11.1% |
| Some other Race | 0 | 0.0% |
| Total | 2,028 | 100.0% |
Ancestry in Walnut Cove
The most populous ancestries reported in Walnut Cove are English (222 | 11.0%), American (121 | 6.0%), German (108 | 5.3%), Irish (79 | 3.9%), and Puerto Rican (70 | 3.5%), together accounting for 29.6% of all Walnut Cove residents.
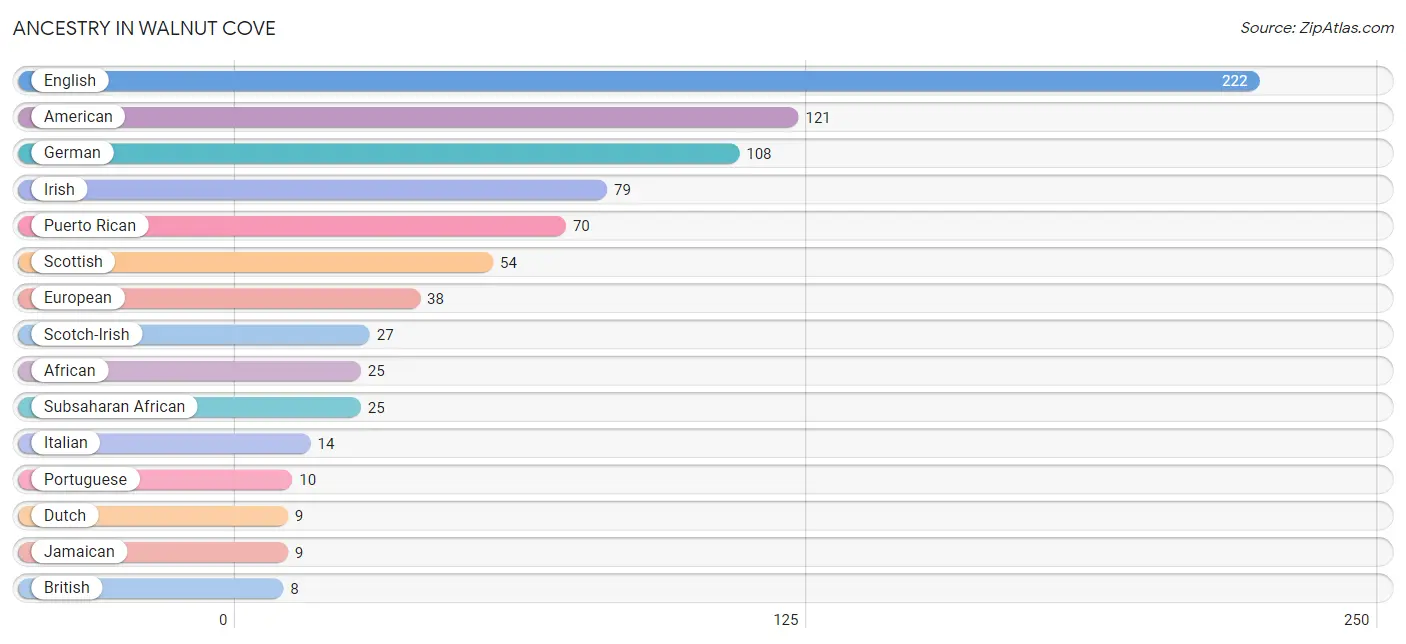
| Ancestry | # Population | % Population |
| African | 25 | 1.2% |
| American | 121 | 6.0% |
| Belgian | 3 | 0.2% |
| British | 8 | 0.4% |
| Canadian | 2 | 0.1% |
| Cherokee | 3 | 0.2% |
| Dutch | 9 | 0.4% |
| English | 222 | 11.0% |
| European | 38 | 1.9% |
| French | 3 | 0.2% |
| German | 108 | 5.3% |
| Irish | 79 | 3.9% |
| Italian | 14 | 0.7% |
| Jamaican | 9 | 0.4% |
| Lumbee | 3 | 0.2% |
| Northern European | 7 | 0.4% |
| Polish | 4 | 0.2% |
| Portuguese | 10 | 0.5% |
| Puerto Rican | 70 | 3.5% |
| Russian | 8 | 0.4% |
| Scandinavian | 2 | 0.1% |
| Scotch-Irish | 27 | 1.3% |
| Scottish | 54 | 2.7% |
| Subsaharan African | 25 | 1.2% | View All 24 Rows |
Immigrants in Walnut Cove
The most numerous immigrant groups reported in Walnut Cove came from Europe (25 | 1.2%), Northern Europe (17 | 0.8%), England (9 | 0.4%), Western Europe (8 | 0.4%), and Germany (7 | 0.4%), together accounting for 3.3% of all Walnut Cove residents.
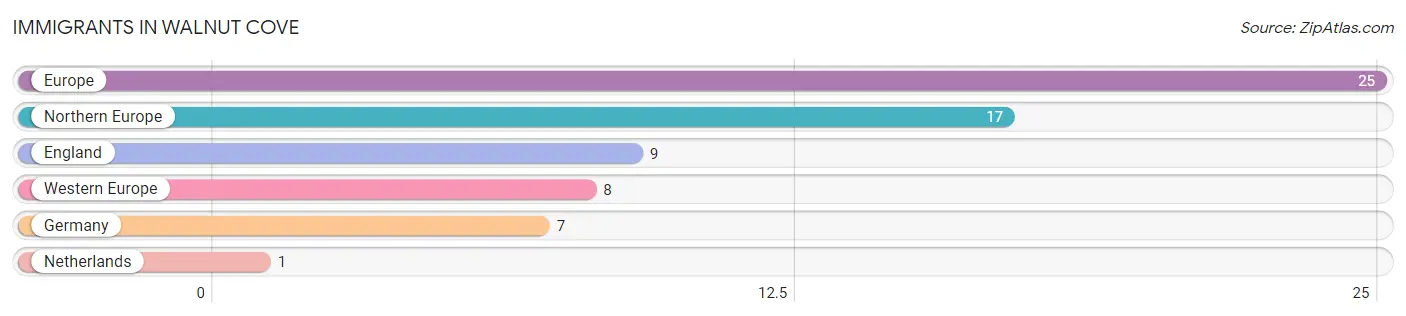
| Immigration Origin | # Population | % Population |
| England | 9 | 0.4% |
| Europe | 25 | 1.2% |
| Germany | 7 | 0.4% |
| Netherlands | 1 | 0.1% |
| Northern Europe | 17 | 0.8% |
| Western Europe | 8 | 0.4% | View All 6 Rows |
Sex and Age in Walnut Cove
Sex and Age in Walnut Cove
The most populous age groups in Walnut Cove are 20 to 24 Years (184 | 17.9%) for men and 15 to 19 Years (117 | 11.7%) for women.
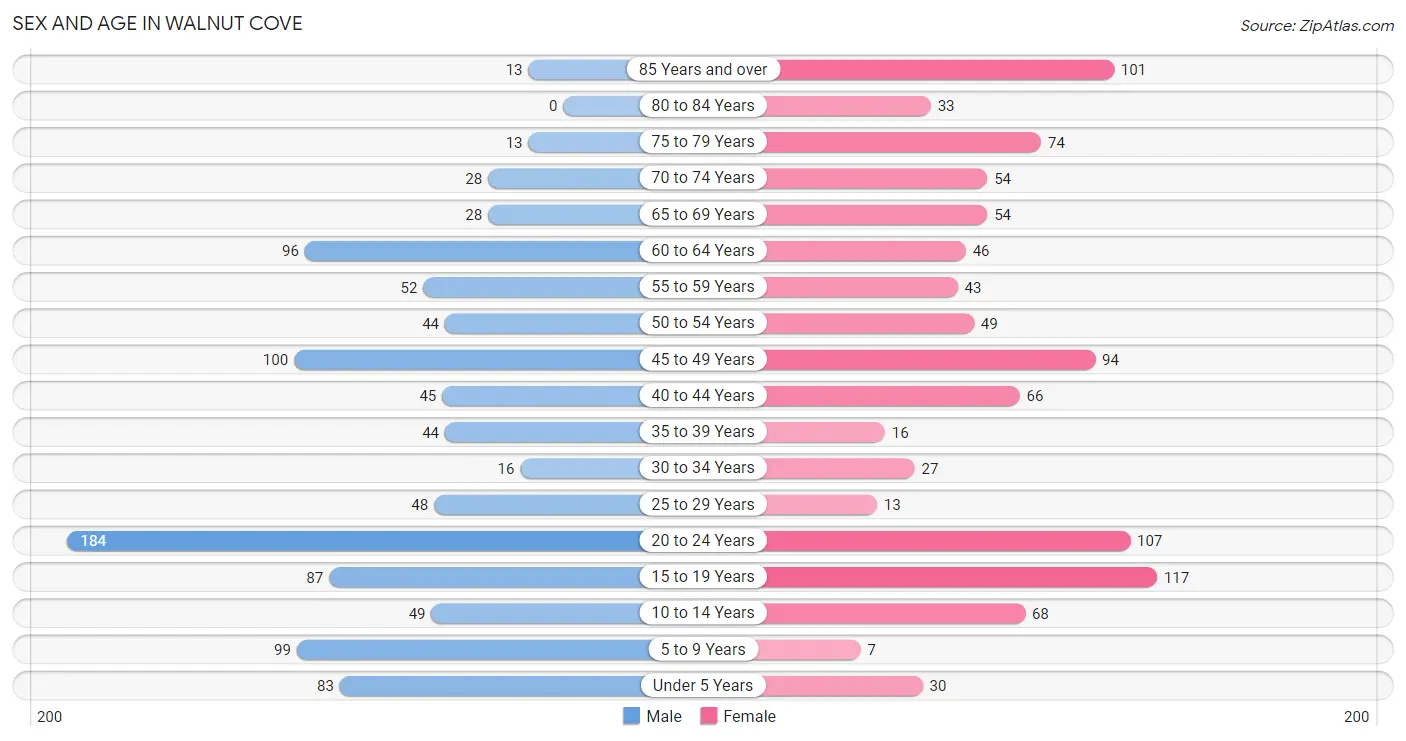
| Age Bracket | Male | Female |
| Under 5 Years | 83 (8.1%) | 30 (3.0%) |
| 5 to 9 Years | 99 (9.6%) | 7 (0.7%) |
| 10 to 14 Years | 49 (4.8%) | 68 (6.8%) |
| 15 to 19 Years | 87 (8.5%) | 117 (11.7%) |
| 20 to 24 Years | 184 (17.9%) | 107 (10.7%) |
| 25 to 29 Years | 48 (4.7%) | 13 (1.3%) |
| 30 to 34 Years | 16 (1.5%) | 27 (2.7%) |
| 35 to 39 Years | 44 (4.3%) | 16 (1.6%) |
| 40 to 44 Years | 45 (4.4%) | 66 (6.6%) |
| 45 to 49 Years | 100 (9.7%) | 94 (9.4%) |
| 50 to 54 Years | 44 (4.3%) | 49 (4.9%) |
| 55 to 59 Years | 52 (5.1%) | 43 (4.3%) |
| 60 to 64 Years | 96 (9.3%) | 46 (4.6%) |
| 65 to 69 Years | 28 (2.7%) | 54 (5.4%) |
| 70 to 74 Years | 28 (2.7%) | 54 (5.4%) |
| 75 to 79 Years | 13 (1.3%) | 74 (7.4%) |
| 80 to 84 Years | 0 (0.0%) | 33 (3.3%) |
| 85 Years and over | 13 (1.3%) | 101 (10.1%) |
| Total | 1,029 (100.0%) | 999 (100.0%) |
Families and Households in Walnut Cove
Median Family Size in Walnut Cove
The median family size in Walnut Cove is 3.69 persons per family, with married-couple families (274 | 60.6%) accounting for the largest median family size of 4.1 persons per family. On the other hand, single male/father families (28 | 6.2%) represent the smallest median family size with 2.68 persons per family.
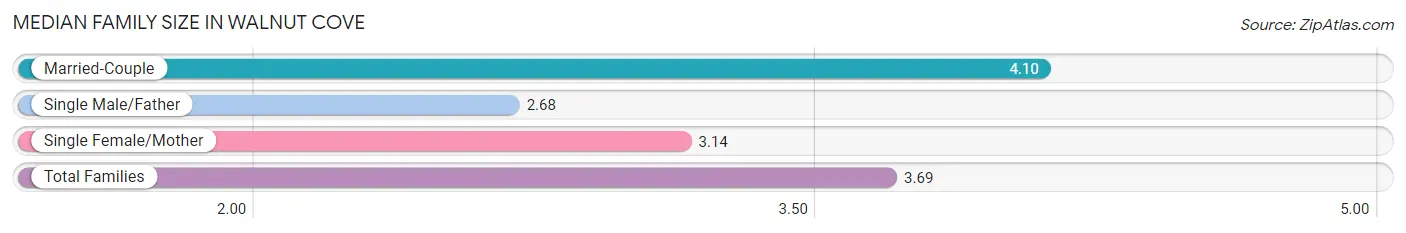
| Family Type | # Families | Family Size |
| Married-Couple | 274 (60.6%) | 4.10 |
| Single Male/Father | 28 (6.2%) | 2.68 |
| Single Female/Mother | 150 (33.2%) | 3.14 |
| Total Families | 452 (100.0%) | 3.69 |
Median Household Size in Walnut Cove
The median household size in Walnut Cove is 2.81 persons per household, with married-couple households (274 | 39.9%) accounting for the largest median household size of 4.1 persons per household. non-family households (234 | 34.1%) represent the smallest median household size with 1.03 persons per household.
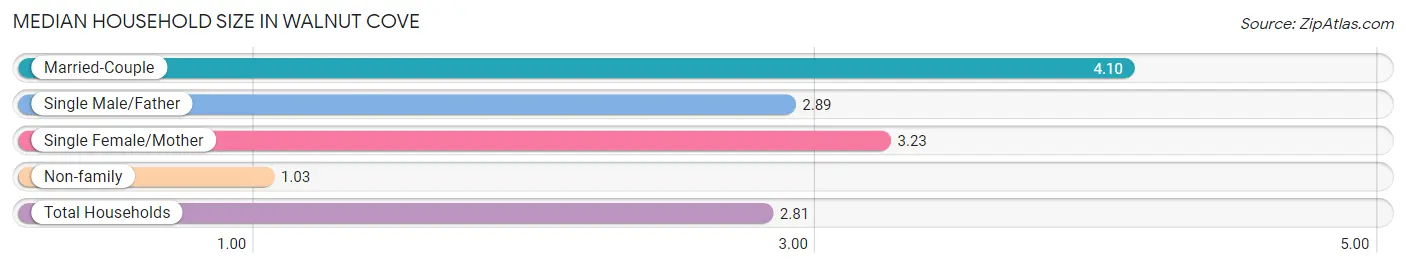
| Household Type | # Households | Household Size |
| Married-Couple | 274 (39.9%) | 4.10 |
| Single Male/Father | 28 (4.1%) | 2.89 |
| Single Female/Mother | 150 (21.9%) | 3.23 |
| Non-family | 234 (34.1%) | 1.03 |
| Total Households | 686 (100.0%) | 2.81 |
Household Size by Marriage Status in Walnut Cove
Out of a total of 686 households in Walnut Cove, 452 (65.9%) are family households, while 234 (34.1%) are nonfamily households. The most numerous type of family households are 2-person households, comprising 146, and the most common type of nonfamily households are 1-person households, comprising 230.
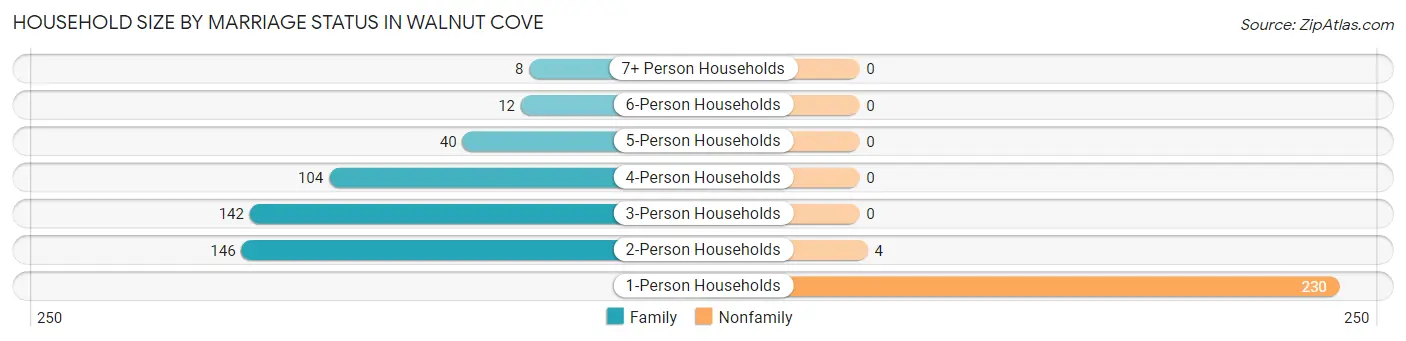
| Household Size | Family Households | Nonfamily Households |
| 1-Person Households | - | 230 (33.5%) |
| 2-Person Households | 146 (21.3%) | 4 (0.6%) |
| 3-Person Households | 142 (20.7%) | 0 (0.0%) |
| 4-Person Households | 104 (15.2%) | 0 (0.0%) |
| 5-Person Households | 40 (5.8%) | 0 (0.0%) |
| 6-Person Households | 12 (1.8%) | 0 (0.0%) |
| 7+ Person Households | 8 (1.2%) | 0 (0.0%) |
| Total | 452 (65.9%) | 234 (34.1%) |
Female Fertility in Walnut Cove
Fertility by Age in Walnut Cove
Average fertility rate in Walnut Cove is 18.0 births per 1,000 women. Women in the age bracket of 20 to 34 years have the highest fertility rate with 54.0 births per 1,000 women. Women in the age bracket of 20 to 34 years acount for 100.0% of all women with births.
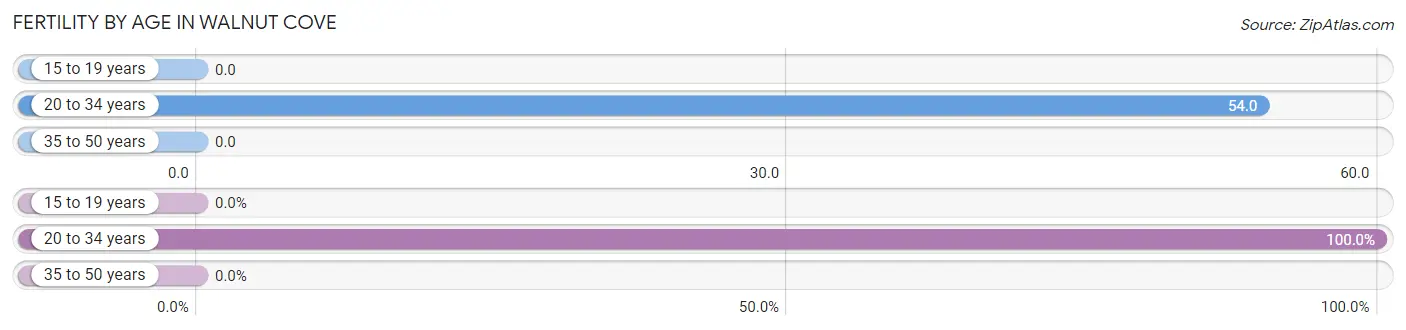
| Age Bracket | Women with Births | Births / 1,000 Women |
| 15 to 19 years | 0 (0.0%) | 0.0 |
| 20 to 34 years | 8 (100.0%) | 54.0 |
| 35 to 50 years | 0 (0.0%) | 0.0 |
| Total | 8 (100.0%) | 18.0 |
Fertility by Age by Marriage Status in Walnut Cove
25.0% of women with births (8) in Walnut Cove are married. The highest percentage of unmarried women with births falls into 20 to 34 years age bracket with 75.0% of them unmarried at the time of birth, while the lowest percentage of unmarried women with births belong to 20 to 34 years age bracket with 75.0% of them unmarried.
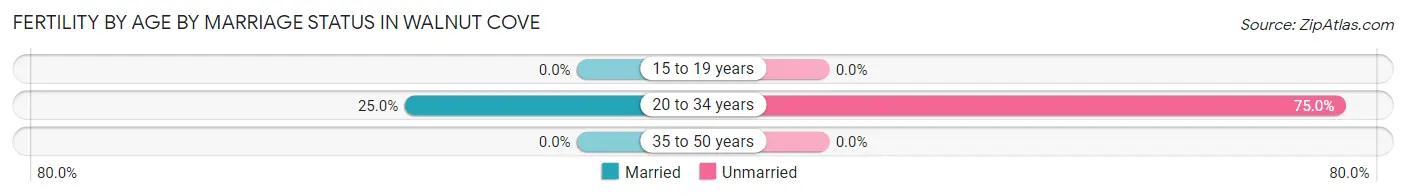
| Age Bracket | Married | Unmarried |
| 15 to 19 years | 0 (0.0%) | 0 (0.0%) |
| 20 to 34 years | 2 (25.0%) | 6 (75.0%) |
| 35 to 50 years | 0 (0.0%) | 0 (0.0%) |
| Total | 2 (25.0%) | 6 (75.0%) |
Fertility by Education in Walnut Cove
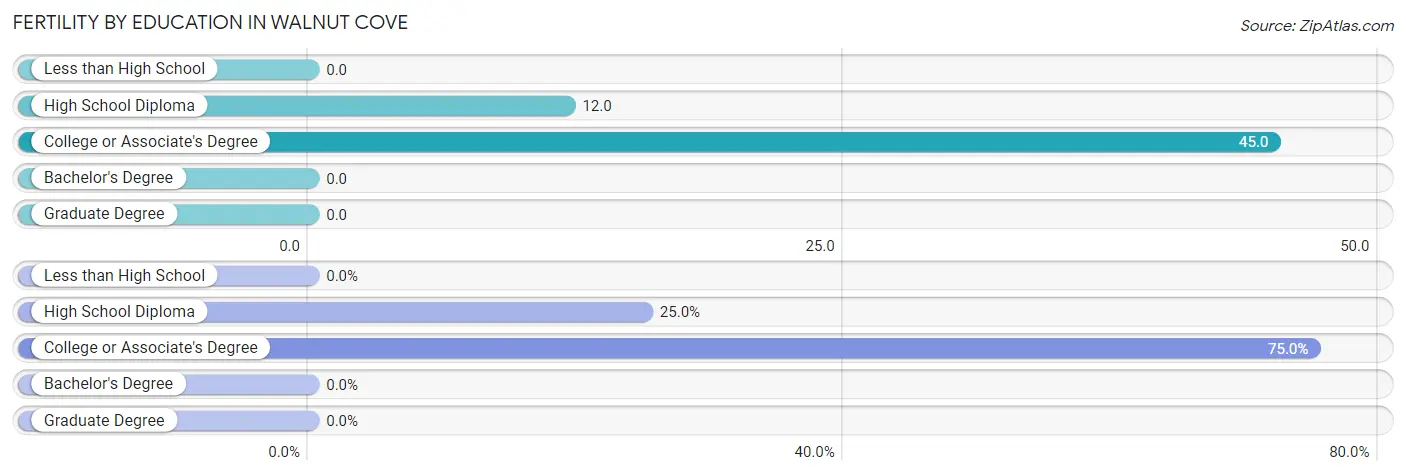
| Educational Attainment | Women with Births | Births / 1,000 Women |
| Less than High School | 0 (0.0%) | 0.0 |
| High School Diploma | 2 (25.0%) | 12.0 |
| College or Associate's Degree | 6 (75.0%) | 45.0 |
| Bachelor's Degree | 0 (0.0%) | 0.0 |
| Graduate Degree | 0 (0.0%) | 0.0 |
| Total | 8 (100.0%) | 18.0 |
Fertility by Education by Marriage Status in Walnut Cove
75.0% of women with births in Walnut Cove are unmarried. Women with the educational attainment of high school diploma are most likely to be married with 100.0% of them married at childbirth, while women with the educational attainment of college or associate's degree are least likely to be married with 100.0% of them unmarried at childbirth.
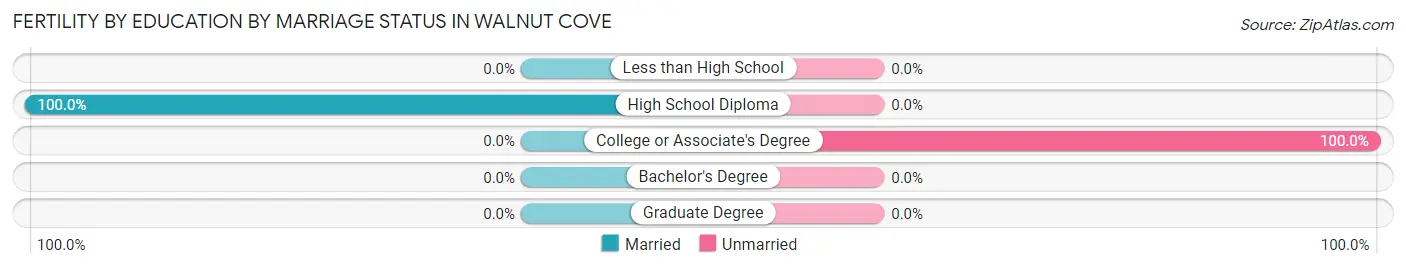
| Educational Attainment | Married | Unmarried |
| Less than High School | 0 (0.0%) | 0 (0.0%) |
| High School Diploma | 2 (100.0%) | 0 (0.0%) |
| College or Associate's Degree | 0 (0.0%) | 6 (100.0%) |
| Bachelor's Degree | 0 (0.0%) | 0 (0.0%) |
| Graduate Degree | 0 (0.0%) | 0 (0.0%) |
| Total | 2 (25.0%) | 6 (75.0%) |
Employment Characteristics in Walnut Cove
Employment by Class of Employer in Walnut Cove
Among the 914 employed individuals in Walnut Cove, private company employees (625 | 68.4%), local government employees (92 | 10.1%), and self-employed (not incorporated) (50 | 5.5%) make up the most common classes of employment.
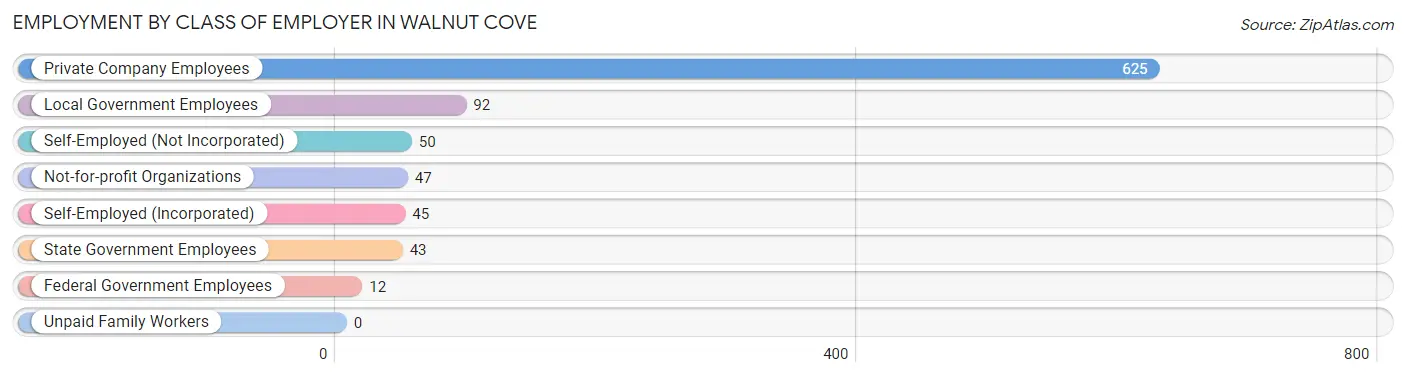
| Employer Class | # Employees | % Employees |
| Private Company Employees | 625 | 68.4% |
| Self-Employed (Incorporated) | 45 | 4.9% |
| Self-Employed (Not Incorporated) | 50 | 5.5% |
| Not-for-profit Organizations | 47 | 5.1% |
| Local Government Employees | 92 | 10.1% |
| State Government Employees | 43 | 4.7% |
| Federal Government Employees | 12 | 1.3% |
| Unpaid Family Workers | 0 | 0.0% |
| Total | 914 | 100.0% |
Employment Status by Age in Walnut Cove
According to the labor force statistics for Walnut Cove, out of the total population over 16 years of age (1,687), 56.6% or 955 individuals are in the labor force, with 4.2% or 40 of them unemployed. The age group with the highest labor force participation rate is 25 to 29 years, with 100.0% or 61 individuals in the labor force. Within the labor force, the 65 to 74 years age range has the highest percentage of unemployed individuals, with 32.0% or 8 of them being unemployed.
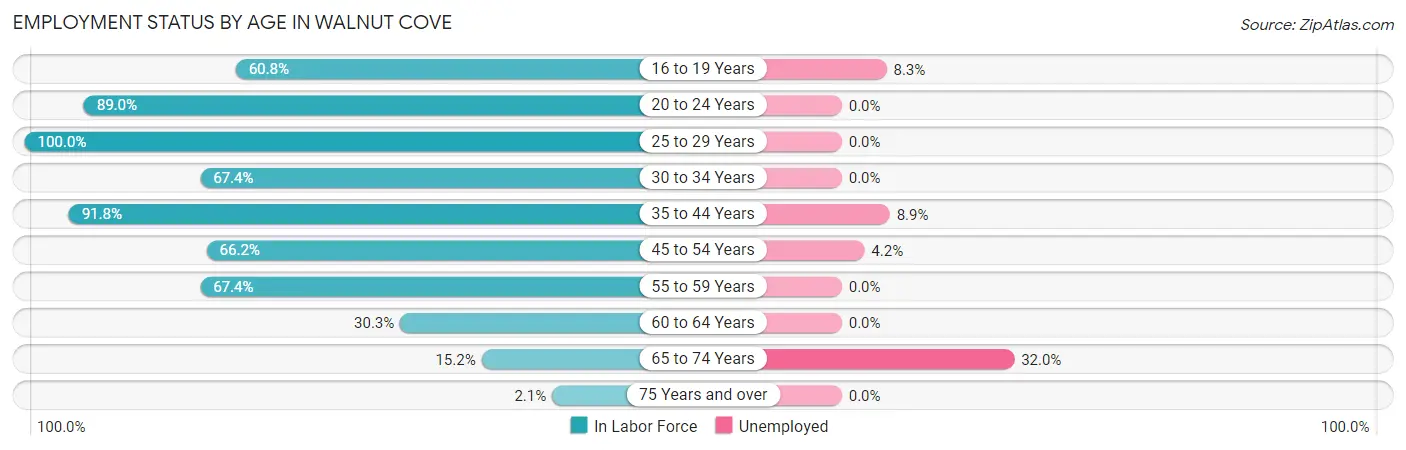
| Age Bracket | In Labor Force | Unemployed |
| 16 to 19 Years | 121 (60.8%) | 10 (8.3%) |
| 20 to 24 Years | 259 (89.0%) | 0 (0.0%) |
| 25 to 29 Years | 61 (100.0%) | 0 (0.0%) |
| 30 to 34 Years | 29 (67.4%) | 0 (0.0%) |
| 35 to 44 Years | 157 (91.8%) | 14 (8.9%) |
| 45 to 54 Years | 190 (66.2%) | 8 (4.2%) |
| 55 to 59 Years | 64 (67.4%) | 0 (0.0%) |
| 60 to 64 Years | 43 (30.3%) | 0 (0.0%) |
| 65 to 74 Years | 25 (15.2%) | 8 (32.0%) |
| 75 Years and over | 5 (2.1%) | 0 (0.0%) |
| Total | 955 (56.6%) | 40 (4.2%) |
Employment Status by Educational Attainment in Walnut Cove
According to labor force statistics for Walnut Cove, 68.1% of individuals (544) out of the total population between 25 and 64 years of age (799) are in the labor force, with 4.0% or 22 of them being unemployed. The group with the highest labor force participation rate are those with the educational attainment of college / associate degree, with 76.2% or 282 individuals in the labor force. Within the labor force, individuals with high school diploma education have the highest percentage of unemployment, with 10.8% or 18 of them being unemployed.
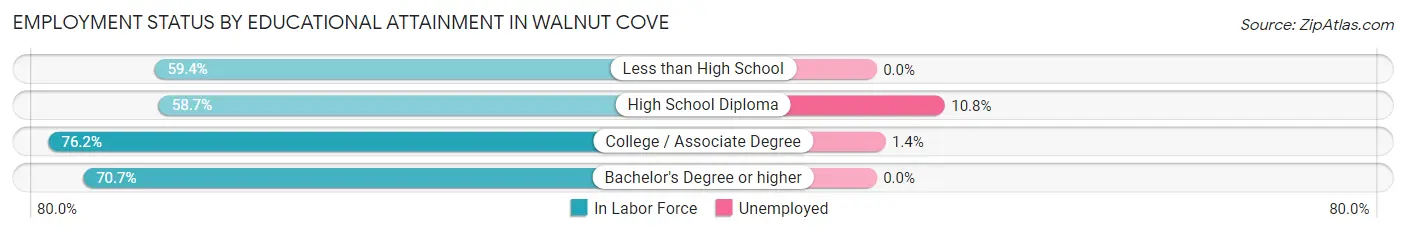
| Educational Attainment | In Labor Force | Unemployed |
| Less than High School | 38 (59.4%) | 0 (0.0%) |
| High School Diploma | 166 (58.7%) | 31 (10.8%) |
| College / Associate Degree | 282 (76.2%) | 5 (1.4%) |
| Bachelor's Degree or higher | 58 (70.7%) | 0 (0.0%) |
| Total | 544 (68.1%) | 32 (4.0%) |
Employment Occupations by Sex in Walnut Cove
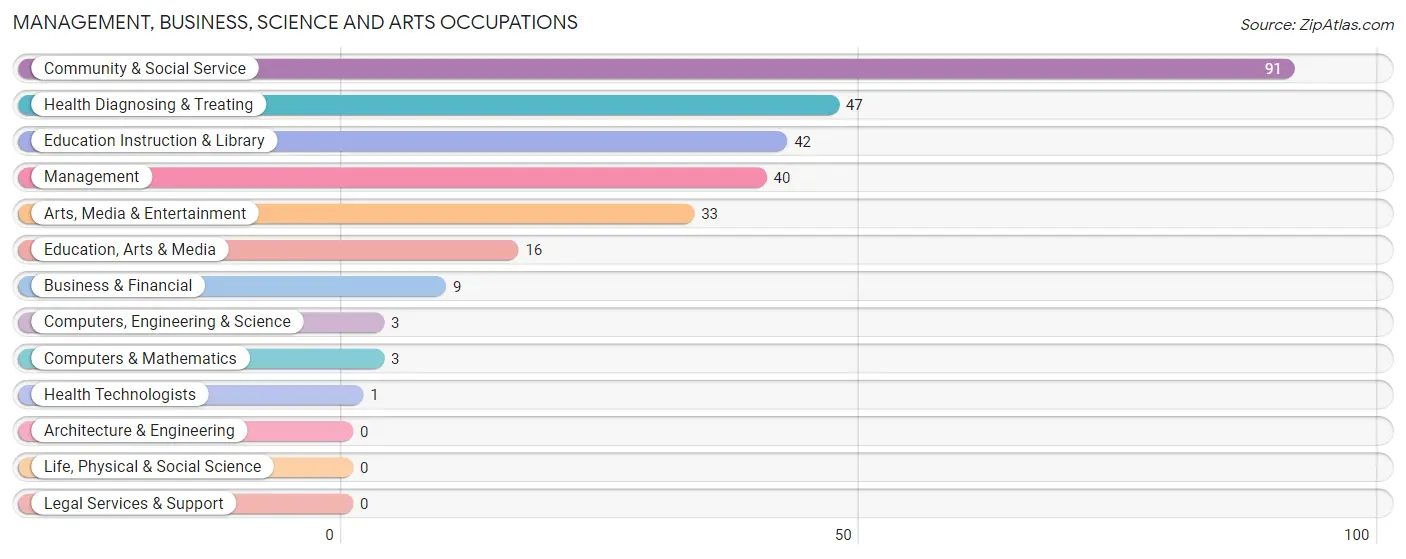
Management, Business, Science and Arts Occupations
The most common Management, Business, Science and Arts occupations in Walnut Cove are Community & Social Service (91 | 10.0%), Health Diagnosing & Treating (47 | 5.2%), Education Instruction & Library (42 | 4.6%), Management (40 | 4.4%), and Arts, Media & Entertainment (33 | 3.6%).
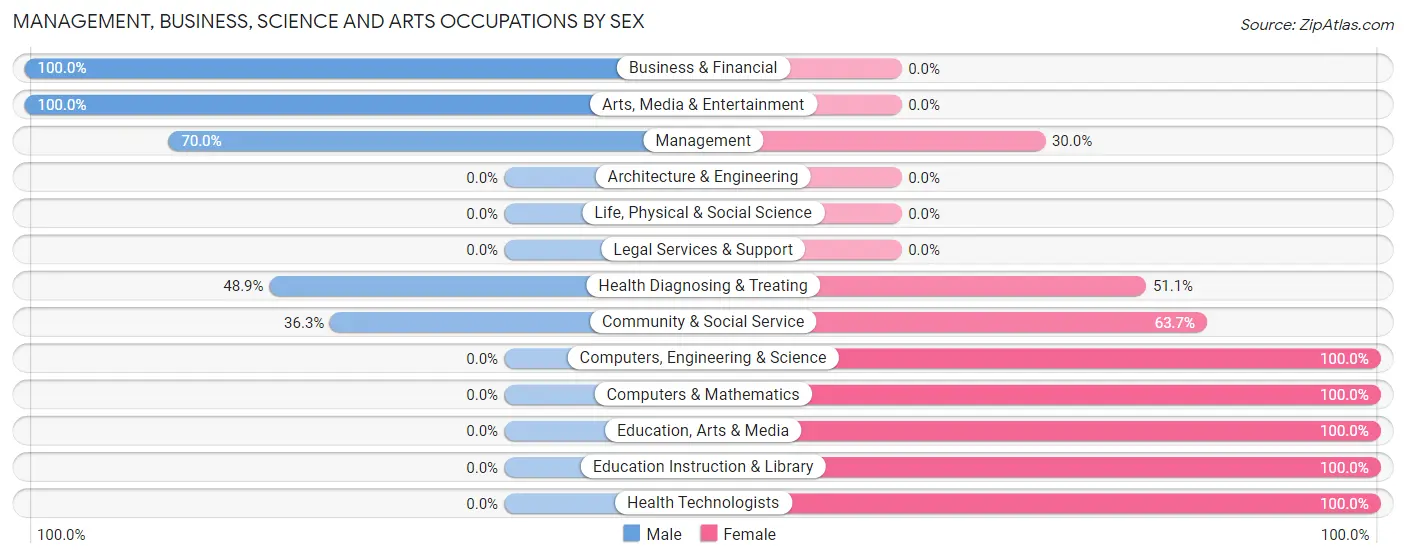
Management, Business, Science and Arts Occupations by Sex
Within the Management, Business, Science and Arts occupations in Walnut Cove, the most male-oriented occupations are Business & Financial (100.0%), Arts, Media & Entertainment (100.0%), and Management (70.0%), while the most female-oriented occupations are Computers, Engineering & Science (100.0%), Computers & Mathematics (100.0%), and Education, Arts & Media (100.0%).
| Occupation | Male | Female |
| Management | 28 (70.0%) | 12 (30.0%) |
| Business & Financial | 9 (100.0%) | 0 (0.0%) |
| Computers, Engineering & Science | 0 (0.0%) | 3 (100.0%) |
| Computers & Mathematics | 0 (0.0%) | 3 (100.0%) |
| Architecture & Engineering | 0 (0.0%) | 0 (0.0%) |
| Life, Physical & Social Science | 0 (0.0%) | 0 (0.0%) |
| Community & Social Service | 33 (36.3%) | 58 (63.7%) |
| Education, Arts & Media | 0 (0.0%) | 16 (100.0%) |
| Legal Services & Support | 0 (0.0%) | 0 (0.0%) |
| Education Instruction & Library | 0 (0.0%) | 42 (100.0%) |
| Arts, Media & Entertainment | 33 (100.0%) | 0 (0.0%) |
| Health Diagnosing & Treating | 23 (48.9%) | 24 (51.1%) |
| Health Technologists | 0 (0.0%) | 1 (100.0%) |
| Total (Category) | 93 (48.9%) | 97 (51.0%) |
| Total (Overall) | 496 (54.5%) | 414 (45.5%) |
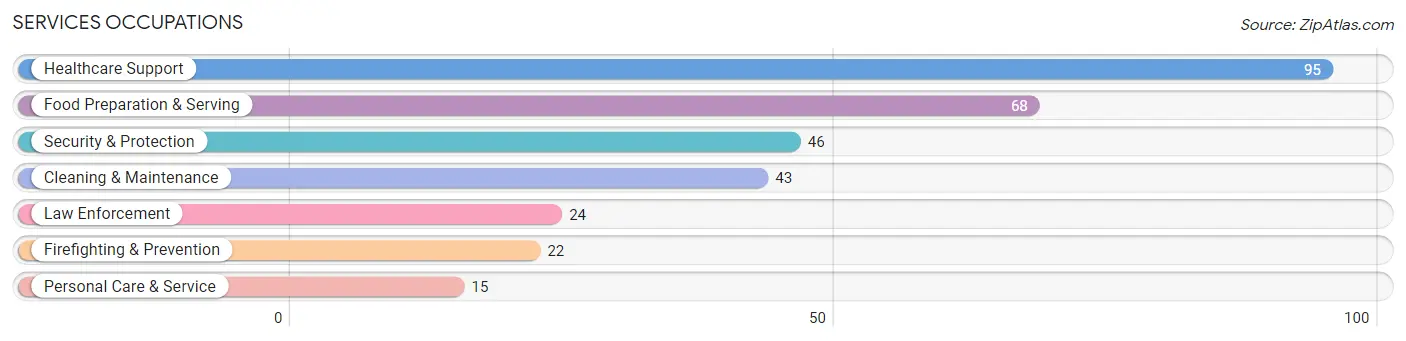
Services Occupations
The most common Services occupations in Walnut Cove are Healthcare Support (95 | 10.4%), Food Preparation & Serving (68 | 7.5%), Security & Protection (46 | 5.1%), Cleaning & Maintenance (43 | 4.7%), and Law Enforcement (24 | 2.6%).
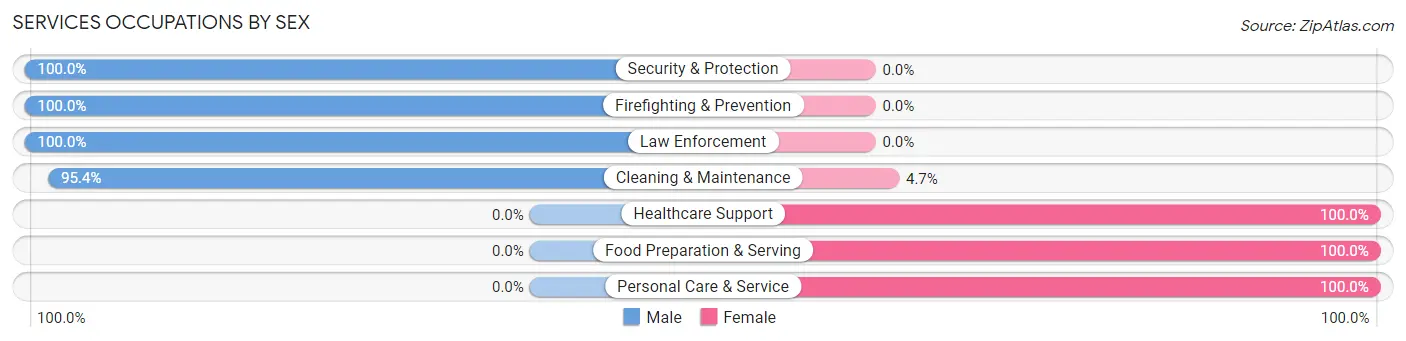
Services Occupations by Sex
Within the Services occupations in Walnut Cove, the most male-oriented occupations are Security & Protection (100.0%), Firefighting & Prevention (100.0%), and Law Enforcement (100.0%), while the most female-oriented occupations are Healthcare Support (100.0%), Food Preparation & Serving (100.0%), and Personal Care & Service (100.0%).
| Occupation | Male | Female |
| Healthcare Support | 0 (0.0%) | 95 (100.0%) |
| Security & Protection | 46 (100.0%) | 0 (0.0%) |
| Firefighting & Prevention | 22 (100.0%) | 0 (0.0%) |
| Law Enforcement | 24 (100.0%) | 0 (0.0%) |
| Food Preparation & Serving | 0 (0.0%) | 68 (100.0%) |
| Cleaning & Maintenance | 41 (95.4%) | 2 (4.6%) |
| Personal Care & Service | 0 (0.0%) | 15 (100.0%) |
| Total (Category) | 87 (32.6%) | 180 (67.4%) |
| Total (Overall) | 496 (54.5%) | 414 (45.5%) |
Sales and Office Occupations
The most common Sales and Office occupations in Walnut Cove are Office & Administration (77 | 8.5%), and Sales & Related (72 | 7.9%).
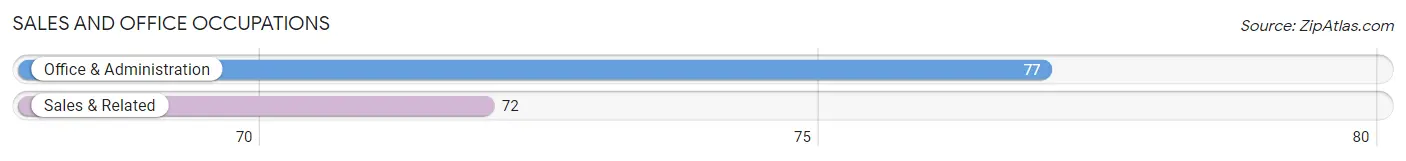
Sales and Office Occupations by Sex

| Occupation | Male | Female |
| Sales & Related | 38 (52.8%) | 34 (47.2%) |
| Office & Administration | 13 (16.9%) | 64 (83.1%) |
| Total (Category) | 51 (34.2%) | 98 (65.8%) |
| Total (Overall) | 496 (54.5%) | 414 (45.5%) |
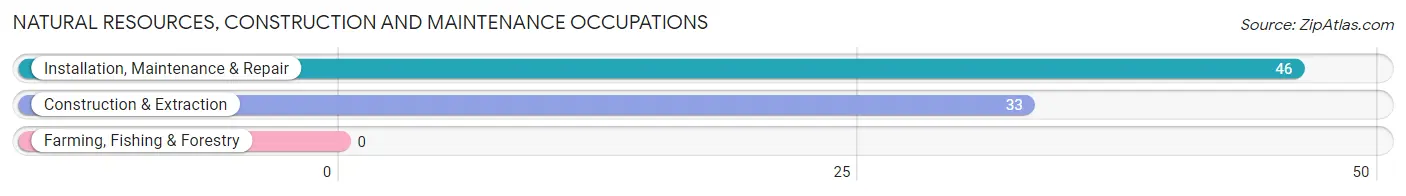
Natural Resources, Construction and Maintenance Occupations
The most common Natural Resources, Construction and Maintenance occupations in Walnut Cove are Installation, Maintenance & Repair (46 | 5.1%), and Construction & Extraction (33 | 3.6%).
Natural Resources, Construction and Maintenance Occupations by Sex
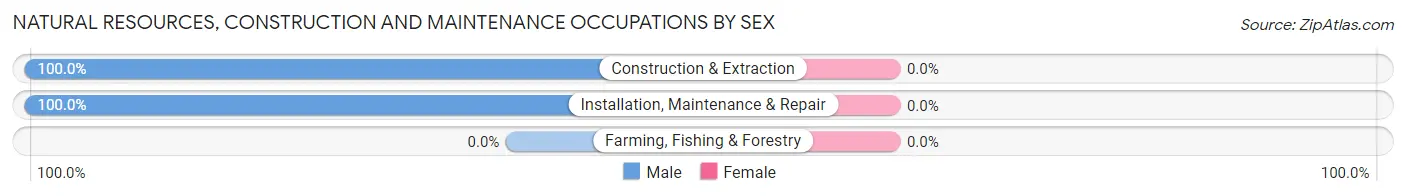
| Occupation | Male | Female |
| Farming, Fishing & Forestry | 0 (0.0%) | 0 (0.0%) |
| Construction & Extraction | 33 (100.0%) | 0 (0.0%) |
| Installation, Maintenance & Repair | 46 (100.0%) | 0 (0.0%) |
| Total (Category) | 79 (100.0%) | 0 (0.0%) |
| Total (Overall) | 496 (54.5%) | 414 (45.5%) |
Production, Transportation and Moving Occupations
The most common Production, Transportation and Moving occupations in Walnut Cove are Material Moving (156 | 17.1%), Transportation (38 | 4.2%), and Production (31 | 3.4%).
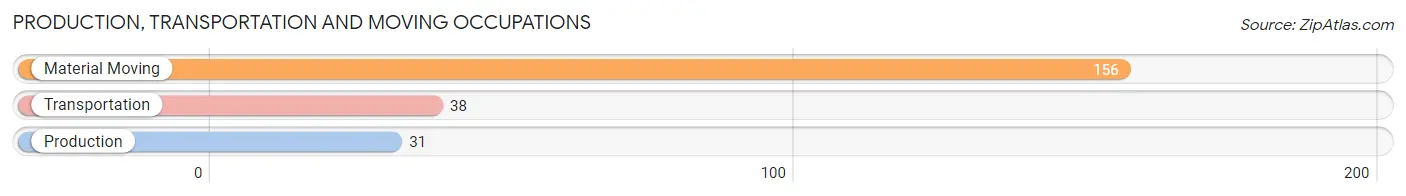
Production, Transportation and Moving Occupations by Sex
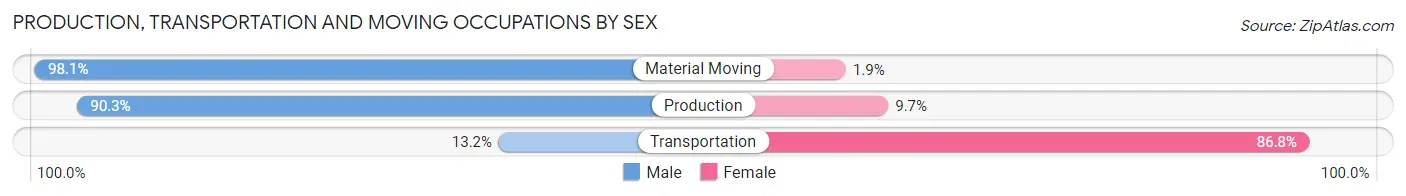
| Occupation | Male | Female |
| Production | 28 (90.3%) | 3 (9.7%) |
| Transportation | 5 (13.2%) | 33 (86.8%) |
| Material Moving | 153 (98.1%) | 3 (1.9%) |
| Total (Category) | 186 (82.7%) | 39 (17.3%) |
| Total (Overall) | 496 (54.5%) | 414 (45.5%) |
Employment Industries by Sex in Walnut Cove
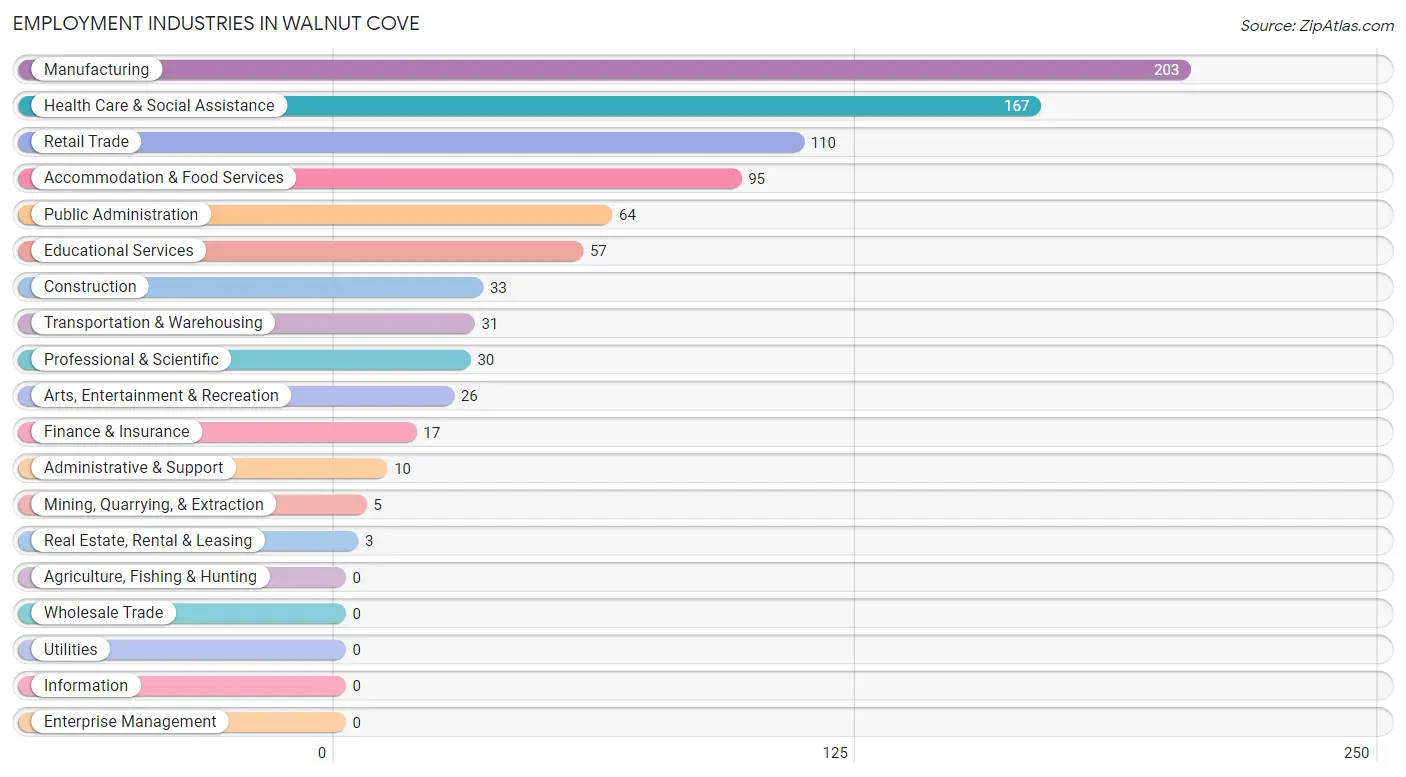
Employment Industries in Walnut Cove
The major employment industries in Walnut Cove include Manufacturing (203 | 22.3%), Health Care & Social Assistance (167 | 18.3%), Retail Trade (110 | 12.1%), Accommodation & Food Services (95 | 10.4%), and Public Administration (64 | 7.0%).
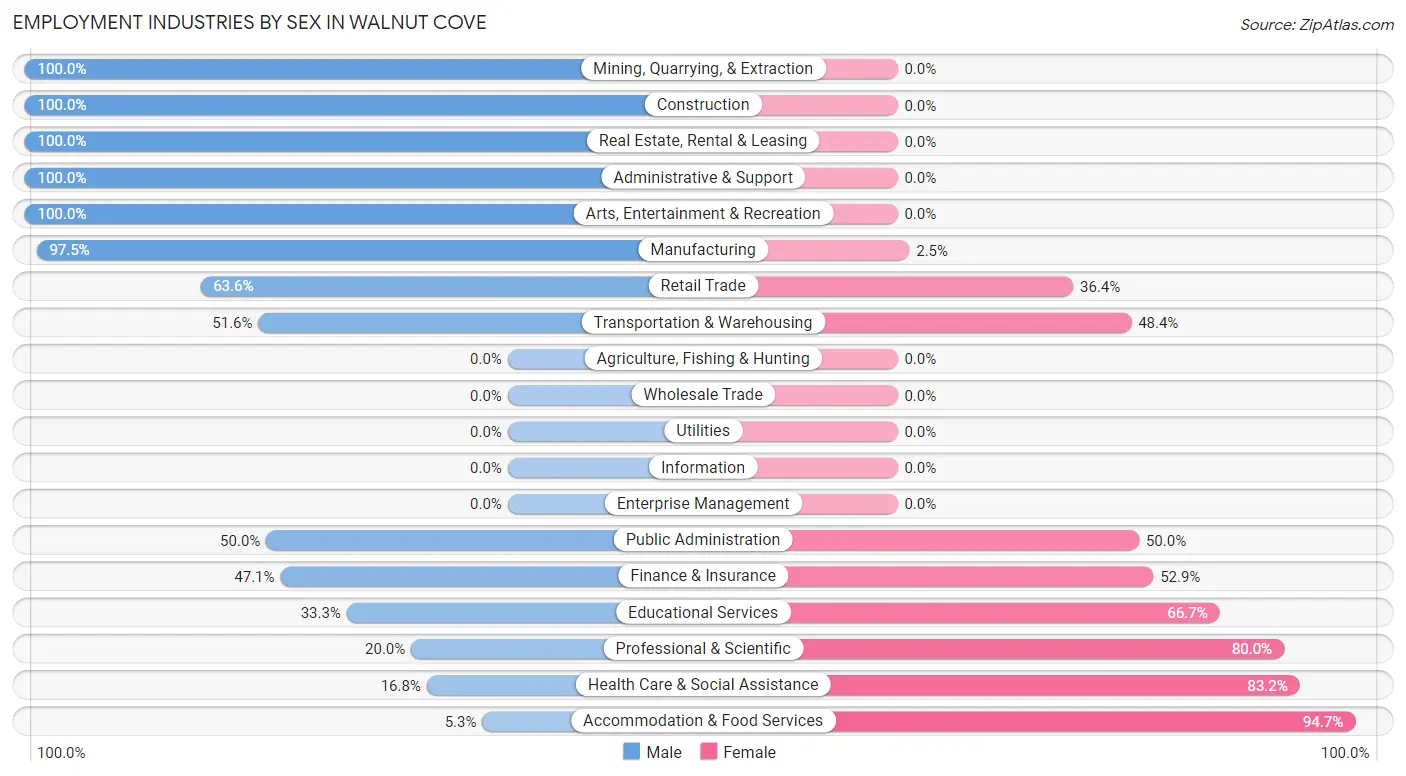
Employment Industries by Sex in Walnut Cove
The Walnut Cove industries that see more men than women are Mining, Quarrying, & Extraction (100.0%), Construction (100.0%), and Real Estate, Rental & Leasing (100.0%), whereas the industries that tend to have a higher number of women are Accommodation & Food Services (94.7%), Health Care & Social Assistance (83.2%), and Professional & Scientific (80.0%).
| Industry | Male | Female |
| Agriculture, Fishing & Hunting | 0 (0.0%) | 0 (0.0%) |
| Mining, Quarrying, & Extraction | 5 (100.0%) | 0 (0.0%) |
| Construction | 33 (100.0%) | 0 (0.0%) |
| Manufacturing | 198 (97.5%) | 5 (2.5%) |
| Wholesale Trade | 0 (0.0%) | 0 (0.0%) |
| Retail Trade | 70 (63.6%) | 40 (36.4%) |
| Transportation & Warehousing | 16 (51.6%) | 15 (48.4%) |
| Utilities | 0 (0.0%) | 0 (0.0%) |
| Information | 0 (0.0%) | 0 (0.0%) |
| Finance & Insurance | 8 (47.1%) | 9 (52.9%) |
| Real Estate, Rental & Leasing | 3 (100.0%) | 0 (0.0%) |
| Professional & Scientific | 6 (20.0%) | 24 (80.0%) |
| Enterprise Management | 0 (0.0%) | 0 (0.0%) |
| Administrative & Support | 10 (100.0%) | 0 (0.0%) |
| Educational Services | 19 (33.3%) | 38 (66.7%) |
| Health Care & Social Assistance | 28 (16.8%) | 139 (83.2%) |
| Arts, Entertainment & Recreation | 26 (100.0%) | 0 (0.0%) |
| Accommodation & Food Services | 5 (5.3%) | 90 (94.7%) |
| Public Administration | 32 (50.0%) | 32 (50.0%) |
| Total | 496 (54.5%) | 414 (45.5%) |
Education in Walnut Cove
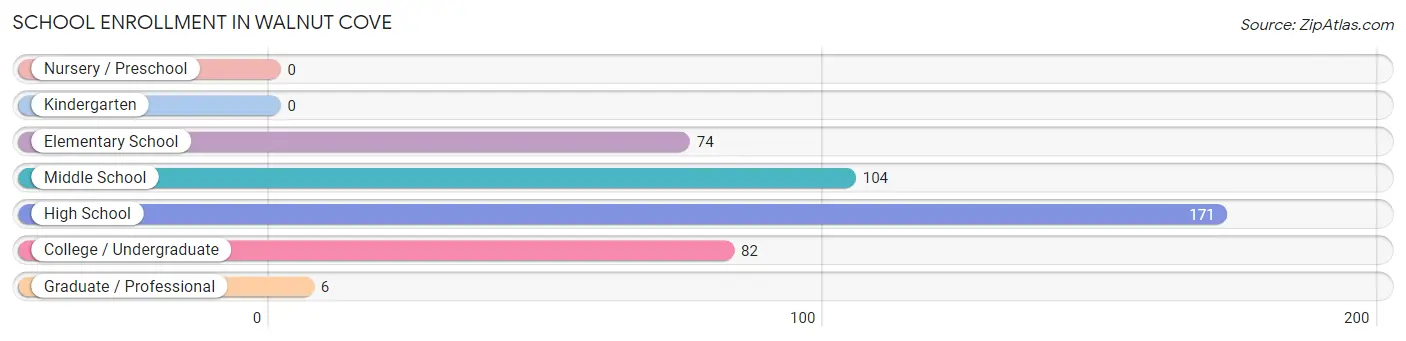
School Enrollment in Walnut Cove
The most common levels of schooling among the 437 students in Walnut Cove are high school (171 | 39.1%), middle school (104 | 23.8%), and college / undergraduate (82 | 18.8%).
| School Level | # Students | % Students |
| Nursery / Preschool | 0 | 0.0% |
| Kindergarten | 0 | 0.0% |
| Elementary School | 74 | 16.9% |
| Middle School | 104 | 23.8% |
| High School | 171 | 39.1% |
| College / Undergraduate | 82 | 18.8% |
| Graduate / Professional | 6 | 1.4% |
| Total | 437 | 100.0% |
School Enrollment by Age by Funding Source in Walnut Cove
Out of a total of 437 students who are enrolled in schools in Walnut Cove, 27 (6.2%) attend a private institution, while the remaining 410 (93.8%) are enrolled in public schools. The age group of 35 years and over has the highest likelihood of being enrolled in private schools, with 18 (72.0% in the age bracket) enrolled. Conversely, the age group of 5 to 9 year old has the lowest likelihood of being enrolled in a private school, with 74 (100.0% in the age bracket) attending a public institution.
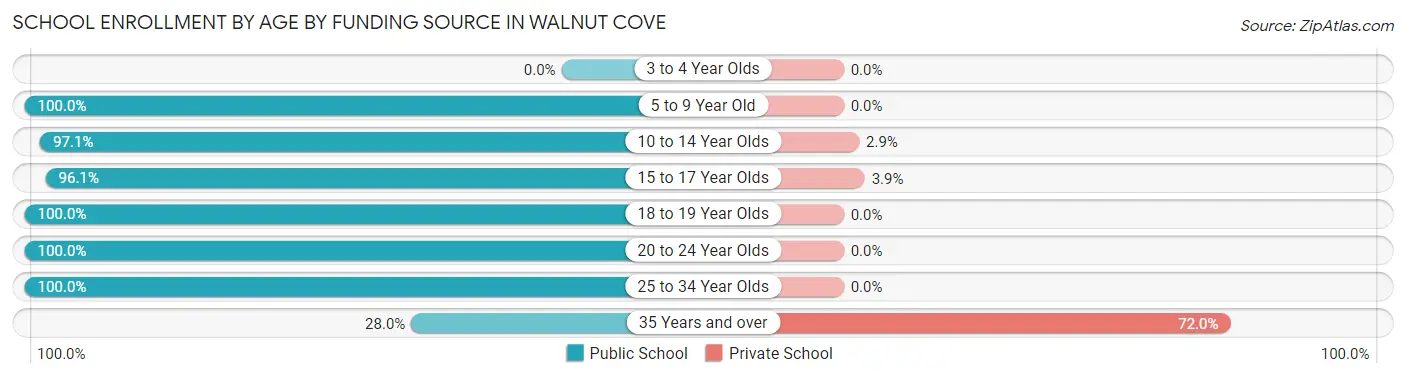
| Age Bracket | Public School | Private School |
| 3 to 4 Year Olds | 0 (0.0%) | 0 (0.0%) |
| 5 to 9 Year Old | 74 (100.0%) | 0 (0.0%) |
| 10 to 14 Year Olds | 101 (97.1%) | 3 (2.9%) |
| 15 to 17 Year Olds | 147 (96.1%) | 6 (3.9%) |
| 18 to 19 Year Olds | 20 (100.0%) | 0 (0.0%) |
| 20 to 24 Year Olds | 55 (100.0%) | 0 (0.0%) |
| 25 to 34 Year Olds | 6 (100.0%) | 0 (0.0%) |
| 35 Years and over | 7 (28.0%) | 18 (72.0%) |
| Total | 410 (93.8%) | 27 (6.2%) |
Educational Attainment by Field of Study in Walnut Cove
Business (41 | 29.9%), arts & humanities (21 | 15.3%), psychology (19 | 13.9%), social sciences (18 | 13.1%), and education (13 | 9.5%) are the most common fields of study among 137 individuals in Walnut Cove who have obtained a bachelor's degree or higher.
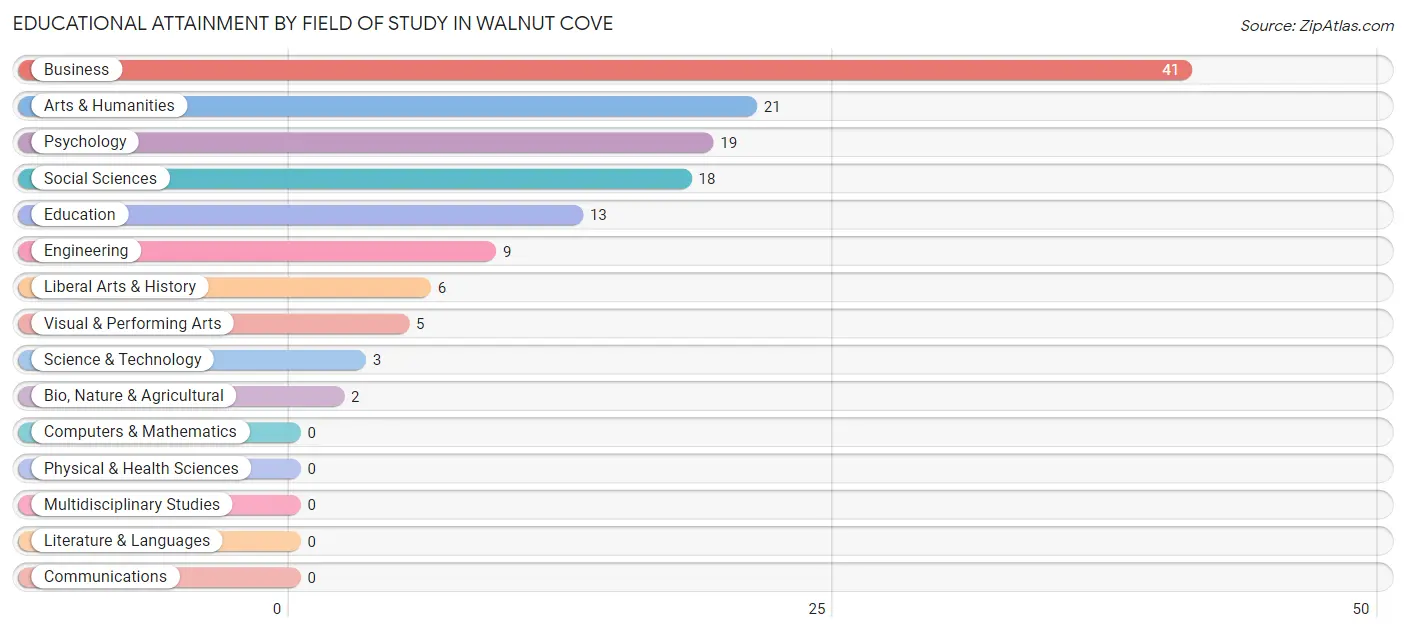
| Field of Study | # Graduates | % Graduates |
| Computers & Mathematics | 0 | 0.0% |
| Bio, Nature & Agricultural | 2 | 1.5% |
| Physical & Health Sciences | 0 | 0.0% |
| Psychology | 19 | 13.9% |
| Social Sciences | 18 | 13.1% |
| Engineering | 9 | 6.6% |
| Multidisciplinary Studies | 0 | 0.0% |
| Science & Technology | 3 | 2.2% |
| Business | 41 | 29.9% |
| Education | 13 | 9.5% |
| Literature & Languages | 0 | 0.0% |
| Liberal Arts & History | 6 | 4.4% |
| Visual & Performing Arts | 5 | 3.6% |
| Communications | 0 | 0.0% |
| Arts & Humanities | 21 | 15.3% |
| Total | 137 | 100.0% |
Transportation & Commute in Walnut Cove
Vehicle Availability by Sex in Walnut Cove
The most prevalent vehicle ownership categories in Walnut Cove are males with 1 vehicle (145, accounting for 29.0%) and females with 1 vehicle (27, making up 35.0%).
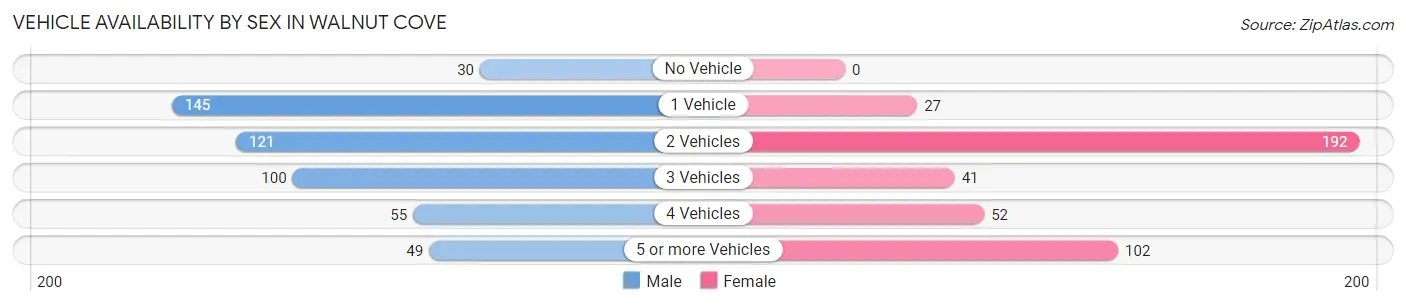
| Vehicles Available | Male | Female |
| No Vehicle | 30 (6.0%) | 0 (0.0%) |
| 1 Vehicle | 145 (29.0%) | 27 (6.5%) |
| 2 Vehicles | 121 (24.2%) | 192 (46.4%) |
| 3 Vehicles | 100 (20.0%) | 41 (9.9%) |
| 4 Vehicles | 55 (11.0%) | 52 (12.6%) |
| 5 or more Vehicles | 49 (9.8%) | 102 (24.6%) |
| Total | 500 (100.0%) | 414 (100.0%) |
Commute Time in Walnut Cove
The most frequently occuring commute durations in Walnut Cove are 5 to 9 minutes (196 commuters, 22.0%), 30 to 34 minutes (141 commuters, 15.8%), and 20 to 24 minutes (120 commuters, 13.5%).
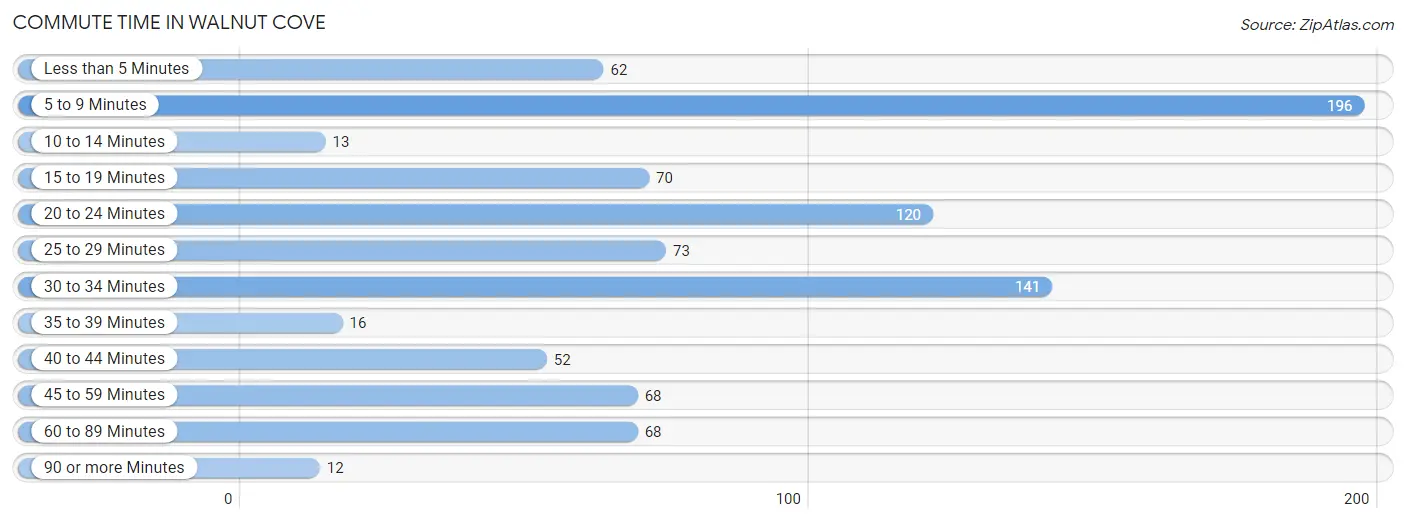
| Commute Time | # Commuters | % Commuters |
| Less than 5 Minutes | 62 | 7.0% |
| 5 to 9 Minutes | 196 | 22.0% |
| 10 to 14 Minutes | 13 | 1.5% |
| 15 to 19 Minutes | 70 | 7.9% |
| 20 to 24 Minutes | 120 | 13.5% |
| 25 to 29 Minutes | 73 | 8.2% |
| 30 to 34 Minutes | 141 | 15.8% |
| 35 to 39 Minutes | 16 | 1.8% |
| 40 to 44 Minutes | 52 | 5.8% |
| 45 to 59 Minutes | 68 | 7.6% |
| 60 to 89 Minutes | 68 | 7.6% |
| 90 or more Minutes | 12 | 1.3% |
Commute Time by Sex in Walnut Cove
The most common commute times in Walnut Cove are 5 to 9 minutes (128 commuters, 26.3%) for males and 20 to 24 minutes (88 commuters, 21.7%) for females.
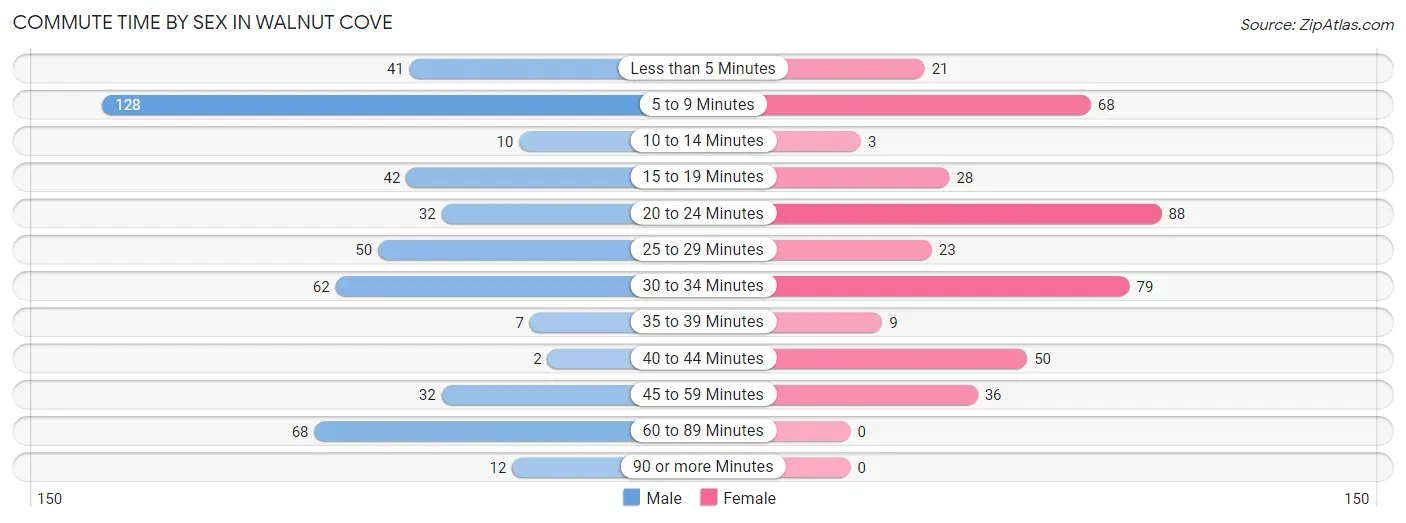
| Commute Time | Male | Female |
| Less than 5 Minutes | 41 (8.4%) | 21 (5.2%) |
| 5 to 9 Minutes | 128 (26.3%) | 68 (16.8%) |
| 10 to 14 Minutes | 10 (2.1%) | 3 (0.7%) |
| 15 to 19 Minutes | 42 (8.6%) | 28 (6.9%) |
| 20 to 24 Minutes | 32 (6.6%) | 88 (21.7%) |
| 25 to 29 Minutes | 50 (10.3%) | 23 (5.7%) |
| 30 to 34 Minutes | 62 (12.8%) | 79 (19.5%) |
| 35 to 39 Minutes | 7 (1.4%) | 9 (2.2%) |
| 40 to 44 Minutes | 2 (0.4%) | 50 (12.3%) |
| 45 to 59 Minutes | 32 (6.6%) | 36 (8.9%) |
| 60 to 89 Minutes | 68 (14.0%) | 0 (0.0%) |
| 90 or more Minutes | 12 (2.5%) | 0 (0.0%) |
Time of Departure to Work by Sex in Walnut Cove
The most frequent times of departure to work in Walnut Cove are 4:00 PM to 11:59 PM (144, 29.6%) for males and 12:00 PM to 3:59 PM (142, 35.1%) for females.
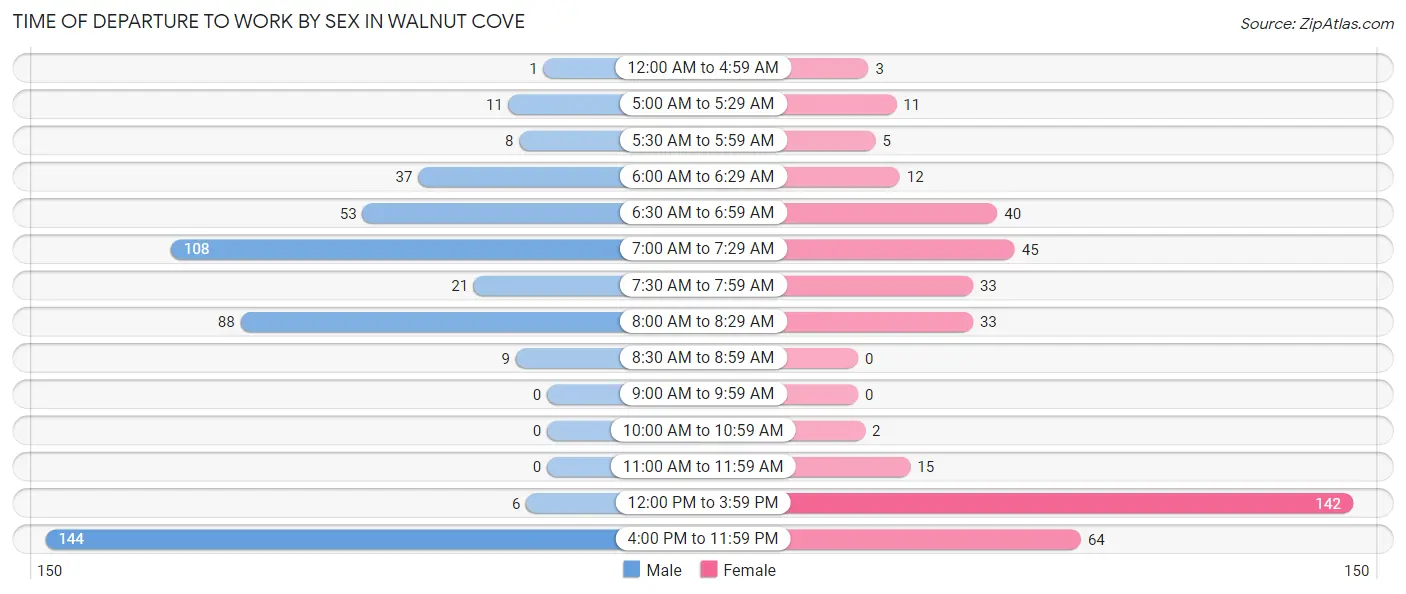
| Time of Departure | Male | Female |
| 12:00 AM to 4:59 AM | 1 (0.2%) | 3 (0.7%) |
| 5:00 AM to 5:29 AM | 11 (2.3%) | 11 (2.7%) |
| 5:30 AM to 5:59 AM | 8 (1.7%) | 5 (1.2%) |
| 6:00 AM to 6:29 AM | 37 (7.6%) | 12 (3.0%) |
| 6:30 AM to 6:59 AM | 53 (10.9%) | 40 (9.9%) |
| 7:00 AM to 7:29 AM | 108 (22.2%) | 45 (11.1%) |
| 7:30 AM to 7:59 AM | 21 (4.3%) | 33 (8.2%) |
| 8:00 AM to 8:29 AM | 88 (18.1%) | 33 (8.2%) |
| 8:30 AM to 8:59 AM | 9 (1.8%) | 0 (0.0%) |
| 9:00 AM to 9:59 AM | 0 (0.0%) | 0 (0.0%) |
| 10:00 AM to 10:59 AM | 0 (0.0%) | 2 (0.5%) |
| 11:00 AM to 11:59 AM | 0 (0.0%) | 15 (3.7%) |
| 12:00 PM to 3:59 PM | 6 (1.2%) | 142 (35.1%) |
| 4:00 PM to 11:59 PM | 144 (29.6%) | 64 (15.8%) |
| Total | 486 (100.0%) | 405 (100.0%) |
Housing Occupancy in Walnut Cove
Occupancy by Ownership in Walnut Cove
Of the total 686 dwellings in Walnut Cove, owner-occupied units account for 351 (51.2%), while renter-occupied units make up 335 (48.8%).
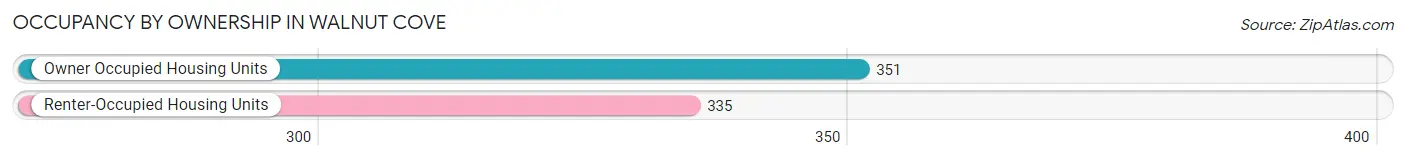
| Occupancy | # Housing Units | % Housing Units |
| Owner Occupied Housing Units | 351 | 51.2% |
| Renter-Occupied Housing Units | 335 | 48.8% |
| Total Occupied Housing Units | 686 | 100.0% |
Occupancy by Household Size in Walnut Cove
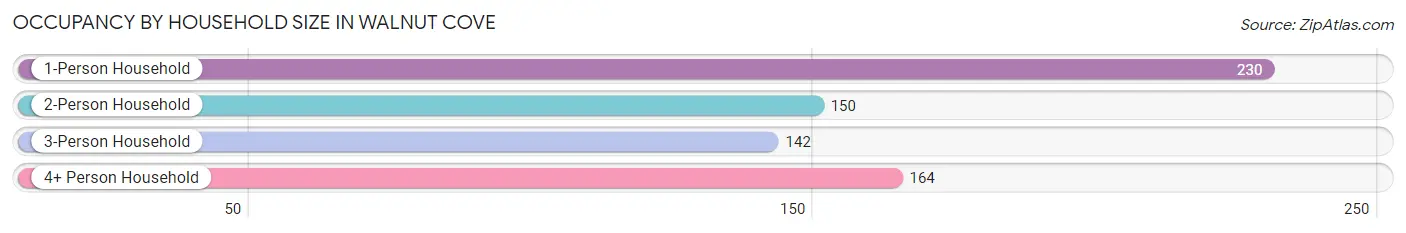
| Household Size | # Housing Units | % Housing Units |
| 1-Person Household | 230 | 33.5% |
| 2-Person Household | 150 | 21.9% |
| 3-Person Household | 142 | 20.7% |
| 4+ Person Household | 164 | 23.9% |
| Total Housing Units | 686 | 100.0% |
Occupancy by Ownership by Household Size in Walnut Cove
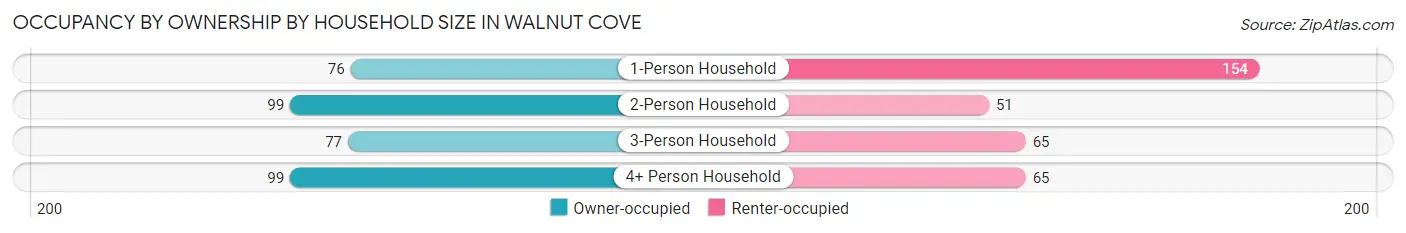
| Household Size | Owner-occupied | Renter-occupied |
| 1-Person Household | 76 (33.0%) | 154 (67.0%) |
| 2-Person Household | 99 (66.0%) | 51 (34.0%) |
| 3-Person Household | 77 (54.2%) | 65 (45.8%) |
| 4+ Person Household | 99 (60.4%) | 65 (39.6%) |
| Total Housing Units | 351 (51.2%) | 335 (48.8%) |
Occupancy by Educational Attainment in Walnut Cove
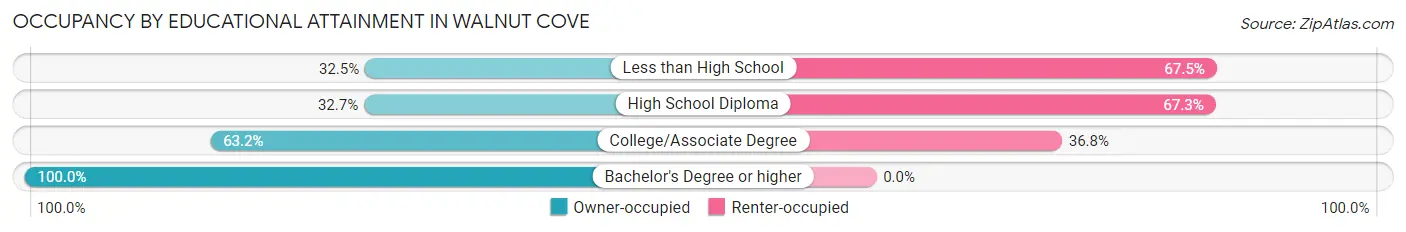
| Household Size | Owner-occupied | Renter-occupied |
| Less than High School | 13 (32.5%) | 27 (67.5%) |
| High School Diploma | 105 (32.7%) | 216 (67.3%) |
| College/Associate Degree | 158 (63.2%) | 92 (36.8%) |
| Bachelor's Degree or higher | 75 (100.0%) | 0 (0.0%) |
Occupancy by Age of Householder in Walnut Cove
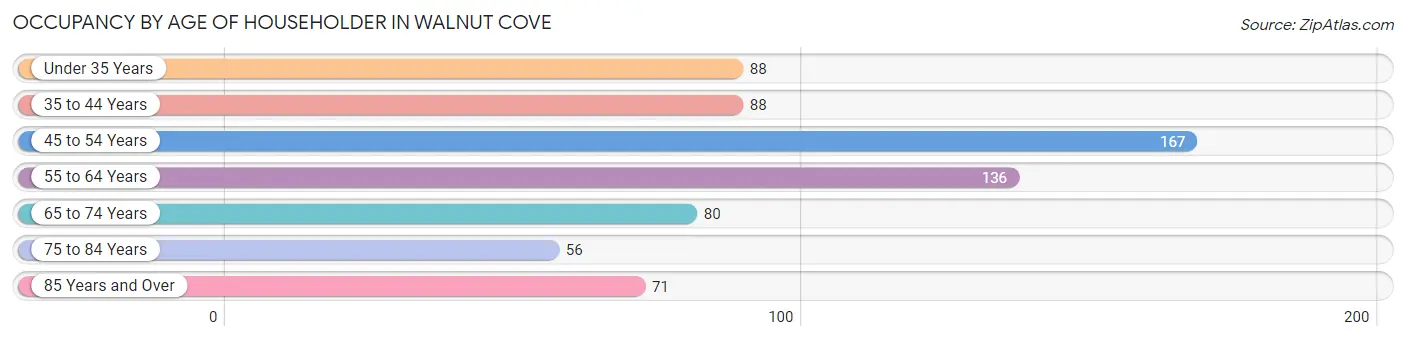
| Age Bracket | # Households | % Households |
| Under 35 Years | 88 | 12.8% |
| 35 to 44 Years | 88 | 12.8% |
| 45 to 54 Years | 167 | 24.3% |
| 55 to 64 Years | 136 | 19.8% |
| 65 to 74 Years | 80 | 11.7% |
| 75 to 84 Years | 56 | 8.2% |
| 85 Years and Over | 71 | 10.3% |
| Total | 686 | 100.0% |
Housing Finances in Walnut Cove
Median Income by Occupancy in Walnut Cove
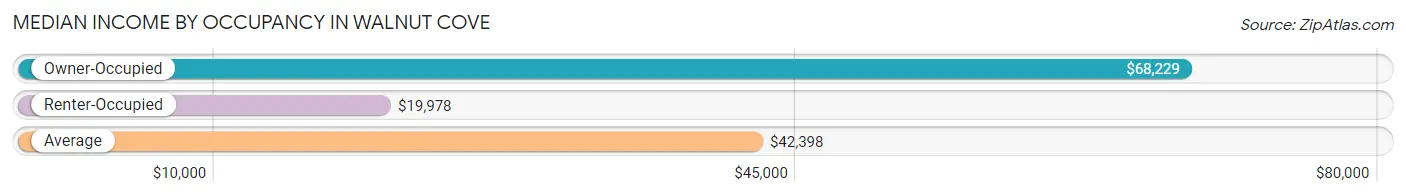
| Occupancy Type | # Households | Median Income |
| Owner-Occupied | 351 (51.2%) | $68,229 |
| Renter-Occupied | 335 (48.8%) | $19,978 |
| Average | 686 (100.0%) | $42,398 |
Occupancy by Householder Income Bracket in Walnut Cove
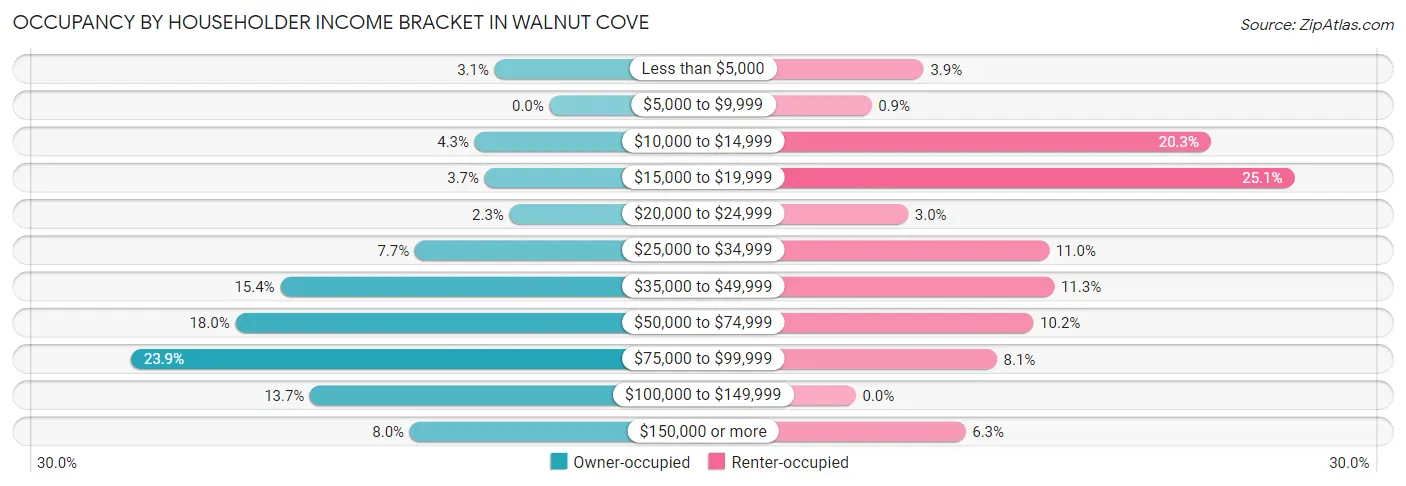
| Income Bracket | Owner-occupied | Renter-occupied |
| Less than $5,000 | 11 (3.1%) | 13 (3.9%) |
| $5,000 to $9,999 | 0 (0.0%) | 3 (0.9%) |
| $10,000 to $14,999 | 15 (4.3%) | 68 (20.3%) |
| $15,000 to $19,999 | 13 (3.7%) | 84 (25.1%) |
| $20,000 to $24,999 | 8 (2.3%) | 10 (3.0%) |
| $25,000 to $34,999 | 27 (7.7%) | 37 (11.0%) |
| $35,000 to $49,999 | 54 (15.4%) | 38 (11.3%) |
| $50,000 to $74,999 | 63 (17.9%) | 34 (10.2%) |
| $75,000 to $99,999 | 84 (23.9%) | 27 (8.1%) |
| $100,000 to $149,999 | 48 (13.7%) | 0 (0.0%) |
| $150,000 or more | 28 (8.0%) | 21 (6.3%) |
| Total | 351 (100.0%) | 335 (100.0%) |
Monthly Housing Cost Tiers in Walnut Cove
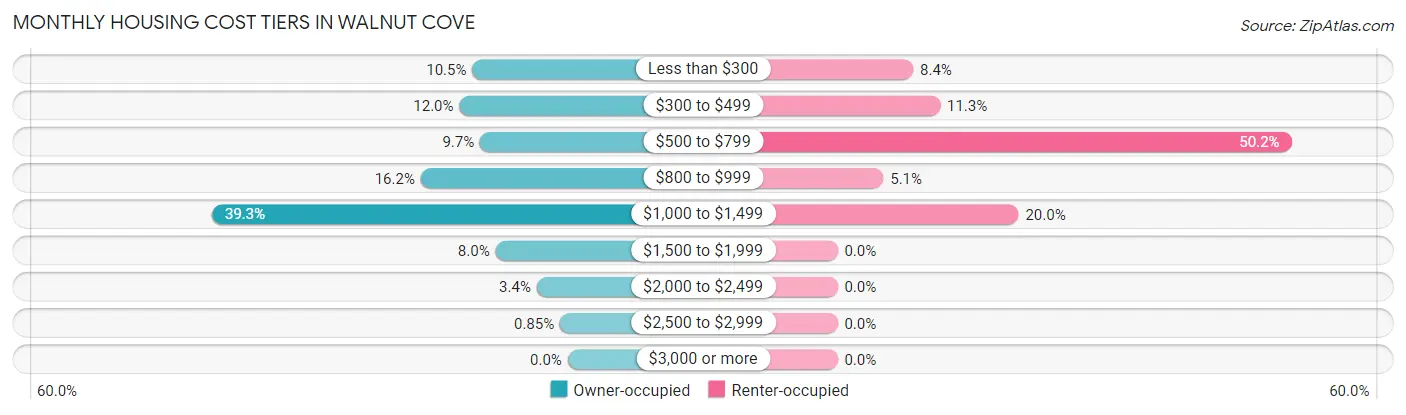
| Monthly Cost | Owner-occupied | Renter-occupied |
| Less than $300 | 37 (10.5%) | 28 (8.4%) |
| $300 to $499 | 42 (12.0%) | 38 (11.3%) |
| $500 to $799 | 34 (9.7%) | 168 (50.1%) |
| $800 to $999 | 57 (16.2%) | 17 (5.1%) |
| $1,000 to $1,499 | 138 (39.3%) | 67 (20.0%) |
| $1,500 to $1,999 | 28 (8.0%) | 0 (0.0%) |
| $2,000 to $2,499 | 12 (3.4%) | 0 (0.0%) |
| $2,500 to $2,999 | 3 (0.9%) | 0 (0.0%) |
| $3,000 or more | 0 (0.0%) | 0 (0.0%) |
| Total | 351 (100.0%) | 335 (100.0%) |
Physical Housing Characteristics in Walnut Cove
Housing Structures in Walnut Cove
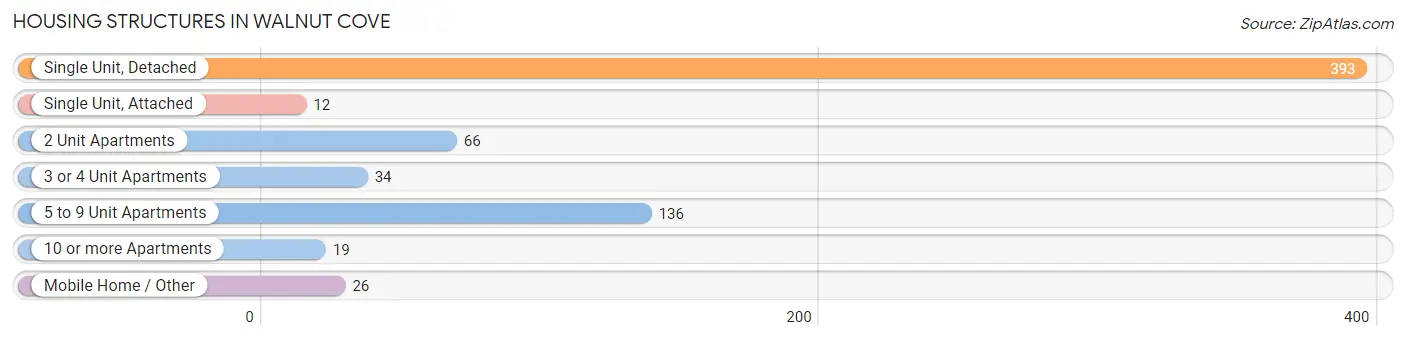
| Structure Type | # Housing Units | % Housing Units |
| Single Unit, Detached | 393 | 57.3% |
| Single Unit, Attached | 12 | 1.8% |
| 2 Unit Apartments | 66 | 9.6% |
| 3 or 4 Unit Apartments | 34 | 5.0% |
| 5 to 9 Unit Apartments | 136 | 19.8% |
| 10 or more Apartments | 19 | 2.8% |
| Mobile Home / Other | 26 | 3.8% |
| Total | 686 | 100.0% |
Housing Structures by Occupancy in Walnut Cove
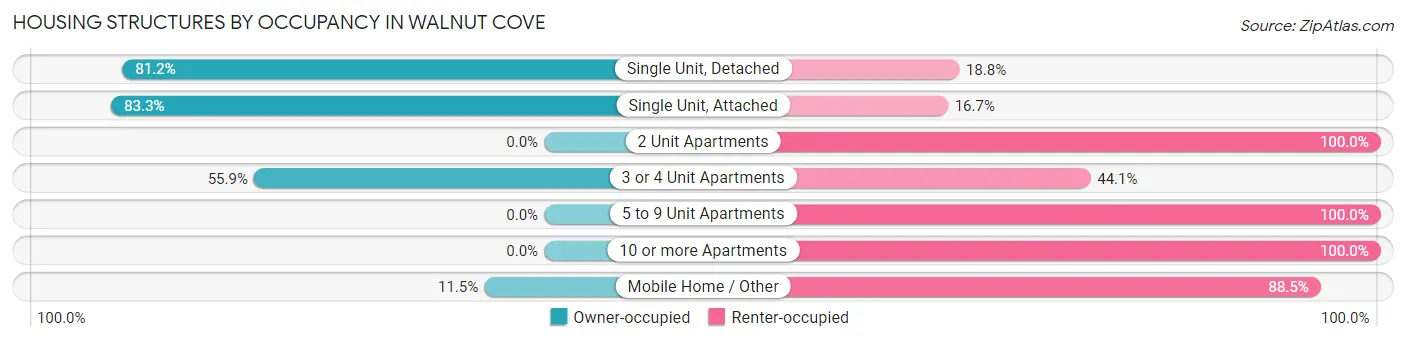
| Structure Type | Owner-occupied | Renter-occupied |
| Single Unit, Detached | 319 (81.2%) | 74 (18.8%) |
| Single Unit, Attached | 10 (83.3%) | 2 (16.7%) |
| 2 Unit Apartments | 0 (0.0%) | 66 (100.0%) |
| 3 or 4 Unit Apartments | 19 (55.9%) | 15 (44.1%) |
| 5 to 9 Unit Apartments | 0 (0.0%) | 136 (100.0%) |
| 10 or more Apartments | 0 (0.0%) | 19 (100.0%) |
| Mobile Home / Other | 3 (11.5%) | 23 (88.5%) |
| Total | 351 (51.2%) | 335 (48.8%) |
Housing Structures by Number of Rooms in Walnut Cove
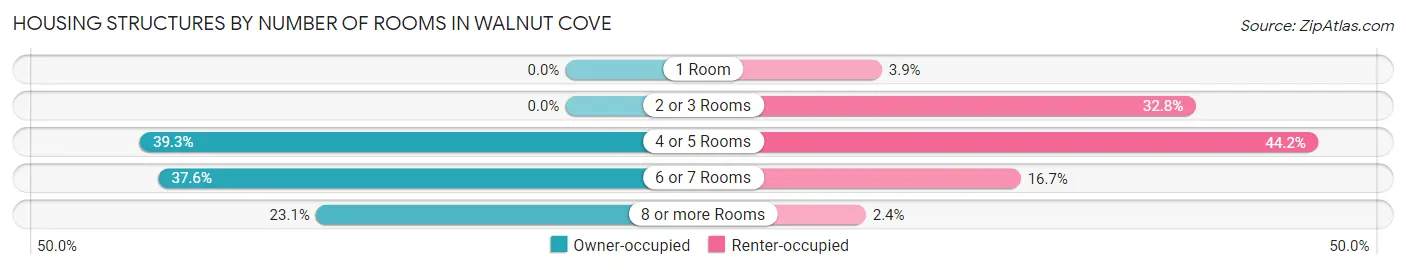
| Number of Rooms | Owner-occupied | Renter-occupied |
| 1 Room | 0 (0.0%) | 13 (3.9%) |
| 2 or 3 Rooms | 0 (0.0%) | 110 (32.8%) |
| 4 or 5 Rooms | 138 (39.3%) | 148 (44.2%) |
| 6 or 7 Rooms | 132 (37.6%) | 56 (16.7%) |
| 8 or more Rooms | 81 (23.1%) | 8 (2.4%) |
| Total | 351 (100.0%) | 335 (100.0%) |
Housing Structure by Heating Type in Walnut Cove
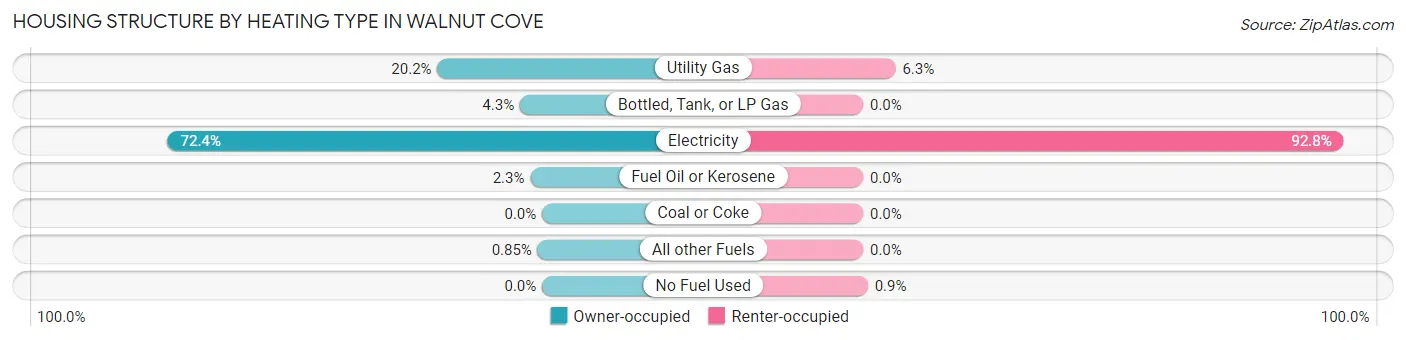
| Heating Type | Owner-occupied | Renter-occupied |
| Utility Gas | 71 (20.2%) | 21 (6.3%) |
| Bottled, Tank, or LP Gas | 15 (4.3%) | 0 (0.0%) |
| Electricity | 254 (72.4%) | 311 (92.8%) |
| Fuel Oil or Kerosene | 8 (2.3%) | 0 (0.0%) |
| Coal or Coke | 0 (0.0%) | 0 (0.0%) |
| All other Fuels | 3 (0.9%) | 0 (0.0%) |
| No Fuel Used | 0 (0.0%) | 3 (0.9%) |
| Total | 351 (100.0%) | 335 (100.0%) |
Household Vehicle Usage in Walnut Cove
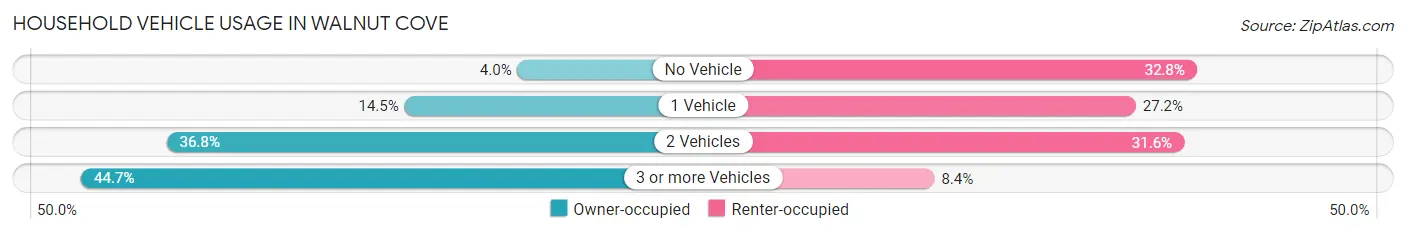
| Vehicles per Household | Owner-occupied | Renter-occupied |
| No Vehicle | 14 (4.0%) | 110 (32.8%) |
| 1 Vehicle | 51 (14.5%) | 91 (27.2%) |
| 2 Vehicles | 129 (36.7%) | 106 (31.6%) |
| 3 or more Vehicles | 157 (44.7%) | 28 (8.4%) |
| Total | 351 (100.0%) | 335 (100.0%) |
Real Estate & Mortgages in Walnut Cove
Real Estate and Mortgage Overview in Walnut Cove
| Characteristic | Without Mortgage | With Mortgage |
| Housing Units | 98 | 253 |
| Median Property Value | $140,300 | $161,800 |
| Median Household Income | $60,294 | $19 |
| Monthly Housing Costs | $409 | $0 |
| Real Estate Taxes | $1,143 | $0 |
Property Value by Mortgage Status in Walnut Cove
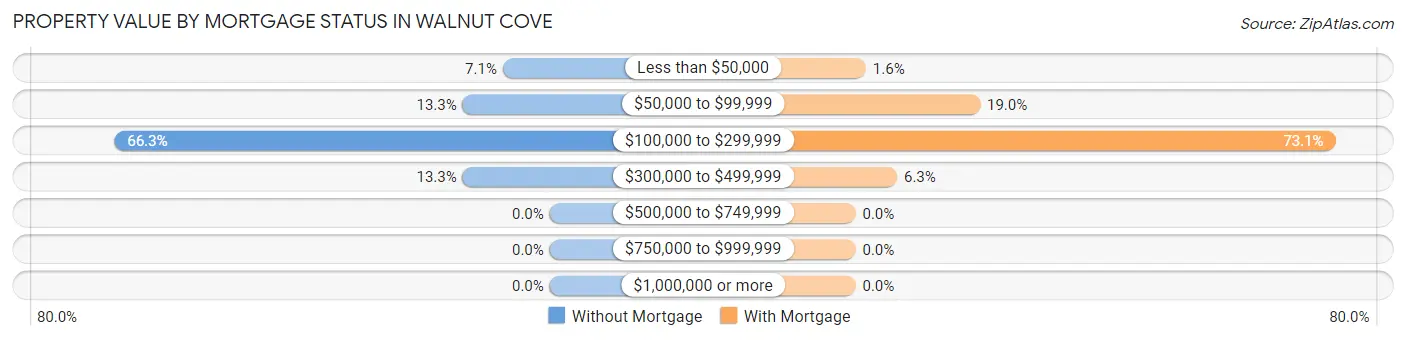
| Property Value | Without Mortgage | With Mortgage |
| Less than $50,000 | 7 (7.1%) | 4 (1.6%) |
| $50,000 to $99,999 | 13 (13.3%) | 48 (19.0%) |
| $100,000 to $299,999 | 65 (66.3%) | 185 (73.1%) |
| $300,000 to $499,999 | 13 (13.3%) | 16 (6.3%) |
| $500,000 to $749,999 | 0 (0.0%) | 0 (0.0%) |
| $750,000 to $999,999 | 0 (0.0%) | 0 (0.0%) |
| $1,000,000 or more | 0 (0.0%) | 0 (0.0%) |
| Total | 98 (100.0%) | 253 (100.0%) |
Household Income by Mortgage Status in Walnut Cove
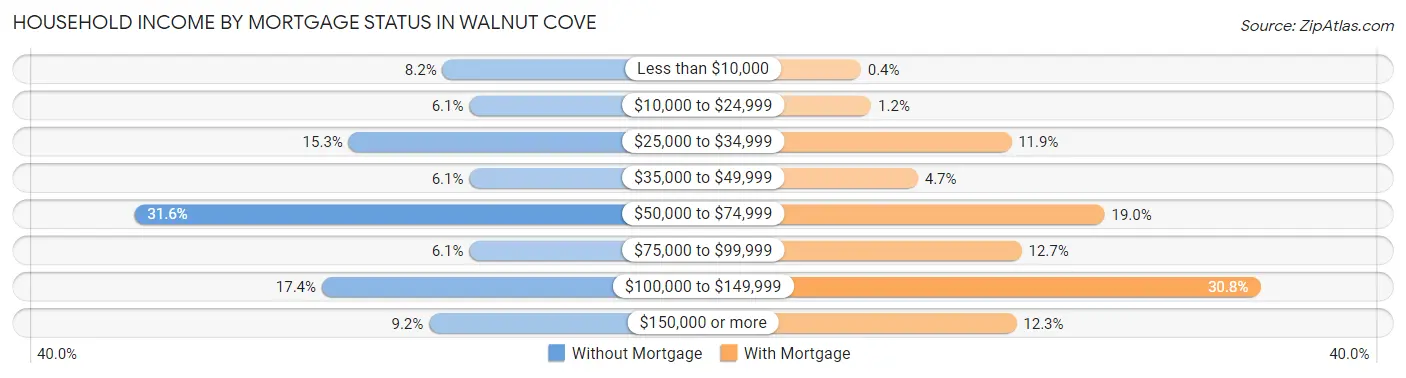
| Household Income | Without Mortgage | With Mortgage |
| Less than $10,000 | 8 (8.2%) | 1 (0.4%) |
| $10,000 to $24,999 | 6 (6.1%) | 3 (1.2%) |
| $25,000 to $34,999 | 15 (15.3%) | 30 (11.9%) |
| $35,000 to $49,999 | 6 (6.1%) | 12 (4.7%) |
| $50,000 to $74,999 | 31 (31.6%) | 48 (19.0%) |
| $75,000 to $99,999 | 6 (6.1%) | 32 (12.7%) |
| $100,000 to $149,999 | 17 (17.3%) | 78 (30.8%) |
| $150,000 or more | 9 (9.2%) | 31 (12.2%) |
| Total | 98 (100.0%) | 253 (100.0%) |
Property Value to Household Income Ratio in Walnut Cove
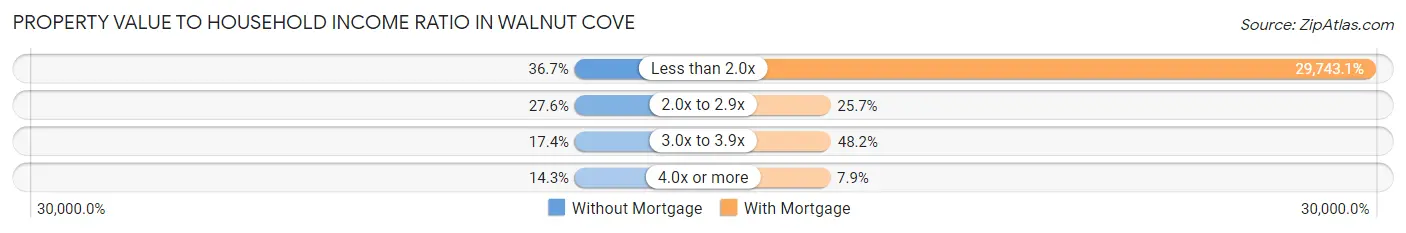
| Value-to-Income Ratio | Without Mortgage | With Mortgage |
| Less than 2.0x | 36 (36.7%) | 75,250 (29,743.1%) |
| 2.0x to 2.9x | 27 (27.6%) | 65 (25.7%) |
| 3.0x to 3.9x | 17 (17.3%) | 122 (48.2%) |
| 4.0x or more | 14 (14.3%) | 20 (7.9%) |
| Total | 98 (100.0%) | 253 (100.0%) |
Real Estate Taxes by Mortgage Status in Walnut Cove
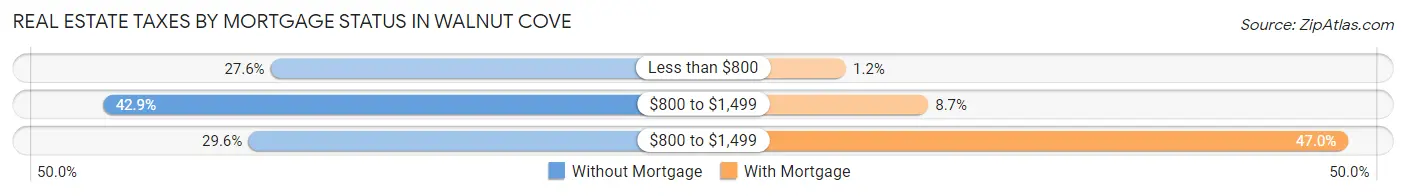
| Property Taxes | Without Mortgage | With Mortgage |
| Less than $800 | 27 (27.6%) | 3 (1.2%) |
| $800 to $1,499 | 42 (42.9%) | 22 (8.7%) |
| $800 to $1,499 | 29 (29.6%) | 119 (47.0%) |
| Total | 98 (100.0%) | 253 (100.0%) |
Health & Disability in Walnut Cove
Health Insurance Coverage by Age in Walnut Cove
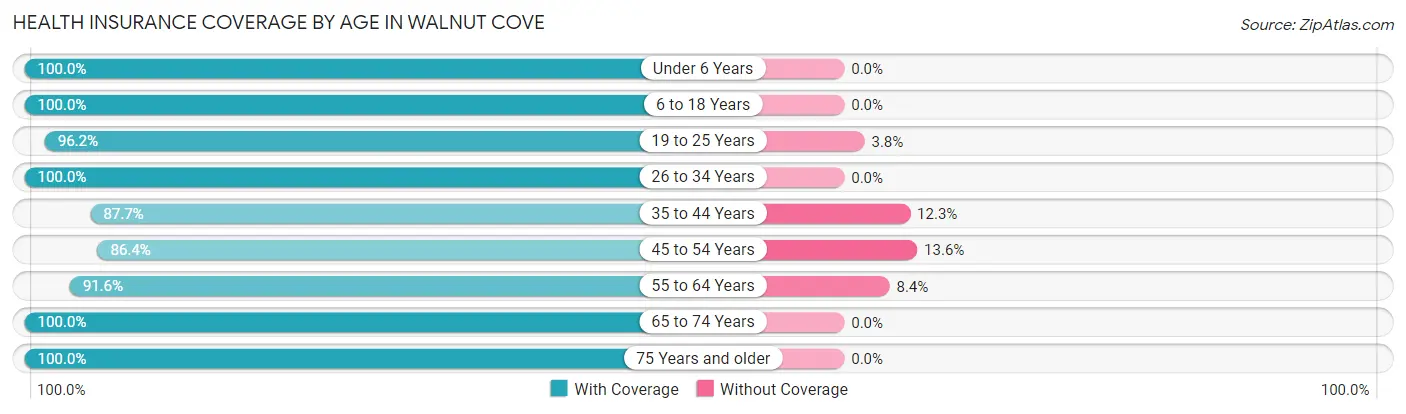
| Age Bracket | With Coverage | Without Coverage |
| Under 6 Years | 136 (100.0%) | 0 (0.0%) |
| 6 to 18 Years | 364 (100.0%) | 0 (0.0%) |
| 19 to 25 Years | 331 (96.2%) | 13 (3.8%) |
| 26 to 34 Years | 87 (100.0%) | 0 (0.0%) |
| 35 to 44 Years | 150 (87.7%) | 21 (12.3%) |
| 45 to 54 Years | 248 (86.4%) | 39 (13.6%) |
| 55 to 64 Years | 217 (91.6%) | 20 (8.4%) |
| 65 to 74 Years | 155 (100.0%) | 0 (0.0%) |
| 75 Years and older | 148 (100.0%) | 0 (0.0%) |
| Total | 1,836 (95.2%) | 93 (4.8%) |
Health Insurance Coverage by Citizenship Status in Walnut Cove
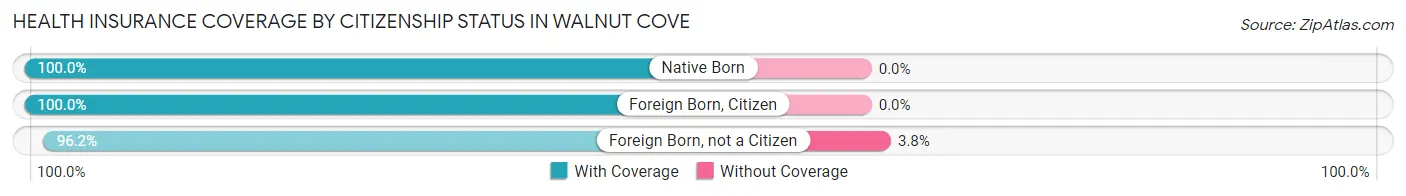
| Citizenship Status | With Coverage | Without Coverage |
| Native Born | 136 (100.0%) | 0 (0.0%) |
| Foreign Born, Citizen | 364 (100.0%) | 0 (0.0%) |
| Foreign Born, not a Citizen | 331 (96.2%) | 13 (3.8%) |
Health Insurance Coverage by Household Income in Walnut Cove
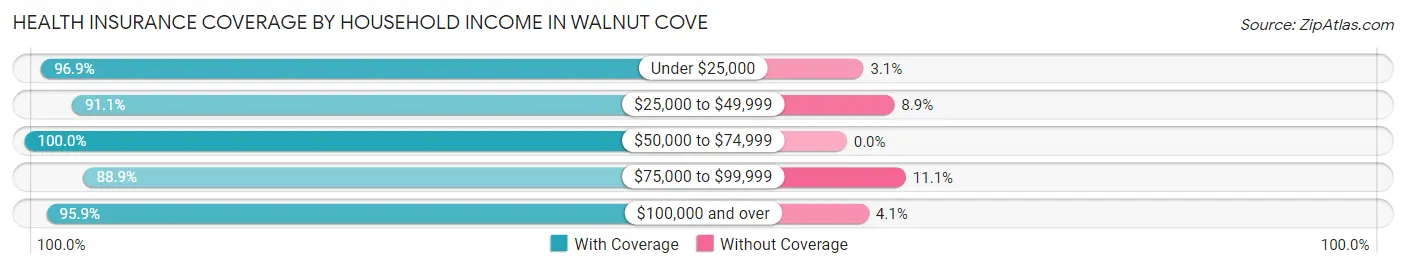
| Household Income | With Coverage | Without Coverage |
| Under $25,000 | 341 (96.9%) | 11 (3.1%) |
| $25,000 to $49,999 | 337 (91.1%) | 33 (8.9%) |
| $50,000 to $74,999 | 505 (100.0%) | 0 (0.0%) |
| $75,000 to $99,999 | 257 (88.9%) | 32 (11.1%) |
| $100,000 and over | 394 (95.9%) | 17 (4.1%) |
Public vs Private Health Insurance Coverage by Age in Walnut Cove
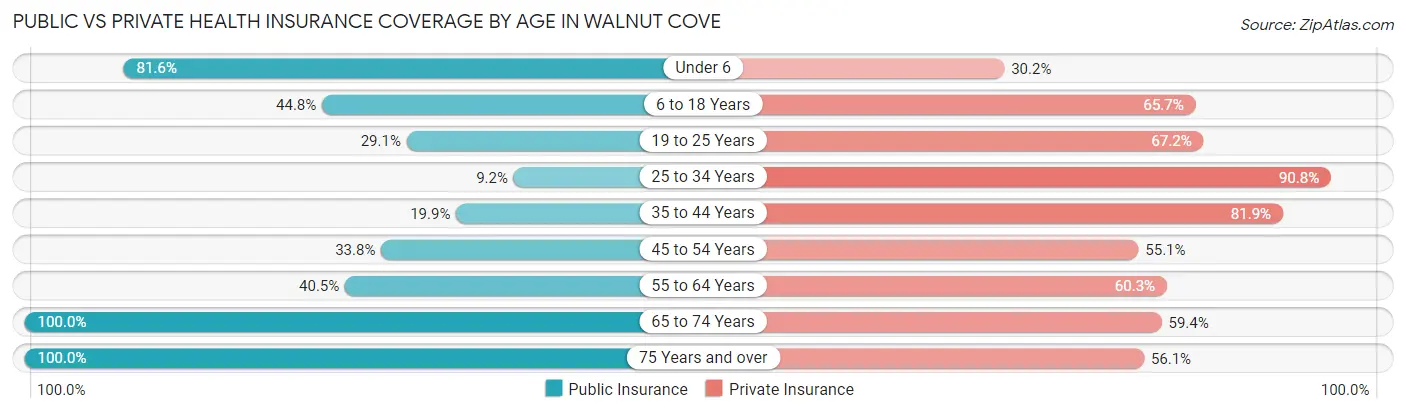
| Age Bracket | Public Insurance | Private Insurance |
| Under 6 | 111 (81.6%) | 41 (30.1%) |
| 6 to 18 Years | 163 (44.8%) | 239 (65.7%) |
| 19 to 25 Years | 100 (29.1%) | 231 (67.1%) |
| 25 to 34 Years | 8 (9.2%) | 79 (90.8%) |
| 35 to 44 Years | 34 (19.9%) | 140 (81.9%) |
| 45 to 54 Years | 97 (33.8%) | 158 (55.0%) |
| 55 to 64 Years | 96 (40.5%) | 143 (60.3%) |
| 65 to 74 Years | 155 (100.0%) | 92 (59.4%) |
| 75 Years and over | 148 (100.0%) | 83 (56.1%) |
| Total | 912 (47.3%) | 1,206 (62.5%) |
Disability Status by Sex by Age in Walnut Cove
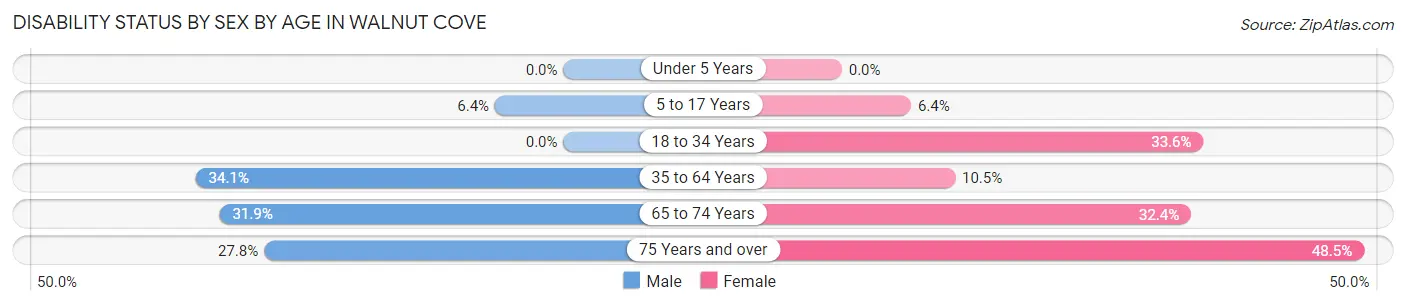
| Age Bracket | Male | Female |
| Under 5 Years | 0 (0.0%) | 0 (0.0%) |
| 5 to 17 Years | 12 (6.4%) | 12 (6.4%) |
| 18 to 34 Years | 0 (0.0%) | 51 (33.6%) |
| 35 to 64 Years | 130 (34.1%) | 33 (10.5%) |
| 65 to 74 Years | 15 (31.9%) | 35 (32.4%) |
| 75 Years and over | 5 (27.8%) | 63 (48.5%) |
Disability Class by Sex by Age in Walnut Cove
Disability Class: Hearing Difficulty
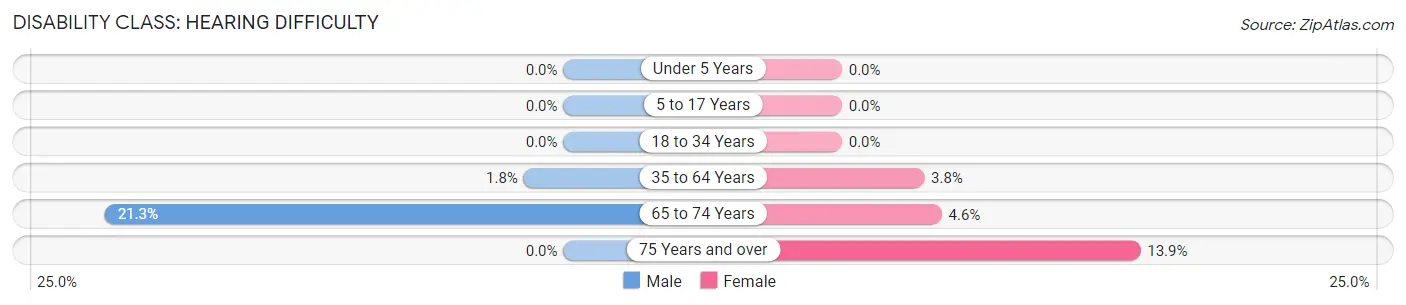
| Age Bracket | Male | Female |
| Under 5 Years | 0 (0.0%) | 0 (0.0%) |
| 5 to 17 Years | 0 (0.0%) | 0 (0.0%) |
| 18 to 34 Years | 0 (0.0%) | 0 (0.0%) |
| 35 to 64 Years | 7 (1.8%) | 12 (3.8%) |
| 65 to 74 Years | 10 (21.3%) | 5 (4.6%) |
| 75 Years and over | 0 (0.0%) | 18 (13.9%) |
Disability Class: Vision Difficulty
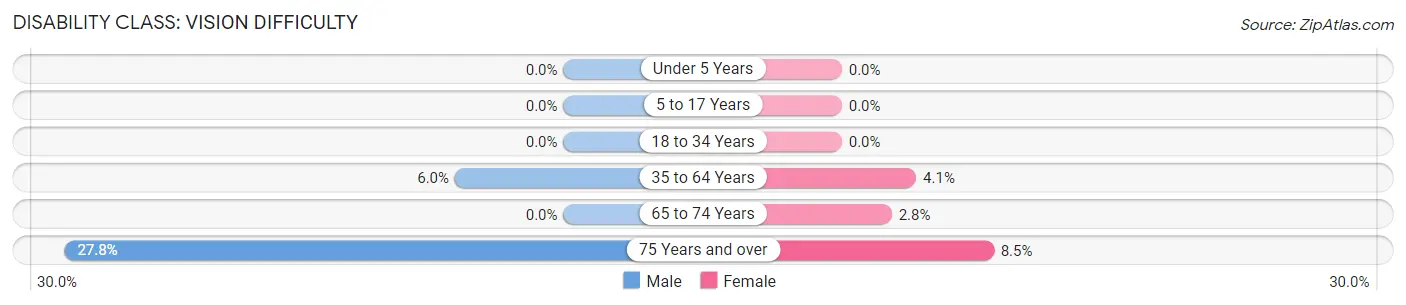
| Age Bracket | Male | Female |
| Under 5 Years | 0 (0.0%) | 0 (0.0%) |
| 5 to 17 Years | 0 (0.0%) | 0 (0.0%) |
| 18 to 34 Years | 0 (0.0%) | 0 (0.0%) |
| 35 to 64 Years | 23 (6.0%) | 13 (4.1%) |
| 65 to 74 Years | 0 (0.0%) | 3 (2.8%) |
| 75 Years and over | 5 (27.8%) | 11 (8.5%) |
Disability Class: Cognitive Difficulty
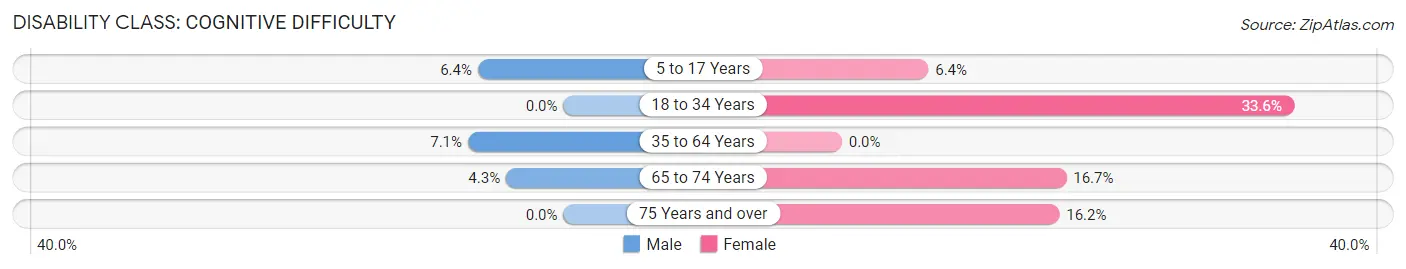
| Age Bracket | Male | Female |
| 5 to 17 Years | 12 (6.4%) | 12 (6.4%) |
| 18 to 34 Years | 0 (0.0%) | 51 (33.6%) |
| 35 to 64 Years | 27 (7.1%) | 0 (0.0%) |
| 65 to 74 Years | 2 (4.3%) | 18 (16.7%) |
| 75 Years and over | 0 (0.0%) | 21 (16.2%) |
Disability Class: Ambulatory Difficulty
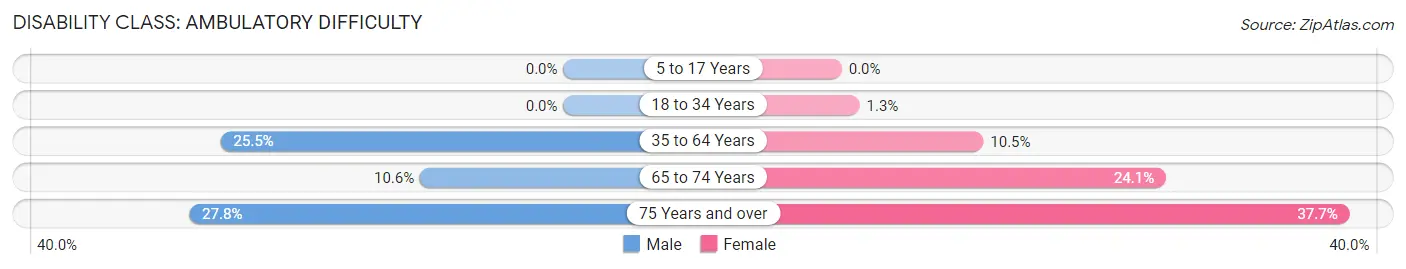
| Age Bracket | Male | Female |
| 5 to 17 Years | 0 (0.0%) | 0 (0.0%) |
| 18 to 34 Years | 0 (0.0%) | 2 (1.3%) |
| 35 to 64 Years | 97 (25.5%) | 33 (10.5%) |
| 65 to 74 Years | 5 (10.6%) | 26 (24.1%) |
| 75 Years and over | 5 (27.8%) | 49 (37.7%) |
Disability Class: Self-Care Difficulty
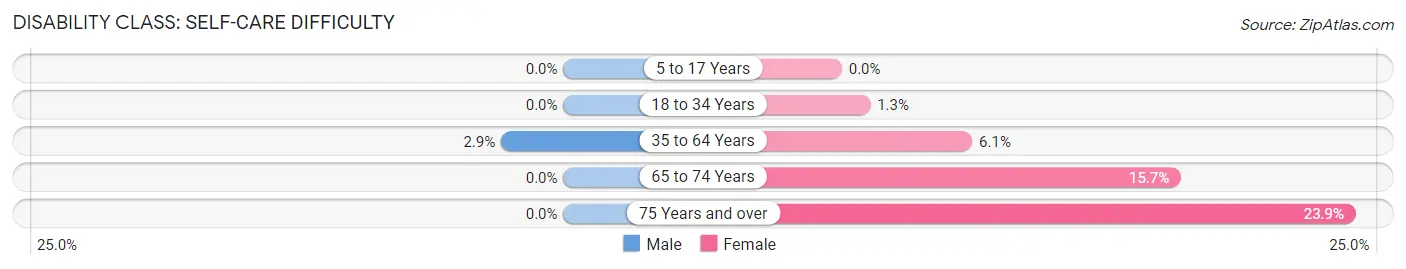
| Age Bracket | Male | Female |
| 5 to 17 Years | 0 (0.0%) | 0 (0.0%) |
| 18 to 34 Years | 0 (0.0%) | 2 (1.3%) |
| 35 to 64 Years | 11 (2.9%) | 19 (6.0%) |
| 65 to 74 Years | 0 (0.0%) | 17 (15.7%) |
| 75 Years and over | 0 (0.0%) | 31 (23.8%) |
Technology Access in Walnut Cove
Computing Device Access in Walnut Cove
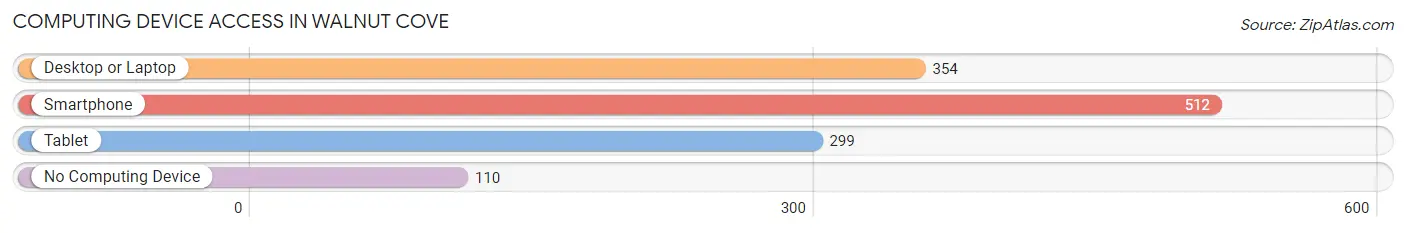
| Device Type | # Households | % Households |
| Desktop or Laptop | 354 | 51.6% |
| Smartphone | 512 | 74.6% |
| Tablet | 299 | 43.6% |
| No Computing Device | 110 | 16.0% |
| Total | 686 | 100.0% |
Internet Access in Walnut Cove
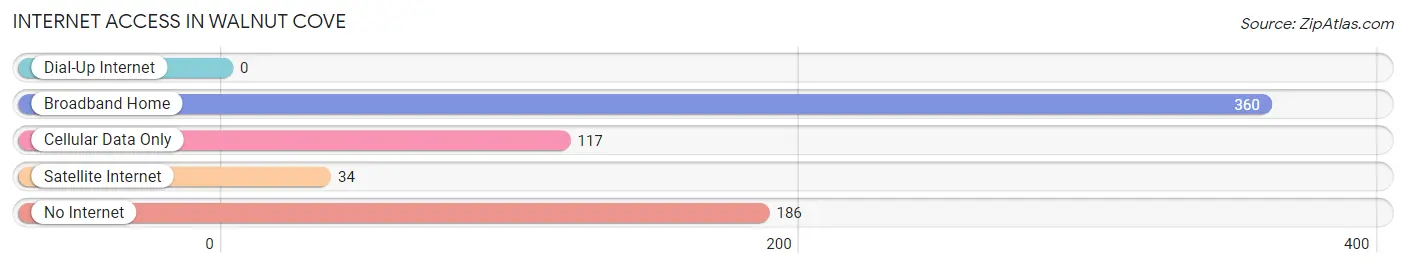
| Internet Type | # Households | % Households |
| Dial-Up Internet | 0 | 0.0% |
| Broadband Home | 360 | 52.5% |
| Cellular Data Only | 117 | 17.1% |
| Satellite Internet | 34 | 5.0% |
| No Internet | 186 | 27.1% |
| Total | 686 | 100.0% |
Walnut Cove Summary
Walnut Cove is a small town located in Stokes County, North Carolina. It is situated in the foothills of the Blue Ridge Mountains, about 25 miles northeast of Winston-Salem. The town has a population of approximately 1,500 people and is part of the Piedmont Triad metropolitan area.
History
Walnut Cove was founded in 1790 by a group of settlers from Pennsylvania. The town was originally known as “Walnut Grove” and was named after the abundance of walnut trees in the area. The town was incorporated in 1872 and was officially renamed “Walnut Cove” in 1875.
The town was a major stop on the North Carolina Railroad, which ran from Charlotte to Danville, Virginia. The railroad brought many new businesses and industries to the area, including a cotton mill, a furniture factory, and a brickyard. The town also became a popular tourist destination, with many visitors coming to enjoy the scenic beauty of the Blue Ridge Mountains.
Geography
Walnut Cove is located in the foothills of the Blue Ridge Mountains, about 25 miles northeast of Winston-Salem. The town is situated at an elevation of 1,000 feet and is surrounded by rolling hills and lush forests. The town is located near the Yadkin River, which provides a source of recreation for the residents.
The climate in Walnut Cove is mild and humid, with temperatures ranging from the mid-30s in the winter to the mid-80s in the summer. The town receives an average of 45 inches of rain per year, with most of the precipitation occurring in the spring and summer months.
Economy
The economy of Walnut Cove is largely based on agriculture and tourism. The town is home to several farms, which produce a variety of crops, including corn, soybeans, and tobacco. The town is also home to several wineries, which produce a variety of wines.
The town is also a popular tourist destination, with many visitors coming to enjoy the scenic beauty of the Blue Ridge Mountains. The town is home to several bed and breakfasts, as well as a variety of restaurants and shops.
Demographics
As of the 2010 census, the population of Walnut Cove was 1,500 people. The racial makeup of the town was 94.2% White, 2.7% African American, 0.7% Native American, 0.3% Asian, and 2.1% from other races. The median household income was $35,000, and the median age was 42 years.
Conclusion
Walnut Cove is a small town located in Stokes County, North Carolina. It is situated in the foothills of the Blue Ridge Mountains, about 25 miles northeast of Winston-Salem. The town has a population of approximately 1,500 people and is part of the Piedmont Triad metropolitan area. The economy of Walnut Cove is largely based on agriculture and tourism, and the town is a popular tourist destination due to its scenic beauty. The racial makeup of the town is predominantly White, with a small percentage of African American, Native American, and Asian residents. The median household income is $35,000, and the median age is 42 years.
Common Questions
What is Per Capita Income in Walnut Cove?
Per Capita income in Walnut Cove is $22,873.
What is the Median Family Income in Walnut Cove?
Median Family Income in Walnut Cove is $61,324.
What is the Median Household income in Walnut Cove?
Median Household Income in Walnut Cove is $42,398.
What is Income or Wage Gap in Walnut Cove?
Income or Wage Gap in Walnut Cove is 51.4%.
Women in Walnut Cove earn 48.6 cents for every dollar earned by a man.
What is Inequality or Gini Index in Walnut Cove?
Inequality or Gini Index in Walnut Cove is 0.44.
What is the Total Population of Walnut Cove?
Total Population of Walnut Cove is 2,028.
What is the Total Male Population of Walnut Cove?
Total Male Population of Walnut Cove is 1,029.
What is the Total Female Population of Walnut Cove?
Total Female Population of Walnut Cove is 999.
What is the Ratio of Males per 100 Females in Walnut Cove?
There are 103.00 Males per 100 Females in Walnut Cove.
What is the Ratio of Females per 100 Males in Walnut Cove?
There are 97.08 Females per 100 Males in Walnut Cove.
What is the Median Population Age in Walnut Cove?
Median Population Age in Walnut Cove is 40.5 Years.
What is the Average Family Size in Walnut Cove
Average Family Size in Walnut Cove is 3.7 People.
What is the Average Household Size in Walnut Cove
Average Household Size in Walnut Cove is 2.8 People.
How Large is the Labor Force in Walnut Cove?
There are 955 People in the Labor Forcein in Walnut Cove.
What is the Percentage of People in the Labor Force in Walnut Cove?
56.6% of People are in the Labor Force in Walnut Cove.
What is the Unemployment Rate in Walnut Cove?
Unemployment Rate in Walnut Cove is 4.2%.