Vanceboro, NC Map & Demographics
Vanceboro Map
Vanceboro Overview
$22,724
PER CAPITA INCOME
$39,044
AVG FAMILY INCOME
$38,646
AVG HOUSEHOLD INCOME
41.3%
WAGE / INCOME GAP [ % ]
58.7¢/ $1
WAGE / INCOME GAP [ $ ]
0.43
INEQUALITY / GINI INDEX
958
TOTAL POPULATION
386
MALE POPULATION
572
FEMALE POPULATION
67.48
MALES / 100 FEMALES
148.19
FEMALES / 100 MALES
38.0
MEDIAN AGE
2.9
AVG FAMILY SIZE
2.4
AVG HOUSEHOLD SIZE
389
LABOR FORCE [ PEOPLE ]
51.7%
PERCENT IN LABOR FORCE
1.0%
UNEMPLOYMENT RATE
Vanceboro Zip Codes
Vanceboro Area Codes
Income in Vanceboro
Income Overview in Vanceboro
Per Capita Income in Vanceboro is $22,724, while median incomes of families and households are $39,044 and $38,646 respectively.
| Characteristic | Number | Measure |
| Per Capita Income | 958 | $22,724 |
| Median Family Income | 255 | $39,044 |
| Mean Family Income | 255 | $54,444 |
| Median Household Income | 406 | $38,646 |
| Mean Household Income | 406 | $55,159 |
| Income Deficit | 255 | $0 |
| Wage / Income Gap (%) | 958 | 41.26% |
| Wage / Income Gap ($) | 958 | 58.74¢ per $1 |
| Gini / Inequality Index | 958 | 0.43 |
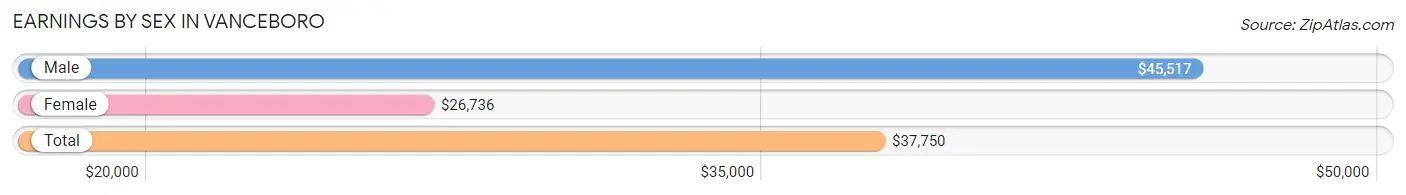
Earnings by Sex in Vanceboro
Average Earnings in Vanceboro are $37,750, $45,517 for men and $26,736 for women, a difference of 41.3%.
| Sex | Number | Average Earnings |
| Male | 176 (44.6%) | $45,517 |
| Female | 219 (55.4%) | $26,736 |
| Total | 395 (100.0%) | $37,750 |
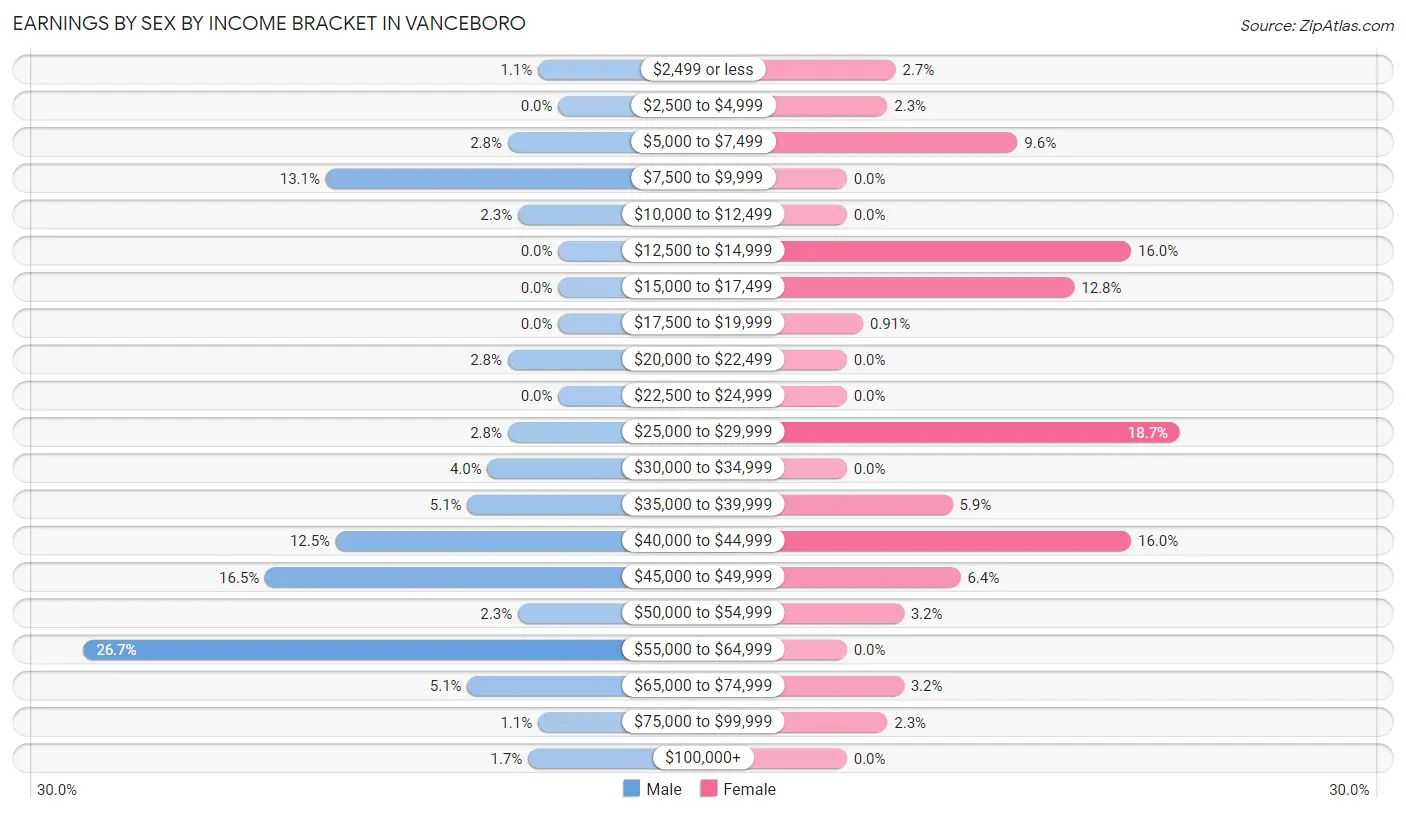
Earnings by Sex by Income Bracket in Vanceboro
The most common earnings brackets in Vanceboro are $55,000 to $64,999 for men (47 | 26.7%) and $25,000 to $29,999 for women (41 | 18.7%).
| Income | Male | Female |
| $2,499 or less | 2 (1.1%) | 6 (2.7%) |
| $2,500 to $4,999 | 0 (0.0%) | 5 (2.3%) |
| $5,000 to $7,499 | 5 (2.8%) | 21 (9.6%) |
| $7,500 to $9,999 | 23 (13.1%) | 0 (0.0%) |
| $10,000 to $12,499 | 4 (2.3%) | 0 (0.0%) |
| $12,500 to $14,999 | 0 (0.0%) | 35 (16.0%) |
| $15,000 to $17,499 | 0 (0.0%) | 28 (12.8%) |
| $17,500 to $19,999 | 0 (0.0%) | 2 (0.9%) |
| $20,000 to $22,499 | 5 (2.8%) | 0 (0.0%) |
| $22,500 to $24,999 | 0 (0.0%) | 0 (0.0%) |
| $25,000 to $29,999 | 5 (2.8%) | 41 (18.7%) |
| $30,000 to $34,999 | 7 (4.0%) | 0 (0.0%) |
| $35,000 to $39,999 | 9 (5.1%) | 13 (5.9%) |
| $40,000 to $44,999 | 22 (12.5%) | 35 (16.0%) |
| $45,000 to $49,999 | 29 (16.5%) | 14 (6.4%) |
| $50,000 to $54,999 | 4 (2.3%) | 7 (3.2%) |
| $55,000 to $64,999 | 47 (26.7%) | 0 (0.0%) |
| $65,000 to $74,999 | 9 (5.1%) | 7 (3.2%) |
| $75,000 to $99,999 | 2 (1.1%) | 5 (2.3%) |
| $100,000+ | 3 (1.7%) | 0 (0.0%) |
| Total | 176 (100.0%) | 219 (100.0%) |
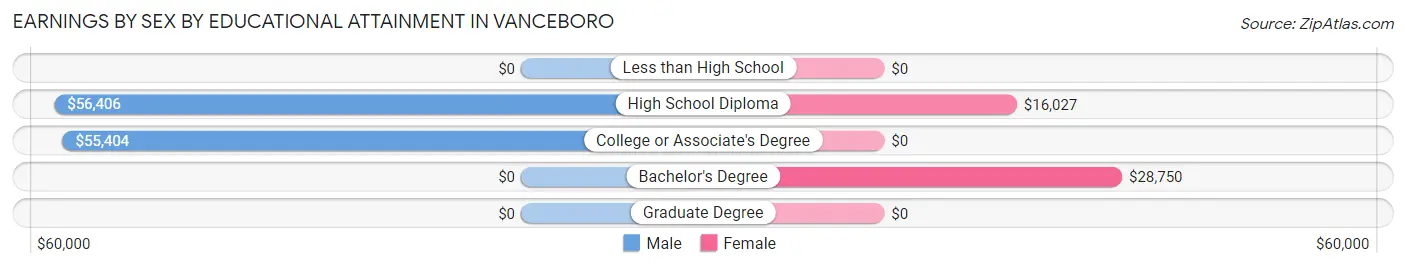
Earnings by Sex by Educational Attainment in Vanceboro
Average earnings in Vanceboro are $47,328 for men and $26,736 for women, a difference of 43.5%. Men with an educational attainment of high school diploma enjoy the highest average annual earnings of $56,406, while those with college or associate's degree education earn the least with $55,404. Women with an educational attainment of bachelor's degree earn the most with the average annual earnings of $28,750, while those with high school diploma education have the smallest earnings of $16,027.
| Educational Attainment | Male Income | Female Income |
| Less than High School | - | - |
| High School Diploma | $56,406 | $16,027 |
| College or Associate's Degree | $55,404 | $0 |
| Bachelor's Degree | - | - |
| Graduate Degree | - | - |
| Total | $47,328 | $26,736 |
Family Income in Vanceboro
Family Income Brackets in Vanceboro
According to the Vanceboro family income data, there are 43 families falling into the $25,000 to $34,999 income range, which is the most common income bracket and makes up 16.9% of all families.
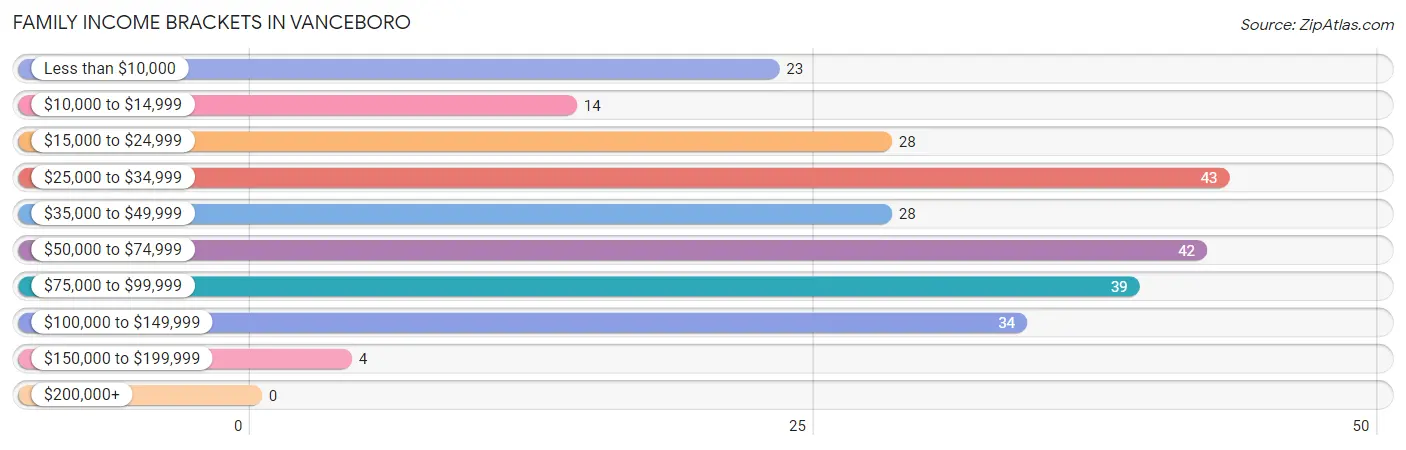
| Income Bracket | # Families | % Families |
| Less than $10,000 | 23 | 9.0% |
| $10,000 to $14,999 | 14 | 5.5% |
| $15,000 to $24,999 | 28 | 11.0% |
| $25,000 to $34,999 | 43 | 16.9% |
| $35,000 to $49,999 | 28 | 11.0% |
| $50,000 to $74,999 | 42 | 16.5% |
| $75,000 to $99,999 | 39 | 15.3% |
| $100,000 to $149,999 | 34 | 13.3% |
| $150,000 to $199,999 | 4 | 1.6% |
| $200,000+ | 0 | 0.0% |
Family Income by Famaliy Size in Vanceboro
4-person families (32 | 12.6%) account for the highest median family income in Vanceboro with $115,833 per family, while 4-person families (32 | 12.6%) have the highest median income of $28,958 per family member.
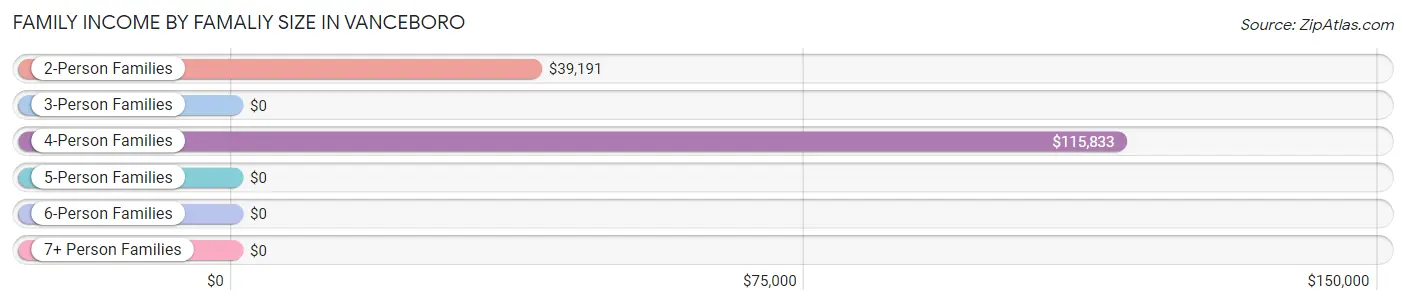
| Income Bracket | # Families | Median Income |
| 2-Person Families | 105 (41.2%) | $39,191 |
| 3-Person Families | 96 (37.7%) | $0 |
| 4-Person Families | 32 (12.6%) | $115,833 |
| 5-Person Families | 17 (6.7%) | $0 |
| 6-Person Families | 5 (2.0%) | $0 |
| 7+ Person Families | 0 (0.0%) | $0 |
| Total | 255 (100.0%) | $39,044 |
Family Income by Number of Earners in Vanceboro
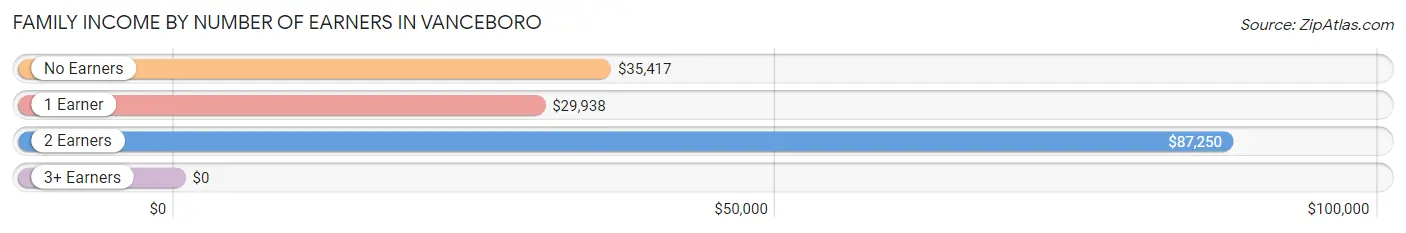
| Number of Earners | # Families | Median Income |
| No Earners | 47 (18.4%) | $35,417 |
| 1 Earner | 141 (55.3%) | $29,938 |
| 2 Earners | 61 (23.9%) | $87,250 |
| 3+ Earners | 6 (2.4%) | $0 |
| Total | 255 (100.0%) | $39,044 |
Household Income in Vanceboro
Household Income Brackets in Vanceboro
With 78 households falling in the category, the $15,000 to $24,999 income range is the most frequent in Vanceboro, accounting for 19.2% of all households.
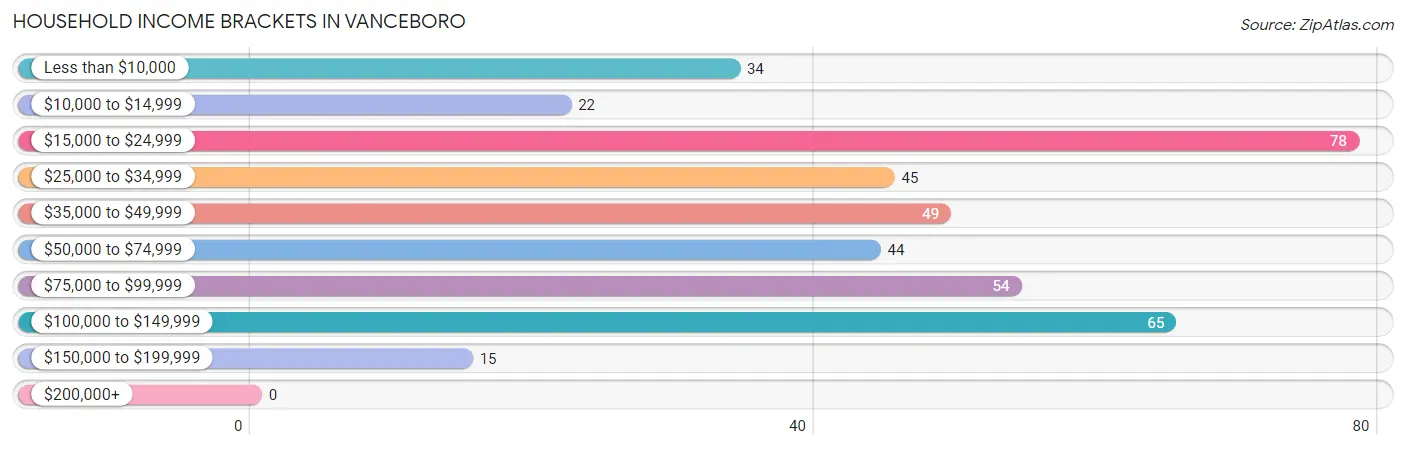
| Income Bracket | # Households | % Households |
| Less than $10,000 | 34 | 8.4% |
| $10,000 to $14,999 | 22 | 5.4% |
| $15,000 to $24,999 | 78 | 19.2% |
| $25,000 to $34,999 | 45 | 11.1% |
| $35,000 to $49,999 | 49 | 12.1% |
| $50,000 to $74,999 | 44 | 10.8% |
| $75,000 to $99,999 | 54 | 13.3% |
| $100,000 to $149,999 | 65 | 16.0% |
| $150,000 to $199,999 | 15 | 3.7% |
| $200,000+ | 0 | 0.0% |
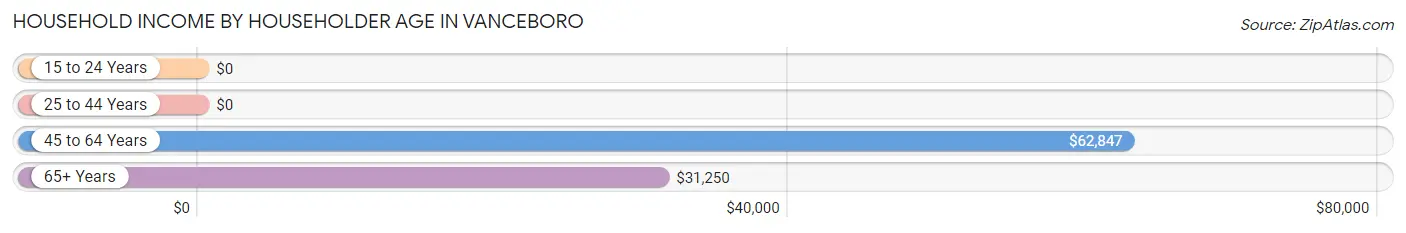
Household Income by Householder Age in Vanceboro
The median household income in Vanceboro is $38,646, with the highest median household income of $62,847 found in the 45 to 64 years age bracket for the primary householder. A total of 151 households (37.2%) fall into this category. Meanwhile, the 15 to 24 years age bracket for the primary householder has the lowest median household income of $0, with 20 households (4.9%) in this group.
| Income Bracket | # Households | Median Income |
| 15 to 24 Years | 20 (4.9%) | $0 |
| 25 to 44 Years | 143 (35.2%) | $0 |
| 45 to 64 Years | 151 (37.2%) | $62,847 |
| 65+ Years | 92 (22.7%) | $31,250 |
| Total | 406 (100.0%) | $38,646 |
Poverty in Vanceboro
Income Below Poverty by Sex and Age in Vanceboro
With 21.0% poverty level for males and 30.1% for females among the residents of Vanceboro, under 5 year old males and 5 year old females are the most vulnerable to poverty, with 4 males (100.0%) and 1 females (100.0%) in their respective age groups living below the poverty level.
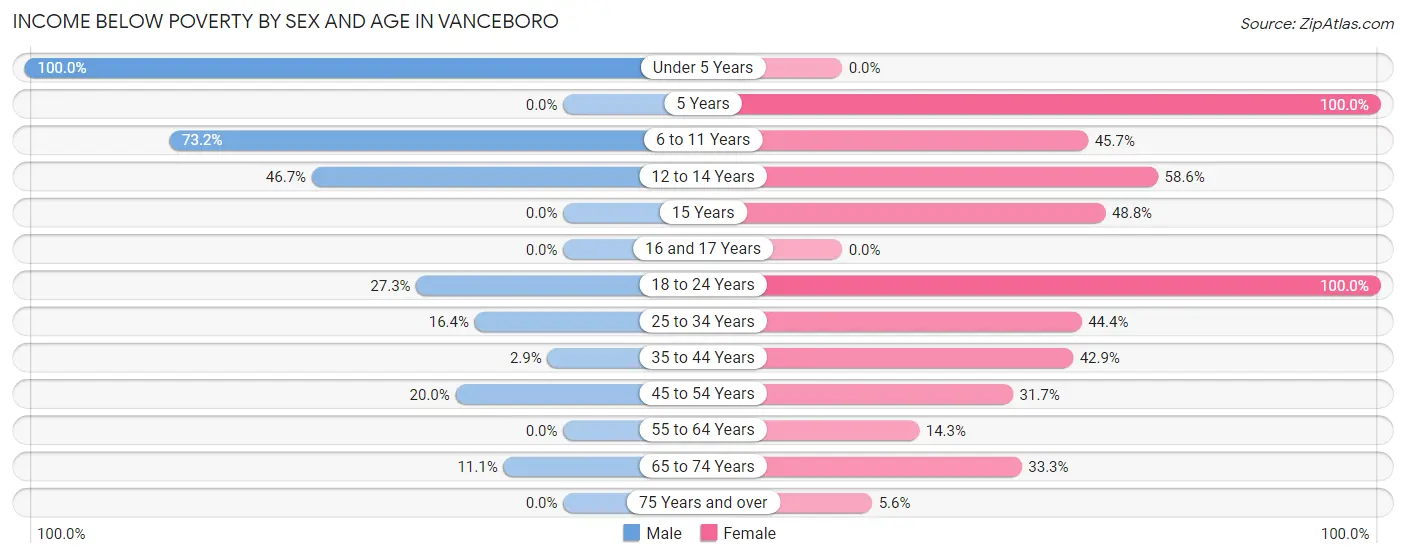
| Age Bracket | Male | Female |
| Under 5 Years | 4 (100.0%) | 0 (0.0%) |
| 5 Years | 0 (0.0%) | 1 (100.0%) |
| 6 to 11 Years | 30 (73.2%) | 21 (45.7%) |
| 12 to 14 Years | 14 (46.7%) | 17 (58.6%) |
| 15 Years | 0 (0.0%) | 21 (48.8%) |
| 16 and 17 Years | 0 (0.0%) | 0 (0.0%) |
| 18 to 24 Years | 15 (27.3%) | 5 (100.0%) |
| 25 to 34 Years | 12 (16.4%) | 40 (44.4%) |
| 35 to 44 Years | 1 (2.9%) | 18 (42.9%) |
| 45 to 54 Years | 3 (20.0%) | 13 (31.7%) |
| 55 to 64 Years | 0 (0.0%) | 15 (14.3%) |
| 65 to 74 Years | 2 (11.1%) | 15 (33.3%) |
| 75 Years and over | 0 (0.0%) | 6 (5.6%) |
| Total | 81 (21.0%) | 172 (30.1%) |
Income Above Poverty by Sex and Age in Vanceboro
According to the poverty statistics in Vanceboro, males aged 5 years and females aged under 5 years are the age groups that are most secure financially, with 100.0% of males and 100.0% of females in these age groups living above the poverty line.
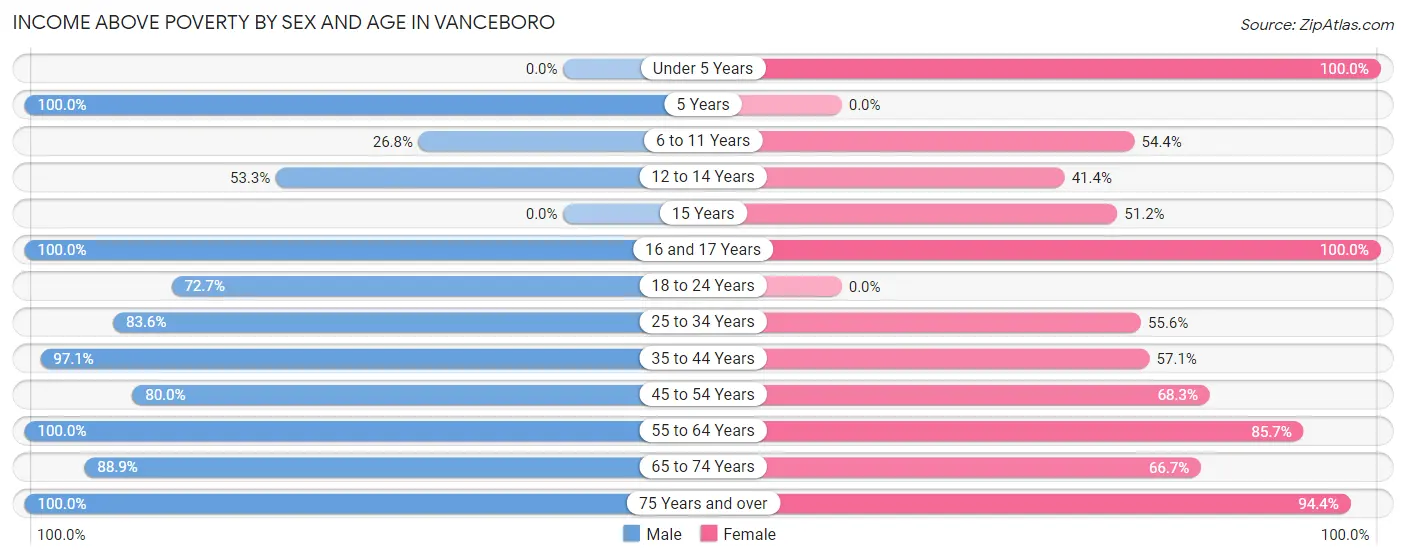
| Age Bracket | Male | Female |
| Under 5 Years | 0 (0.0%) | 6 (100.0%) |
| 5 Years | 6 (100.0%) | 0 (0.0%) |
| 6 to 11 Years | 11 (26.8%) | 25 (54.3%) |
| 12 to 14 Years | 16 (53.3%) | 12 (41.4%) |
| 15 Years | 0 (0.0%) | 22 (51.2%) |
| 16 and 17 Years | 2 (100.0%) | 11 (100.0%) |
| 18 to 24 Years | 40 (72.7%) | 0 (0.0%) |
| 25 to 34 Years | 61 (83.6%) | 50 (55.6%) |
| 35 to 44 Years | 33 (97.1%) | 24 (57.1%) |
| 45 to 54 Years | 12 (80.0%) | 28 (68.3%) |
| 55 to 64 Years | 91 (100.0%) | 90 (85.7%) |
| 65 to 74 Years | 16 (88.9%) | 30 (66.7%) |
| 75 Years and over | 17 (100.0%) | 102 (94.4%) |
| Total | 305 (79.0%) | 400 (69.9%) |
Income Below Poverty Among Married-Couple Families in Vanceboro
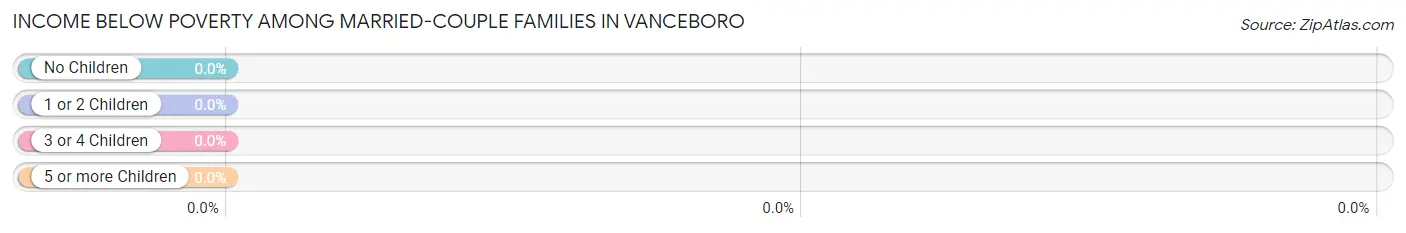
| Children | Above Poverty | Below Poverty |
| No Children | 81 (100.0%) | 0 (0.0%) |
| 1 or 2 Children | 40 (100.0%) | 0 (0.0%) |
| 3 or 4 Children | 5 (100.0%) | 0 (0.0%) |
| 5 or more Children | 0 (0.0%) | 0 (0.0%) |
| Total | 126 (100.0%) | 0 (0.0%) |
Income Below Poverty Among Single-Parent Households in Vanceboro
According to the poverty data in Vanceboro, 27.9% or 12 single-father households and 61.6% or 53 single-mother households are living below the poverty line. Among single-father households, those with 1 or 2 children have the highest poverty rate, with 12 households (27.9%) experiencing poverty. Likewise, among single-mother households, those with 3 or 4 children have the highest poverty rate, with 21 households (100.0%) falling below the poverty line.

| Children | Single Father | Single Mother |
| No Children | 0 (0.0%) | 4 (20.0%) |
| 1 or 2 Children | 12 (27.9%) | 28 (62.2%) |
| 3 or 4 Children | 0 (0.0%) | 21 (100.0%) |
| 5 or more Children | 0 (0.0%) | 0 (0.0%) |
| Total | 12 (27.9%) | 53 (61.6%) |
Income Below Poverty Among Married-Couple vs Single-Parent Households in Vanceboro
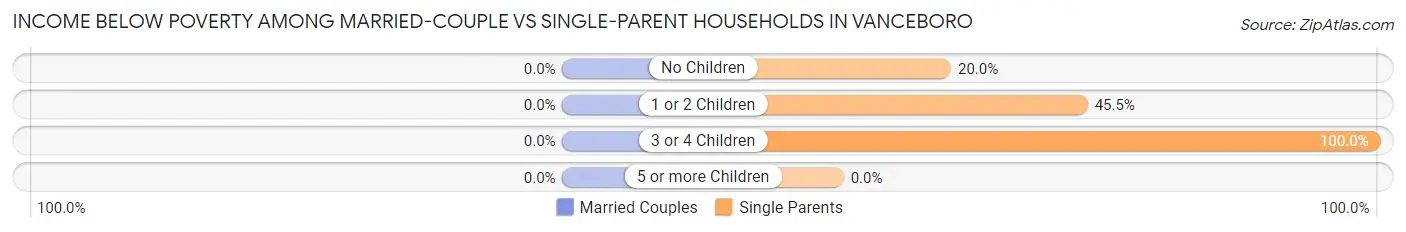
| Children | Married-Couple Families | Single-Parent Households |
| No Children | 0 (0.0%) | 4 (20.0%) |
| 1 or 2 Children | 0 (0.0%) | 40 (45.5%) |
| 3 or 4 Children | 0 (0.0%) | 21 (100.0%) |
| 5 or more Children | 0 (0.0%) | 0 (0.0%) |
| Total | 0 (0.0%) | 65 (50.4%) |
Race in Vanceboro
The most populous races in Vanceboro are White / Caucasian (526 | 54.9%), Black / African American (383 | 40.0%), and Native / Alaskan (21 | 2.2%).
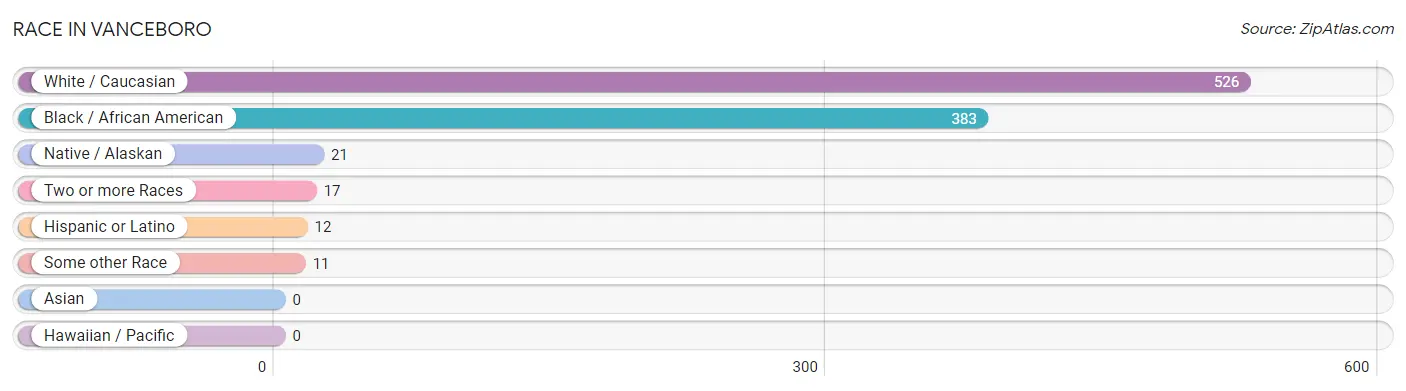
| Race | # Population | % Population |
| Asian | 0 | 0.0% |
| Black / African American | 383 | 40.0% |
| Hawaiian / Pacific | 0 | 0.0% |
| Hispanic or Latino | 12 | 1.3% |
| Native / Alaskan | 21 | 2.2% |
| White / Caucasian | 526 | 54.9% |
| Two or more Races | 17 | 1.8% |
| Some other Race | 11 | 1.1% |
| Total | 958 | 100.0% |
Ancestry in Vanceboro
The most populous ancestries reported in Vanceboro are American (119 | 12.4%), Irish (89 | 9.3%), English (51 | 5.3%), European (29 | 3.0%), and French American Indian (18 | 1.9%), together accounting for 31.9% of all Vanceboro residents.
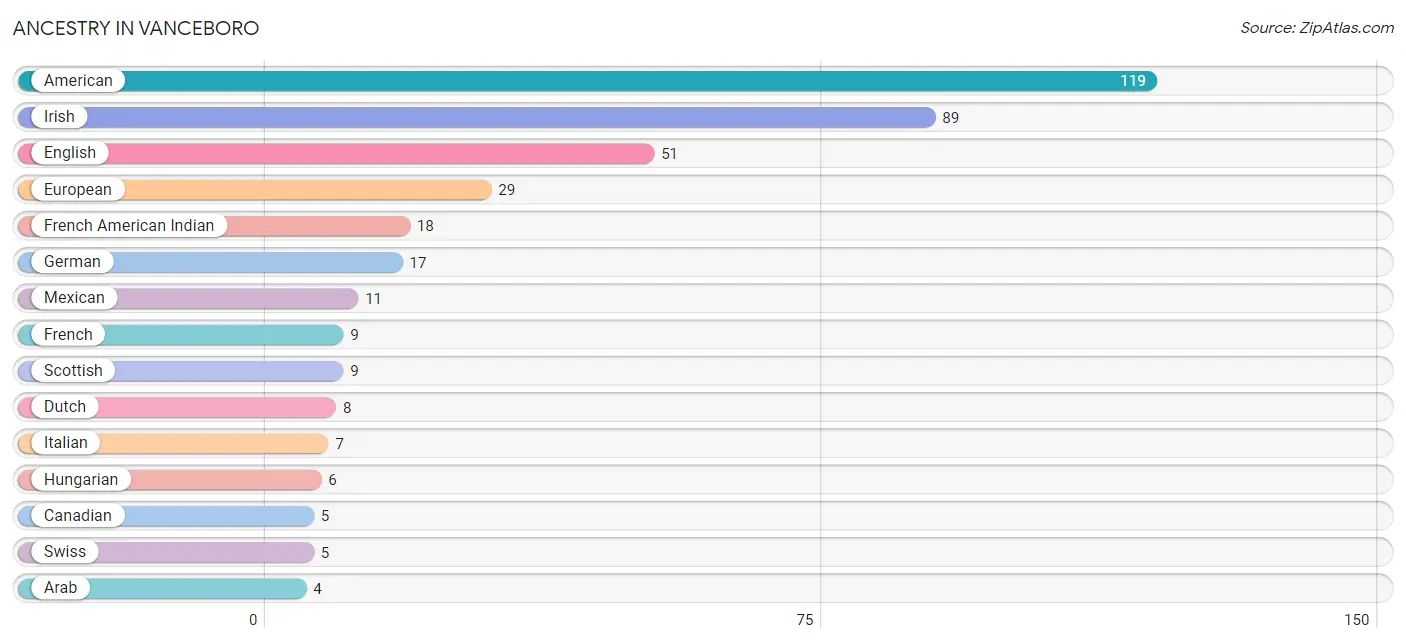
| Ancestry | # Population | % Population |
| American | 119 | 12.4% |
| Arab | 4 | 0.4% |
| Canadian | 5 | 0.5% |
| Danish | 2 | 0.2% |
| Dutch | 8 | 0.8% |
| English | 51 | 5.3% |
| European | 29 | 3.0% |
| French | 9 | 0.9% |
| French American Indian | 18 | 1.9% |
| German | 17 | 1.8% |
| Hungarian | 6 | 0.6% |
| Irish | 89 | 9.3% |
| Italian | 7 | 0.7% |
| Mexican | 11 | 1.1% |
| Puerto Rican | 1 | 0.1% |
| Scotch-Irish | 3 | 0.3% |
| Scottish | 9 | 0.9% |
| Swedish | 2 | 0.2% |
| Swiss | 5 | 0.5% | View All 19 Rows |
Immigrants in Vanceboro
The most numerous immigrant groups reported in Vanceboro came from Asia (4 | 0.4%), Western Asia (4 | 0.4%), and Yemen (4 | 0.4%), together accounting for 1.3% of all Vanceboro residents.
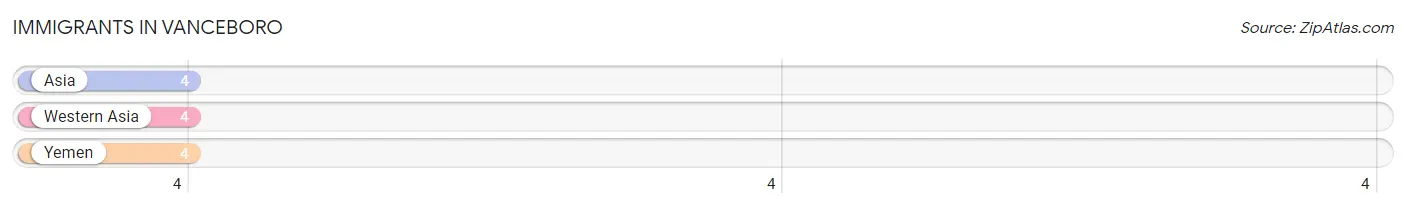
| Immigration Origin | # Population | % Population |
| Asia | 4 | 0.4% |
| Western Asia | 4 | 0.4% |
| Yemen | 4 | 0.4% | View All 3 Rows |
Sex and Age in Vanceboro
Sex and Age in Vanceboro
The most populous age groups in Vanceboro are 60 to 64 Years (56 | 14.5%) for men and 85 Years and over (90 | 15.7%) for women.
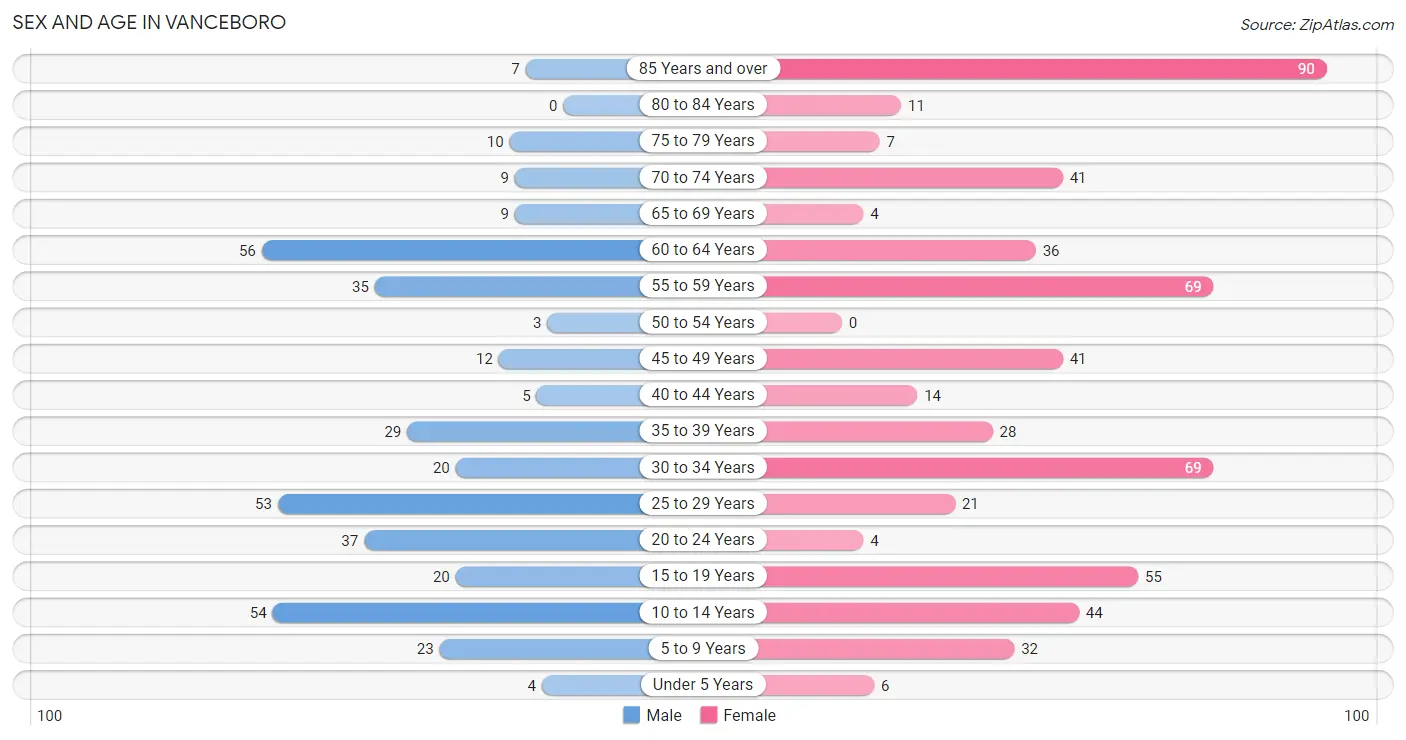
| Age Bracket | Male | Female |
| Under 5 Years | 4 (1.0%) | 6 (1.1%) |
| 5 to 9 Years | 23 (6.0%) | 32 (5.6%) |
| 10 to 14 Years | 54 (14.0%) | 44 (7.7%) |
| 15 to 19 Years | 20 (5.2%) | 55 (9.6%) |
| 20 to 24 Years | 37 (9.6%) | 4 (0.7%) |
| 25 to 29 Years | 53 (13.7%) | 21 (3.7%) |
| 30 to 34 Years | 20 (5.2%) | 69 (12.1%) |
| 35 to 39 Years | 29 (7.5%) | 28 (4.9%) |
| 40 to 44 Years | 5 (1.3%) | 14 (2.5%) |
| 45 to 49 Years | 12 (3.1%) | 41 (7.2%) |
| 50 to 54 Years | 3 (0.8%) | 0 (0.0%) |
| 55 to 59 Years | 35 (9.1%) | 69 (12.1%) |
| 60 to 64 Years | 56 (14.5%) | 36 (6.3%) |
| 65 to 69 Years | 9 (2.3%) | 4 (0.7%) |
| 70 to 74 Years | 9 (2.3%) | 41 (7.2%) |
| 75 to 79 Years | 10 (2.6%) | 7 (1.2%) |
| 80 to 84 Years | 0 (0.0%) | 11 (1.9%) |
| 85 Years and over | 7 (1.8%) | 90 (15.7%) |
| Total | 386 (100.0%) | 572 (100.0%) |
Families and Households in Vanceboro
Median Family Size in Vanceboro
The median family size in Vanceboro is 2.91 persons per family, with married-couple families (126 | 49.4%) accounting for the largest median family size of 3.17 persons per family. On the other hand, single male/father families (43 | 16.9%) represent the smallest median family size with 2.23 persons per family.
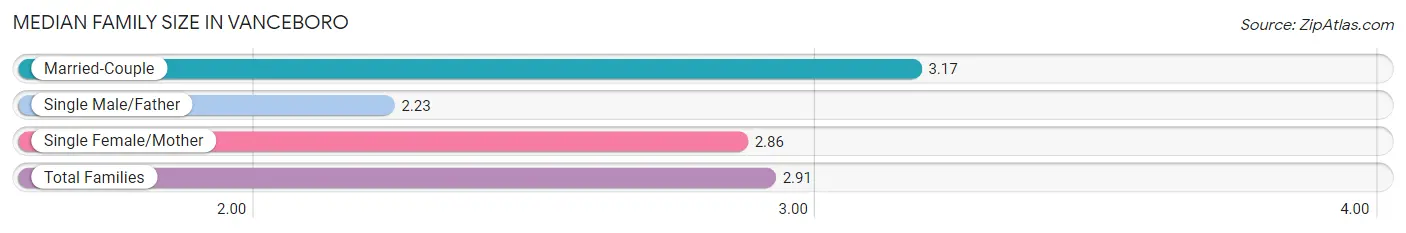
| Family Type | # Families | Family Size |
| Married-Couple | 126 (49.4%) | 3.17 |
| Single Male/Father | 43 (16.9%) | 2.23 |
| Single Female/Mother | 86 (33.7%) | 2.86 |
| Total Families | 255 (100.0%) | 2.91 |
Median Household Size in Vanceboro
The median household size in Vanceboro is 2.35 persons per household, with married-couple households (126 | 31.0%) accounting for the largest median household size of 3.17 persons per household. non-family households (151 | 37.2%) represent the smallest median household size with 1.25 persons per household.
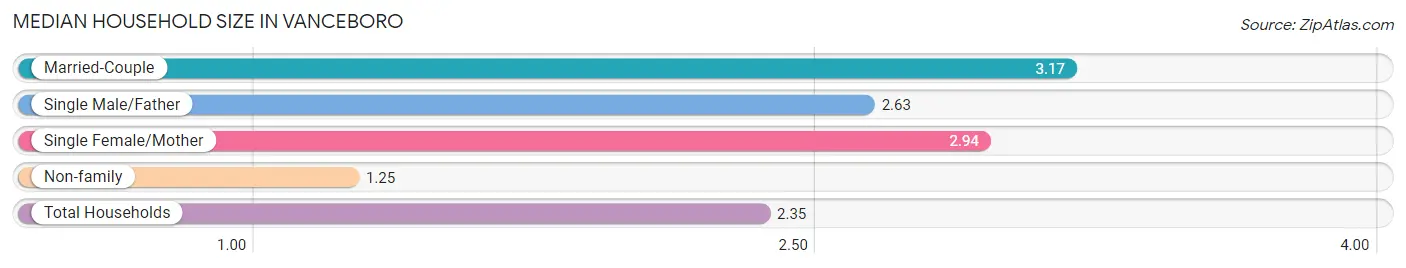
| Household Type | # Households | Household Size |
| Married-Couple | 126 (31.0%) | 3.17 |
| Single Male/Father | 43 (10.6%) | 2.63 |
| Single Female/Mother | 86 (21.2%) | 2.94 |
| Non-family | 151 (37.2%) | 1.25 |
| Total Households | 406 (100.0%) | 2.35 |
Household Size by Marriage Status in Vanceboro
Out of a total of 406 households in Vanceboro, 255 (62.8%) are family households, while 151 (37.2%) are nonfamily households. The most numerous type of family households are 2-person households, comprising 97, and the most common type of nonfamily households are 1-person households, comprising 89.
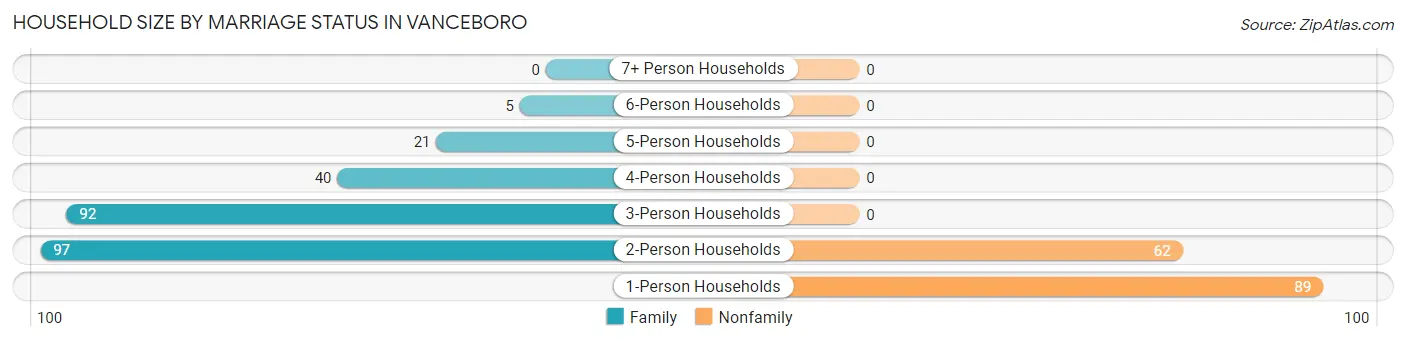
| Household Size | Family Households | Nonfamily Households |
| 1-Person Households | - | 89 (21.9%) |
| 2-Person Households | 97 (23.9%) | 62 (15.3%) |
| 3-Person Households | 92 (22.7%) | 0 (0.0%) |
| 4-Person Households | 40 (9.9%) | 0 (0.0%) |
| 5-Person Households | 21 (5.2%) | 0 (0.0%) |
| 6-Person Households | 5 (1.2%) | 0 (0.0%) |
| 7+ Person Households | 0 (0.0%) | 0 (0.0%) |
| Total | 255 (62.8%) | 151 (37.2%) |
Female Fertility in Vanceboro
Fertility by Age in Vanceboro
Average fertility rate in Vanceboro is 9.0 births per 1,000 women. Women in the age bracket of 20 to 34 years have the highest fertility rate with 21.0 births per 1,000 women. Women in the age bracket of 20 to 34 years acount for 100.0% of all women with births.
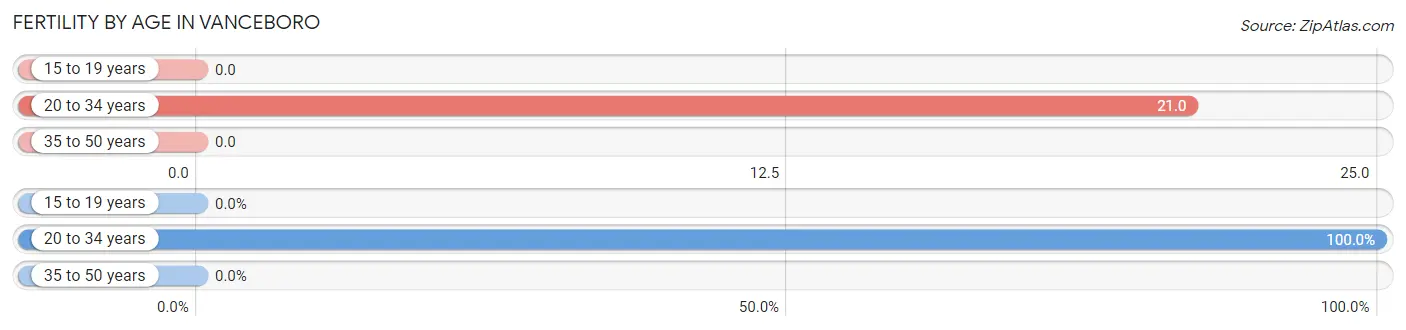
| Age Bracket | Women with Births | Births / 1,000 Women |
| 15 to 19 years | 0 (0.0%) | 0.0 |
| 20 to 34 years | 2 (100.0%) | 21.0 |
| 35 to 50 years | 0 (0.0%) | 0.0 |
| Total | 2 (100.0%) | 9.0 |
Fertility by Age by Marriage Status in Vanceboro
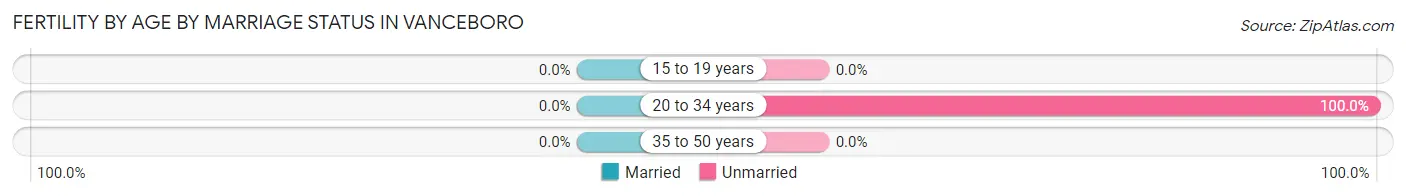
| Age Bracket | Married | Unmarried |
| 15 to 19 years | 0 (0.0%) | 0 (0.0%) |
| 20 to 34 years | 0 (0.0%) | 2 (100.0%) |
| 35 to 50 years | 0 (0.0%) | 0 (0.0%) |
| Total | 0 (0.0%) | 2 (100.0%) |
Fertility by Education in Vanceboro
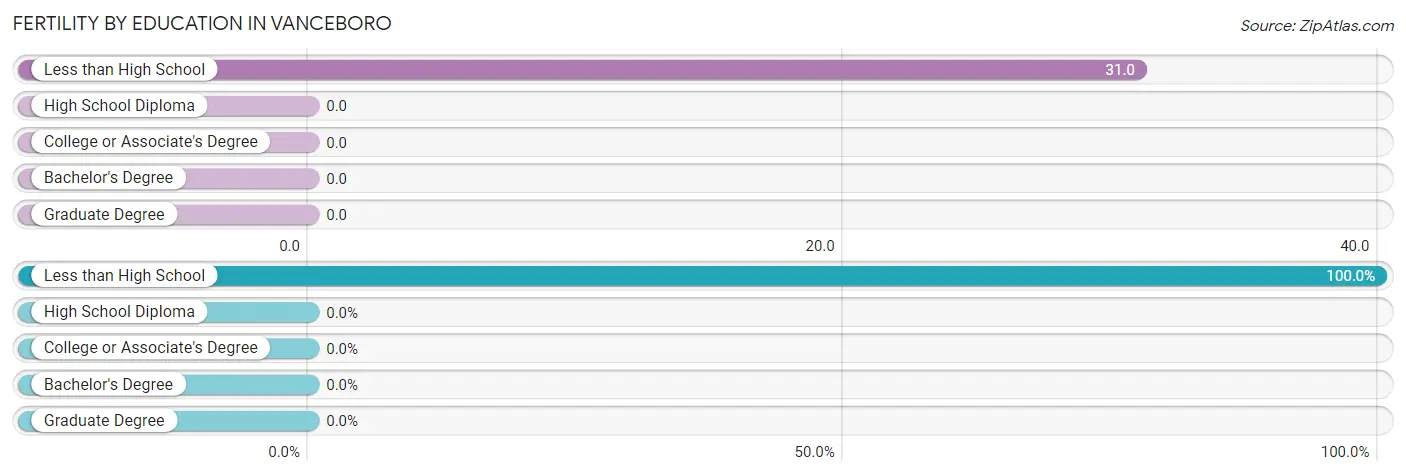
| Educational Attainment | Women with Births | Births / 1,000 Women |
| Less than High School | 2 (100.0%) | 31.0 |
| High School Diploma | 0 (0.0%) | 0.0 |
| College or Associate's Degree | 0 (0.0%) | 0.0 |
| Bachelor's Degree | 0 (0.0%) | 0.0 |
| Graduate Degree | 0 (0.0%) | 0.0 |
| Total | 2 (100.0%) | 9.0 |
Fertility by Education by Marriage Status in Vanceboro
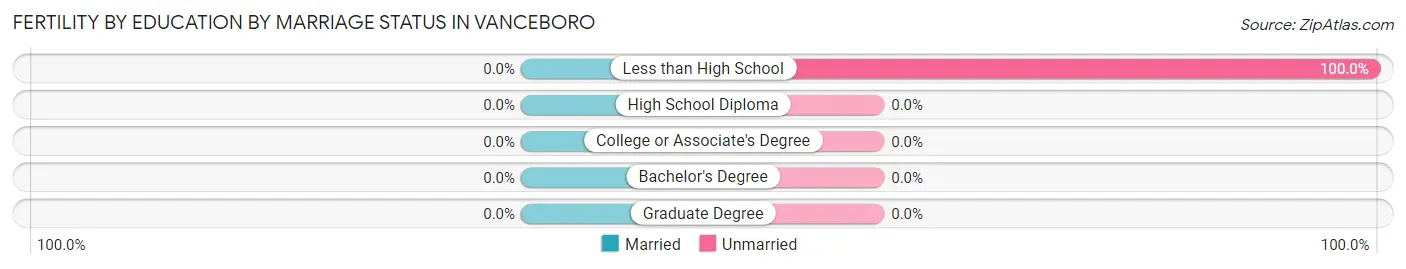
| Educational Attainment | Married | Unmarried |
| Less than High School | 0 (0.0%) | 2 (100.0%) |
| High School Diploma | 0 (0.0%) | 0 (0.0%) |
| College or Associate's Degree | 0 (0.0%) | 0 (0.0%) |
| Bachelor's Degree | 0 (0.0%) | 0 (0.0%) |
| Graduate Degree | 0 (0.0%) | 0 (0.0%) |
| Total | 0 (0.0%) | 2 (100.0%) |
Employment Characteristics in Vanceboro
Employment by Class of Employer in Vanceboro
Among the 364 employed individuals in Vanceboro, private company employees (210 | 57.7%), state government employees (56 | 15.4%), and not-for-profit organizations (50 | 13.7%) make up the most common classes of employment.
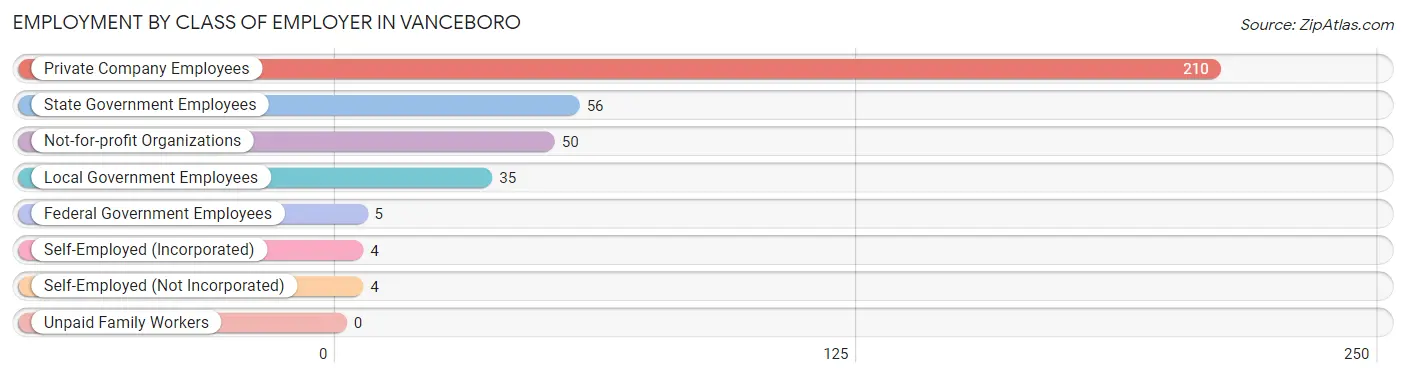
| Employer Class | # Employees | % Employees |
| Private Company Employees | 210 | 57.7% |
| Self-Employed (Incorporated) | 4 | 1.1% |
| Self-Employed (Not Incorporated) | 4 | 1.1% |
| Not-for-profit Organizations | 50 | 13.7% |
| Local Government Employees | 35 | 9.6% |
| State Government Employees | 56 | 15.4% |
| Federal Government Employees | 5 | 1.4% |
| Unpaid Family Workers | 0 | 0.0% |
| Total | 364 | 100.0% |
Employment Status by Age in Vanceboro
According to the labor force statistics for Vanceboro, out of the total population over 16 years of age (752), 51.7% or 389 individuals are in the labor force, with 1.0% or 4 of them unemployed. The age group with the highest labor force participation rate is 25 to 29 years, with 100.0% or 74 individuals in the labor force. Within the labor force, the 45 to 54 years age range has the highest percentage of unemployed individuals, with 5.6% or 2 of them being unemployed.
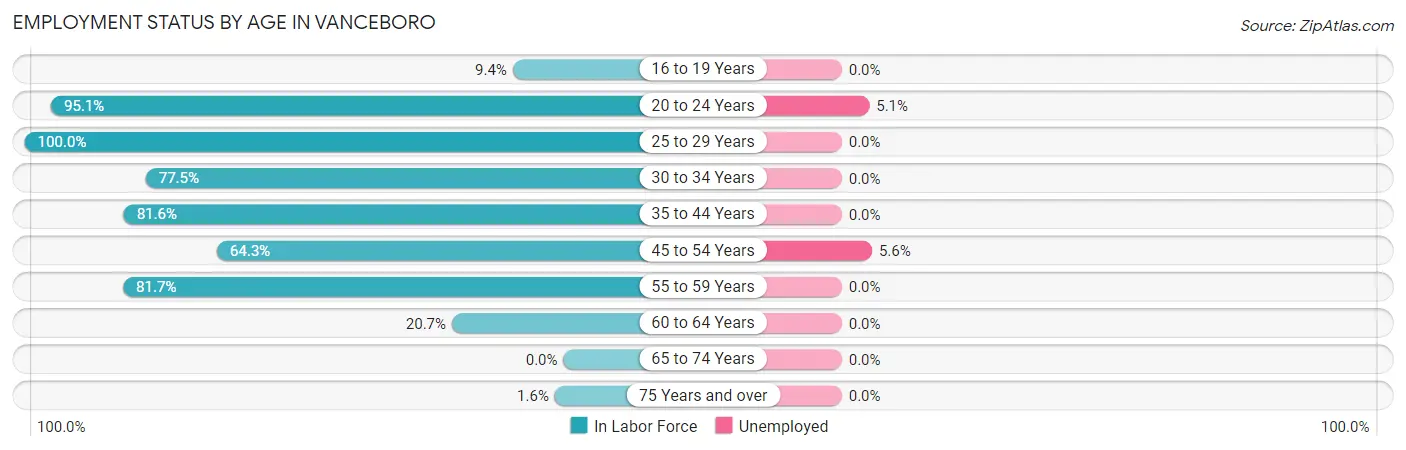
| Age Bracket | In Labor Force | Unemployed |
| 16 to 19 Years | 3 (9.4%) | 0 (0.0%) |
| 20 to 24 Years | 39 (95.1%) | 2 (5.1%) |
| 25 to 29 Years | 74 (100.0%) | 0 (0.0%) |
| 30 to 34 Years | 69 (77.5%) | 0 (0.0%) |
| 35 to 44 Years | 62 (81.6%) | 0 (0.0%) |
| 45 to 54 Years | 36 (64.3%) | 2 (5.6%) |
| 55 to 59 Years | 85 (81.7%) | 0 (0.0%) |
| 60 to 64 Years | 19 (20.7%) | 0 (0.0%) |
| 65 to 74 Years | 0 (0.0%) | 0 (0.0%) |
| 75 Years and over | 2 (1.6%) | 0 (0.0%) |
| Total | 389 (51.7%) | 4 (1.0%) |
Employment Status by Educational Attainment in Vanceboro
According to labor force statistics for Vanceboro, 70.3% of individuals (345) out of the total population between 25 and 64 years of age (491) are in the labor force, with 0.6% or 2 of them being unemployed. The group with the highest labor force participation rate are those with the educational attainment of bachelor's degree or higher, with 90.7% or 49 individuals in the labor force. Within the labor force, individuals with high school diploma education have the highest percentage of unemployment, with 2.0% or 2 of them being unemployed.
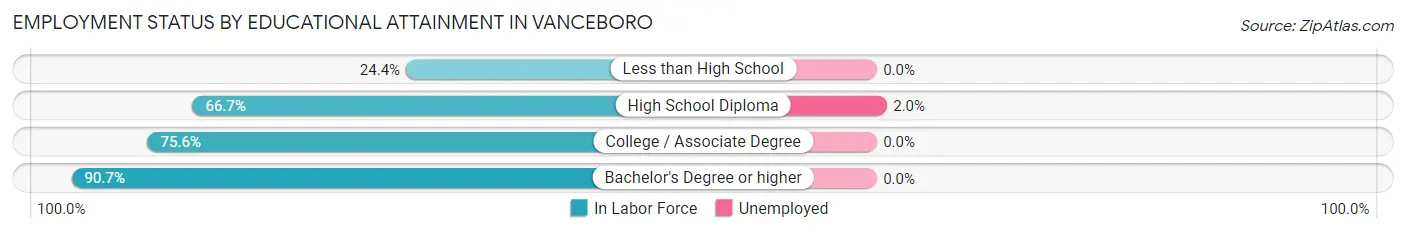
| Educational Attainment | In Labor Force | Unemployed |
| Less than High School | 10 (24.4%) | 0 (0.0%) |
| High School Diploma | 100 (66.7%) | 3 (2.0%) |
| College / Associate Degree | 186 (75.6%) | 0 (0.0%) |
| Bachelor's Degree or higher | 49 (90.7%) | 0 (0.0%) |
| Total | 345 (70.3%) | 3 (0.6%) |
Employment Occupations by Sex in Vanceboro
Management, Business, Science and Arts Occupations
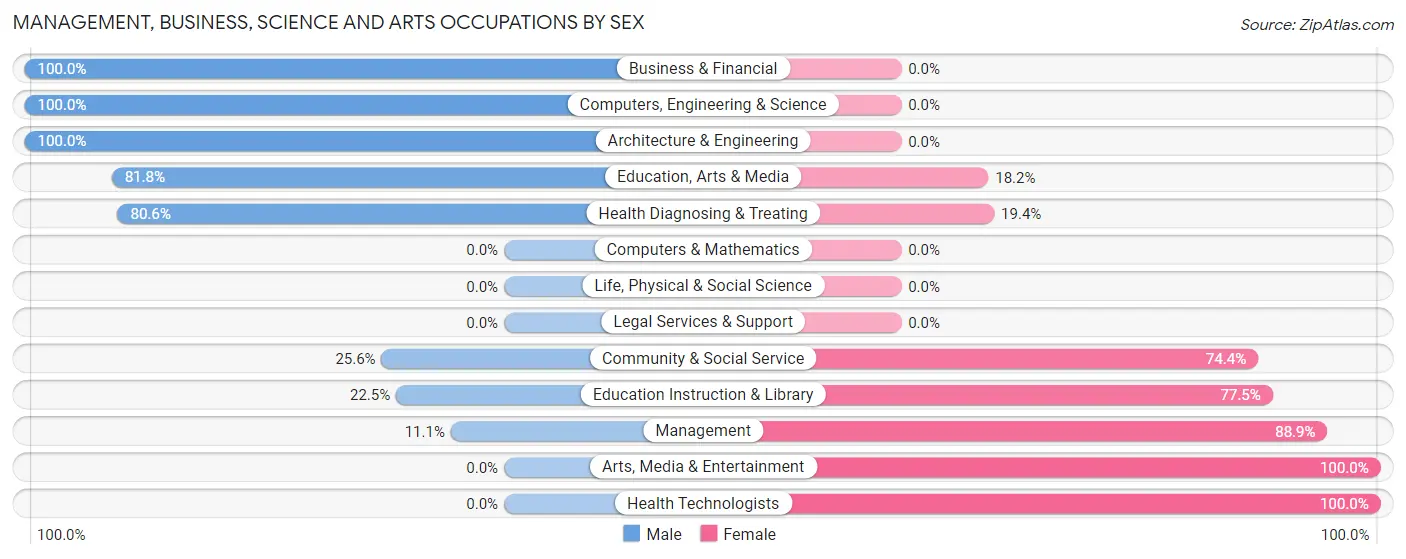
The most common Management, Business, Science and Arts occupations in Vanceboro are Community & Social Service (133 | 34.5%), Education Instruction & Library (111 | 28.8%), Health Diagnosing & Treating (67 | 17.4%), Management (18 | 4.7%), and Education, Arts & Media (11 | 2.9%).
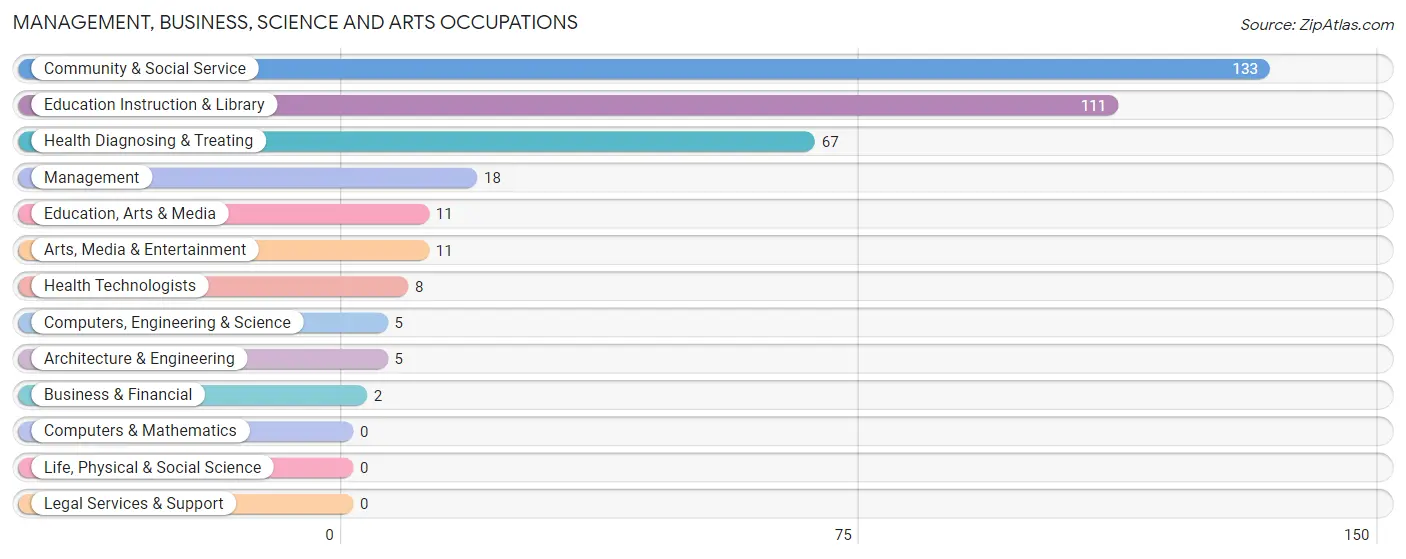
Management, Business, Science and Arts Occupations by Sex
Within the Management, Business, Science and Arts occupations in Vanceboro, the most male-oriented occupations are Business & Financial (100.0%), Computers, Engineering & Science (100.0%), and Architecture & Engineering (100.0%), while the most female-oriented occupations are Arts, Media & Entertainment (100.0%), Health Technologists (100.0%), and Management (88.9%).
| Occupation | Male | Female |
| Management | 2 (11.1%) | 16 (88.9%) |
| Business & Financial | 2 (100.0%) | 0 (0.0%) |
| Computers, Engineering & Science | 5 (100.0%) | 0 (0.0%) |
| Computers & Mathematics | 0 (0.0%) | 0 (0.0%) |
| Architecture & Engineering | 5 (100.0%) | 0 (0.0%) |
| Life, Physical & Social Science | 0 (0.0%) | 0 (0.0%) |
| Community & Social Service | 34 (25.6%) | 99 (74.4%) |
| Education, Arts & Media | 9 (81.8%) | 2 (18.2%) |
| Legal Services & Support | 0 (0.0%) | 0 (0.0%) |
| Education Instruction & Library | 25 (22.5%) | 86 (77.5%) |
| Arts, Media & Entertainment | 0 (0.0%) | 11 (100.0%) |
| Health Diagnosing & Treating | 54 (80.6%) | 13 (19.4%) |
| Health Technologists | 0 (0.0%) | 8 (100.0%) |
| Total (Category) | 97 (43.1%) | 128 (56.9%) |
| Total (Overall) | 174 (45.2%) | 211 (54.8%) |
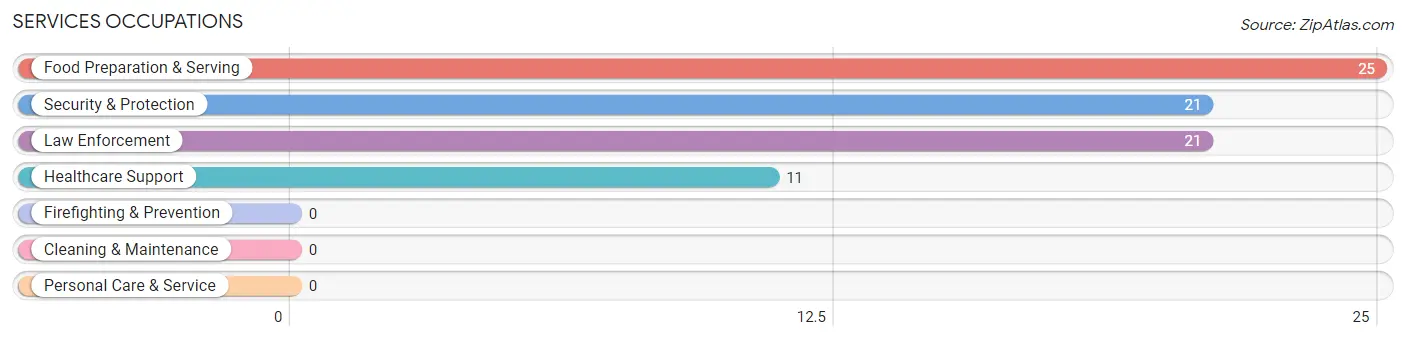
Services Occupations
The most common Services occupations in Vanceboro are Food Preparation & Serving (25 | 6.5%), Security & Protection (21 | 5.4%), Law Enforcement (21 | 5.4%), and Healthcare Support (11 | 2.9%).
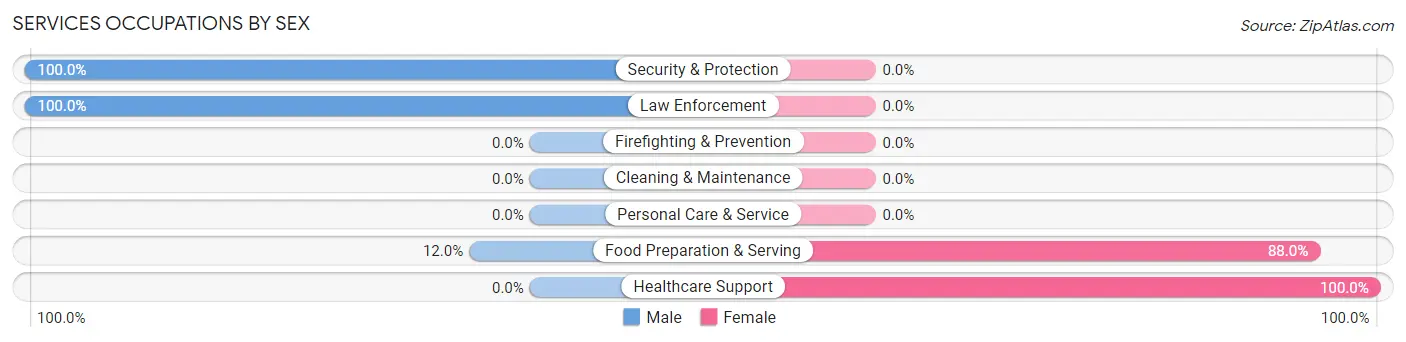
Services Occupations by Sex
Within the Services occupations in Vanceboro, the most male-oriented occupations are Security & Protection (100.0%), Law Enforcement (100.0%), and Food Preparation & Serving (12.0%), while the most female-oriented occupations are Healthcare Support (100.0%), and Food Preparation & Serving (88.0%).
| Occupation | Male | Female |
| Healthcare Support | 0 (0.0%) | 11 (100.0%) |
| Security & Protection | 21 (100.0%) | 0 (0.0%) |
| Firefighting & Prevention | 0 (0.0%) | 0 (0.0%) |
| Law Enforcement | 21 (100.0%) | 0 (0.0%) |
| Food Preparation & Serving | 3 (12.0%) | 22 (88.0%) |
| Cleaning & Maintenance | 0 (0.0%) | 0 (0.0%) |
| Personal Care & Service | 0 (0.0%) | 0 (0.0%) |
| Total (Category) | 24 (42.1%) | 33 (57.9%) |
| Total (Overall) | 174 (45.2%) | 211 (54.8%) |
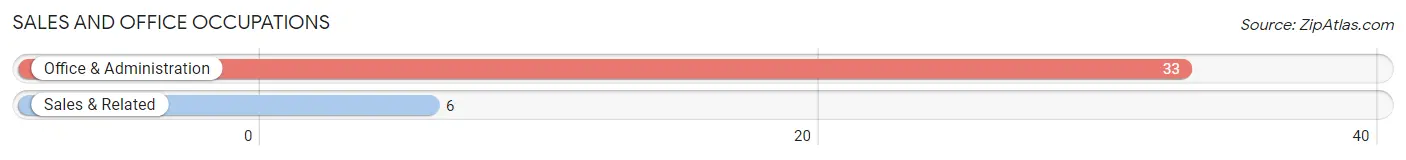
Sales and Office Occupations
The most common Sales and Office occupations in Vanceboro are Office & Administration (33 | 8.6%), and Sales & Related (6 | 1.6%).
Sales and Office Occupations by Sex

| Occupation | Male | Female |
| Sales & Related | 6 (100.0%) | 0 (0.0%) |
| Office & Administration | 5 (15.1%) | 28 (84.9%) |
| Total (Category) | 11 (28.2%) | 28 (71.8%) |
| Total (Overall) | 174 (45.2%) | 211 (54.8%) |
Natural Resources, Construction and Maintenance Occupations
The most common Natural Resources, Construction and Maintenance occupations in Vanceboro are Installation, Maintenance & Repair (12 | 3.1%), and Construction & Extraction (9 | 2.3%).
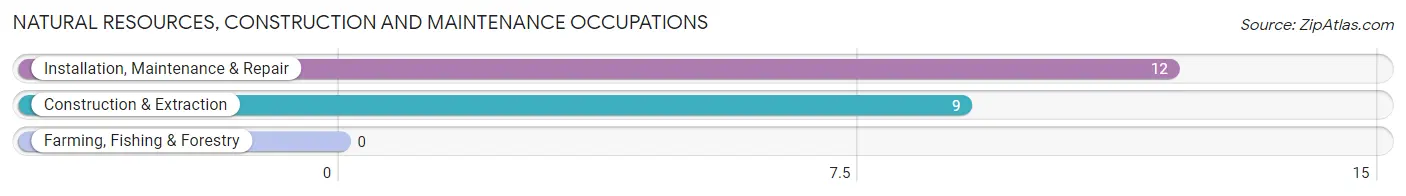
Natural Resources, Construction and Maintenance Occupations by Sex
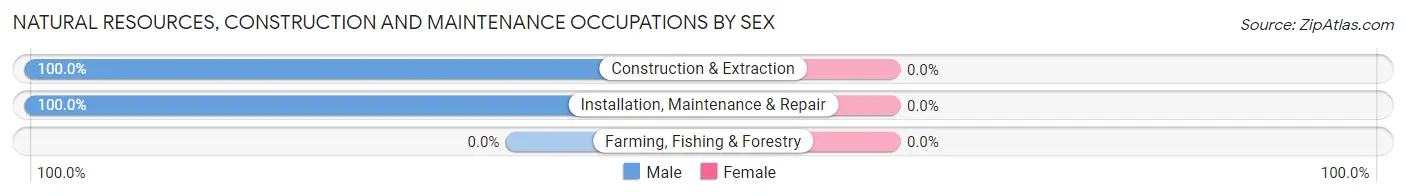
| Occupation | Male | Female |
| Farming, Fishing & Forestry | 0 (0.0%) | 0 (0.0%) |
| Construction & Extraction | 9 (100.0%) | 0 (0.0%) |
| Installation, Maintenance & Repair | 12 (100.0%) | 0 (0.0%) |
| Total (Category) | 21 (100.0%) | 0 (0.0%) |
| Total (Overall) | 174 (45.2%) | 211 (54.8%) |
Production, Transportation and Moving Occupations
The most common Production, Transportation and Moving occupations in Vanceboro are Production (26 | 6.8%), Transportation (12 | 3.1%), and Material Moving (5 | 1.3%).
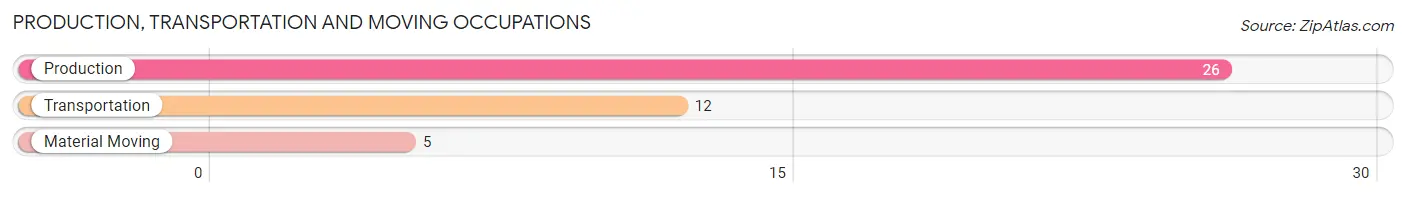
Production, Transportation and Moving Occupations by Sex
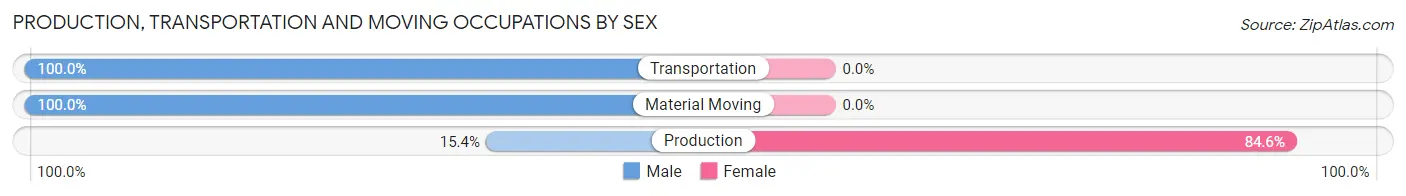
| Occupation | Male | Female |
| Production | 4 (15.4%) | 22 (84.6%) |
| Transportation | 12 (100.0%) | 0 (0.0%) |
| Material Moving | 5 (100.0%) | 0 (0.0%) |
| Total (Category) | 21 (48.8%) | 22 (51.2%) |
| Total (Overall) | 174 (45.2%) | 211 (54.8%) |
Employment Industries by Sex in Vanceboro
Employment Industries in Vanceboro
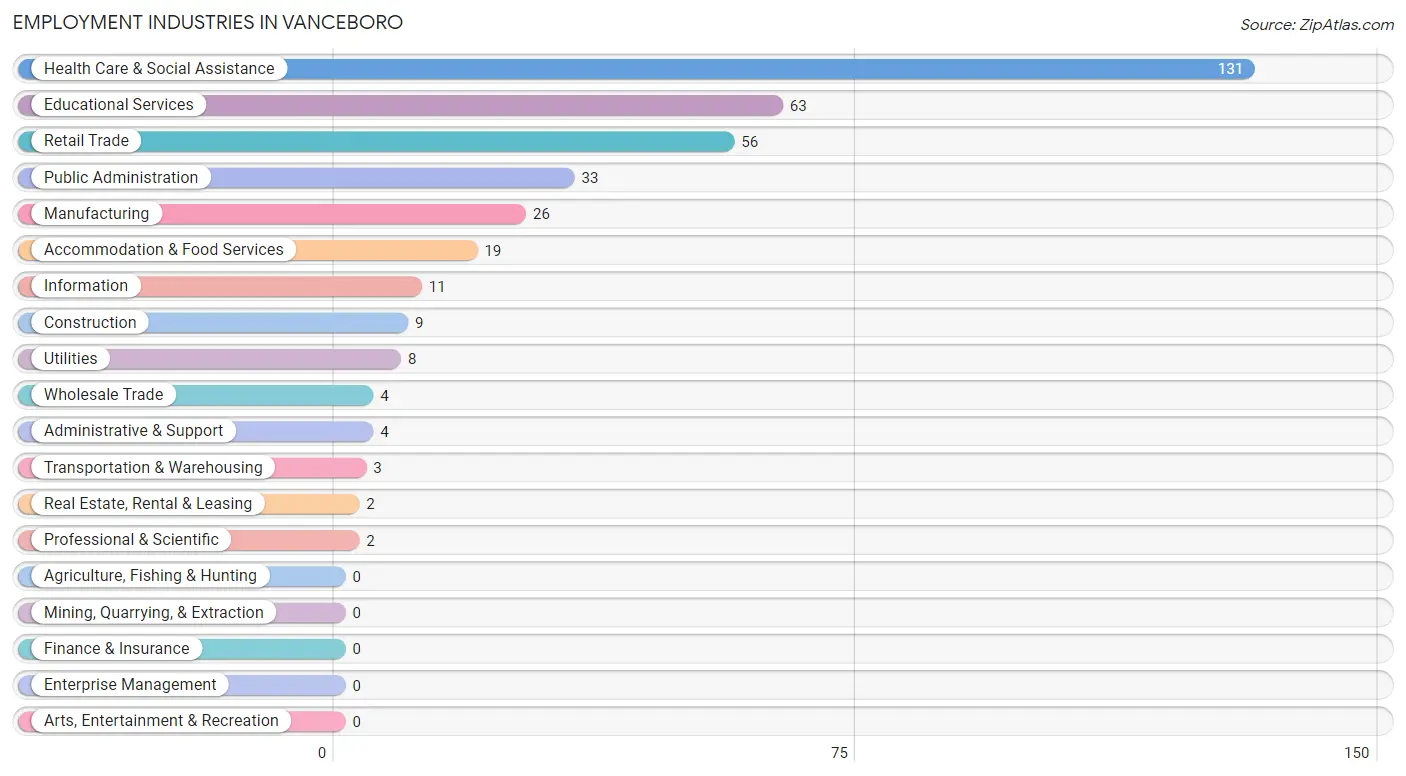
The major employment industries in Vanceboro include Health Care & Social Assistance (131 | 34.0%), Educational Services (63 | 16.4%), Retail Trade (56 | 14.5%), Public Administration (33 | 8.6%), and Manufacturing (26 | 6.8%).
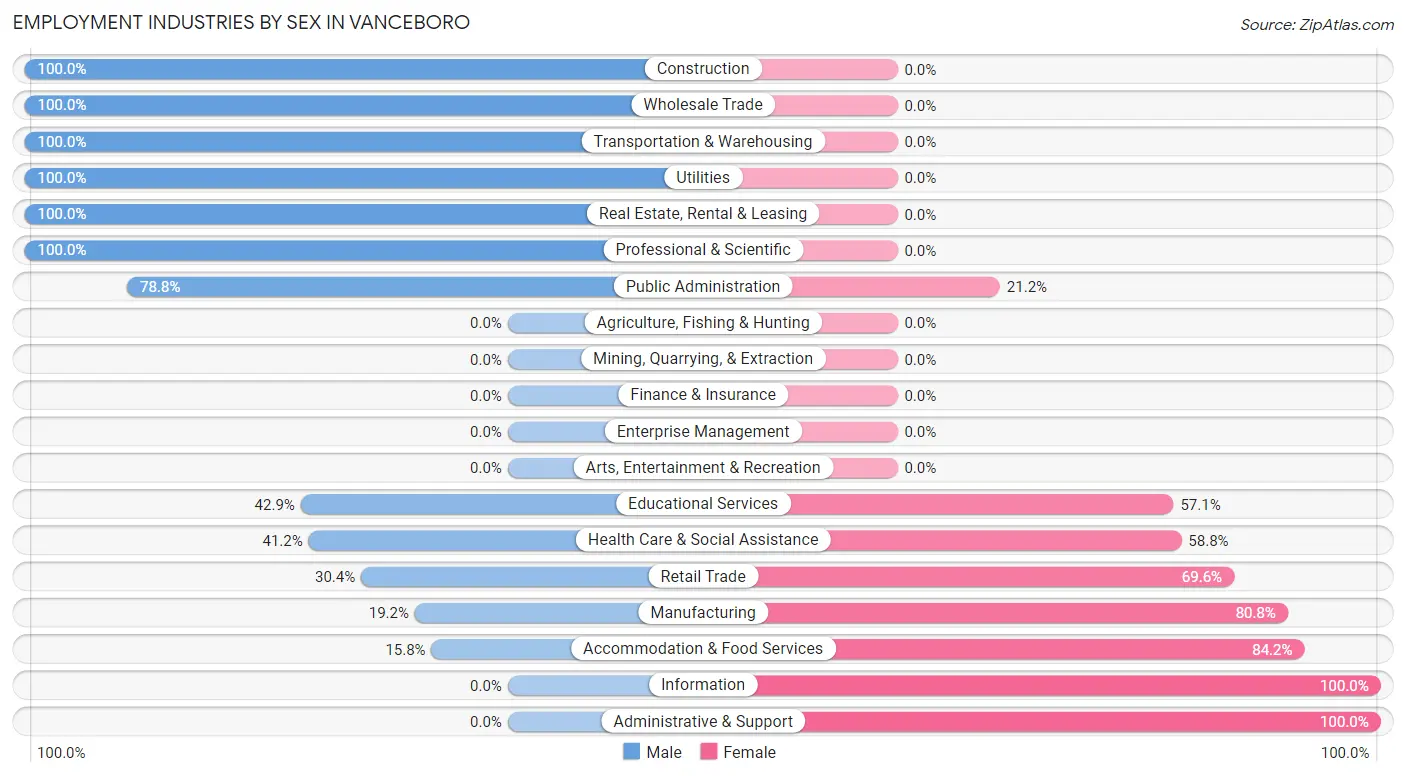
Employment Industries by Sex in Vanceboro
The Vanceboro industries that see more men than women are Construction (100.0%), Wholesale Trade (100.0%), and Transportation & Warehousing (100.0%), whereas the industries that tend to have a higher number of women are Information (100.0%), Administrative & Support (100.0%), and Accommodation & Food Services (84.2%).
| Industry | Male | Female |
| Agriculture, Fishing & Hunting | 0 (0.0%) | 0 (0.0%) |
| Mining, Quarrying, & Extraction | 0 (0.0%) | 0 (0.0%) |
| Construction | 9 (100.0%) | 0 (0.0%) |
| Manufacturing | 5 (19.2%) | 21 (80.8%) |
| Wholesale Trade | 4 (100.0%) | 0 (0.0%) |
| Retail Trade | 17 (30.4%) | 39 (69.6%) |
| Transportation & Warehousing | 3 (100.0%) | 0 (0.0%) |
| Utilities | 8 (100.0%) | 0 (0.0%) |
| Information | 0 (0.0%) | 11 (100.0%) |
| Finance & Insurance | 0 (0.0%) | 0 (0.0%) |
| Real Estate, Rental & Leasing | 2 (100.0%) | 0 (0.0%) |
| Professional & Scientific | 2 (100.0%) | 0 (0.0%) |
| Enterprise Management | 0 (0.0%) | 0 (0.0%) |
| Administrative & Support | 0 (0.0%) | 4 (100.0%) |
| Educational Services | 27 (42.9%) | 36 (57.1%) |
| Health Care & Social Assistance | 54 (41.2%) | 77 (58.8%) |
| Arts, Entertainment & Recreation | 0 (0.0%) | 0 (0.0%) |
| Accommodation & Food Services | 3 (15.8%) | 16 (84.2%) |
| Public Administration | 26 (78.8%) | 7 (21.2%) |
| Total | 174 (45.2%) | 211 (54.8%) |
Education in Vanceboro
School Enrollment in Vanceboro
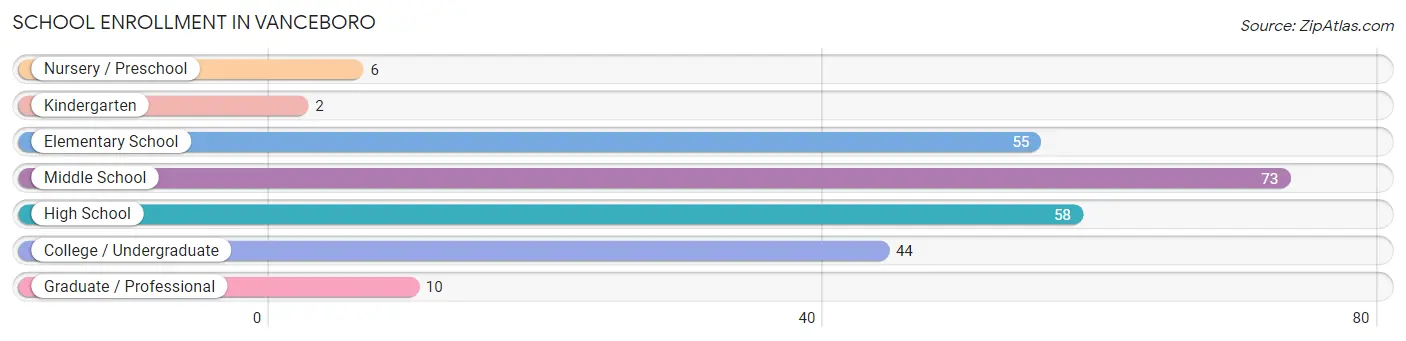
The most common levels of schooling among the 248 students in Vanceboro are middle school (73 | 29.4%), high school (58 | 23.4%), and elementary school (55 | 22.2%).
| School Level | # Students | % Students |
| Nursery / Preschool | 6 | 2.4% |
| Kindergarten | 2 | 0.8% |
| Elementary School | 55 | 22.2% |
| Middle School | 73 | 29.4% |
| High School | 58 | 23.4% |
| College / Undergraduate | 44 | 17.7% |
| Graduate / Professional | 10 | 4.0% |
| Total | 248 | 100.0% |
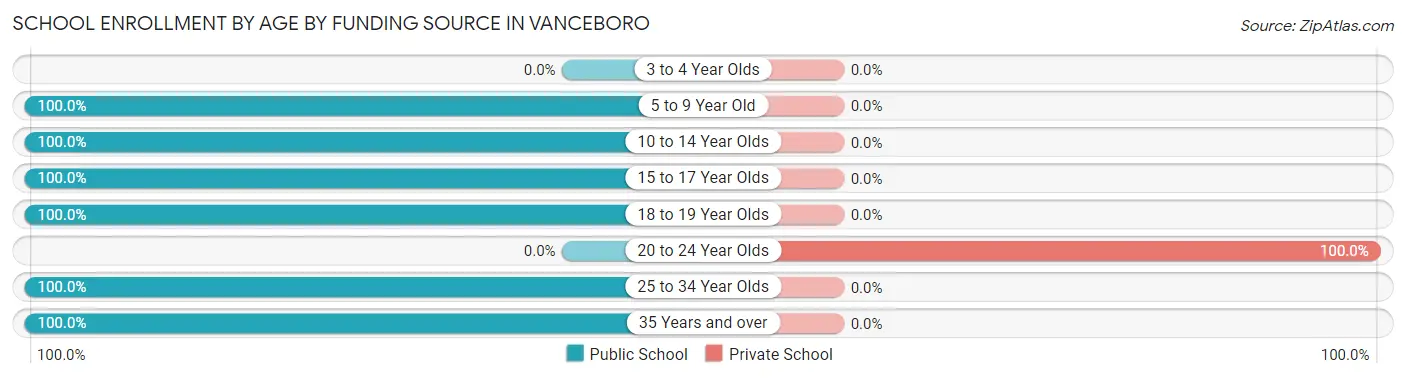
School Enrollment by Age by Funding Source in Vanceboro
Out of a total of 248 students who are enrolled in schools in Vanceboro, 2 (0.8%) attend a private institution, while the remaining 246 (99.2%) are enrolled in public schools. The age group of 20 to 24 year olds has the highest likelihood of being enrolled in private schools, with 2 (100.0% in the age bracket) enrolled. Conversely, the age group of 5 to 9 year old has the lowest likelihood of being enrolled in a private school, with 54 (100.0% in the age bracket) attending a public institution.
| Age Bracket | Public School | Private School |
| 3 to 4 Year Olds | 0 (0.0%) | 0 (0.0%) |
| 5 to 9 Year Old | 54 (100.0%) | 0 (0.0%) |
| 10 to 14 Year Olds | 98 (100.0%) | 0 (0.0%) |
| 15 to 17 Year Olds | 39 (100.0%) | 0 (0.0%) |
| 18 to 19 Year Olds | 19 (100.0%) | 0 (0.0%) |
| 20 to 24 Year Olds | 0 (0.0%) | 2 (100.0%) |
| 25 to 34 Year Olds | 30 (100.0%) | 0 (0.0%) |
| 35 Years and over | 6 (100.0%) | 0 (0.0%) |
| Total | 246 (99.2%) | 2 (0.8%) |
Educational Attainment by Field of Study in Vanceboro
Bio, nature & agricultural (25 | 35.7%), education (23 | 32.9%), literature & languages (8 | 11.4%), arts & humanities (6 | 8.6%), and business (4 | 5.7%) are the most common fields of study among 70 individuals in Vanceboro who have obtained a bachelor's degree or higher.
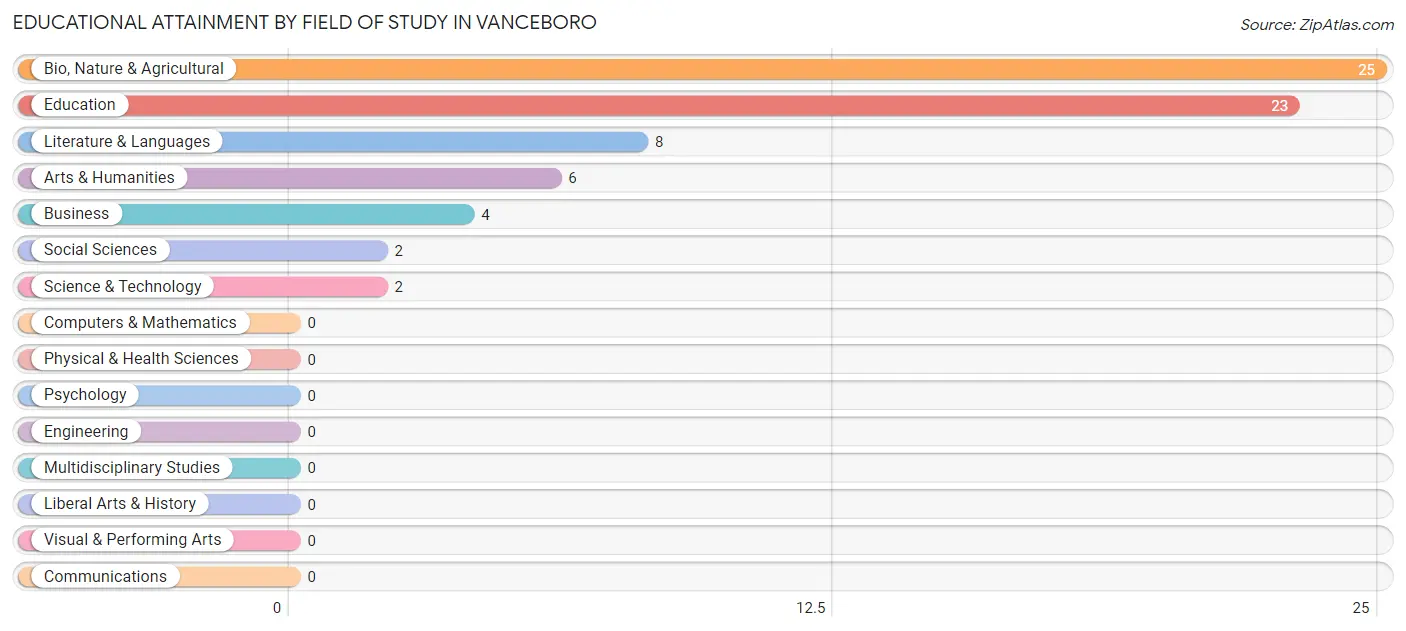
| Field of Study | # Graduates | % Graduates |
| Computers & Mathematics | 0 | 0.0% |
| Bio, Nature & Agricultural | 25 | 35.7% |
| Physical & Health Sciences | 0 | 0.0% |
| Psychology | 0 | 0.0% |
| Social Sciences | 2 | 2.9% |
| Engineering | 0 | 0.0% |
| Multidisciplinary Studies | 0 | 0.0% |
| Science & Technology | 2 | 2.9% |
| Business | 4 | 5.7% |
| Education | 23 | 32.9% |
| Literature & Languages | 8 | 11.4% |
| Liberal Arts & History | 0 | 0.0% |
| Visual & Performing Arts | 0 | 0.0% |
| Communications | 0 | 0.0% |
| Arts & Humanities | 6 | 8.6% |
| Total | 70 | 100.0% |
Transportation & Commute in Vanceboro
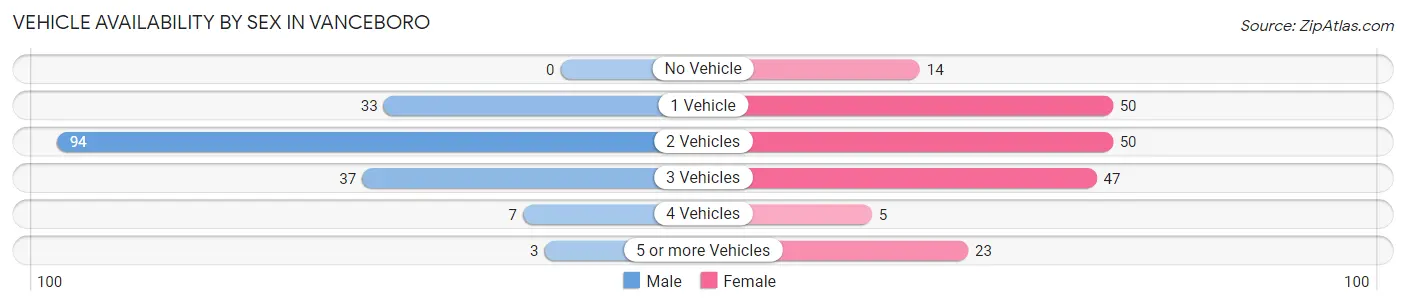
Vehicle Availability by Sex in Vanceboro
The most prevalent vehicle ownership categories in Vanceboro are males with 2 vehicles (94, accounting for 54.0%) and females with 2 vehicles (50, making up 49.7%).
| Vehicles Available | Male | Female |
| No Vehicle | 0 (0.0%) | 14 (7.4%) |
| 1 Vehicle | 33 (19.0%) | 50 (26.5%) |
| 2 Vehicles | 94 (54.0%) | 50 (26.5%) |
| 3 Vehicles | 37 (21.3%) | 47 (24.9%) |
| 4 Vehicles | 7 (4.0%) | 5 (2.6%) |
| 5 or more Vehicles | 3 (1.7%) | 23 (12.2%) |
| Total | 174 (100.0%) | 189 (100.0%) |
Commute Time in Vanceboro
The most frequently occuring commute durations in Vanceboro are 30 to 34 minutes (114 commuters, 31.5%), 20 to 24 minutes (54 commuters, 14.9%), and 25 to 29 minutes (49 commuters, 13.5%).
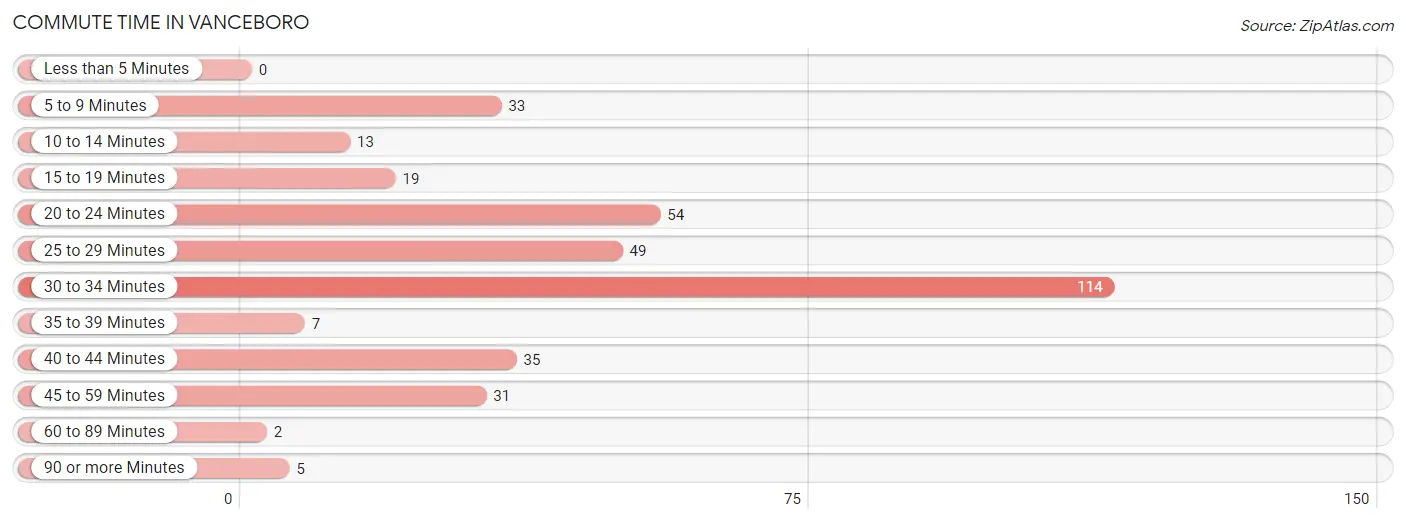
| Commute Time | # Commuters | % Commuters |
| Less than 5 Minutes | 0 | 0.0% |
| 5 to 9 Minutes | 33 | 9.1% |
| 10 to 14 Minutes | 13 | 3.6% |
| 15 to 19 Minutes | 19 | 5.2% |
| 20 to 24 Minutes | 54 | 14.9% |
| 25 to 29 Minutes | 49 | 13.5% |
| 30 to 34 Minutes | 114 | 31.5% |
| 35 to 39 Minutes | 7 | 1.9% |
| 40 to 44 Minutes | 35 | 9.7% |
| 45 to 59 Minutes | 31 | 8.6% |
| 60 to 89 Minutes | 2 | 0.5% |
| 90 or more Minutes | 5 | 1.4% |
Commute Time by Sex in Vanceboro
The most common commute times in Vanceboro are 30 to 34 minutes (84 commuters, 48.8%) for males and 20 to 24 minutes (42 commuters, 22.1%) for females.
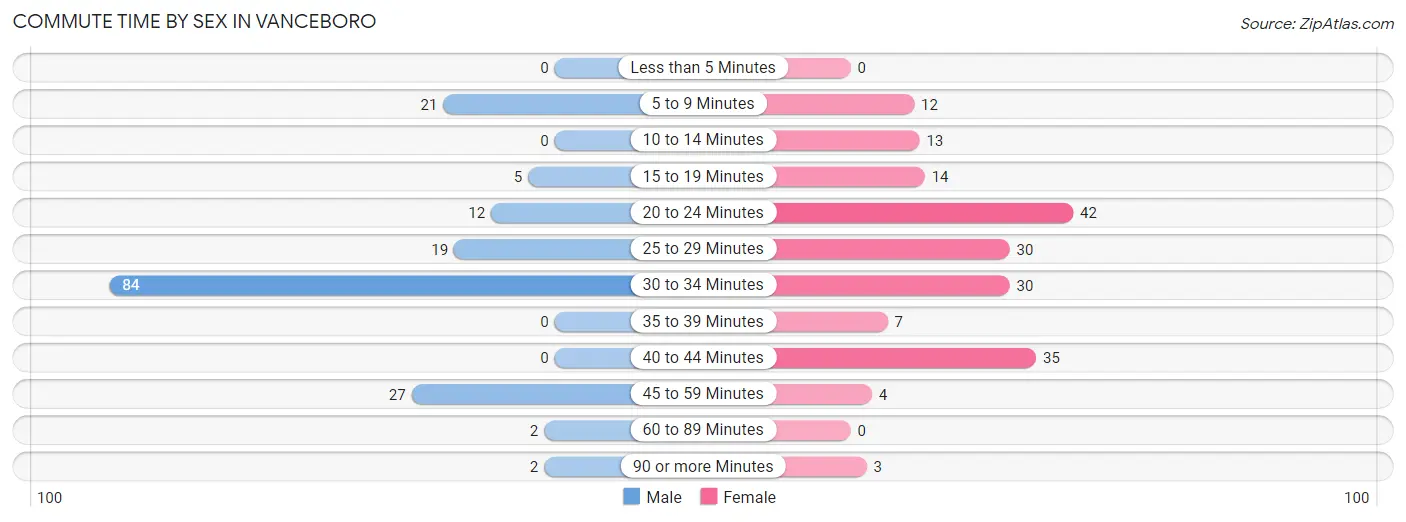
| Commute Time | Male | Female |
| Less than 5 Minutes | 0 (0.0%) | 0 (0.0%) |
| 5 to 9 Minutes | 21 (12.2%) | 12 (6.3%) |
| 10 to 14 Minutes | 0 (0.0%) | 13 (6.8%) |
| 15 to 19 Minutes | 5 (2.9%) | 14 (7.4%) |
| 20 to 24 Minutes | 12 (7.0%) | 42 (22.1%) |
| 25 to 29 Minutes | 19 (11.1%) | 30 (15.8%) |
| 30 to 34 Minutes | 84 (48.8%) | 30 (15.8%) |
| 35 to 39 Minutes | 0 (0.0%) | 7 (3.7%) |
| 40 to 44 Minutes | 0 (0.0%) | 35 (18.4%) |
| 45 to 59 Minutes | 27 (15.7%) | 4 (2.1%) |
| 60 to 89 Minutes | 2 (1.2%) | 0 (0.0%) |
| 90 or more Minutes | 2 (1.2%) | 3 (1.6%) |
Time of Departure to Work by Sex in Vanceboro
The most frequent times of departure to work in Vanceboro are 6:30 AM to 6:59 AM (50, 29.1%) for males and 6:30 AM to 6:59 AM (54, 28.4%) for females.
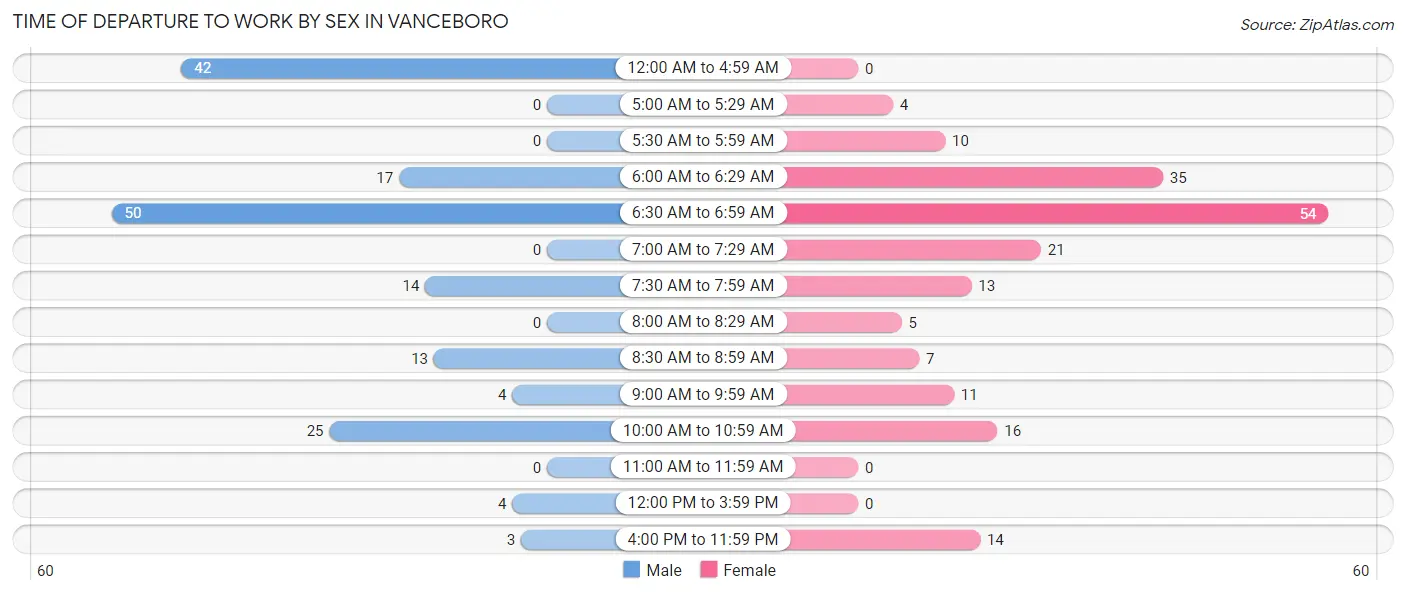
| Time of Departure | Male | Female |
| 12:00 AM to 4:59 AM | 42 (24.4%) | 0 (0.0%) |
| 5:00 AM to 5:29 AM | 0 (0.0%) | 4 (2.1%) |
| 5:30 AM to 5:59 AM | 0 (0.0%) | 10 (5.3%) |
| 6:00 AM to 6:29 AM | 17 (9.9%) | 35 (18.4%) |
| 6:30 AM to 6:59 AM | 50 (29.1%) | 54 (28.4%) |
| 7:00 AM to 7:29 AM | 0 (0.0%) | 21 (11.1%) |
| 7:30 AM to 7:59 AM | 14 (8.1%) | 13 (6.8%) |
| 8:00 AM to 8:29 AM | 0 (0.0%) | 5 (2.6%) |
| 8:30 AM to 8:59 AM | 13 (7.6%) | 7 (3.7%) |
| 9:00 AM to 9:59 AM | 4 (2.3%) | 11 (5.8%) |
| 10:00 AM to 10:59 AM | 25 (14.5%) | 16 (8.4%) |
| 11:00 AM to 11:59 AM | 0 (0.0%) | 0 (0.0%) |
| 12:00 PM to 3:59 PM | 4 (2.3%) | 0 (0.0%) |
| 4:00 PM to 11:59 PM | 3 (1.7%) | 14 (7.4%) |
| Total | 172 (100.0%) | 190 (100.0%) |
Housing Occupancy in Vanceboro
Occupancy by Ownership in Vanceboro
Of the total 406 dwellings in Vanceboro, owner-occupied units account for 201 (49.5%), while renter-occupied units make up 205 (50.5%).
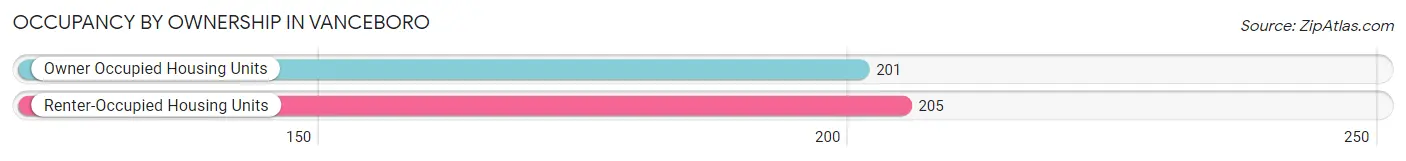
| Occupancy | # Housing Units | % Housing Units |
| Owner Occupied Housing Units | 201 | 49.5% |
| Renter-Occupied Housing Units | 205 | 50.5% |
| Total Occupied Housing Units | 406 | 100.0% |
Occupancy by Household Size in Vanceboro
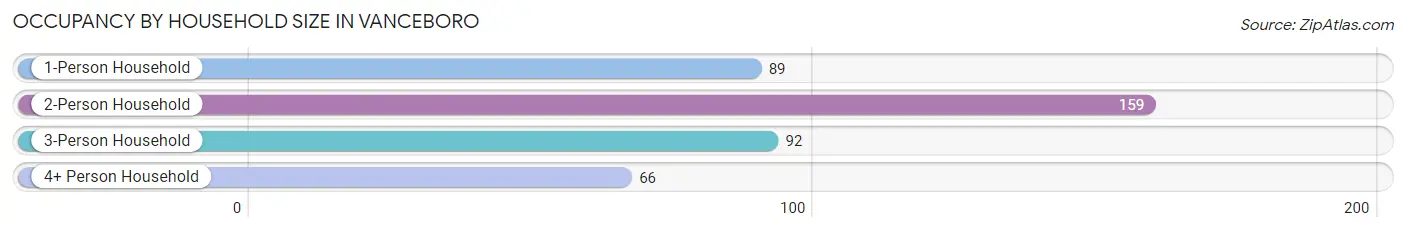
| Household Size | # Housing Units | % Housing Units |
| 1-Person Household | 89 | 21.9% |
| 2-Person Household | 159 | 39.2% |
| 3-Person Household | 92 | 22.7% |
| 4+ Person Household | 66 | 16.3% |
| Total Housing Units | 406 | 100.0% |
Occupancy by Ownership by Household Size in Vanceboro
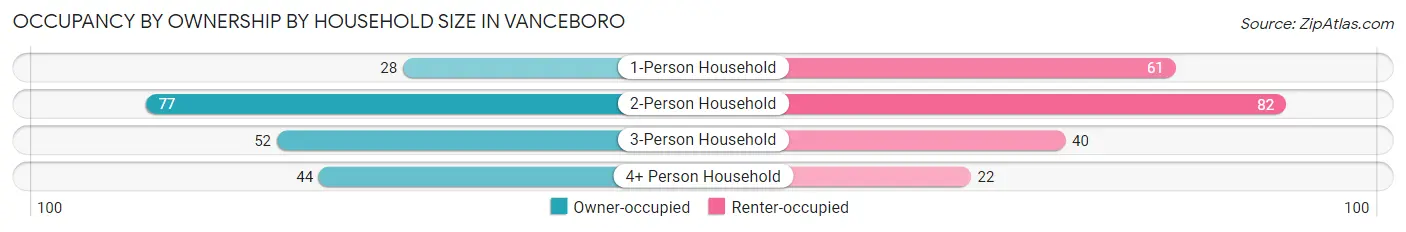
| Household Size | Owner-occupied | Renter-occupied |
| 1-Person Household | 28 (31.5%) | 61 (68.5%) |
| 2-Person Household | 77 (48.4%) | 82 (51.6%) |
| 3-Person Household | 52 (56.5%) | 40 (43.5%) |
| 4+ Person Household | 44 (66.7%) | 22 (33.3%) |
| Total Housing Units | 201 (49.5%) | 205 (50.5%) |
Occupancy by Educational Attainment in Vanceboro
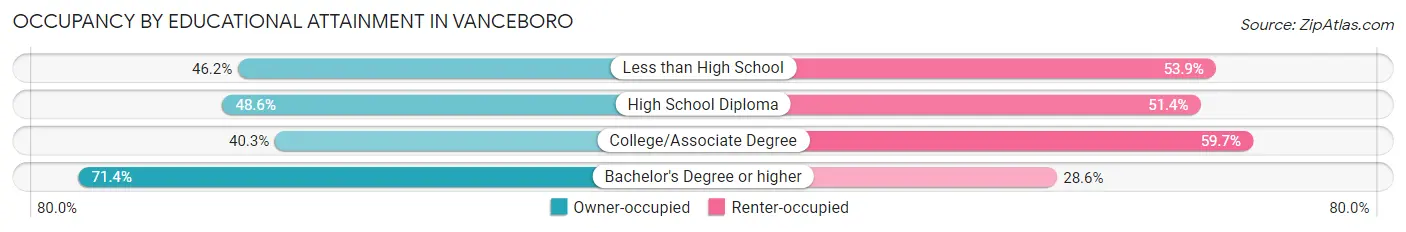
| Household Size | Owner-occupied | Renter-occupied |
| Less than High School | 36 (46.2%) | 42 (53.8%) |
| High School Diploma | 52 (48.6%) | 55 (51.4%) |
| College/Associate Degree | 58 (40.3%) | 86 (59.7%) |
| Bachelor's Degree or higher | 55 (71.4%) | 22 (28.6%) |
Occupancy by Age of Householder in Vanceboro
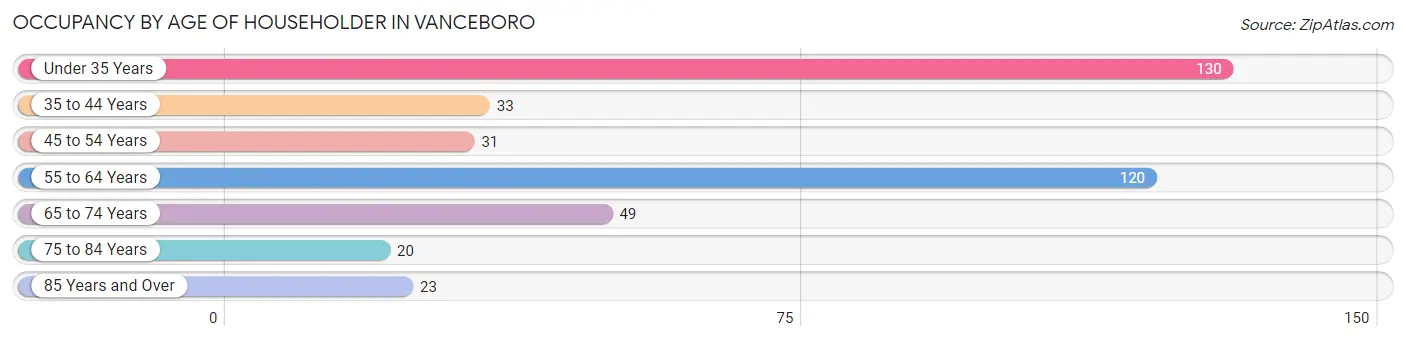
| Age Bracket | # Households | % Households |
| Under 35 Years | 130 | 32.0% |
| 35 to 44 Years | 33 | 8.1% |
| 45 to 54 Years | 31 | 7.6% |
| 55 to 64 Years | 120 | 29.6% |
| 65 to 74 Years | 49 | 12.1% |
| 75 to 84 Years | 20 | 4.9% |
| 85 Years and Over | 23 | 5.7% |
| Total | 406 | 100.0% |
Housing Finances in Vanceboro
Median Income by Occupancy in Vanceboro
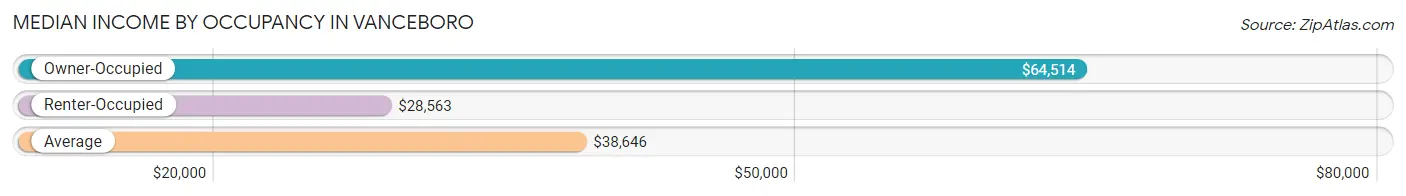
| Occupancy Type | # Households | Median Income |
| Owner-Occupied | 201 (49.5%) | $64,514 |
| Renter-Occupied | 205 (50.5%) | $28,563 |
| Average | 406 (100.0%) | $38,646 |
Occupancy by Householder Income Bracket in Vanceboro
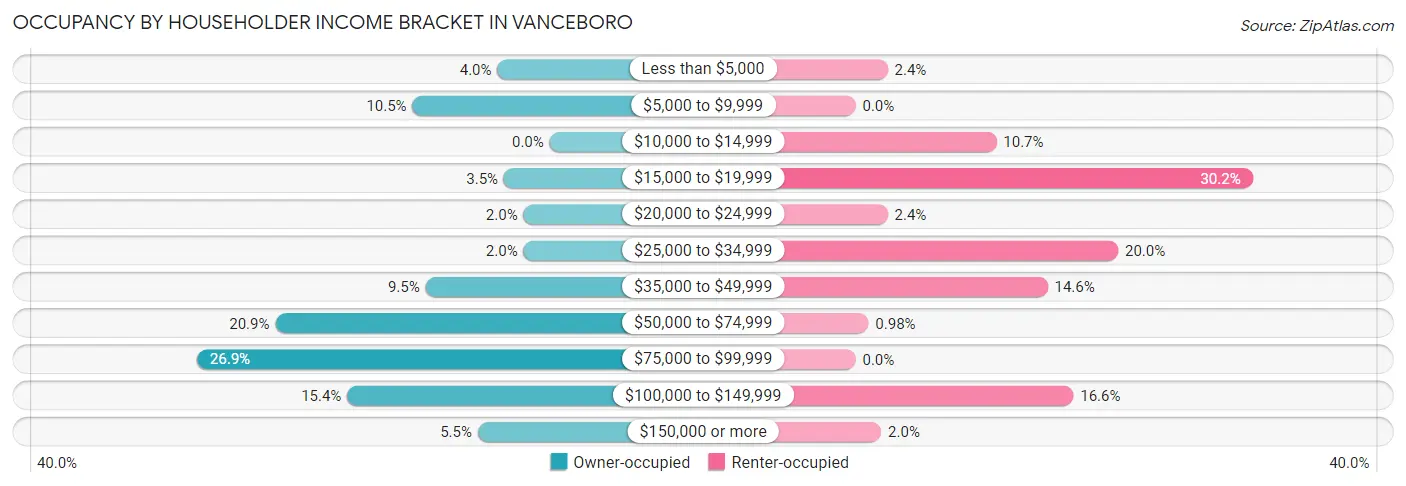
| Income Bracket | Owner-occupied | Renter-occupied |
| Less than $5,000 | 8 (4.0%) | 5 (2.4%) |
| $5,000 to $9,999 | 21 (10.4%) | 0 (0.0%) |
| $10,000 to $14,999 | 0 (0.0%) | 22 (10.7%) |
| $15,000 to $19,999 | 7 (3.5%) | 62 (30.2%) |
| $20,000 to $24,999 | 4 (2.0%) | 5 (2.4%) |
| $25,000 to $34,999 | 4 (2.0%) | 41 (20.0%) |
| $35,000 to $49,999 | 19 (9.5%) | 30 (14.6%) |
| $50,000 to $74,999 | 42 (20.9%) | 2 (1.0%) |
| $75,000 to $99,999 | 54 (26.9%) | 0 (0.0%) |
| $100,000 to $149,999 | 31 (15.4%) | 34 (16.6%) |
| $150,000 or more | 11 (5.5%) | 4 (1.9%) |
| Total | 201 (100.0%) | 205 (100.0%) |
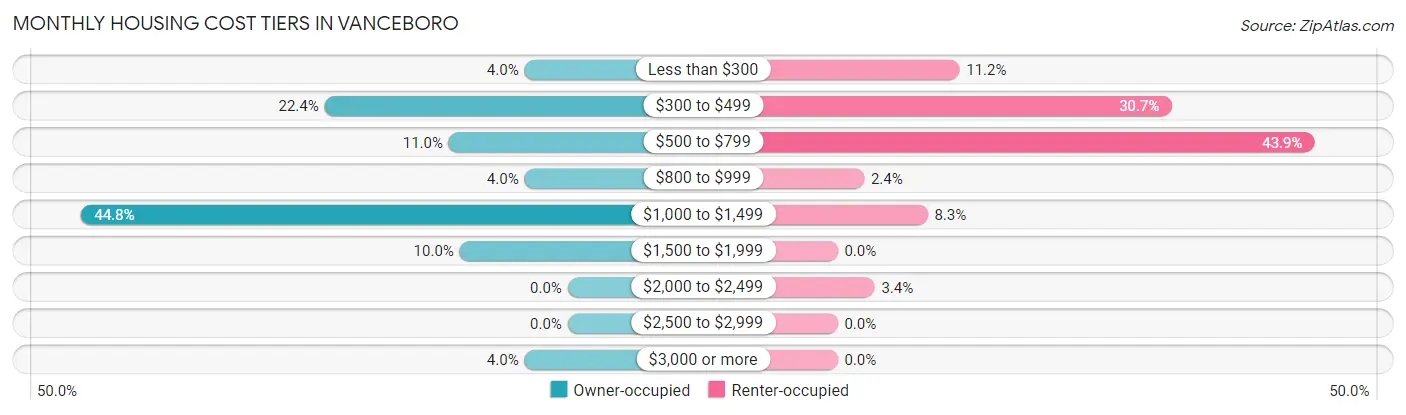
Monthly Housing Cost Tiers in Vanceboro
| Monthly Cost | Owner-occupied | Renter-occupied |
| Less than $300 | 8 (4.0%) | 23 (11.2%) |
| $300 to $499 | 45 (22.4%) | 63 (30.7%) |
| $500 to $799 | 22 (11.0%) | 90 (43.9%) |
| $800 to $999 | 8 (4.0%) | 5 (2.4%) |
| $1,000 to $1,499 | 90 (44.8%) | 17 (8.3%) |
| $1,500 to $1,999 | 20 (10.0%) | 0 (0.0%) |
| $2,000 to $2,499 | 0 (0.0%) | 7 (3.4%) |
| $2,500 to $2,999 | 0 (0.0%) | 0 (0.0%) |
| $3,000 or more | 8 (4.0%) | 0 (0.0%) |
| Total | 201 (100.0%) | 205 (100.0%) |
Physical Housing Characteristics in Vanceboro
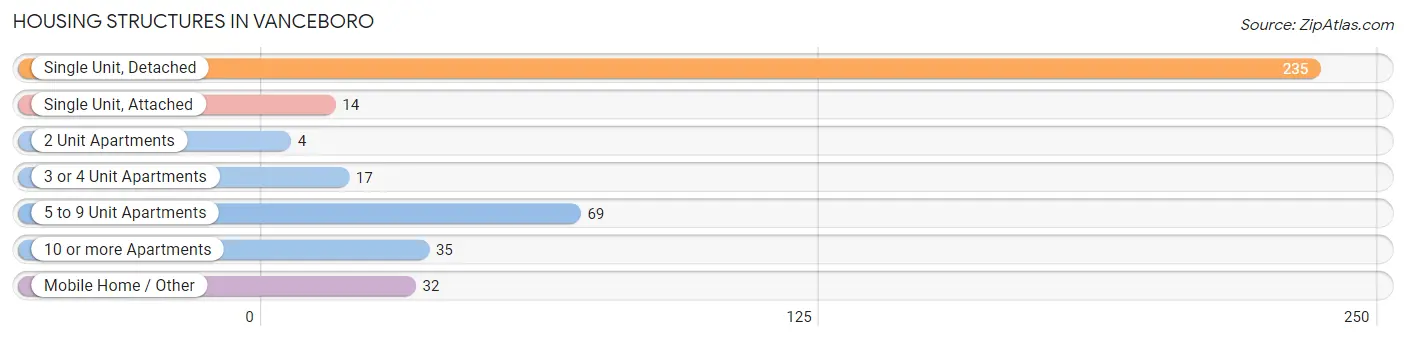
Housing Structures in Vanceboro
| Structure Type | # Housing Units | % Housing Units |
| Single Unit, Detached | 235 | 57.9% |
| Single Unit, Attached | 14 | 3.5% |
| 2 Unit Apartments | 4 | 1.0% |
| 3 or 4 Unit Apartments | 17 | 4.2% |
| 5 to 9 Unit Apartments | 69 | 17.0% |
| 10 or more Apartments | 35 | 8.6% |
| Mobile Home / Other | 32 | 7.9% |
| Total | 406 | 100.0% |
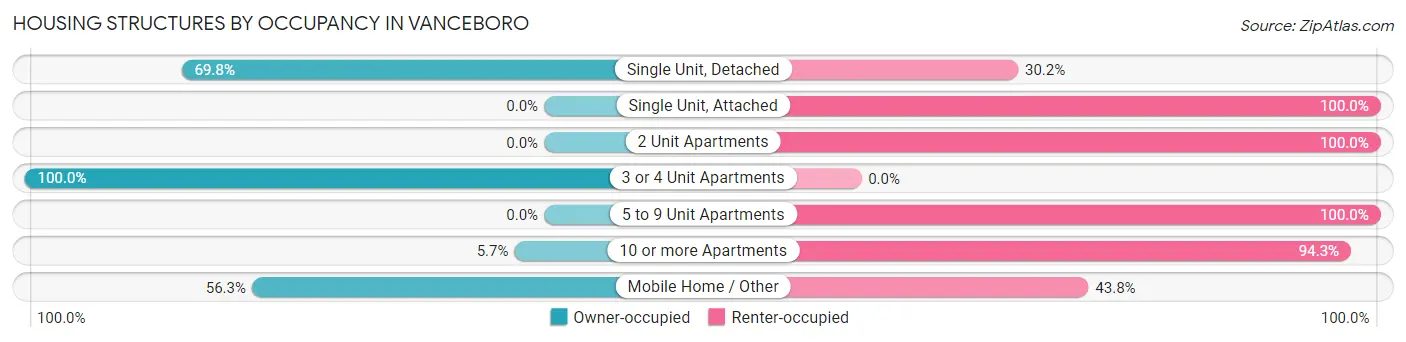
Housing Structures by Occupancy in Vanceboro
| Structure Type | Owner-occupied | Renter-occupied |
| Single Unit, Detached | 164 (69.8%) | 71 (30.2%) |
| Single Unit, Attached | 0 (0.0%) | 14 (100.0%) |
| 2 Unit Apartments | 0 (0.0%) | 4 (100.0%) |
| 3 or 4 Unit Apartments | 17 (100.0%) | 0 (0.0%) |
| 5 to 9 Unit Apartments | 0 (0.0%) | 69 (100.0%) |
| 10 or more Apartments | 2 (5.7%) | 33 (94.3%) |
| Mobile Home / Other | 18 (56.2%) | 14 (43.8%) |
| Total | 201 (49.5%) | 205 (50.5%) |
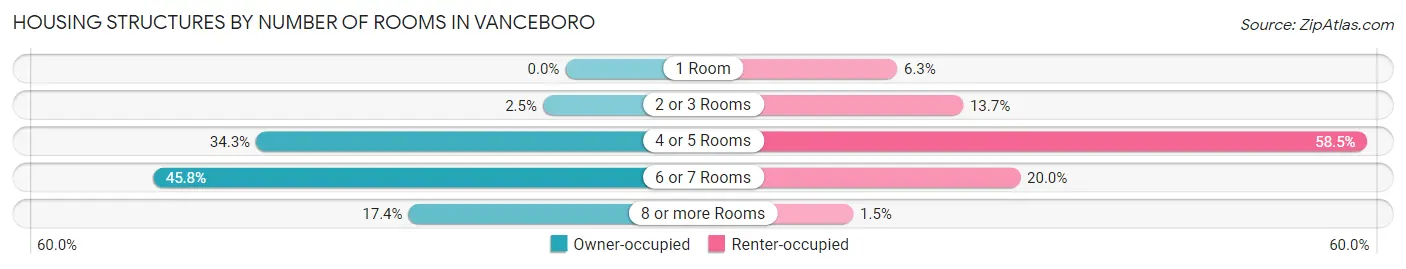
Housing Structures by Number of Rooms in Vanceboro
| Number of Rooms | Owner-occupied | Renter-occupied |
| 1 Room | 0 (0.0%) | 13 (6.3%) |
| 2 or 3 Rooms | 5 (2.5%) | 28 (13.7%) |
| 4 or 5 Rooms | 69 (34.3%) | 120 (58.5%) |
| 6 or 7 Rooms | 92 (45.8%) | 41 (20.0%) |
| 8 or more Rooms | 35 (17.4%) | 3 (1.5%) |
| Total | 201 (100.0%) | 205 (100.0%) |
Housing Structure by Heating Type in Vanceboro
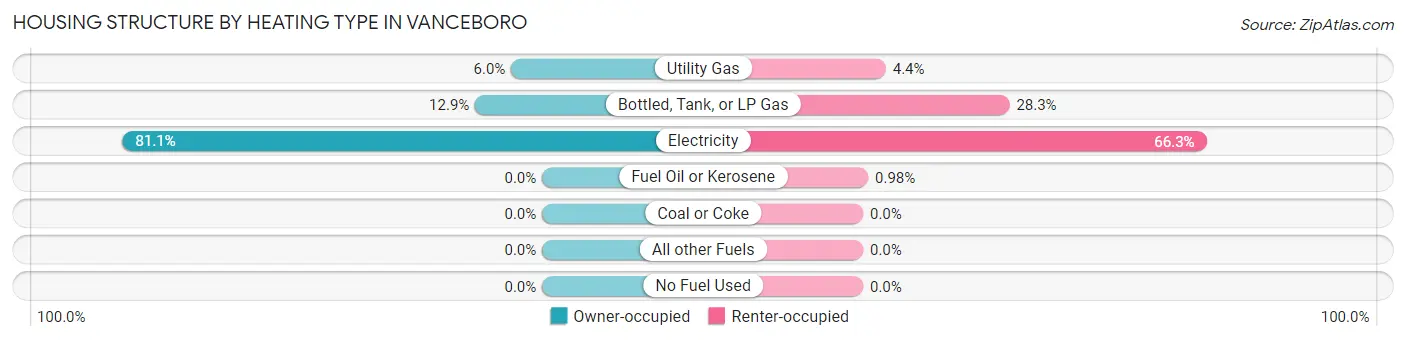
| Heating Type | Owner-occupied | Renter-occupied |
| Utility Gas | 12 (6.0%) | 9 (4.4%) |
| Bottled, Tank, or LP Gas | 26 (12.9%) | 58 (28.3%) |
| Electricity | 163 (81.1%) | 136 (66.3%) |
| Fuel Oil or Kerosene | 0 (0.0%) | 2 (1.0%) |
| Coal or Coke | 0 (0.0%) | 0 (0.0%) |
| All other Fuels | 0 (0.0%) | 0 (0.0%) |
| No Fuel Used | 0 (0.0%) | 0 (0.0%) |
| Total | 201 (100.0%) | 205 (100.0%) |
Household Vehicle Usage in Vanceboro
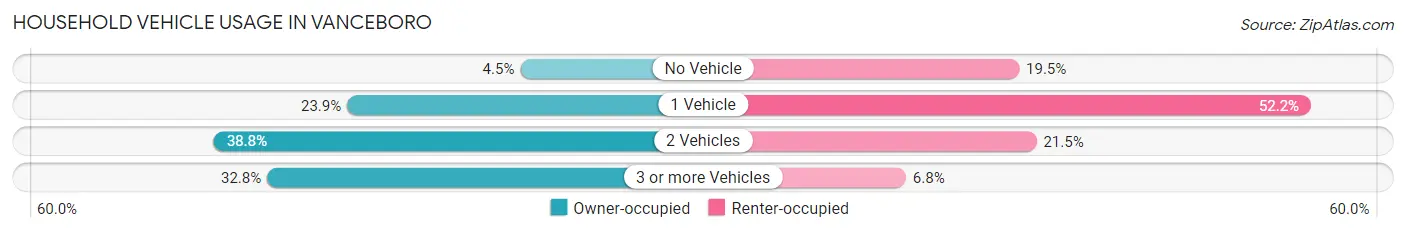
| Vehicles per Household | Owner-occupied | Renter-occupied |
| No Vehicle | 9 (4.5%) | 40 (19.5%) |
| 1 Vehicle | 48 (23.9%) | 107 (52.2%) |
| 2 Vehicles | 78 (38.8%) | 44 (21.5%) |
| 3 or more Vehicles | 66 (32.8%) | 14 (6.8%) |
| Total | 201 (100.0%) | 205 (100.0%) |
Real Estate & Mortgages in Vanceboro
Real Estate and Mortgage Overview in Vanceboro
| Characteristic | Without Mortgage | With Mortgage |
| Housing Units | 78 | 123 |
| Median Property Value | $112,100 | $152,600 |
| Median Household Income | $85,800 | $11 |
| Monthly Housing Costs | $465 | $8 |
| Real Estate Taxes | $990 | $2 |
Property Value by Mortgage Status in Vanceboro
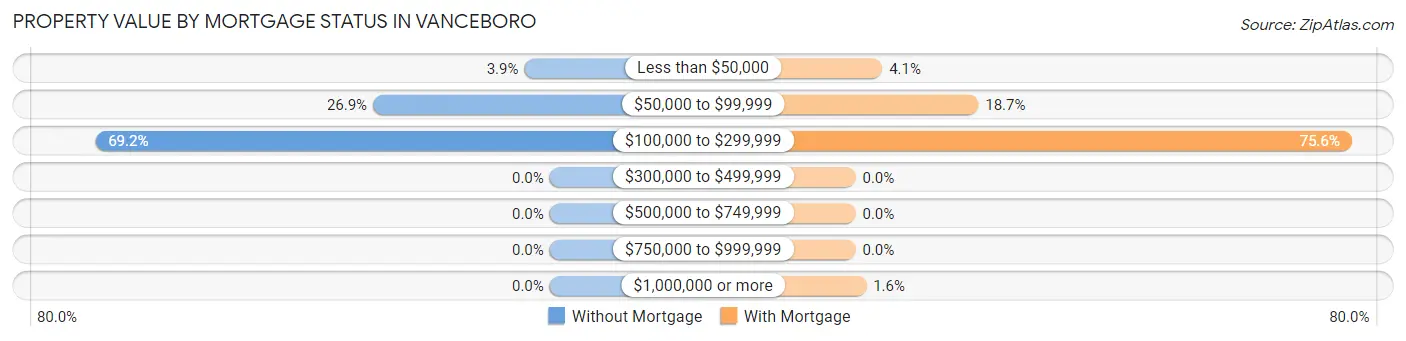
| Property Value | Without Mortgage | With Mortgage |
| Less than $50,000 | 3 (3.8%) | 5 (4.1%) |
| $50,000 to $99,999 | 21 (26.9%) | 23 (18.7%) |
| $100,000 to $299,999 | 54 (69.2%) | 93 (75.6%) |
| $300,000 to $499,999 | 0 (0.0%) | 0 (0.0%) |
| $500,000 to $749,999 | 0 (0.0%) | 0 (0.0%) |
| $750,000 to $999,999 | 0 (0.0%) | 0 (0.0%) |
| $1,000,000 or more | 0 (0.0%) | 2 (1.6%) |
| Total | 78 (100.0%) | 123 (100.0%) |
Household Income by Mortgage Status in Vanceboro
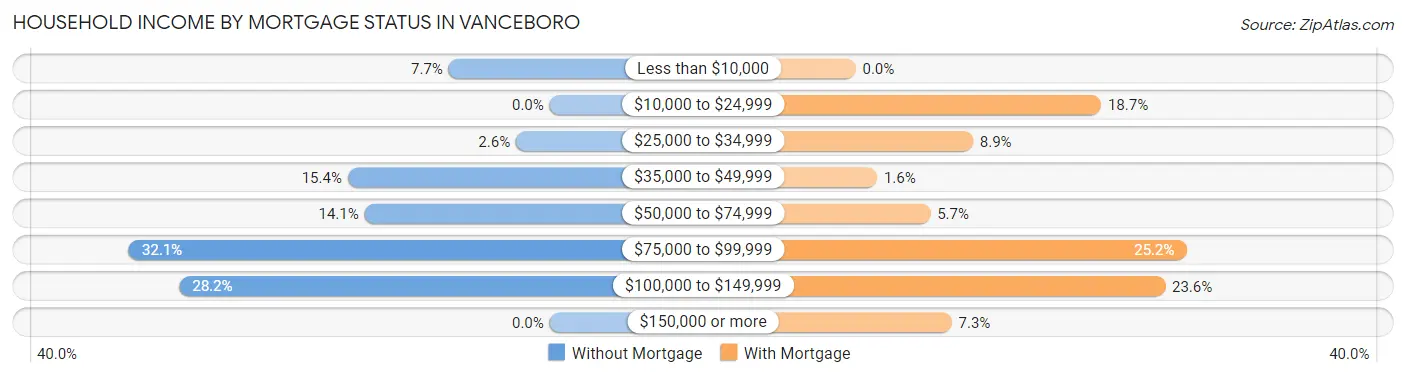
| Household Income | Without Mortgage | With Mortgage |
| Less than $10,000 | 6 (7.7%) | 0 (0.0%) |
| $10,000 to $24,999 | 0 (0.0%) | 23 (18.7%) |
| $25,000 to $34,999 | 2 (2.6%) | 11 (8.9%) |
| $35,000 to $49,999 | 12 (15.4%) | 2 (1.6%) |
| $50,000 to $74,999 | 11 (14.1%) | 7 (5.7%) |
| $75,000 to $99,999 | 25 (32.1%) | 31 (25.2%) |
| $100,000 to $149,999 | 22 (28.2%) | 29 (23.6%) |
| $150,000 or more | 0 (0.0%) | 9 (7.3%) |
| Total | 78 (100.0%) | 123 (100.0%) |
Property Value to Household Income Ratio in Vanceboro
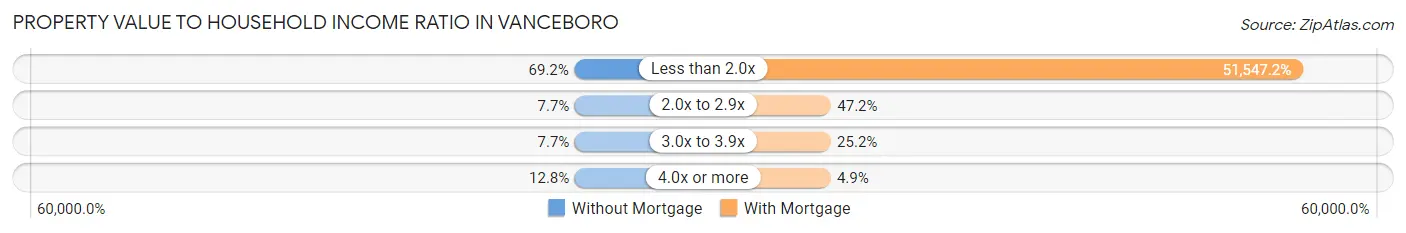
| Value-to-Income Ratio | Without Mortgage | With Mortgage |
| Less than 2.0x | 54 (69.2%) | 63,403 (51,547.1%) |
| 2.0x to 2.9x | 6 (7.7%) | 58 (47.1%) |
| 3.0x to 3.9x | 6 (7.7%) | 31 (25.2%) |
| 4.0x or more | 10 (12.8%) | 6 (4.9%) |
| Total | 78 (100.0%) | 123 (100.0%) |
Real Estate Taxes by Mortgage Status in Vanceboro
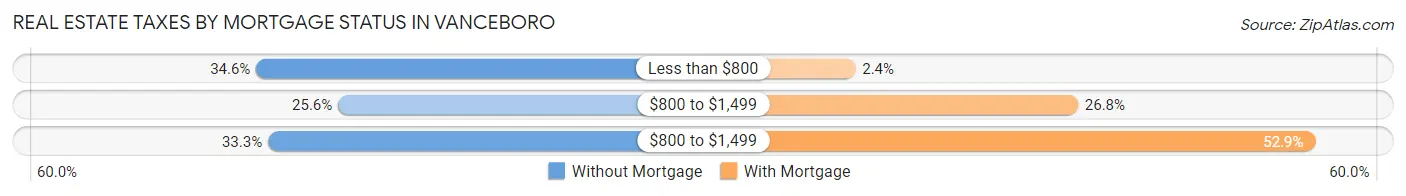
| Property Taxes | Without Mortgage | With Mortgage |
| Less than $800 | 27 (34.6%) | 3 (2.4%) |
| $800 to $1,499 | 20 (25.6%) | 33 (26.8%) |
| $800 to $1,499 | 26 (33.3%) | 65 (52.8%) |
| Total | 78 (100.0%) | 123 (100.0%) |
Health & Disability in Vanceboro
Health Insurance Coverage by Age in Vanceboro
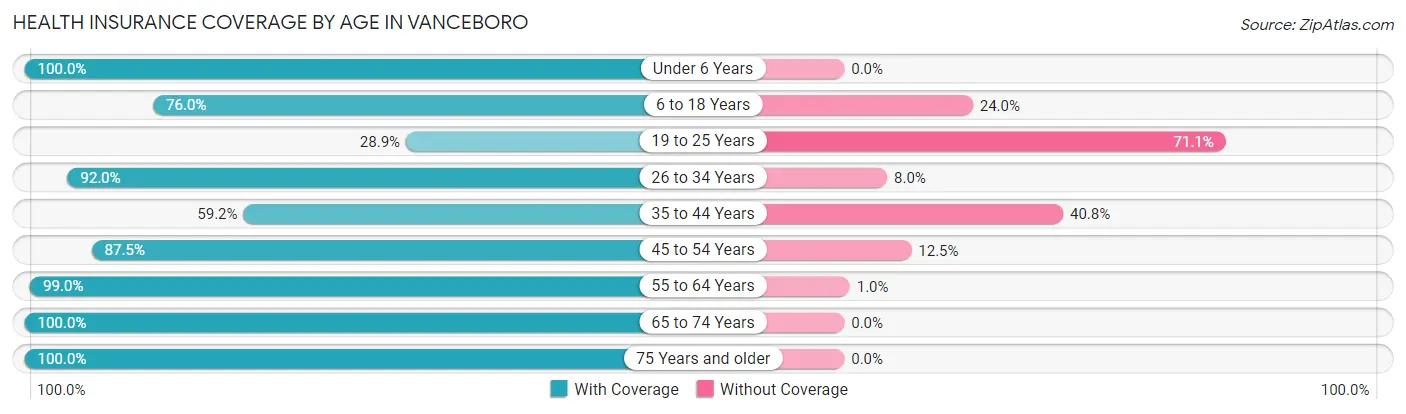
| Age Bracket | With Coverage | Without Coverage |
| Under 6 Years | 17 (100.0%) | 0 (0.0%) |
| 6 to 18 Years | 165 (76.0%) | 52 (24.0%) |
| 19 to 25 Years | 13 (28.9%) | 32 (71.1%) |
| 26 to 34 Years | 150 (92.0%) | 13 (8.0%) |
| 35 to 44 Years | 45 (59.2%) | 31 (40.8%) |
| 45 to 54 Years | 49 (87.5%) | 7 (12.5%) |
| 55 to 64 Years | 194 (99.0%) | 2 (1.0%) |
| 65 to 74 Years | 63 (100.0%) | 0 (0.0%) |
| 75 Years and older | 125 (100.0%) | 0 (0.0%) |
| Total | 821 (85.7%) | 137 (14.3%) |
Health Insurance Coverage by Citizenship Status in Vanceboro
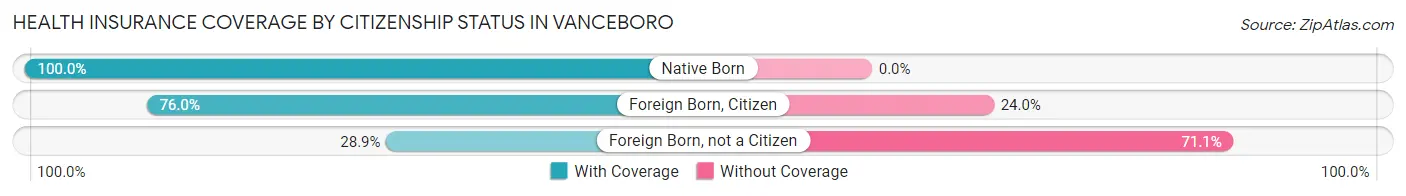
| Citizenship Status | With Coverage | Without Coverage |
| Native Born | 17 (100.0%) | 0 (0.0%) |
| Foreign Born, Citizen | 165 (76.0%) | 52 (24.0%) |
| Foreign Born, not a Citizen | 13 (28.9%) | 32 (71.1%) |
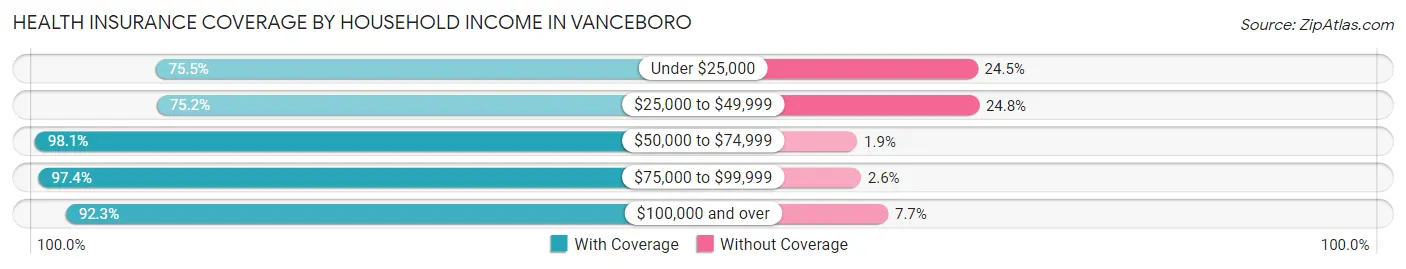
Health Insurance Coverage by Household Income in Vanceboro
| Household Income | With Coverage | Without Coverage |
| Under $25,000 | 197 (75.5%) | 64 (24.5%) |
| $25,000 to $49,999 | 155 (75.2%) | 51 (24.8%) |
| $50,000 to $74,999 | 101 (98.1%) | 2 (1.9%) |
| $75,000 to $99,999 | 185 (97.4%) | 5 (2.6%) |
| $100,000 and over | 179 (92.3%) | 15 (7.7%) |
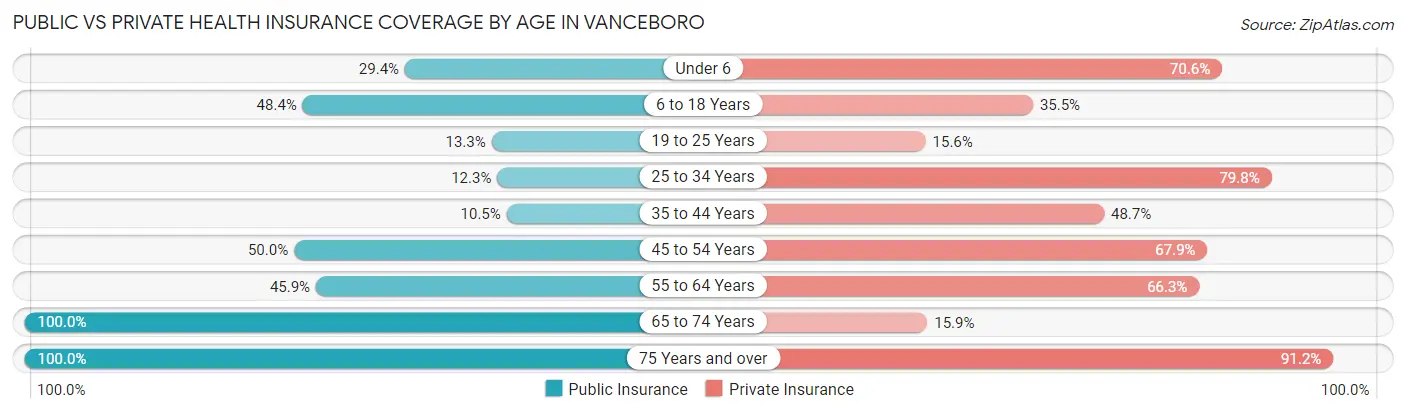
Public vs Private Health Insurance Coverage by Age in Vanceboro
| Age Bracket | Public Insurance | Private Insurance |
| Under 6 | 5 (29.4%) | 12 (70.6%) |
| 6 to 18 Years | 105 (48.4%) | 77 (35.5%) |
| 19 to 25 Years | 6 (13.3%) | 7 (15.6%) |
| 25 to 34 Years | 20 (12.3%) | 130 (79.7%) |
| 35 to 44 Years | 8 (10.5%) | 37 (48.7%) |
| 45 to 54 Years | 28 (50.0%) | 38 (67.9%) |
| 55 to 64 Years | 90 (45.9%) | 130 (66.3%) |
| 65 to 74 Years | 63 (100.0%) | 10 (15.9%) |
| 75 Years and over | 125 (100.0%) | 114 (91.2%) |
| Total | 450 (47.0%) | 555 (57.9%) |
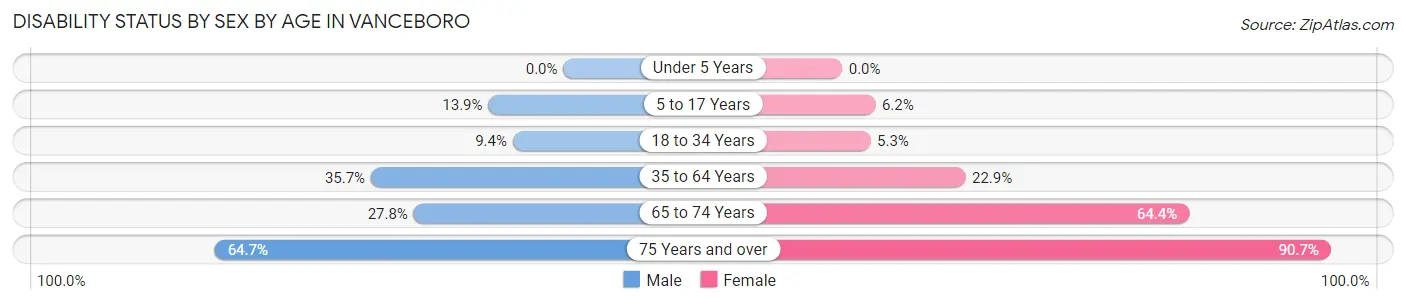
Disability Status by Sex by Age in Vanceboro
| Age Bracket | Male | Female |
| Under 5 Years | 0 (0.0%) | 0 (0.0%) |
| 5 to 17 Years | 11 (13.9%) | 8 (6.1%) |
| 18 to 34 Years | 12 (9.4%) | 5 (5.3%) |
| 35 to 64 Years | 50 (35.7%) | 43 (22.9%) |
| 65 to 74 Years | 5 (27.8%) | 29 (64.4%) |
| 75 Years and over | 11 (64.7%) | 98 (90.7%) |
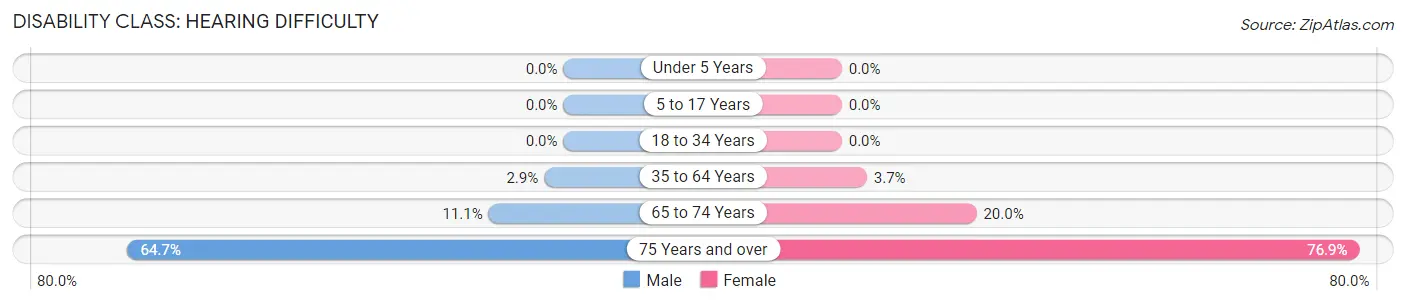
Disability Class by Sex by Age in Vanceboro
Disability Class: Hearing Difficulty
| Age Bracket | Male | Female |
| Under 5 Years | 0 (0.0%) | 0 (0.0%) |
| 5 to 17 Years | 0 (0.0%) | 0 (0.0%) |
| 18 to 34 Years | 0 (0.0%) | 0 (0.0%) |
| 35 to 64 Years | 4 (2.9%) | 7 (3.7%) |
| 65 to 74 Years | 2 (11.1%) | 9 (20.0%) |
| 75 Years and over | 11 (64.7%) | 83 (76.8%) |
Disability Class: Vision Difficulty
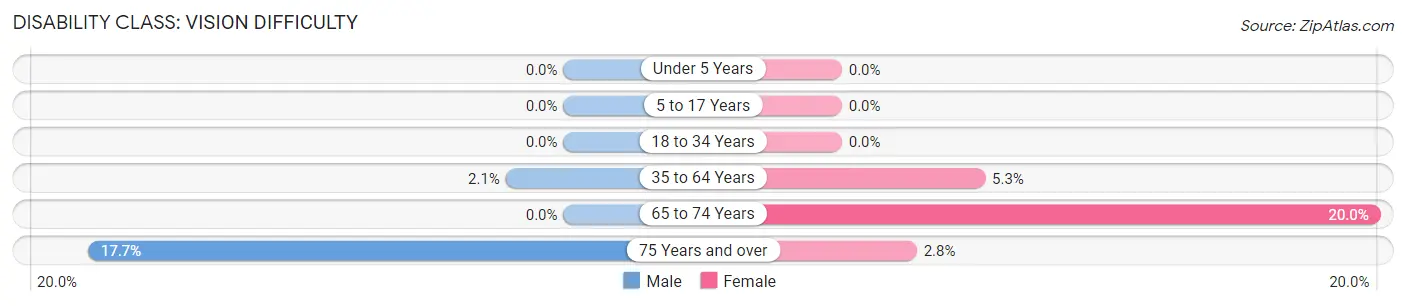
| Age Bracket | Male | Female |
| Under 5 Years | 0 (0.0%) | 0 (0.0%) |
| 5 to 17 Years | 0 (0.0%) | 0 (0.0%) |
| 18 to 34 Years | 0 (0.0%) | 0 (0.0%) |
| 35 to 64 Years | 3 (2.1%) | 10 (5.3%) |
| 65 to 74 Years | 0 (0.0%) | 9 (20.0%) |
| 75 Years and over | 3 (17.6%) | 3 (2.8%) |
Disability Class: Cognitive Difficulty
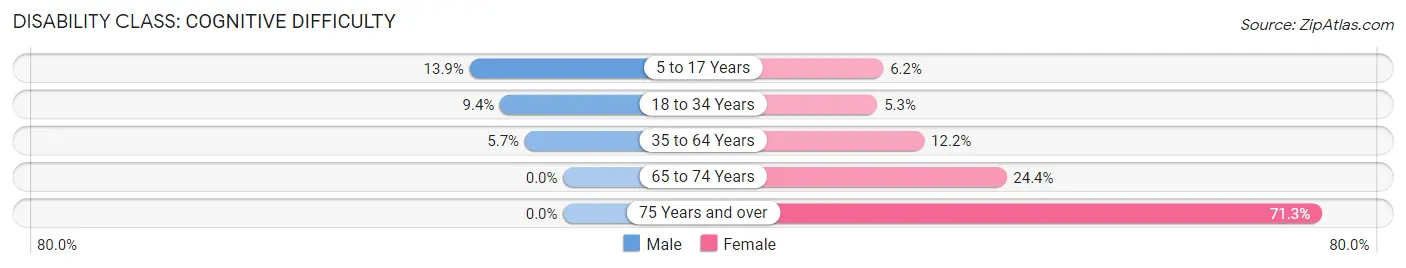
| Age Bracket | Male | Female |
| 5 to 17 Years | 11 (13.9%) | 8 (6.1%) |
| 18 to 34 Years | 12 (9.4%) | 5 (5.3%) |
| 35 to 64 Years | 8 (5.7%) | 23 (12.2%) |
| 65 to 74 Years | 0 (0.0%) | 11 (24.4%) |
| 75 Years and over | 0 (0.0%) | 77 (71.3%) |
Disability Class: Ambulatory Difficulty
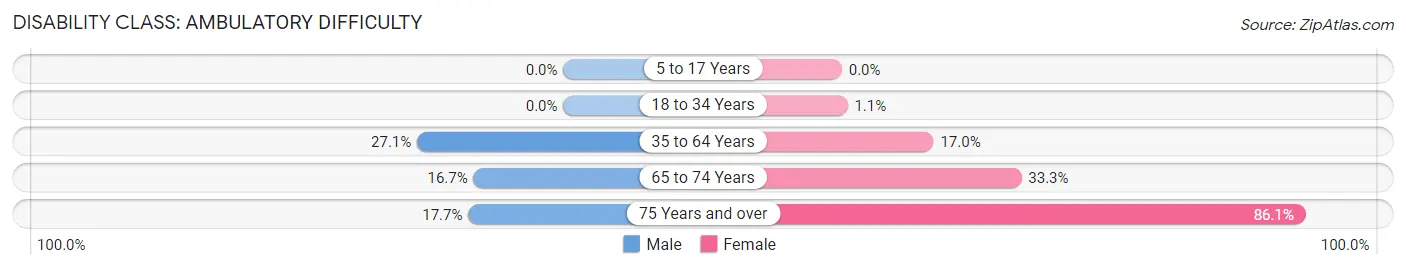
| Age Bracket | Male | Female |
| 5 to 17 Years | 0 (0.0%) | 0 (0.0%) |
| 18 to 34 Years | 0 (0.0%) | 1 (1.1%) |
| 35 to 64 Years | 38 (27.1%) | 32 (17.0%) |
| 65 to 74 Years | 3 (16.7%) | 15 (33.3%) |
| 75 Years and over | 3 (17.6%) | 93 (86.1%) |
Disability Class: Self-Care Difficulty
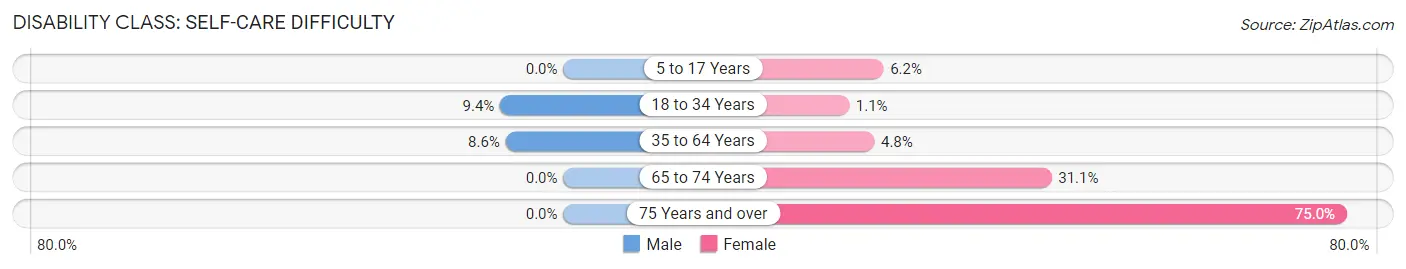
| Age Bracket | Male | Female |
| 5 to 17 Years | 0 (0.0%) | 8 (6.1%) |
| 18 to 34 Years | 12 (9.4%) | 1 (1.1%) |
| 35 to 64 Years | 12 (8.6%) | 9 (4.8%) |
| 65 to 74 Years | 0 (0.0%) | 14 (31.1%) |
| 75 Years and over | 0 (0.0%) | 81 (75.0%) |
Technology Access in Vanceboro
Computing Device Access in Vanceboro
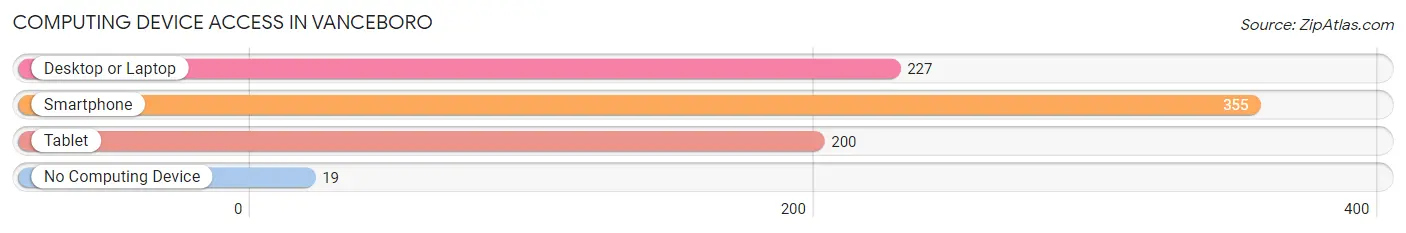
| Device Type | # Households | % Households |
| Desktop or Laptop | 227 | 55.9% |
| Smartphone | 355 | 87.4% |
| Tablet | 200 | 49.3% |
| No Computing Device | 19 | 4.7% |
| Total | 406 | 100.0% |
Internet Access in Vanceboro
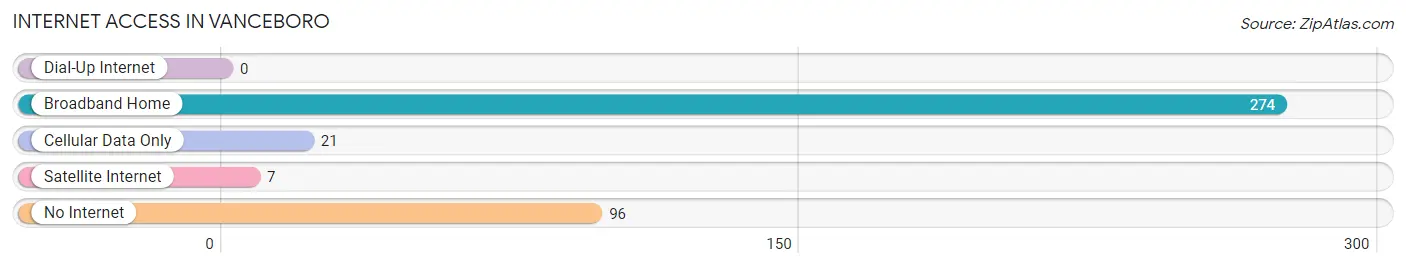
| Internet Type | # Households | % Households |
| Dial-Up Internet | 0 | 0.0% |
| Broadband Home | 274 | 67.5% |
| Cellular Data Only | 21 | 5.2% |
| Satellite Internet | 7 | 1.7% |
| No Internet | 96 | 23.6% |
| Total | 406 | 100.0% |
Vanceboro Summary
Vanceboro is a small town located in Craven County, North Carolina. It is situated on the banks of the Trent River, approximately 20 miles east of New Bern. The town was founded in 1891 and named after Zebulon B. Vance, a former governor of North Carolina. Vanceboro is a rural community with a population of 1,845 as of the 2010 census.
Geography
Vanceboro is located in the Coastal Plain region of North Carolina. The town is situated on the banks of the Trent River, which flows through the center of town. The town is surrounded by farmland and is located approximately 20 miles east of New Bern. The town is located at an elevation of 28 feet above sea level.
Climate
Vanceboro has a humid subtropical climate, with hot, humid summers and mild winters. The average annual temperature is around 68°F, with an average high of 86°F in the summer and an average low of 48°F in the winter. The average annual precipitation is around 48 inches, with the majority of the rain falling in the summer months.
Demographics
As of the 2010 census, Vanceboro had a population of 1,845. The racial makeup of the town was 79.2% White, 17.3% African American, 0.3% Native American, 0.7% Asian, 0.1% Pacific Islander, 1.2% from other races, and 1.3% from two or more races. Hispanic or Latino of any race were 2.3% of the population.
Economy
Vanceboro is a rural community with a primarily agricultural economy. The town is home to several farms, as well as a few small businesses. The town is also home to a lumber mill, which provides employment for many of the town's residents.
Education
Vanceboro is served by the Craven County School System. The town is home to Vanceboro Farm Life Elementary School, which serves students in grades K-5. Students in grades 6-8 attend West Craven Middle School, and students in grades 9-12 attend West Craven High School.
Conclusion
Vanceboro is a small rural town located in Craven County, North Carolina. The town is situated on the banks of the Trent River and is surrounded by farmland. The town has a population of 1,845 as of the 2010 census and has a primarily agricultural economy. Vanceboro is served by the Craven County School System and is home to Vanceboro Farm Life Elementary School.
Common Questions
What is Per Capita Income in Vanceboro?
Per Capita income in Vanceboro is $22,724.
What is the Median Family Income in Vanceboro?
Median Family Income in Vanceboro is $39,044.
What is the Median Household income in Vanceboro?
Median Household Income in Vanceboro is $38,646.
What is Income or Wage Gap in Vanceboro?
Income or Wage Gap in Vanceboro is 41.3%.
Women in Vanceboro earn 58.7 cents for every dollar earned by a man.
What is Inequality or Gini Index in Vanceboro?
Inequality or Gini Index in Vanceboro is 0.43.
What is the Total Population of Vanceboro?
Total Population of Vanceboro is 958.
What is the Total Male Population of Vanceboro?
Total Male Population of Vanceboro is 386.
What is the Total Female Population of Vanceboro?
Total Female Population of Vanceboro is 572.
What is the Ratio of Males per 100 Females in Vanceboro?
There are 67.48 Males per 100 Females in Vanceboro.
What is the Ratio of Females per 100 Males in Vanceboro?
There are 148.19 Females per 100 Males in Vanceboro.
What is the Median Population Age in Vanceboro?
Median Population Age in Vanceboro is 38.0 Years.
What is the Average Family Size in Vanceboro
Average Family Size in Vanceboro is 2.9 People.
What is the Average Household Size in Vanceboro
Average Household Size in Vanceboro is 2.4 People.
How Large is the Labor Force in Vanceboro?
There are 389 People in the Labor Forcein in Vanceboro.
What is the Percentage of People in the Labor Force in Vanceboro?
51.7% of People are in the Labor Force in Vanceboro.
What is the Unemployment Rate in Vanceboro?
Unemployment Rate in Vanceboro is 1.0%.