Tobaccoville, NC Map & Demographics
Tobaccoville Map
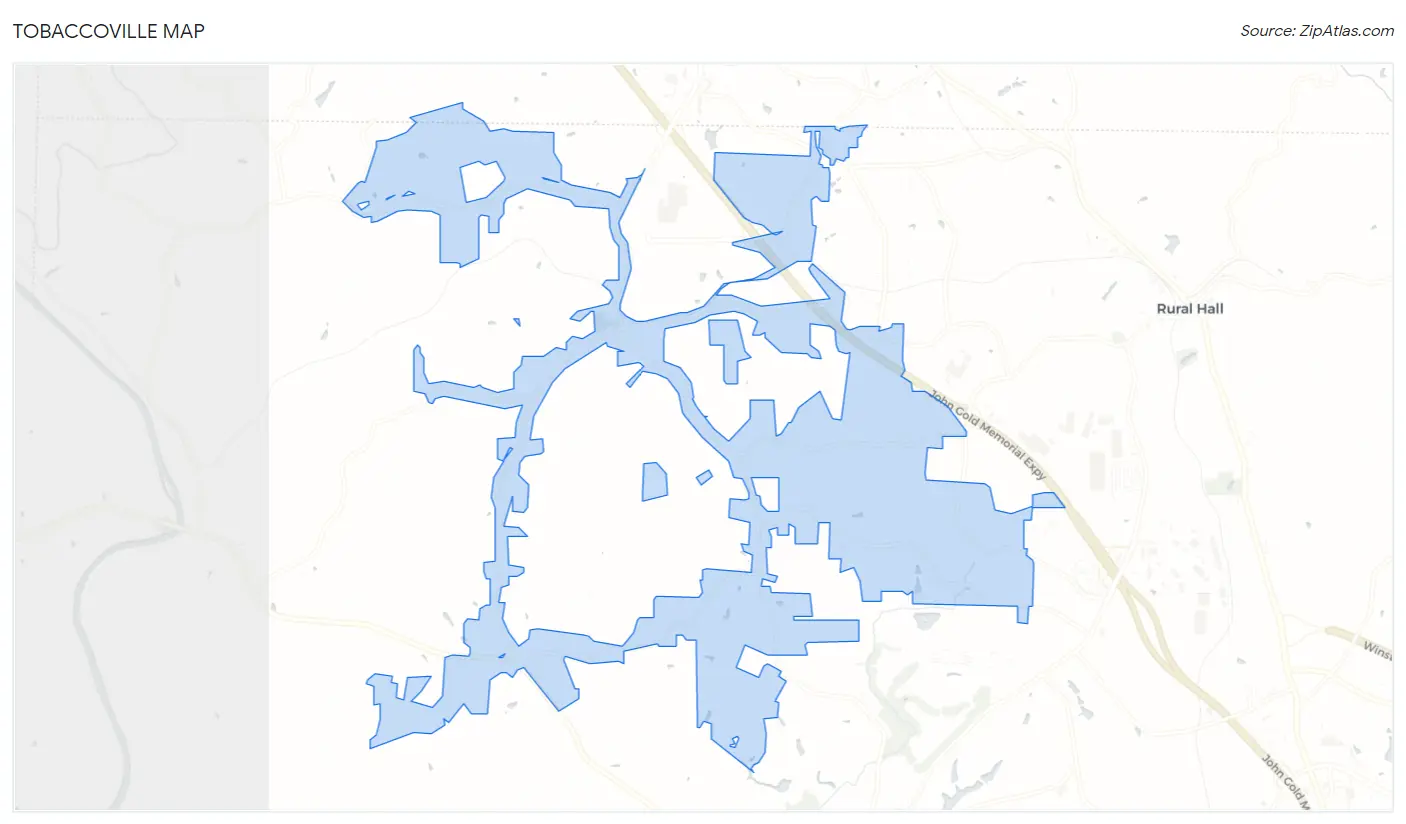
Tobaccoville Overview
$30,316
PER CAPITA INCOME
$77,346
AVG FAMILY INCOME
$75,673
AVG HOUSEHOLD INCOME
22.5%
WAGE / INCOME GAP [ % ]
77.5¢/ $1
WAGE / INCOME GAP [ $ ]
0.36
INEQUALITY / GINI INDEX
2,602
TOTAL POPULATION
1,290
MALE POPULATION
1,312
FEMALE POPULATION
98.32
MALES / 100 FEMALES
101.71
FEMALES / 100 MALES
40.2
MEDIAN AGE
3.0
AVG FAMILY SIZE
2.6
AVG HOUSEHOLD SIZE
1,179
LABOR FORCE [ PEOPLE ]
59.2%
PERCENT IN LABOR FORCE
4.0%
UNEMPLOYMENT RATE
Tobaccoville Zip Codes
Tobaccoville Area Codes
Income in Tobaccoville
Income Overview in Tobaccoville
Per Capita Income in Tobaccoville is $30,316, while median incomes of families and households are $77,346 and $75,673 respectively.
| Characteristic | Number | Measure |
| Per Capita Income | 2,602 | $30,316 |
| Median Family Income | 736 | $77,346 |
| Mean Family Income | 736 | $90,900 |
| Median Household Income | 983 | $75,673 |
| Mean Household Income | 983 | $79,369 |
| Income Deficit | 736 | $0 |
| Wage / Income Gap (%) | 2,602 | 22.46% |
| Wage / Income Gap ($) | 2,602 | 77.54¢ per $1 |
| Gini / Inequality Index | 2,602 | 0.36 |
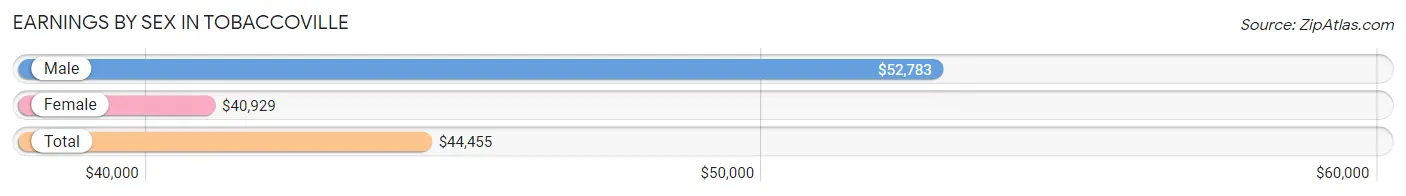
Earnings by Sex in Tobaccoville
Average Earnings in Tobaccoville are $44,455, $52,783 for men and $40,929 for women, a difference of 22.5%.
| Sex | Number | Average Earnings |
| Male | 578 (47.8%) | $52,783 |
| Female | 630 (52.1%) | $40,929 |
| Total | 1,208 (100.0%) | $44,455 |
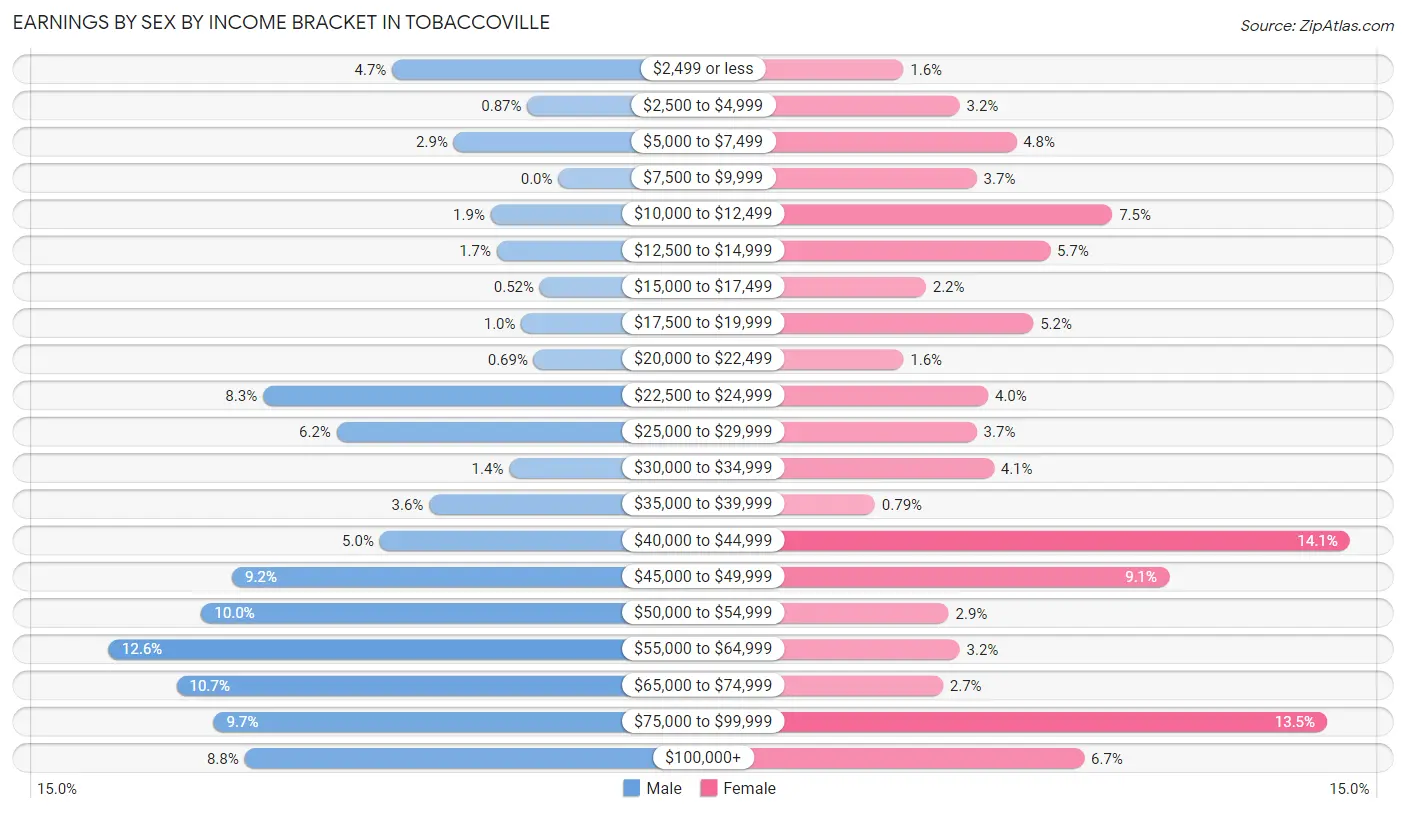
Earnings by Sex by Income Bracket in Tobaccoville
The most common earnings brackets in Tobaccoville are $55,000 to $64,999 for men (73 | 12.6%) and $40,000 to $44,999 for women (89 | 14.1%).
| Income | Male | Female |
| $2,499 or less | 27 (4.7%) | 10 (1.6%) |
| $2,500 to $4,999 | 5 (0.9%) | 20 (3.2%) |
| $5,000 to $7,499 | 17 (2.9%) | 30 (4.8%) |
| $7,500 to $9,999 | 0 (0.0%) | 23 (3.6%) |
| $10,000 to $12,499 | 11 (1.9%) | 47 (7.5%) |
| $12,500 to $14,999 | 10 (1.7%) | 36 (5.7%) |
| $15,000 to $17,499 | 3 (0.5%) | 14 (2.2%) |
| $17,500 to $19,999 | 6 (1.0%) | 33 (5.2%) |
| $20,000 to $22,499 | 4 (0.7%) | 10 (1.6%) |
| $22,500 to $24,999 | 48 (8.3%) | 25 (4.0%) |
| $25,000 to $29,999 | 36 (6.2%) | 23 (3.6%) |
| $30,000 to $34,999 | 8 (1.4%) | 26 (4.1%) |
| $35,000 to $39,999 | 21 (3.6%) | 5 (0.8%) |
| $40,000 to $44,999 | 29 (5.0%) | 89 (14.1%) |
| $45,000 to $49,999 | 53 (9.2%) | 57 (9.0%) |
| $50,000 to $54,999 | 58 (10.0%) | 18 (2.9%) |
| $55,000 to $64,999 | 73 (12.6%) | 20 (3.2%) |
| $65,000 to $74,999 | 62 (10.7%) | 17 (2.7%) |
| $75,000 to $99,999 | 56 (9.7%) | 85 (13.5%) |
| $100,000+ | 51 (8.8%) | 42 (6.7%) |
| Total | 578 (100.0%) | 630 (100.0%) |
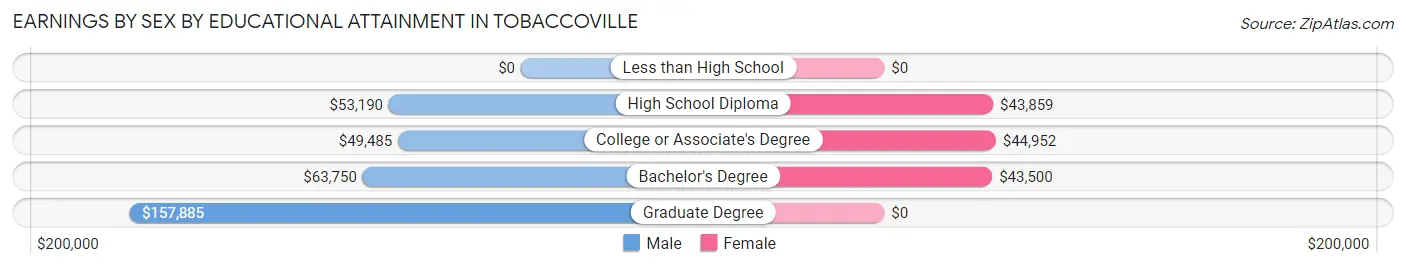
Earnings by Sex by Educational Attainment in Tobaccoville
Average earnings in Tobaccoville are $53,844 for men and $44,028 for women, a difference of 18.2%. Men with an educational attainment of graduate degree enjoy the highest average annual earnings of $157,885, while those with college or associate's degree education earn the least with $49,485. Women with an educational attainment of college or associate's degree earn the most with the average annual earnings of $44,952, while those with bachelor's degree education have the smallest earnings of $43,500.
| Educational Attainment | Male Income | Female Income |
| Less than High School | - | - |
| High School Diploma | $53,190 | $43,859 |
| College or Associate's Degree | $49,485 | $44,952 |
| Bachelor's Degree | $63,750 | $43,500 |
| Graduate Degree | $157,885 | $0 |
| Total | $53,844 | $44,028 |
Family Income in Tobaccoville
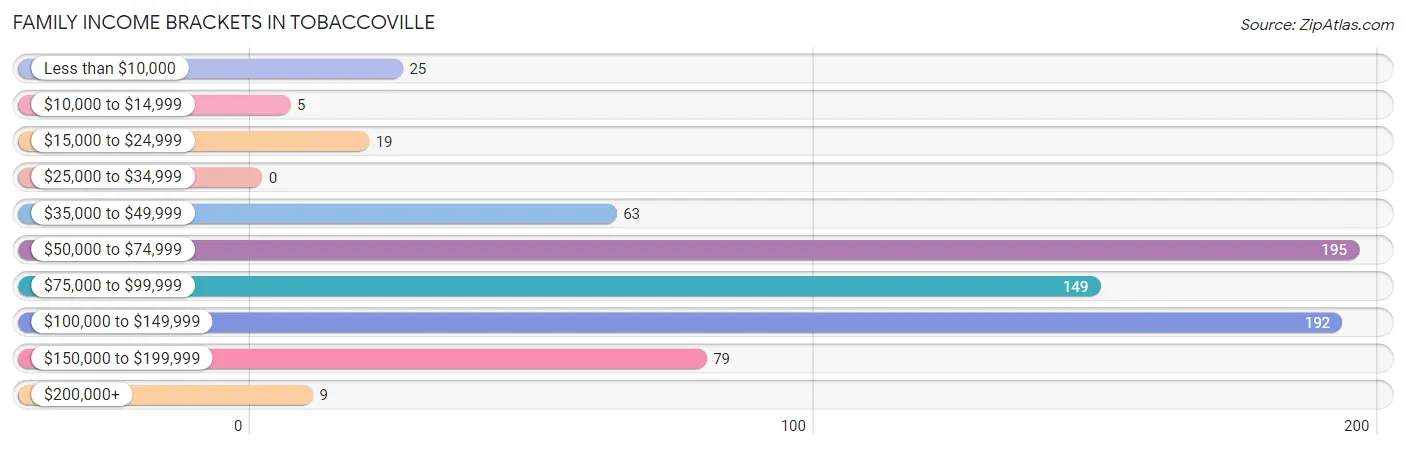
Family Income Brackets in Tobaccoville
According to the Tobaccoville family income data, there are 195 families falling into the $50,000 to $74,999 income range, which is the most common income bracket and makes up 26.5% of all families.
| Income Bracket | # Families | % Families |
| Less than $10,000 | 25 | 3.4% |
| $10,000 to $14,999 | 5 | 0.7% |
| $15,000 to $24,999 | 19 | 2.6% |
| $25,000 to $34,999 | 0 | 0.0% |
| $35,000 to $49,999 | 63 | 8.6% |
| $50,000 to $74,999 | 195 | 26.5% |
| $75,000 to $99,999 | 149 | 20.2% |
| $100,000 to $149,999 | 192 | 26.1% |
| $150,000 to $199,999 | 79 | 10.7% |
| $200,000+ | 9 | 1.2% |
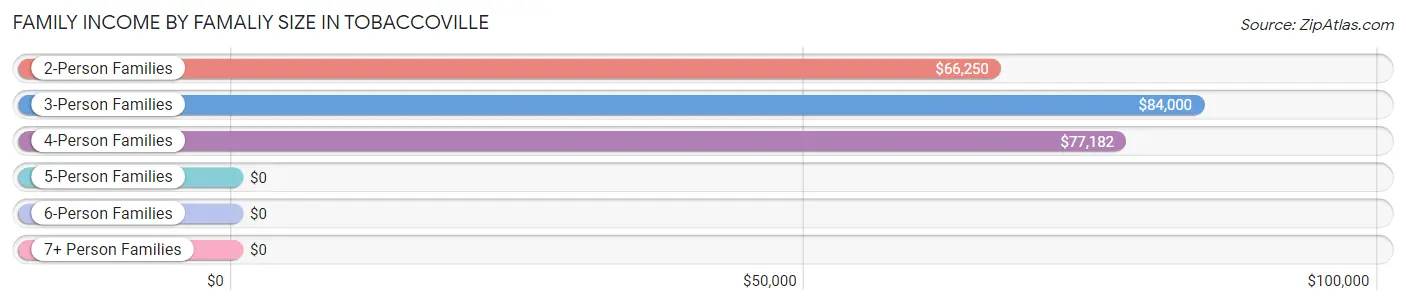
Family Income by Famaliy Size in Tobaccoville
3-person families (164 | 22.3%) account for the highest median family income in Tobaccoville with $84,000 per family, while 2-person families (387 | 52.6%) have the highest median income of $33,125 per family member.
| Income Bracket | # Families | Median Income |
| 2-Person Families | 387 (52.6%) | $66,250 |
| 3-Person Families | 164 (22.3%) | $84,000 |
| 4-Person Families | 125 (17.0%) | $77,182 |
| 5-Person Families | 22 (3.0%) | $0 |
| 6-Person Families | 38 (5.2%) | $0 |
| 7+ Person Families | 0 (0.0%) | $0 |
| Total | 736 (100.0%) | $77,346 |
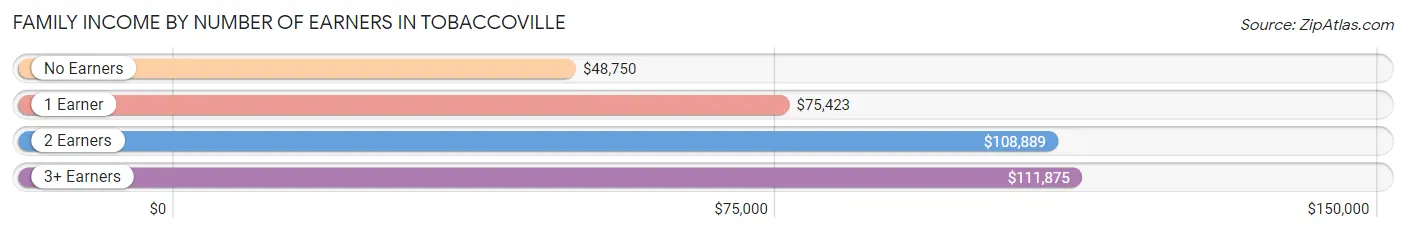
Family Income by Number of Earners in Tobaccoville
The median family income in Tobaccoville is $77,346, with families comprising 3+ earners (60) having the highest median family income of $111,875, while families with no earners (128) have the lowest median family income of $48,750, accounting for 8.2% and 17.4% of families, respectively.
| Number of Earners | # Families | Median Income |
| No Earners | 128 (17.4%) | $48,750 |
| 1 Earner | 314 (42.7%) | $75,423 |
| 2 Earners | 234 (31.8%) | $108,889 |
| 3+ Earners | 60 (8.2%) | $111,875 |
| Total | 736 (100.0%) | $77,346 |
Household Income in Tobaccoville
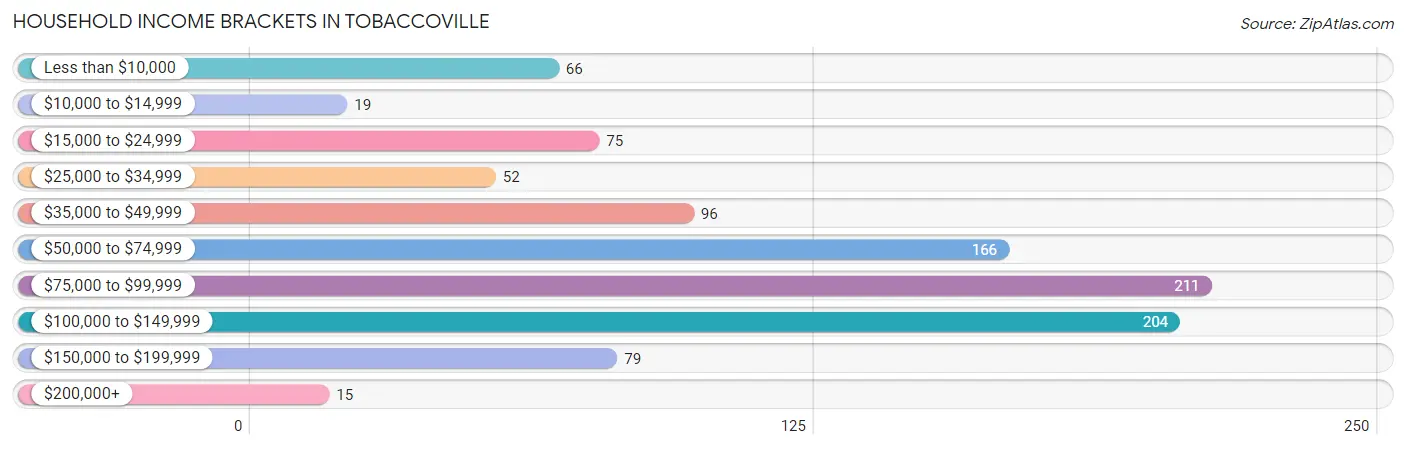
Household Income Brackets in Tobaccoville
With 211 households falling in the category, the $75,000 to $99,999 income range is the most frequent in Tobaccoville, accounting for 21.5% of all households. In contrast, only 15 households (1.5%) fall into the $200,000+ income bracket, making it the least populous group.
| Income Bracket | # Households | % Households |
| Less than $10,000 | 66 | 6.7% |
| $10,000 to $14,999 | 19 | 1.9% |
| $15,000 to $24,999 | 75 | 7.6% |
| $25,000 to $34,999 | 52 | 5.3% |
| $35,000 to $49,999 | 96 | 9.8% |
| $50,000 to $74,999 | 166 | 16.9% |
| $75,000 to $99,999 | 211 | 21.5% |
| $100,000 to $149,999 | 204 | 20.8% |
| $150,000 to $199,999 | 79 | 8.0% |
| $200,000+ | 15 | 1.5% |
Household Income by Householder Age in Tobaccoville
The median household income in Tobaccoville is $75,673, with the highest median household income of $84,338 found in the 25 to 44 years age bracket for the primary householder. A total of 311 households (31.6%) fall into this category. Meanwhile, the 15 to 24 years age bracket for the primary householder has the lowest median household income of $0, with 20 households (2.0%) in this group.
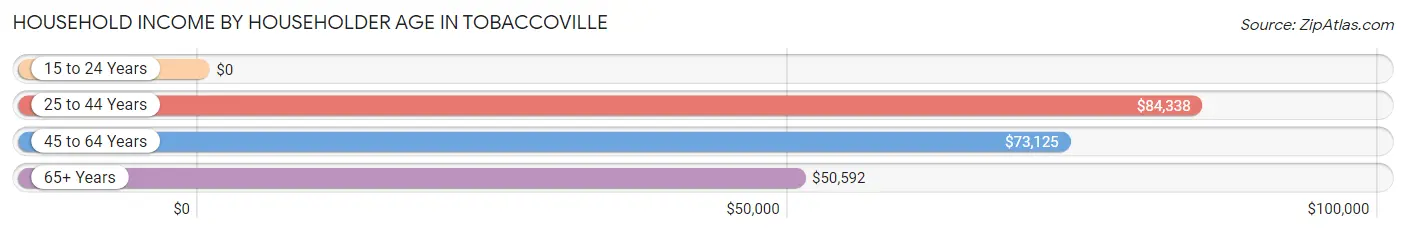
| Income Bracket | # Households | Median Income |
| 15 to 24 Years | 20 (2.0%) | $0 |
| 25 to 44 Years | 311 (31.6%) | $84,338 |
| 45 to 64 Years | 351 (35.7%) | $73,125 |
| 65+ Years | 301 (30.6%) | $50,592 |
| Total | 983 (100.0%) | $75,673 |
Poverty in Tobaccoville
Income Below Poverty by Sex and Age in Tobaccoville
With 9.6% poverty level for males and 9.9% for females among the residents of Tobaccoville, 75 year old and over males and 18 to 24 year old females are the most vulnerable to poverty, with 11 males (26.8%) and 46 females (38.7%) in their respective age groups living below the poverty level.
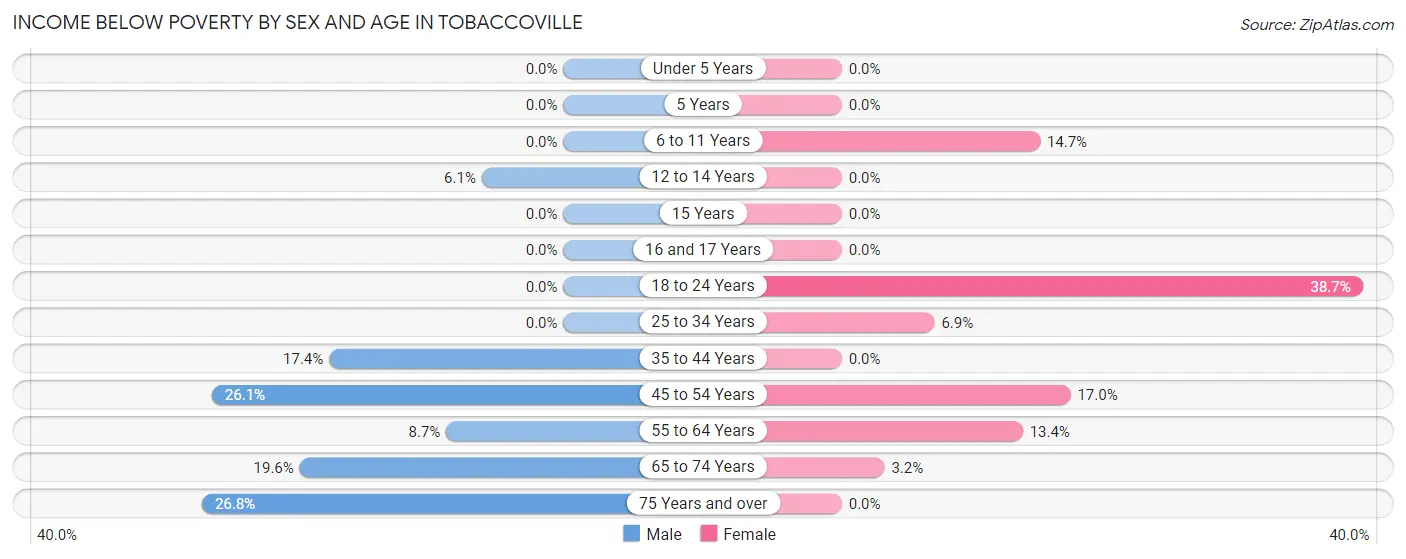
| Age Bracket | Male | Female |
| Under 5 Years | 0 (0.0%) | 0 (0.0%) |
| 5 Years | 0 (0.0%) | 0 (0.0%) |
| 6 to 11 Years | 0 (0.0%) | 5 (14.7%) |
| 12 to 14 Years | 6 (6.1%) | 0 (0.0%) |
| 15 Years | 0 (0.0%) | 0 (0.0%) |
| 16 and 17 Years | 0 (0.0%) | 0 (0.0%) |
| 18 to 24 Years | 0 (0.0%) | 46 (38.7%) |
| 25 to 34 Years | 0 (0.0%) | 11 (6.9%) |
| 35 to 44 Years | 24 (17.4%) | 0 (0.0%) |
| 45 to 54 Years | 30 (26.1%) | 36 (17.0%) |
| 55 to 64 Years | 16 (8.7%) | 27 (13.4%) |
| 65 to 74 Years | 37 (19.6%) | 4 (3.2%) |
| 75 Years and over | 11 (26.8%) | 0 (0.0%) |
| Total | 124 (9.6%) | 129 (9.9%) |
Income Above Poverty by Sex and Age in Tobaccoville
According to the poverty statistics in Tobaccoville, males aged under 5 years and females aged under 5 years are the age groups that are most secure financially, with 100.0% of males and 100.0% of females in these age groups living above the poverty line.
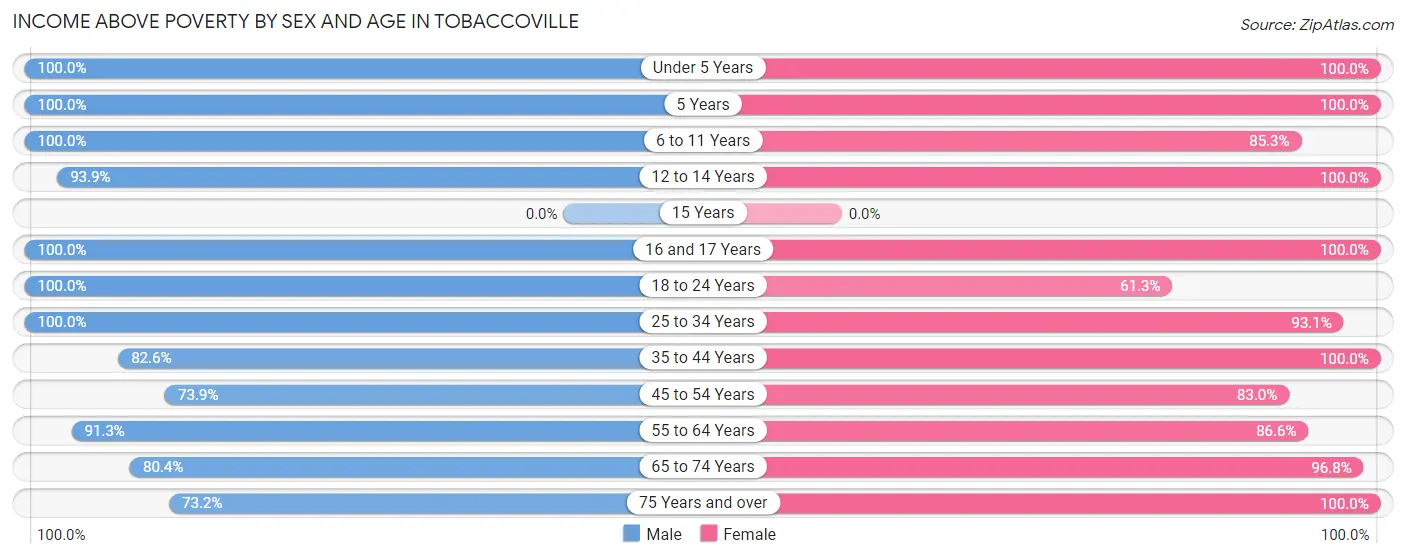
| Age Bracket | Male | Female |
| Under 5 Years | 146 (100.0%) | 151 (100.0%) |
| 5 Years | 23 (100.0%) | 27 (100.0%) |
| 6 to 11 Years | 105 (100.0%) | 29 (85.3%) |
| 12 to 14 Years | 93 (93.9%) | 18 (100.0%) |
| 15 Years | 0 (0.0%) | 0 (0.0%) |
| 16 and 17 Years | 59 (100.0%) | 25 (100.0%) |
| 18 to 24 Years | 39 (100.0%) | 73 (61.3%) |
| 25 to 34 Years | 152 (100.0%) | 149 (93.1%) |
| 35 to 44 Years | 114 (82.6%) | 144 (100.0%) |
| 45 to 54 Years | 85 (73.9%) | 176 (83.0%) |
| 55 to 64 Years | 168 (91.3%) | 174 (86.6%) |
| 65 to 74 Years | 152 (80.4%) | 122 (96.8%) |
| 75 Years and over | 30 (73.2%) | 87 (100.0%) |
| Total | 1,166 (90.4%) | 1,175 (90.1%) |
Income Below Poverty Among Married-Couple Families in Tobaccoville
The poverty statistics for married-couple families in Tobaccoville show that 4.6% or 25 of the total 545 families live below the poverty line. Families with no children have the highest poverty rate of 6.1%, comprising of 20 families. On the other hand, families with 3 or 4 children have the lowest poverty rate of 0.0%, which includes 0 families.
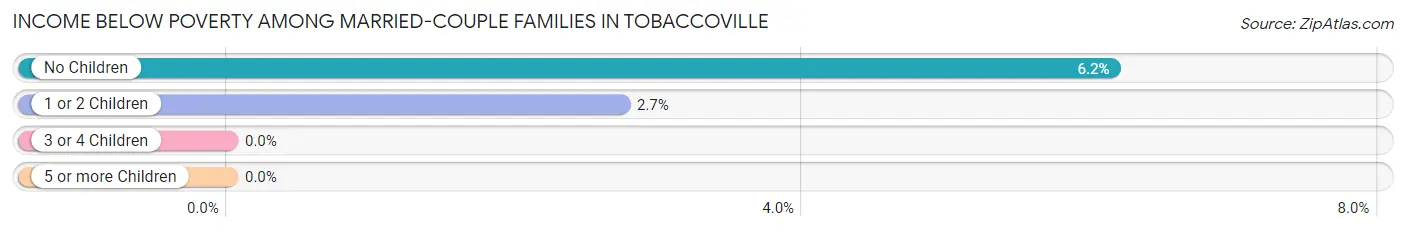
| Children | Above Poverty | Below Poverty |
| No Children | 305 (93.9%) | 20 (6.1%) |
| 1 or 2 Children | 178 (97.3%) | 5 (2.7%) |
| 3 or 4 Children | 37 (100.0%) | 0 (0.0%) |
| 5 or more Children | 0 (0.0%) | 0 (0.0%) |
| Total | 520 (95.4%) | 25 (4.6%) |
Income Below Poverty Among Single-Parent Households in Tobaccoville
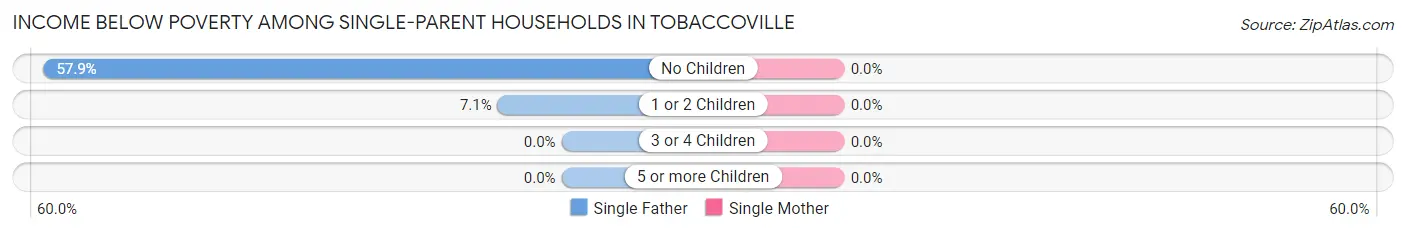
| Children | Single Father | Single Mother |
| No Children | 11 (57.9%) | 0 (0.0%) |
| 1 or 2 Children | 5 (7.1%) | 0 (0.0%) |
| 3 or 4 Children | 0 (0.0%) | 0 (0.0%) |
| 5 or more Children | 0 (0.0%) | 0 (0.0%) |
| Total | 16 (18.0%) | 0 (0.0%) |
Income Below Poverty Among Married-Couple vs Single-Parent Households in Tobaccoville
The poverty data for Tobaccoville shows that 25 of the married-couple family households (4.6%) and 16 of the single-parent households (8.4%) are living below the poverty level. Within the married-couple family households, those with no children have the highest poverty rate, with 20 households (6.1%) falling below the poverty line. Among the single-parent households, those with no children have the highest poverty rate, with 11 household (25.6%) living below poverty.
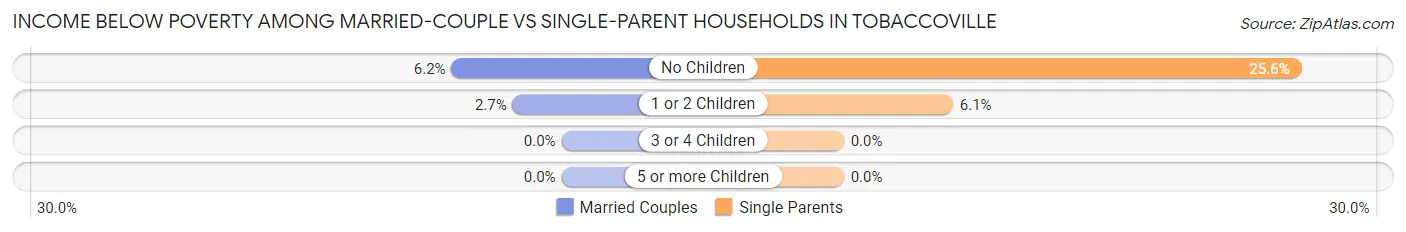
| Children | Married-Couple Families | Single-Parent Households |
| No Children | 20 (6.1%) | 11 (25.6%) |
| 1 or 2 Children | 5 (2.7%) | 5 (6.1%) |
| 3 or 4 Children | 0 (0.0%) | 0 (0.0%) |
| 5 or more Children | 0 (0.0%) | 0 (0.0%) |
| Total | 25 (4.6%) | 16 (8.4%) |
Race in Tobaccoville
The most populous races in Tobaccoville are White / Caucasian (1,870 | 71.9%), Black / African American (582 | 22.4%), and Two or more Races (145 | 5.6%).
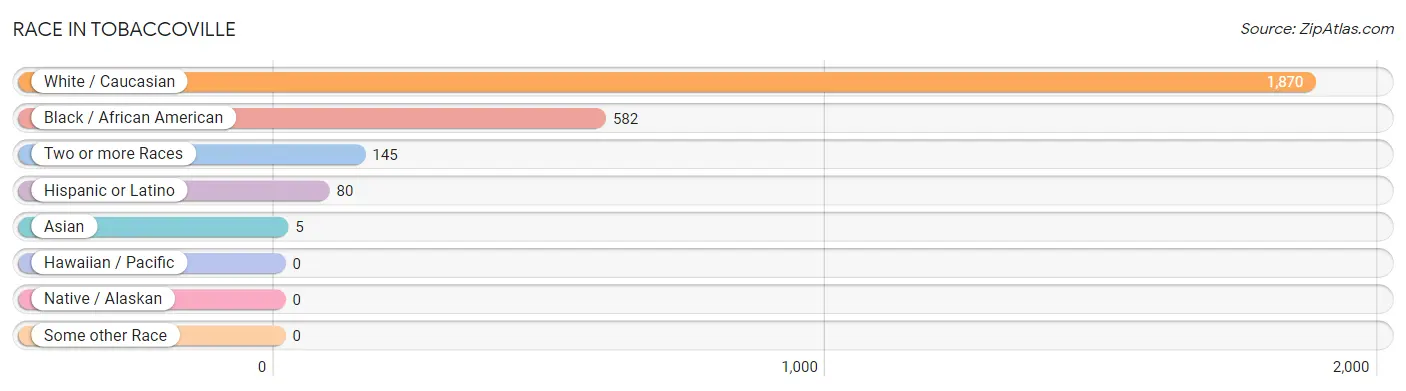
| Race | # Population | % Population |
| Asian | 5 | 0.2% |
| Black / African American | 582 | 22.4% |
| Hawaiian / Pacific | 0 | 0.0% |
| Hispanic or Latino | 80 | 3.1% |
| Native / Alaskan | 0 | 0.0% |
| White / Caucasian | 1,870 | 71.9% |
| Two or more Races | 145 | 5.6% |
| Some other Race | 0 | 0.0% |
| Total | 2,602 | 100.0% |
Ancestry in Tobaccoville
The most populous ancestries reported in Tobaccoville are German (397 | 15.3%), American (317 | 12.2%), English (294 | 11.3%), Irish (202 | 7.8%), and French (44 | 1.7%), together accounting for 48.2% of all Tobaccoville residents.
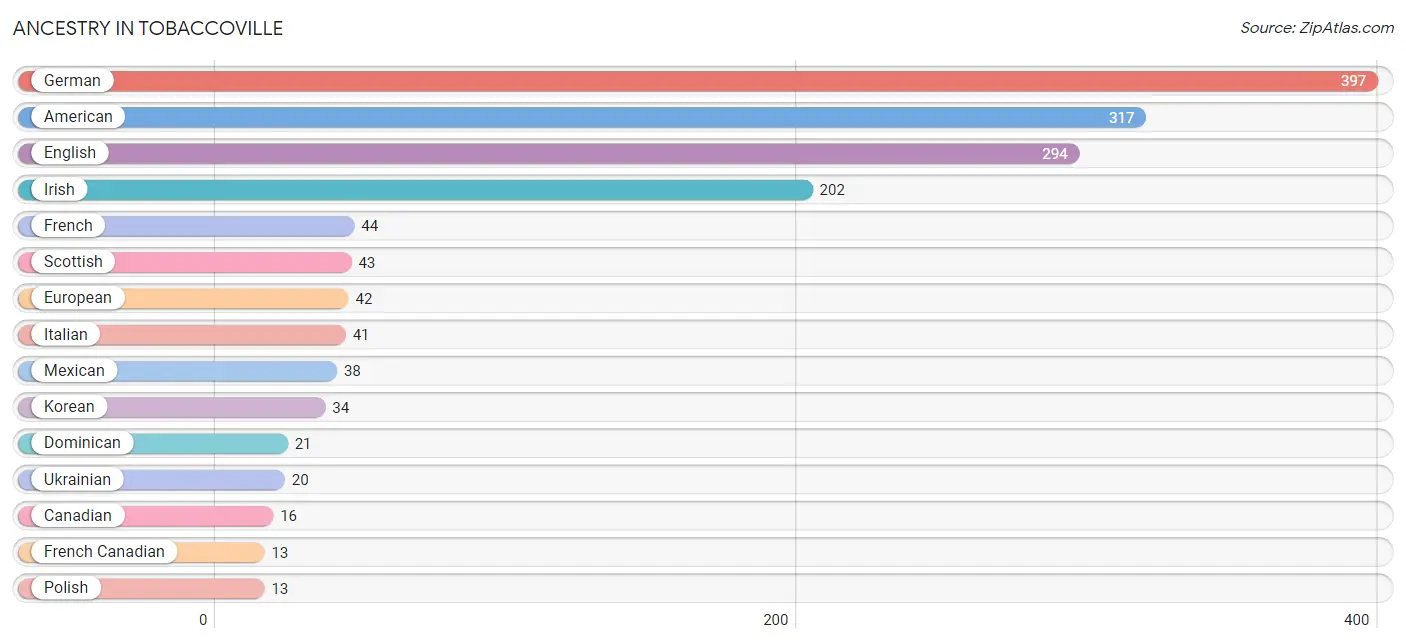
| Ancestry | # Population | % Population |
| American | 317 | 12.2% |
| British | 4 | 0.2% |
| Canadian | 16 | 0.6% |
| Colombian | 6 | 0.2% |
| Cuban | 6 | 0.2% |
| Dominican | 21 | 0.8% |
| Dutch | 4 | 0.2% |
| English | 294 | 11.3% |
| European | 42 | 1.6% |
| Finnish | 5 | 0.2% |
| French | 44 | 1.7% |
| French Canadian | 13 | 0.5% |
| German | 397 | 15.3% |
| Irish | 202 | 7.8% |
| Italian | 41 | 1.6% |
| Korean | 34 | 1.3% |
| Mexican | 38 | 1.5% |
| Pakistani | 5 | 0.2% |
| Polish | 13 | 0.5% |
| Puerto Rican | 9 | 0.4% |
| Scotch-Irish | 13 | 0.5% |
| Scottish | 43 | 1.7% |
| South American | 6 | 0.2% |
| Swedish | 5 | 0.2% |
| Swiss | 6 | 0.2% |
| Ukrainian | 20 | 0.8% |
| Welsh | 9 | 0.4% | View All 27 Rows |
Immigrants in Tobaccoville
The most numerous immigrant groups reported in Tobaccoville came from Europe (14 | 0.5%), Northern Europe (14 | 0.5%), Asia (5 | 0.2%), South Eastern Asia (5 | 0.2%), and Thailand (5 | 0.2%), together accounting for 1.7% of all Tobaccoville residents.
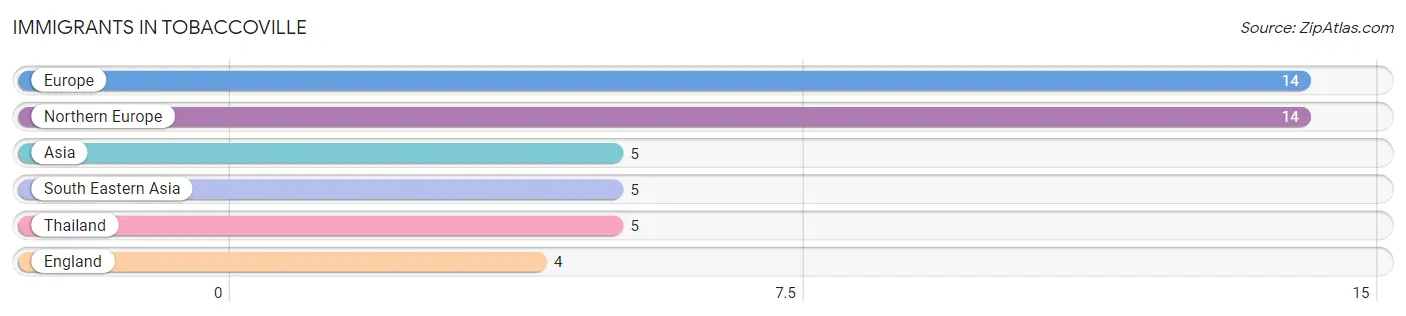
| Immigration Origin | # Population | % Population |
| Asia | 5 | 0.2% |
| England | 4 | 0.2% |
| Europe | 14 | 0.5% |
| Northern Europe | 14 | 0.5% |
| South Eastern Asia | 5 | 0.2% |
| Thailand | 5 | 0.2% | View All 6 Rows |
Sex and Age in Tobaccoville
Sex and Age in Tobaccoville
The most populous age groups in Tobaccoville are Under 5 Years (146 | 11.3%) for men and Under 5 Years (159 | 12.1%) for women.
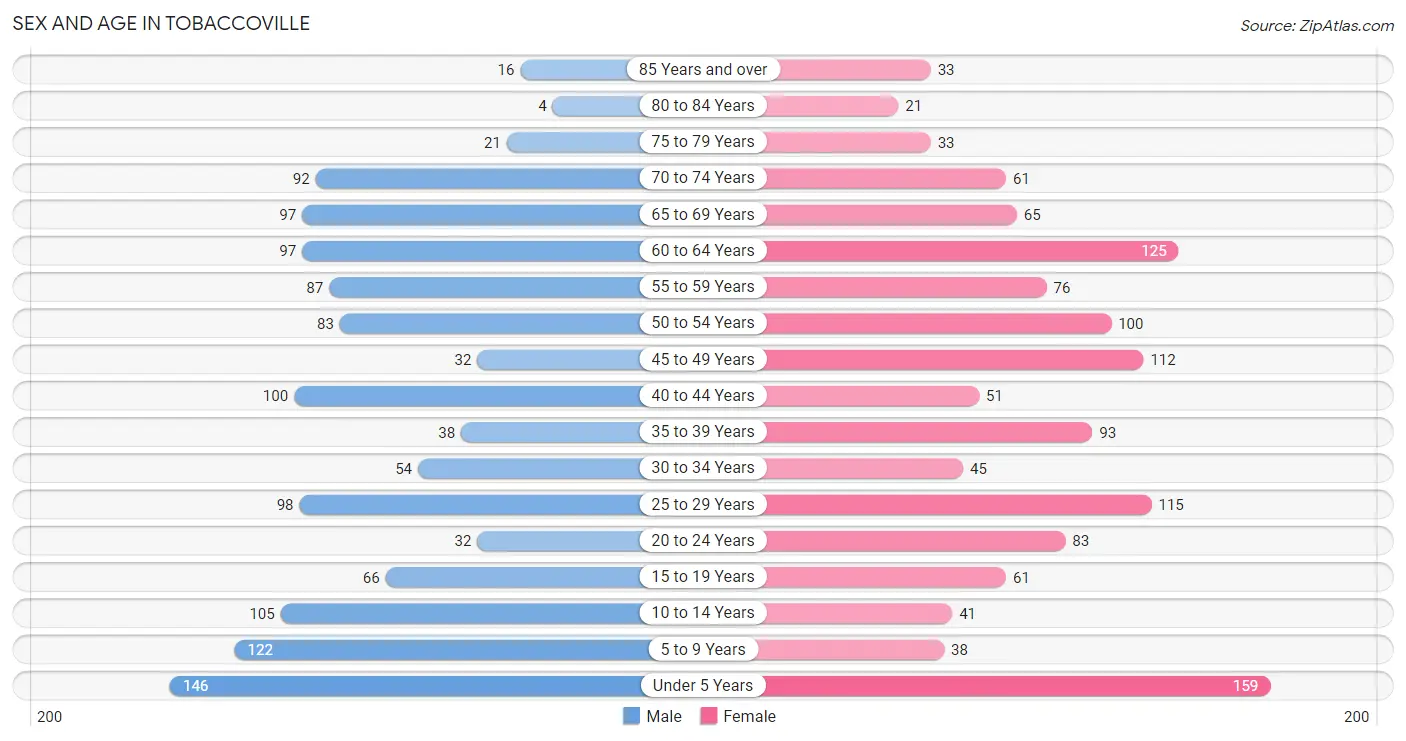
| Age Bracket | Male | Female |
| Under 5 Years | 146 (11.3%) | 159 (12.1%) |
| 5 to 9 Years | 122 (9.5%) | 38 (2.9%) |
| 10 to 14 Years | 105 (8.1%) | 41 (3.1%) |
| 15 to 19 Years | 66 (5.1%) | 61 (4.6%) |
| 20 to 24 Years | 32 (2.5%) | 83 (6.3%) |
| 25 to 29 Years | 98 (7.6%) | 115 (8.8%) |
| 30 to 34 Years | 54 (4.2%) | 45 (3.4%) |
| 35 to 39 Years | 38 (2.9%) | 93 (7.1%) |
| 40 to 44 Years | 100 (7.7%) | 51 (3.9%) |
| 45 to 49 Years | 32 (2.5%) | 112 (8.5%) |
| 50 to 54 Years | 83 (6.4%) | 100 (7.6%) |
| 55 to 59 Years | 87 (6.7%) | 76 (5.8%) |
| 60 to 64 Years | 97 (7.5%) | 125 (9.5%) |
| 65 to 69 Years | 97 (7.5%) | 65 (5.0%) |
| 70 to 74 Years | 92 (7.1%) | 61 (4.6%) |
| 75 to 79 Years | 21 (1.6%) | 33 (2.5%) |
| 80 to 84 Years | 4 (0.3%) | 21 (1.6%) |
| 85 Years and over | 16 (1.2%) | 33 (2.5%) |
| Total | 1,290 (100.0%) | 1,312 (100.0%) |
Families and Households in Tobaccoville
Median Family Size in Tobaccoville
The median family size in Tobaccoville is 3.01 persons per family, with single female/mother families (102 | 13.9%) accounting for the largest median family size of 3.89 persons per family. On the other hand, single male/father families (89 | 12.1%) represent the smallest median family size with 2.08 persons per family.
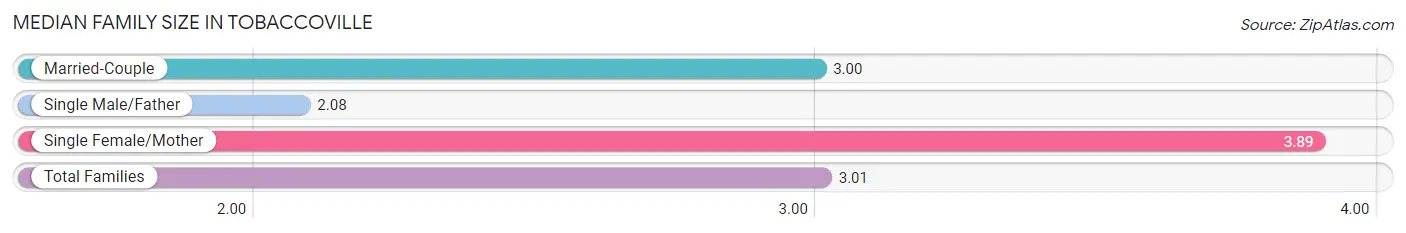
| Family Type | # Families | Family Size |
| Married-Couple | 545 (74.1%) | 3.00 |
| Single Male/Father | 89 (12.1%) | 2.08 |
| Single Female/Mother | 102 (13.9%) | 3.89 |
| Total Families | 736 (100.0%) | 3.01 |
Median Household Size in Tobaccoville
The median household size in Tobaccoville is 2.65 persons per household, with single female/mother households (102 | 10.4%) accounting for the largest median household size of 4.13 persons per household. non-family households (247 | 25.1%) represent the smallest median household size with 1.21 persons per household.
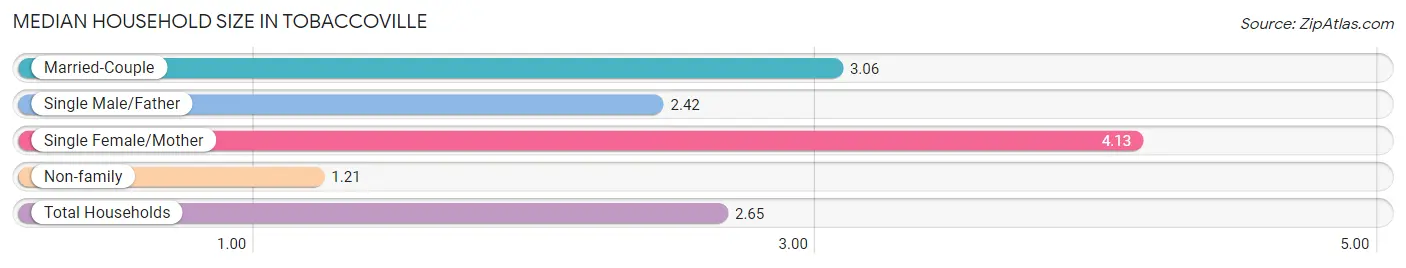
| Household Type | # Households | Household Size |
| Married-Couple | 545 (55.4%) | 3.06 |
| Single Male/Father | 89 (9.0%) | 2.42 |
| Single Female/Mother | 102 (10.4%) | 4.13 |
| Non-family | 247 (25.1%) | 1.21 |
| Total Households | 983 (100.0%) | 2.65 |
Household Size by Marriage Status in Tobaccoville
Out of a total of 983 households in Tobaccoville, 736 (74.9%) are family households, while 247 (25.1%) are nonfamily households. The most numerous type of family households are 2-person households, comprising 336, and the most common type of nonfamily households are 1-person households, comprising 210.
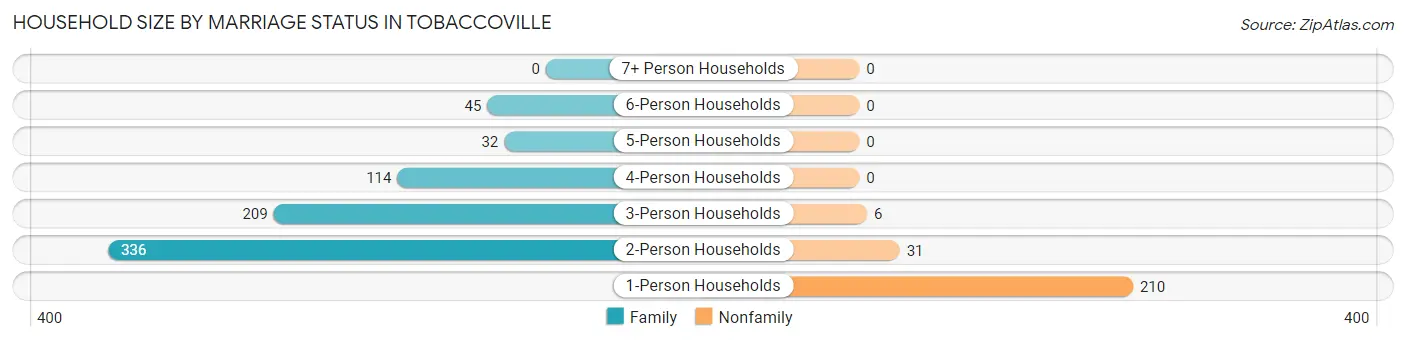
| Household Size | Family Households | Nonfamily Households |
| 1-Person Households | - | 210 (21.4%) |
| 2-Person Households | 336 (34.2%) | 31 (3.2%) |
| 3-Person Households | 209 (21.3%) | 6 (0.6%) |
| 4-Person Households | 114 (11.6%) | 0 (0.0%) |
| 5-Person Households | 32 (3.3%) | 0 (0.0%) |
| 6-Person Households | 45 (4.6%) | 0 (0.0%) |
| 7+ Person Households | 0 (0.0%) | 0 (0.0%) |
| Total | 736 (74.9%) | 247 (25.1%) |
Female Fertility in Tobaccoville
Fertility by Age in Tobaccoville
Average fertility rate in Tobaccoville is 38.0 births per 1,000 women. Women in the age bracket of 20 to 34 years have the highest fertility rate with 70.0 births per 1,000 women. Women in the age bracket of 20 to 34 years acount for 73.9% of all women with births.
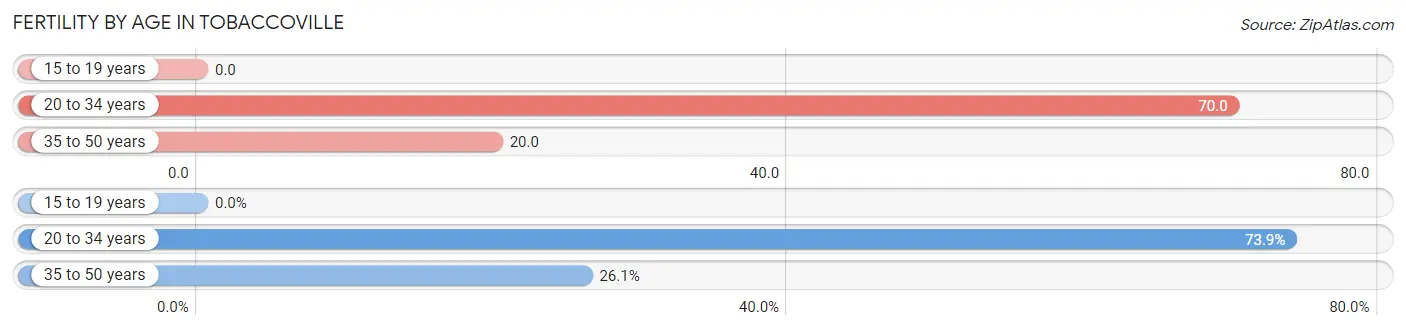
| Age Bracket | Women with Births | Births / 1,000 Women |
| 15 to 19 years | 0 (0.0%) | 0.0 |
| 20 to 34 years | 17 (73.9%) | 70.0 |
| 35 to 50 years | 6 (26.1%) | 20.0 |
| Total | 23 (100.0%) | 38.0 |
Fertility by Age by Marriage Status in Tobaccoville
34.8% of women with births (23) in Tobaccoville are married. The highest percentage of unmarried women with births falls into 35 to 50 years age bracket with 100.0% of them unmarried at the time of birth, while the lowest percentage of unmarried women with births belong to 20 to 34 years age bracket with 52.9% of them unmarried.
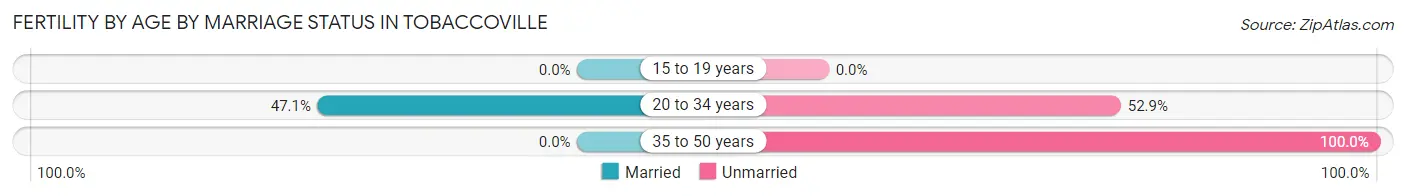
| Age Bracket | Married | Unmarried |
| 15 to 19 years | 0 (0.0%) | 0 (0.0%) |
| 20 to 34 years | 8 (47.1%) | 9 (52.9%) |
| 35 to 50 years | 0 (0.0%) | 6 (100.0%) |
| Total | 8 (34.8%) | 15 (65.2%) |
Fertility by Education in Tobaccoville
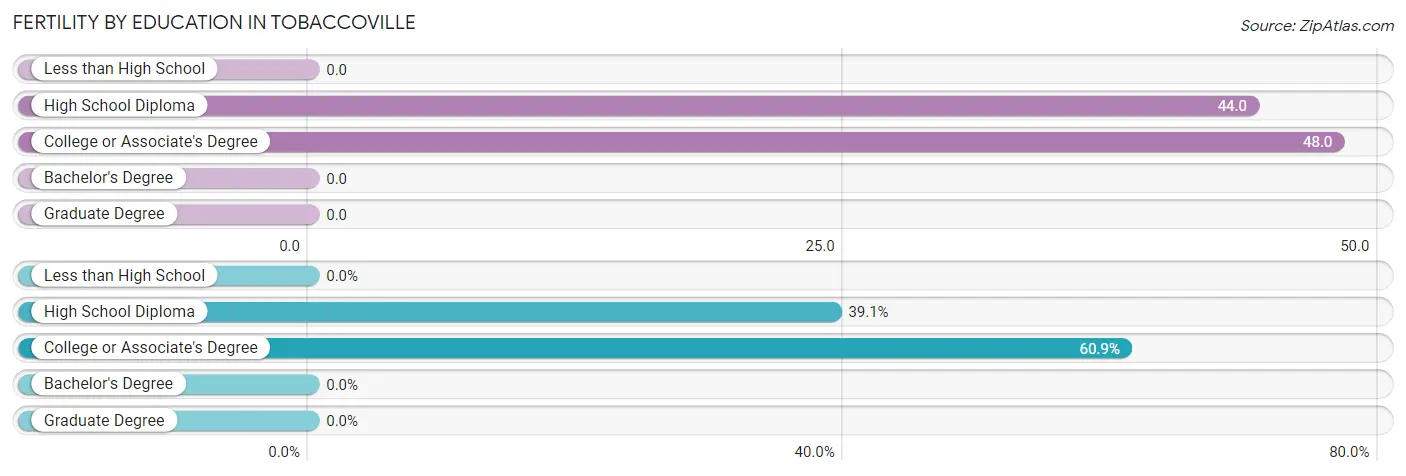
| Educational Attainment | Women with Births | Births / 1,000 Women |
| Less than High School | 0 (0.0%) | 0.0 |
| High School Diploma | 9 (39.1%) | 44.0 |
| College or Associate's Degree | 14 (60.9%) | 48.0 |
| Bachelor's Degree | 0 (0.0%) | 0.0 |
| Graduate Degree | 0 (0.0%) | 0.0 |
| Total | 23 (100.0%) | 38.0 |
Fertility by Education by Marriage Status in Tobaccoville
65.2% of women with births in Tobaccoville are unmarried. Women with the educational attainment of college or associate's degree are most likely to be married with 57.1% of them married at childbirth, while women with the educational attainment of high school diploma are least likely to be married with 100.0% of them unmarried at childbirth.
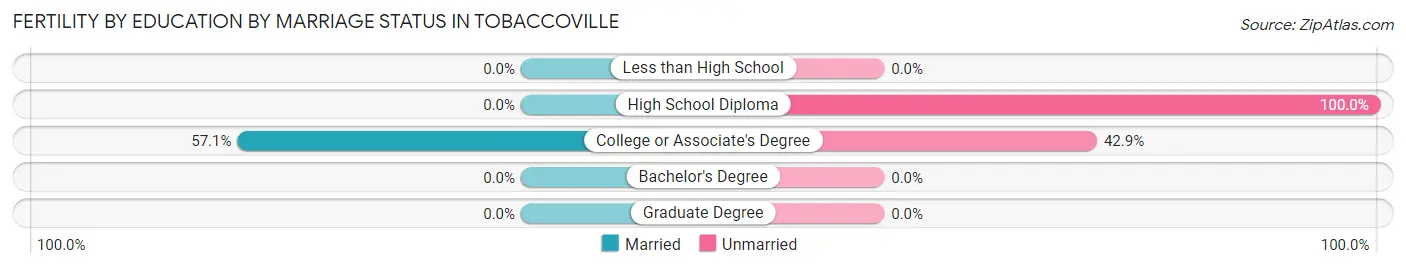
| Educational Attainment | Married | Unmarried |
| Less than High School | 0 (0.0%) | 0 (0.0%) |
| High School Diploma | 0 (0.0%) | 9 (100.0%) |
| College or Associate's Degree | 8 (57.1%) | 6 (42.9%) |
| Bachelor's Degree | 0 (0.0%) | 0 (0.0%) |
| Graduate Degree | 0 (0.0%) | 0 (0.0%) |
| Total | 8 (34.8%) | 15 (65.2%) |
Employment Characteristics in Tobaccoville
Employment by Class of Employer in Tobaccoville
Among the 1,108 employed individuals in Tobaccoville, private company employees (781 | 70.5%), self-employed (not incorporated) (130 | 11.7%), and not-for-profit organizations (81 | 7.3%) make up the most common classes of employment.
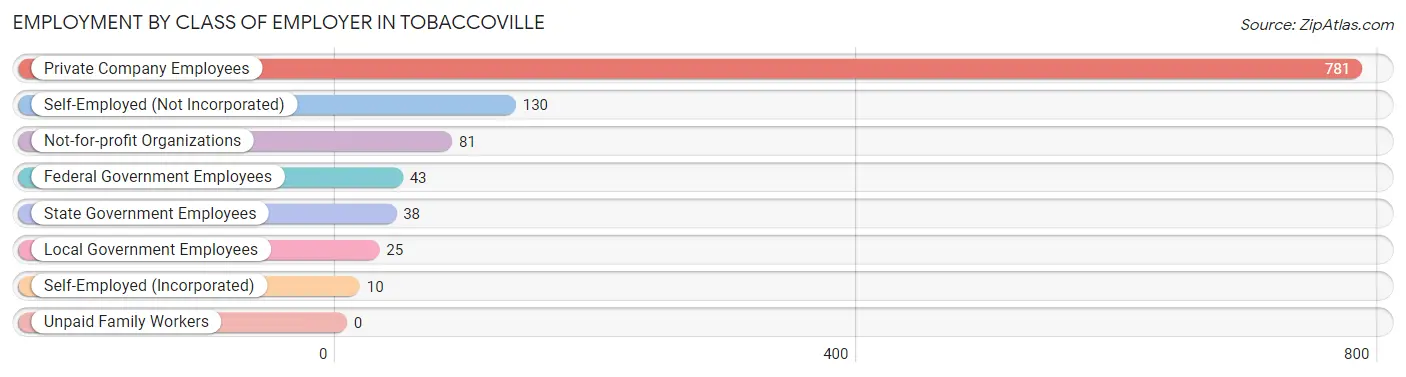
| Employer Class | # Employees | % Employees |
| Private Company Employees | 781 | 70.5% |
| Self-Employed (Incorporated) | 10 | 0.9% |
| Self-Employed (Not Incorporated) | 130 | 11.7% |
| Not-for-profit Organizations | 81 | 7.3% |
| Local Government Employees | 25 | 2.3% |
| State Government Employees | 38 | 3.4% |
| Federal Government Employees | 43 | 3.9% |
| Unpaid Family Workers | 0 | 0.0% |
| Total | 1,108 | 100.0% |
Employment Status by Age in Tobaccoville
According to the labor force statistics for Tobaccoville, out of the total population over 16 years of age (1,991), 59.2% or 1,179 individuals are in the labor force, with 4.0% or 47 of them unemployed. The age group with the highest labor force participation rate is 35 to 44 years, with 89.0% or 251 individuals in the labor force. Within the labor force, the 75 years and over age range has the highest percentage of unemployed individuals, with 44.4% or 4 of them being unemployed.
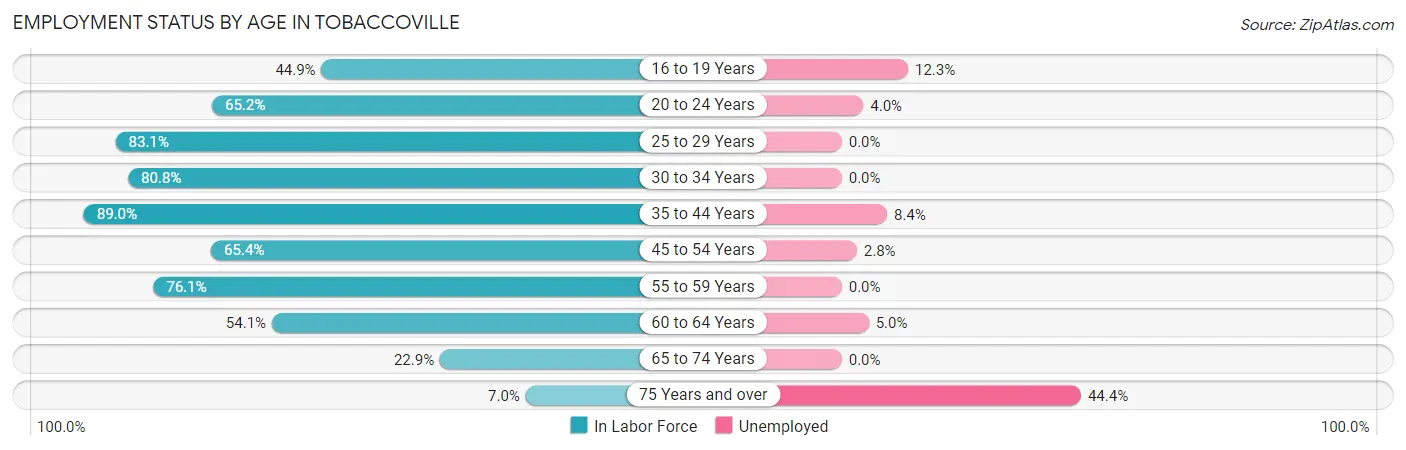
| Age Bracket | In Labor Force | Unemployed |
| 16 to 19 Years | 57 (44.9%) | 7 (12.3%) |
| 20 to 24 Years | 75 (65.2%) | 3 (4.0%) |
| 25 to 29 Years | 177 (83.1%) | 0 (0.0%) |
| 30 to 34 Years | 80 (80.8%) | 0 (0.0%) |
| 35 to 44 Years | 251 (89.0%) | 21 (8.4%) |
| 45 to 54 Years | 214 (65.4%) | 6 (2.8%) |
| 55 to 59 Years | 124 (76.1%) | 0 (0.0%) |
| 60 to 64 Years | 120 (54.1%) | 6 (5.0%) |
| 65 to 74 Years | 72 (22.9%) | 0 (0.0%) |
| 75 Years and over | 9 (7.0%) | 4 (44.4%) |
| Total | 1,179 (59.2%) | 47 (4.0%) |
Employment Status by Educational Attainment in Tobaccoville
According to labor force statistics for Tobaccoville, 74.0% of individuals (966) out of the total population between 25 and 64 years of age (1,306) are in the labor force, with 3.4% or 33 of them being unemployed. The group with the highest labor force participation rate are those with the educational attainment of college / associate degree, with 89.0% or 445 individuals in the labor force. Within the labor force, individuals with high school diploma education have the highest percentage of unemployment, with 5.2% or 16 of them being unemployed.
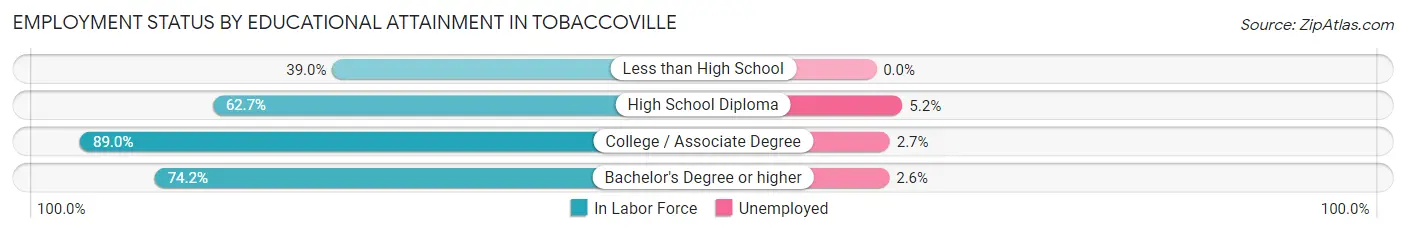
| Educational Attainment | In Labor Force | Unemployed |
| Less than High School | 23 (39.0%) | 0 (0.0%) |
| High School Diploma | 308 (62.7%) | 26 (5.2%) |
| College / Associate Degree | 445 (89.0%) | 14 (2.7%) |
| Bachelor's Degree or higher | 190 (74.2%) | 7 (2.6%) |
| Total | 966 (74.0%) | 44 (3.4%) |
Employment Occupations by Sex in Tobaccoville
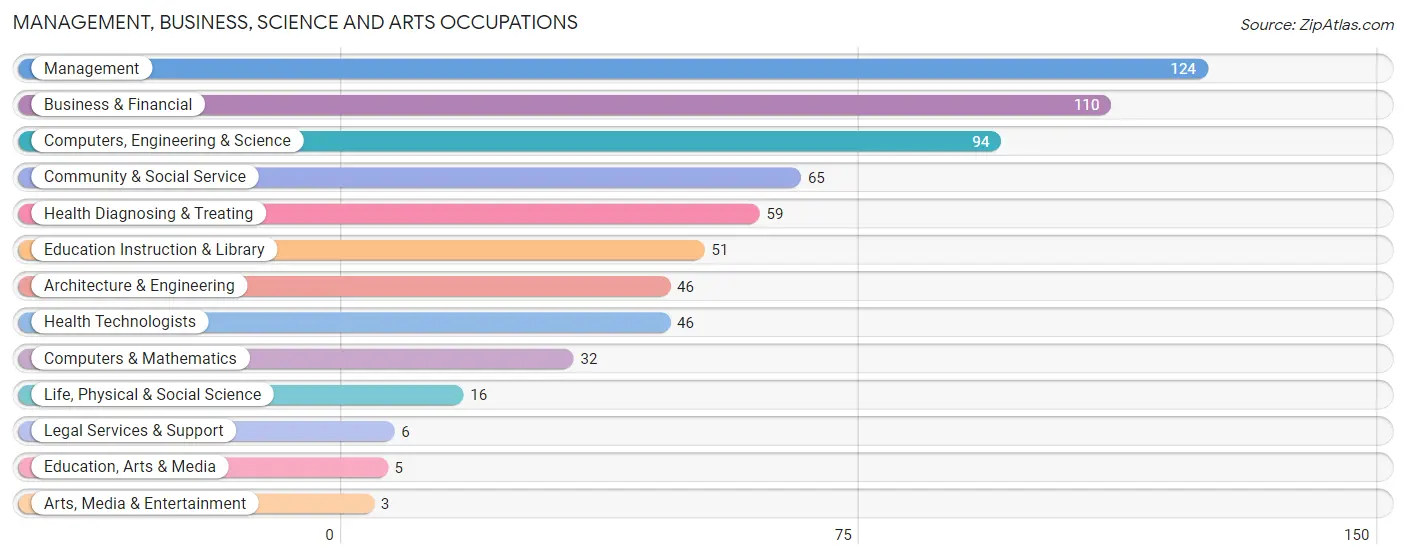
Management, Business, Science and Arts Occupations
The most common Management, Business, Science and Arts occupations in Tobaccoville are Management (124 | 11.0%), Business & Financial (110 | 9.7%), Computers, Engineering & Science (94 | 8.3%), Community & Social Service (65 | 5.7%), and Health Diagnosing & Treating (59 | 5.2%).
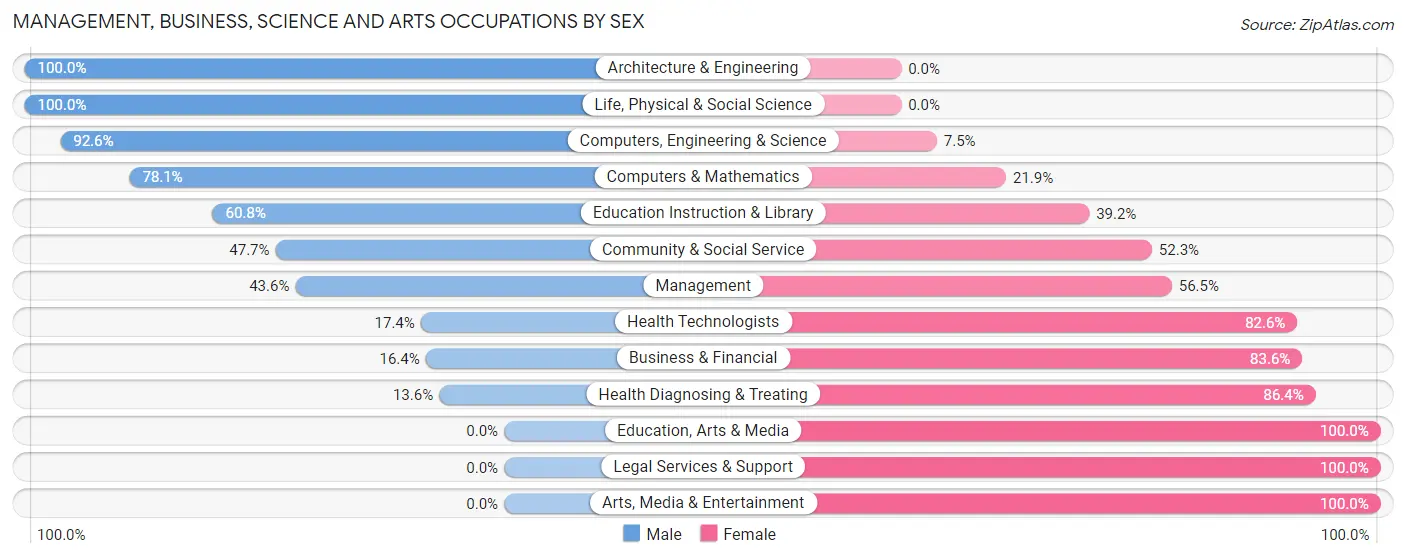
Management, Business, Science and Arts Occupations by Sex
Within the Management, Business, Science and Arts occupations in Tobaccoville, the most male-oriented occupations are Architecture & Engineering (100.0%), Life, Physical & Social Science (100.0%), and Computers, Engineering & Science (92.5%), while the most female-oriented occupations are Education, Arts & Media (100.0%), Legal Services & Support (100.0%), and Arts, Media & Entertainment (100.0%).
| Occupation | Male | Female |
| Management | 54 (43.5%) | 70 (56.5%) |
| Business & Financial | 18 (16.4%) | 92 (83.6%) |
| Computers, Engineering & Science | 87 (92.5%) | 7 (7.4%) |
| Computers & Mathematics | 25 (78.1%) | 7 (21.9%) |
| Architecture & Engineering | 46 (100.0%) | 0 (0.0%) |
| Life, Physical & Social Science | 16 (100.0%) | 0 (0.0%) |
| Community & Social Service | 31 (47.7%) | 34 (52.3%) |
| Education, Arts & Media | 0 (0.0%) | 5 (100.0%) |
| Legal Services & Support | 0 (0.0%) | 6 (100.0%) |
| Education Instruction & Library | 31 (60.8%) | 20 (39.2%) |
| Arts, Media & Entertainment | 0 (0.0%) | 3 (100.0%) |
| Health Diagnosing & Treating | 8 (13.6%) | 51 (86.4%) |
| Health Technologists | 8 (17.4%) | 38 (82.6%) |
| Total (Category) | 198 (43.8%) | 254 (56.2%) |
| Total (Overall) | 560 (49.5%) | 572 (50.5%) |
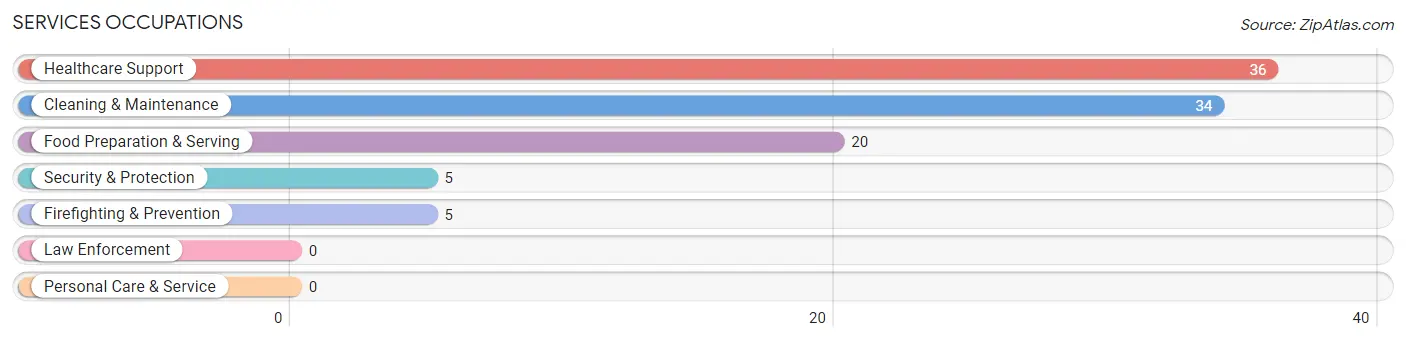
Services Occupations
The most common Services occupations in Tobaccoville are Healthcare Support (36 | 3.2%), Cleaning & Maintenance (34 | 3.0%), Food Preparation & Serving (20 | 1.8%), Security & Protection (5 | 0.4%), and Firefighting & Prevention (5 | 0.4%).
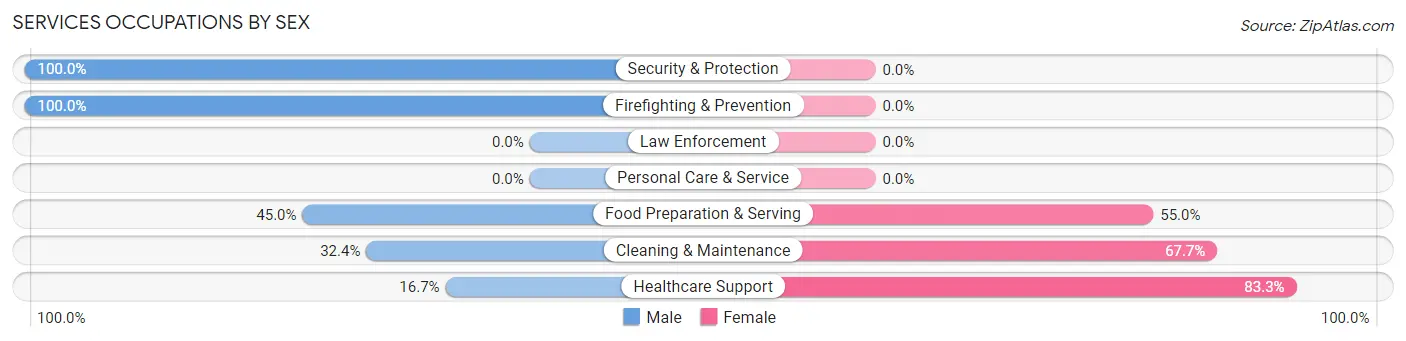
Services Occupations by Sex
Within the Services occupations in Tobaccoville, the most male-oriented occupations are Security & Protection (100.0%), Firefighting & Prevention (100.0%), and Food Preparation & Serving (45.0%), while the most female-oriented occupations are Healthcare Support (83.3%), Cleaning & Maintenance (67.6%), and Food Preparation & Serving (55.0%).
| Occupation | Male | Female |
| Healthcare Support | 6 (16.7%) | 30 (83.3%) |
| Security & Protection | 5 (100.0%) | 0 (0.0%) |
| Firefighting & Prevention | 5 (100.0%) | 0 (0.0%) |
| Law Enforcement | 0 (0.0%) | 0 (0.0%) |
| Food Preparation & Serving | 9 (45.0%) | 11 (55.0%) |
| Cleaning & Maintenance | 11 (32.4%) | 23 (67.6%) |
| Personal Care & Service | 0 (0.0%) | 0 (0.0%) |
| Total (Category) | 31 (32.6%) | 64 (67.4%) |
| Total (Overall) | 560 (49.5%) | 572 (50.5%) |
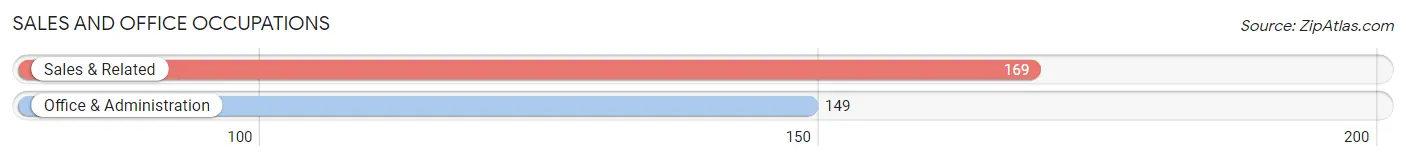
Sales and Office Occupations
The most common Sales and Office occupations in Tobaccoville are Sales & Related (169 | 14.9%), and Office & Administration (149 | 13.2%).
Sales and Office Occupations by Sex

| Occupation | Male | Female |
| Sales & Related | 71 (42.0%) | 98 (58.0%) |
| Office & Administration | 25 (16.8%) | 124 (83.2%) |
| Total (Category) | 96 (30.2%) | 222 (69.8%) |
| Total (Overall) | 560 (49.5%) | 572 (50.5%) |
Natural Resources, Construction and Maintenance Occupations
The most common Natural Resources, Construction and Maintenance occupations in Tobaccoville are Installation, Maintenance & Repair (67 | 5.9%), Construction & Extraction (59 | 5.2%), and Farming, Fishing & Forestry (12 | 1.1%).

Natural Resources, Construction and Maintenance Occupations by Sex

| Occupation | Male | Female |
| Farming, Fishing & Forestry | 8 (66.7%) | 4 (33.3%) |
| Construction & Extraction | 59 (100.0%) | 0 (0.0%) |
| Installation, Maintenance & Repair | 67 (100.0%) | 0 (0.0%) |
| Total (Category) | 134 (97.1%) | 4 (2.9%) |
| Total (Overall) | 560 (49.5%) | 572 (50.5%) |
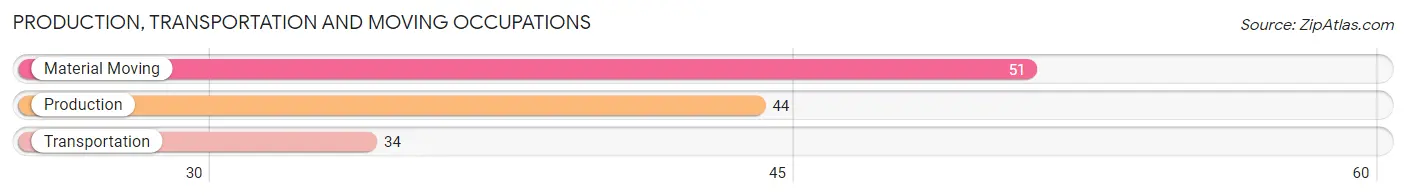
Production, Transportation and Moving Occupations
The most common Production, Transportation and Moving occupations in Tobaccoville are Material Moving (51 | 4.5%), Production (44 | 3.9%), and Transportation (34 | 3.0%).
Production, Transportation and Moving Occupations by Sex
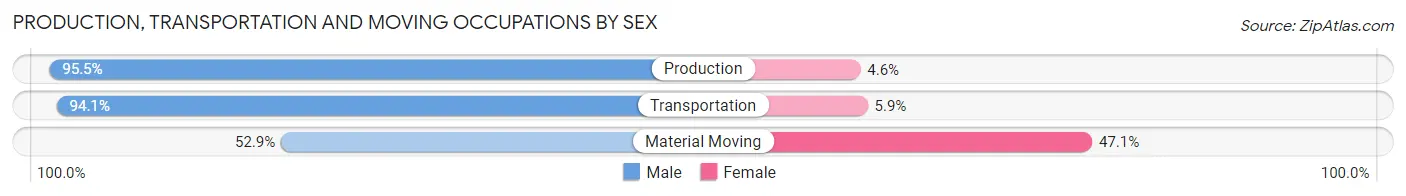
| Occupation | Male | Female |
| Production | 42 (95.5%) | 2 (4.5%) |
| Transportation | 32 (94.1%) | 2 (5.9%) |
| Material Moving | 27 (52.9%) | 24 (47.1%) |
| Total (Category) | 101 (78.3%) | 28 (21.7%) |
| Total (Overall) | 560 (49.5%) | 572 (50.5%) |
Employment Industries by Sex in Tobaccoville
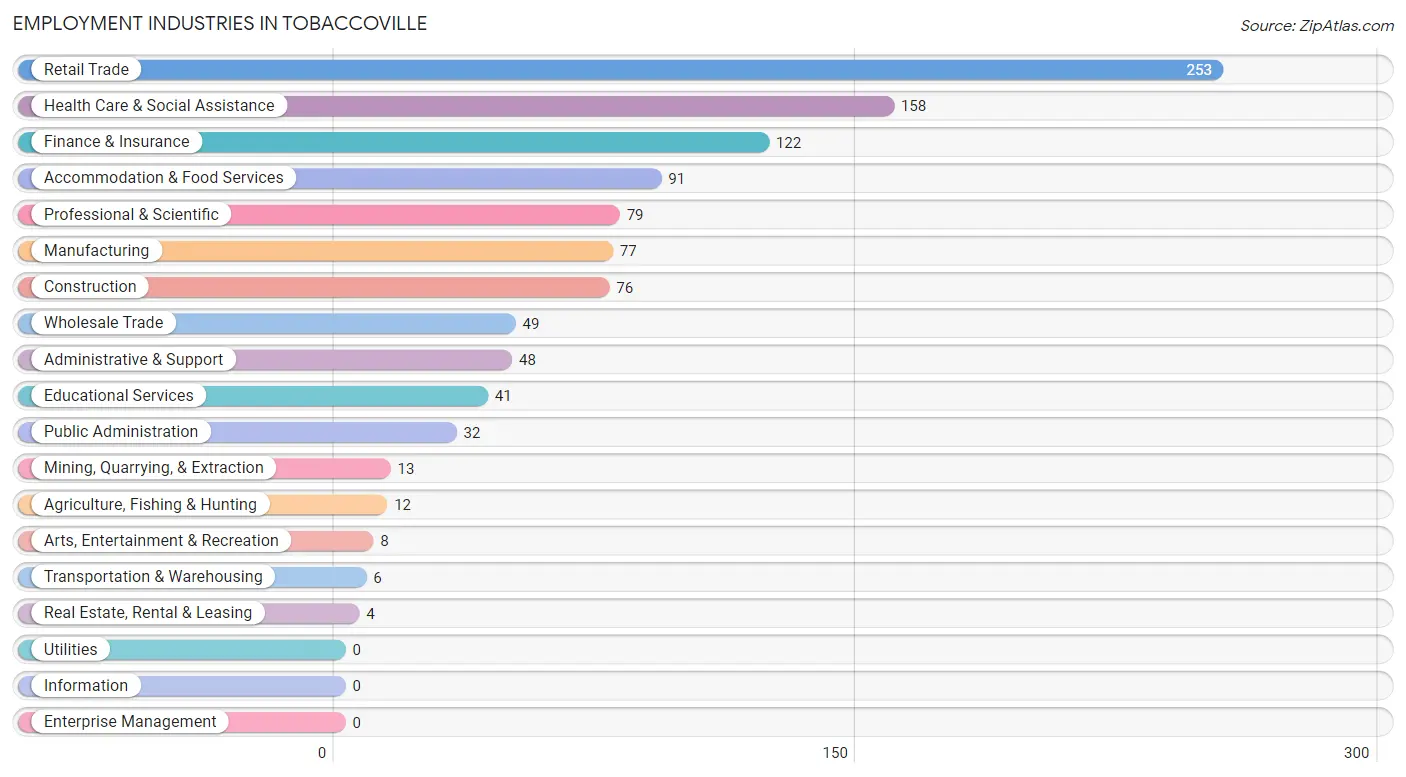
Employment Industries in Tobaccoville
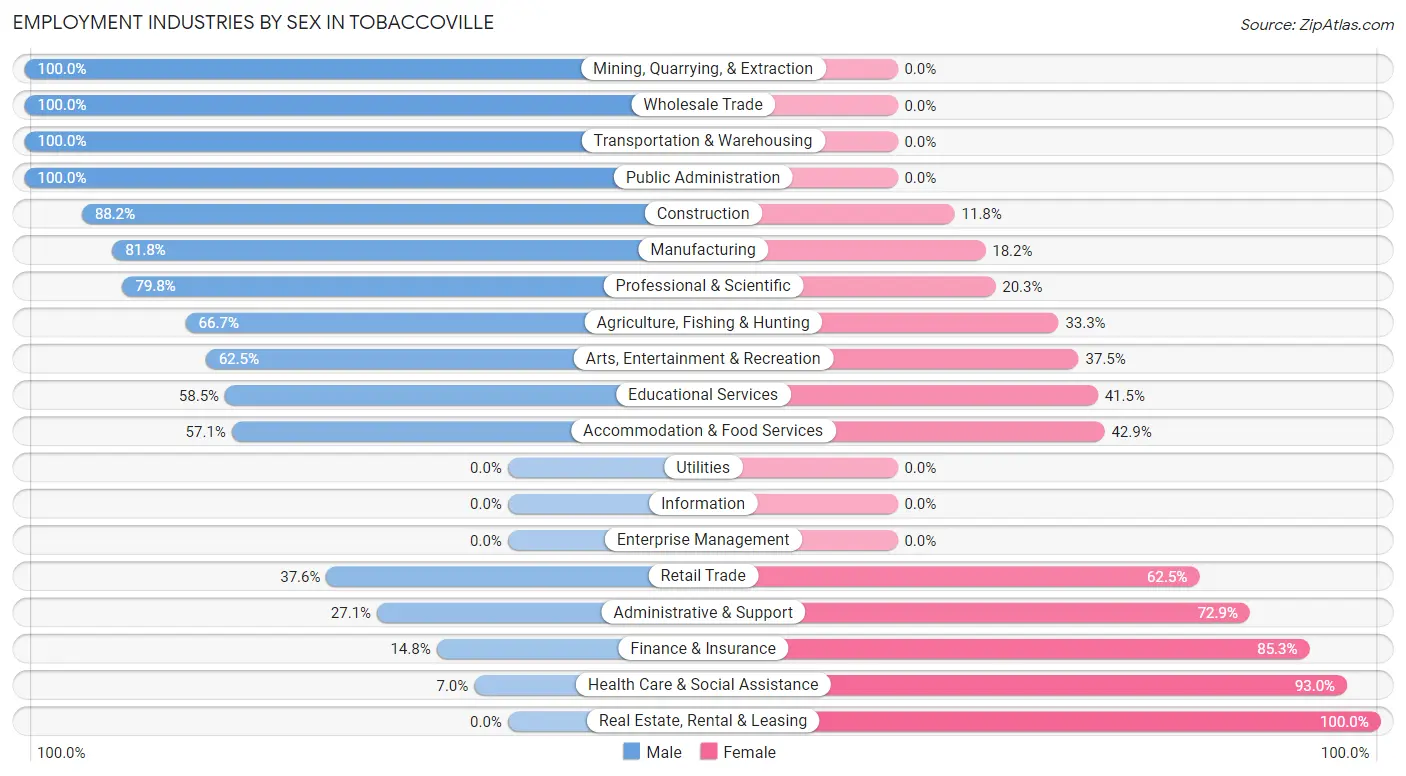
The major employment industries in Tobaccoville include Retail Trade (253 | 22.4%), Health Care & Social Assistance (158 | 14.0%), Finance & Insurance (122 | 10.8%), Accommodation & Food Services (91 | 8.0%), and Professional & Scientific (79 | 7.0%).
Employment Industries by Sex in Tobaccoville
The Tobaccoville industries that see more men than women are Mining, Quarrying, & Extraction (100.0%), Wholesale Trade (100.0%), and Transportation & Warehousing (100.0%), whereas the industries that tend to have a higher number of women are Real Estate, Rental & Leasing (100.0%), Health Care & Social Assistance (93.0%), and Finance & Insurance (85.3%).
| Industry | Male | Female |
| Agriculture, Fishing & Hunting | 8 (66.7%) | 4 (33.3%) |
| Mining, Quarrying, & Extraction | 13 (100.0%) | 0 (0.0%) |
| Construction | 67 (88.2%) | 9 (11.8%) |
| Manufacturing | 63 (81.8%) | 14 (18.2%) |
| Wholesale Trade | 49 (100.0%) | 0 (0.0%) |
| Retail Trade | 95 (37.6%) | 158 (62.5%) |
| Transportation & Warehousing | 6 (100.0%) | 0 (0.0%) |
| Utilities | 0 (0.0%) | 0 (0.0%) |
| Information | 0 (0.0%) | 0 (0.0%) |
| Finance & Insurance | 18 (14.7%) | 104 (85.3%) |
| Real Estate, Rental & Leasing | 0 (0.0%) | 4 (100.0%) |
| Professional & Scientific | 63 (79.7%) | 16 (20.3%) |
| Enterprise Management | 0 (0.0%) | 0 (0.0%) |
| Administrative & Support | 13 (27.1%) | 35 (72.9%) |
| Educational Services | 24 (58.5%) | 17 (41.5%) |
| Health Care & Social Assistance | 11 (7.0%) | 147 (93.0%) |
| Arts, Entertainment & Recreation | 5 (62.5%) | 3 (37.5%) |
| Accommodation & Food Services | 52 (57.1%) | 39 (42.9%) |
| Public Administration | 32 (100.0%) | 0 (0.0%) |
| Total | 560 (49.5%) | 572 (50.5%) |
Education in Tobaccoville
School Enrollment in Tobaccoville
The most common levels of schooling among the 666 students in Tobaccoville are nursery / preschool (225 | 33.8%), middle school (124 | 18.6%), and high school (112 | 16.8%).
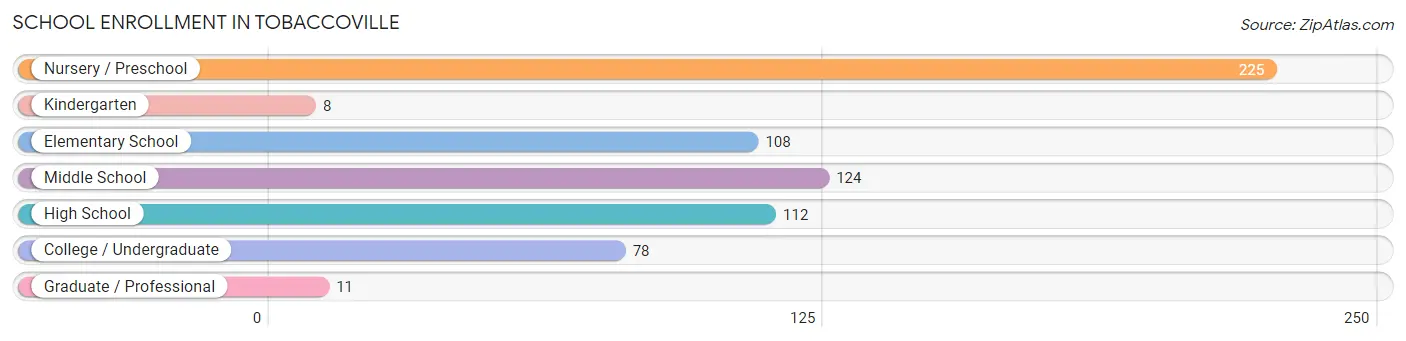
| School Level | # Students | % Students |
| Nursery / Preschool | 225 | 33.8% |
| Kindergarten | 8 | 1.2% |
| Elementary School | 108 | 16.2% |
| Middle School | 124 | 18.6% |
| High School | 112 | 16.8% |
| College / Undergraduate | 78 | 11.7% |
| Graduate / Professional | 11 | 1.7% |
| Total | 666 | 100.0% |
School Enrollment by Age by Funding Source in Tobaccoville
Out of a total of 666 students who are enrolled in schools in Tobaccoville, 269 (40.4%) attend a private institution, while the remaining 397 (59.6%) are enrolled in public schools. The age group of 3 to 4 year olds has the highest likelihood of being enrolled in private schools, with 155 (76.7% in the age bracket) enrolled. Conversely, the age group of 18 to 19 year olds has the lowest likelihood of being enrolled in a private school, with 18 (100.0% in the age bracket) attending a public institution.
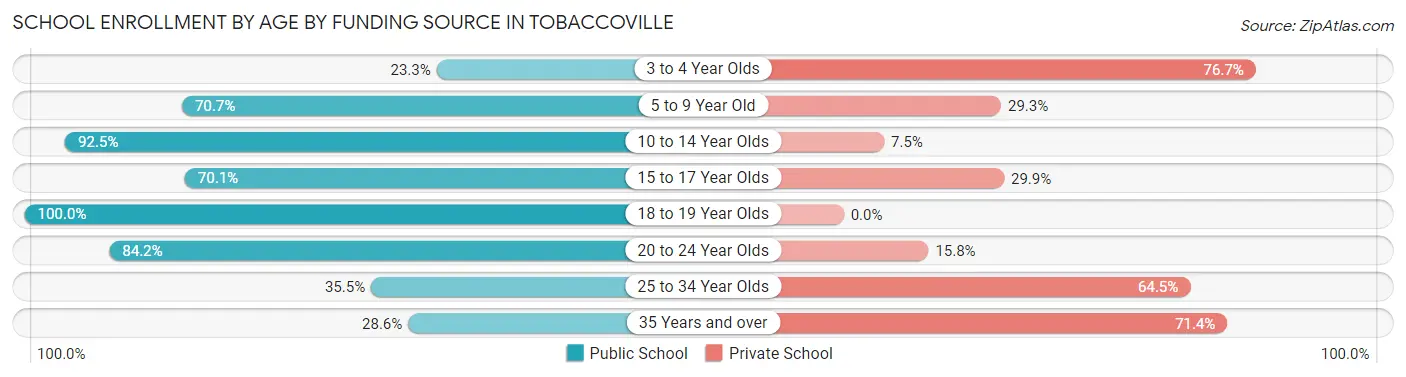
| Age Bracket | Public School | Private School |
| 3 to 4 Year Olds | 47 (23.3%) | 155 (76.7%) |
| 5 to 9 Year Old | 94 (70.7%) | 39 (29.3%) |
| 10 to 14 Year Olds | 135 (92.5%) | 11 (7.5%) |
| 15 to 17 Year Olds | 54 (70.1%) | 23 (29.9%) |
| 18 to 19 Year Olds | 18 (100.0%) | 0 (0.0%) |
| 20 to 24 Year Olds | 32 (84.2%) | 6 (15.8%) |
| 25 to 34 Year Olds | 11 (35.5%) | 20 (64.5%) |
| 35 Years and over | 6 (28.6%) | 15 (71.4%) |
| Total | 397 (59.6%) | 269 (40.4%) |
Educational Attainment by Field of Study in Tobaccoville
Business (87 | 22.6%), engineering (54 | 14.0%), science & technology (39 | 10.1%), education (37 | 9.6%), and psychology (36 | 9.3%) are the most common fields of study among 385 individuals in Tobaccoville who have obtained a bachelor's degree or higher.
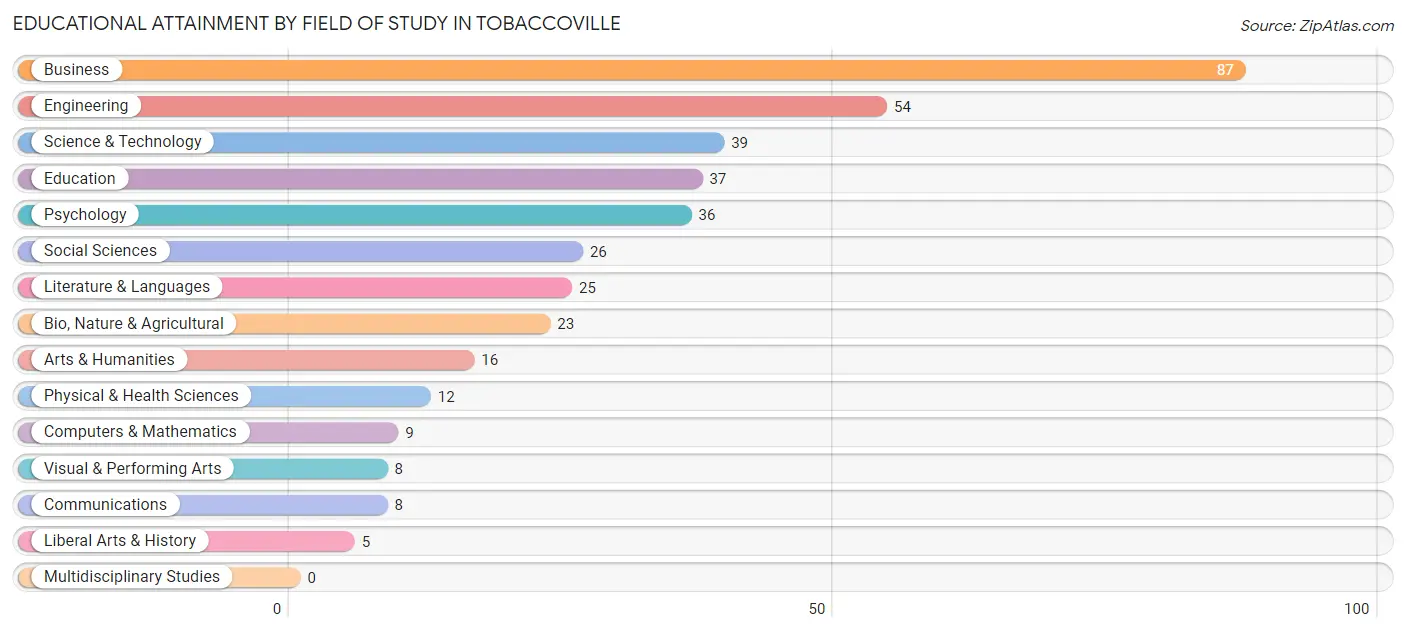
| Field of Study | # Graduates | % Graduates |
| Computers & Mathematics | 9 | 2.3% |
| Bio, Nature & Agricultural | 23 | 6.0% |
| Physical & Health Sciences | 12 | 3.1% |
| Psychology | 36 | 9.3% |
| Social Sciences | 26 | 6.8% |
| Engineering | 54 | 14.0% |
| Multidisciplinary Studies | 0 | 0.0% |
| Science & Technology | 39 | 10.1% |
| Business | 87 | 22.6% |
| Education | 37 | 9.6% |
| Literature & Languages | 25 | 6.5% |
| Liberal Arts & History | 5 | 1.3% |
| Visual & Performing Arts | 8 | 2.1% |
| Communications | 8 | 2.1% |
| Arts & Humanities | 16 | 4.2% |
| Total | 385 | 100.0% |
Transportation & Commute in Tobaccoville
Vehicle Availability by Sex in Tobaccoville
The most prevalent vehicle ownership categories in Tobaccoville are males with 2 vehicles (207, accounting for 37.5%) and females with 2 vehicles (244, making up 37.2%).
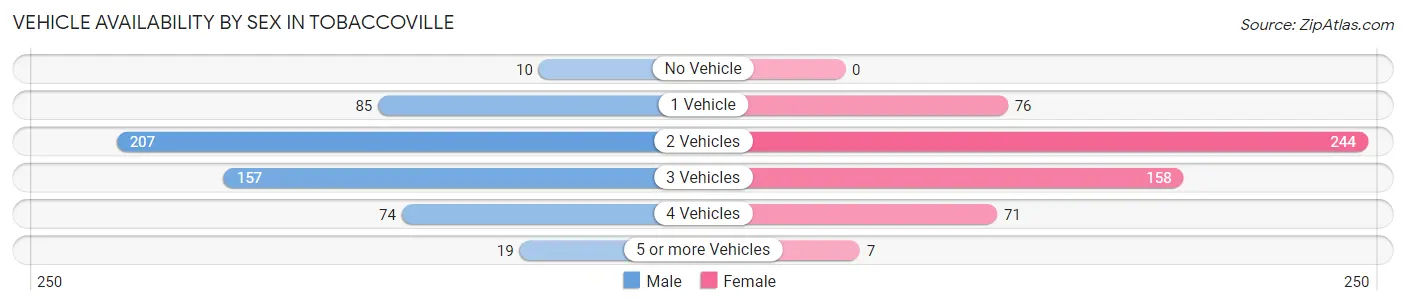
| Vehicles Available | Male | Female |
| No Vehicle | 10 (1.8%) | 0 (0.0%) |
| 1 Vehicle | 85 (15.4%) | 76 (13.7%) |
| 2 Vehicles | 207 (37.5%) | 244 (43.9%) |
| 3 Vehicles | 157 (28.4%) | 158 (28.4%) |
| 4 Vehicles | 74 (13.4%) | 71 (12.8%) |
| 5 or more Vehicles | 19 (3.4%) | 7 (1.3%) |
| Total | 552 (100.0%) | 556 (100.0%) |
Commute Time in Tobaccoville
The most frequently occuring commute durations in Tobaccoville are 20 to 24 minutes (166 commuters, 17.9%), 10 to 14 minutes (162 commuters, 17.5%), and 25 to 29 minutes (159 commuters, 17.1%).
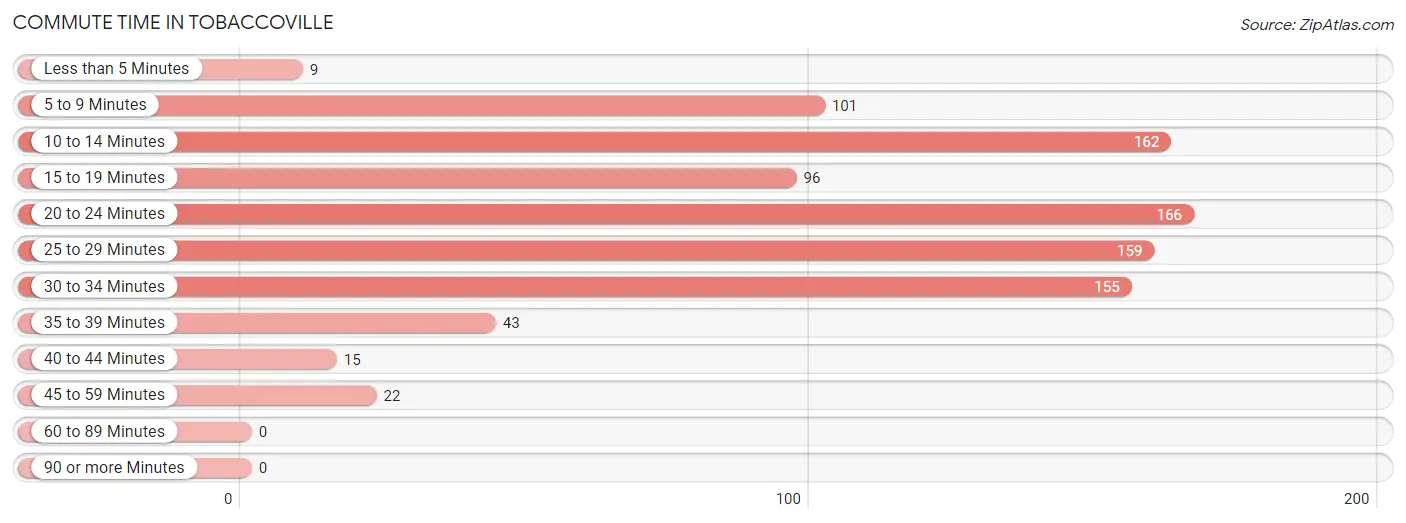
| Commute Time | # Commuters | % Commuters |
| Less than 5 Minutes | 9 | 1.0% |
| 5 to 9 Minutes | 101 | 10.9% |
| 10 to 14 Minutes | 162 | 17.5% |
| 15 to 19 Minutes | 96 | 10.3% |
| 20 to 24 Minutes | 166 | 17.9% |
| 25 to 29 Minutes | 159 | 17.1% |
| 30 to 34 Minutes | 155 | 16.7% |
| 35 to 39 Minutes | 43 | 4.6% |
| 40 to 44 Minutes | 15 | 1.6% |
| 45 to 59 Minutes | 22 | 2.4% |
| 60 to 89 Minutes | 0 | 0.0% |
| 90 or more Minutes | 0 | 0.0% |
Commute Time by Sex in Tobaccoville
The most common commute times in Tobaccoville are 20 to 24 minutes (109 commuters, 23.0%) for males and 25 to 29 minutes (99 commuters, 21.8%) for females.
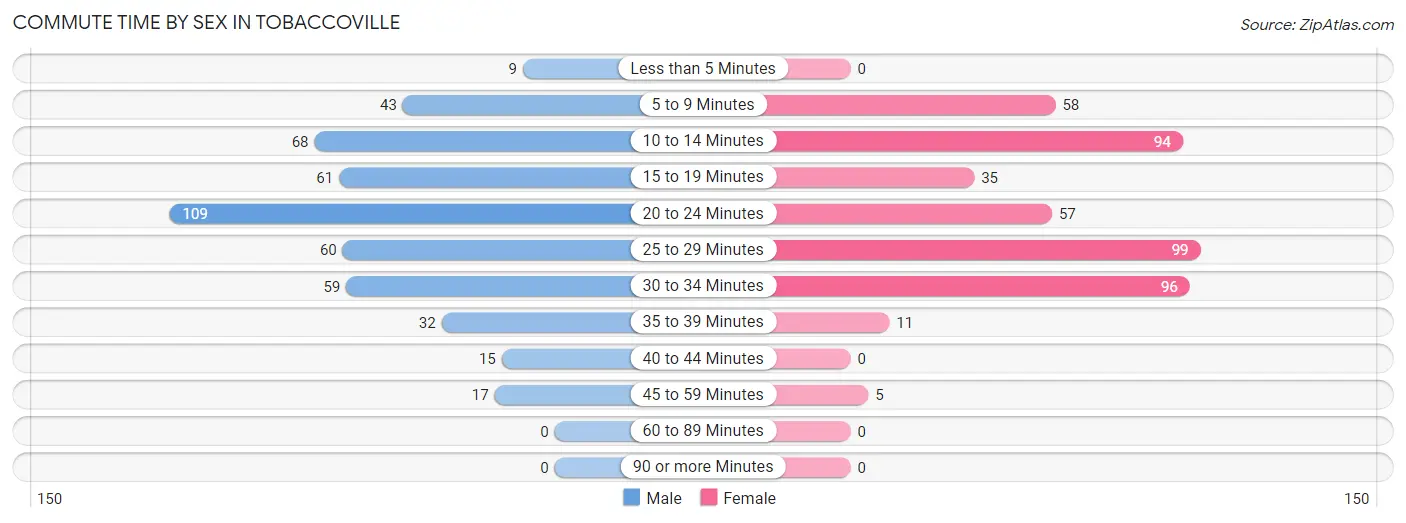
| Commute Time | Male | Female |
| Less than 5 Minutes | 9 (1.9%) | 0 (0.0%) |
| 5 to 9 Minutes | 43 (9.1%) | 58 (12.8%) |
| 10 to 14 Minutes | 68 (14.4%) | 94 (20.7%) |
| 15 to 19 Minutes | 61 (12.9%) | 35 (7.7%) |
| 20 to 24 Minutes | 109 (23.0%) | 57 (12.5%) |
| 25 to 29 Minutes | 60 (12.7%) | 99 (21.8%) |
| 30 to 34 Minutes | 59 (12.5%) | 96 (21.1%) |
| 35 to 39 Minutes | 32 (6.8%) | 11 (2.4%) |
| 40 to 44 Minutes | 15 (3.2%) | 0 (0.0%) |
| 45 to 59 Minutes | 17 (3.6%) | 5 (1.1%) |
| 60 to 89 Minutes | 0 (0.0%) | 0 (0.0%) |
| 90 or more Minutes | 0 (0.0%) | 0 (0.0%) |
Time of Departure to Work by Sex in Tobaccoville
The most frequent times of departure to work in Tobaccoville are 7:30 AM to 7:59 AM (121, 25.6%) for males and 7:30 AM to 7:59 AM (79, 17.4%) for females.
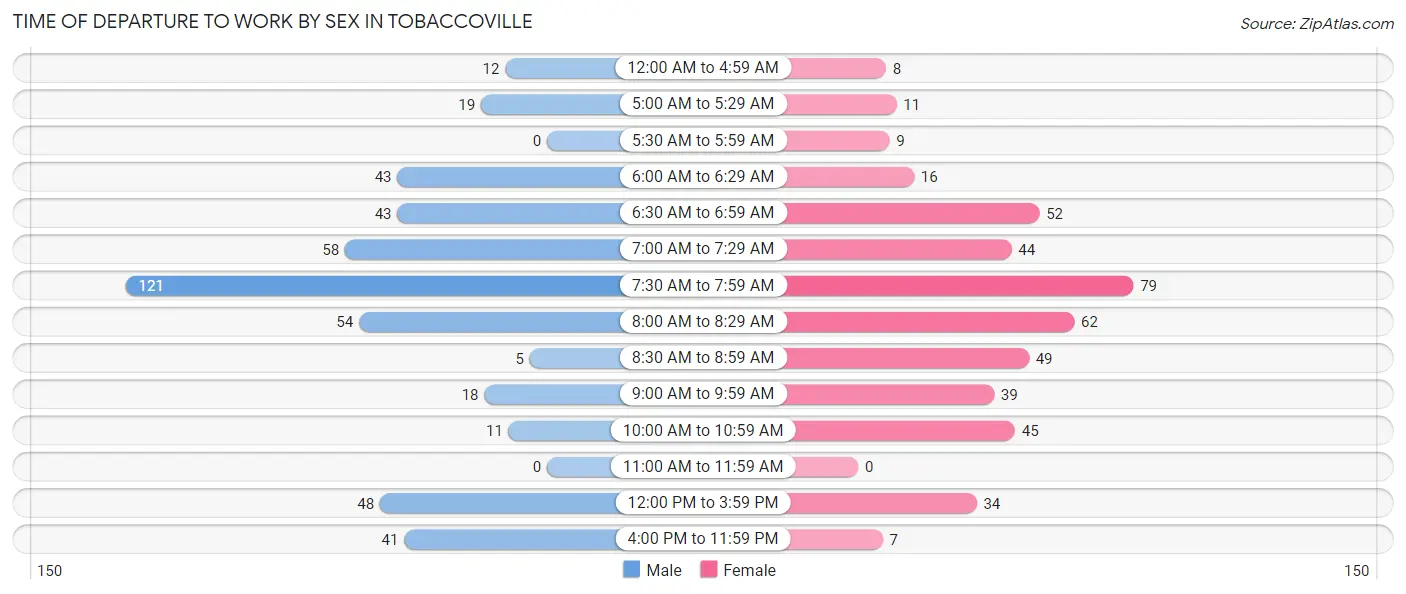
| Time of Departure | Male | Female |
| 12:00 AM to 4:59 AM | 12 (2.5%) | 8 (1.8%) |
| 5:00 AM to 5:29 AM | 19 (4.0%) | 11 (2.4%) |
| 5:30 AM to 5:59 AM | 0 (0.0%) | 9 (2.0%) |
| 6:00 AM to 6:29 AM | 43 (9.1%) | 16 (3.5%) |
| 6:30 AM to 6:59 AM | 43 (9.1%) | 52 (11.4%) |
| 7:00 AM to 7:29 AM | 58 (12.3%) | 44 (9.7%) |
| 7:30 AM to 7:59 AM | 121 (25.6%) | 79 (17.4%) |
| 8:00 AM to 8:29 AM | 54 (11.4%) | 62 (13.6%) |
| 8:30 AM to 8:59 AM | 5 (1.1%) | 49 (10.8%) |
| 9:00 AM to 9:59 AM | 18 (3.8%) | 39 (8.6%) |
| 10:00 AM to 10:59 AM | 11 (2.3%) | 45 (9.9%) |
| 11:00 AM to 11:59 AM | 0 (0.0%) | 0 (0.0%) |
| 12:00 PM to 3:59 PM | 48 (10.2%) | 34 (7.5%) |
| 4:00 PM to 11:59 PM | 41 (8.7%) | 7 (1.5%) |
| Total | 473 (100.0%) | 455 (100.0%) |
Housing Occupancy in Tobaccoville
Occupancy by Ownership in Tobaccoville
Of the total 983 dwellings in Tobaccoville, owner-occupied units account for 838 (85.3%), while renter-occupied units make up 145 (14.7%).
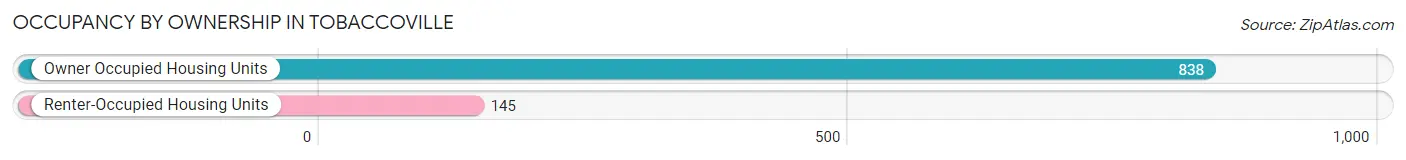
| Occupancy | # Housing Units | % Housing Units |
| Owner Occupied Housing Units | 838 | 85.3% |
| Renter-Occupied Housing Units | 145 | 14.7% |
| Total Occupied Housing Units | 983 | 100.0% |
Occupancy by Household Size in Tobaccoville
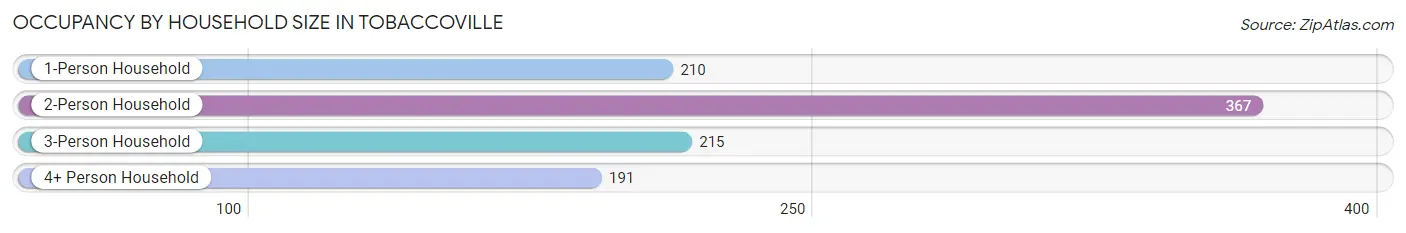
| Household Size | # Housing Units | % Housing Units |
| 1-Person Household | 210 | 21.4% |
| 2-Person Household | 367 | 37.3% |
| 3-Person Household | 215 | 21.9% |
| 4+ Person Household | 191 | 19.4% |
| Total Housing Units | 983 | 100.0% |
Occupancy by Ownership by Household Size in Tobaccoville
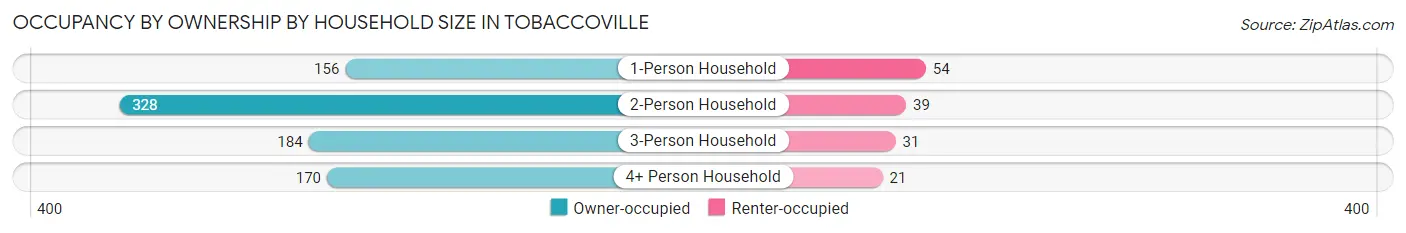
| Household Size | Owner-occupied | Renter-occupied |
| 1-Person Household | 156 (74.3%) | 54 (25.7%) |
| 2-Person Household | 328 (89.4%) | 39 (10.6%) |
| 3-Person Household | 184 (85.6%) | 31 (14.4%) |
| 4+ Person Household | 170 (89.0%) | 21 (11.0%) |
| Total Housing Units | 838 (85.3%) | 145 (14.7%) |
Occupancy by Educational Attainment in Tobaccoville
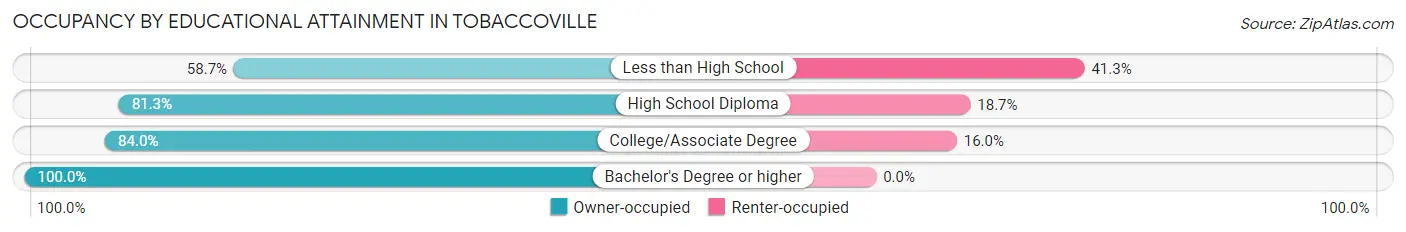
| Household Size | Owner-occupied | Renter-occupied |
| Less than High School | 27 (58.7%) | 19 (41.3%) |
| High School Diploma | 244 (81.3%) | 56 (18.7%) |
| College/Associate Degree | 368 (84.0%) | 70 (16.0%) |
| Bachelor's Degree or higher | 199 (100.0%) | 0 (0.0%) |
Occupancy by Age of Householder in Tobaccoville
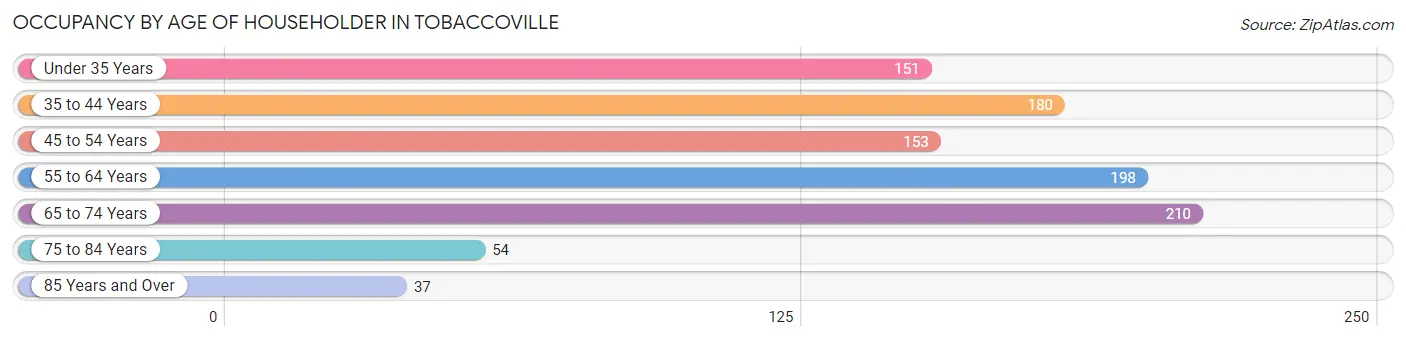
| Age Bracket | # Households | % Households |
| Under 35 Years | 151 | 15.4% |
| 35 to 44 Years | 180 | 18.3% |
| 45 to 54 Years | 153 | 15.6% |
| 55 to 64 Years | 198 | 20.1% |
| 65 to 74 Years | 210 | 21.4% |
| 75 to 84 Years | 54 | 5.5% |
| 85 Years and Over | 37 | 3.8% |
| Total | 983 | 100.0% |
Housing Finances in Tobaccoville
Median Income by Occupancy in Tobaccoville
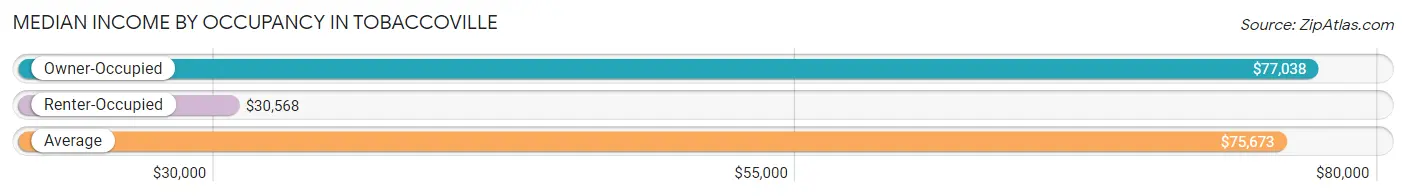
| Occupancy Type | # Households | Median Income |
| Owner-Occupied | 838 (85.3%) | $77,038 |
| Renter-Occupied | 145 (14.7%) | $30,568 |
| Average | 983 (100.0%) | $75,673 |
Occupancy by Householder Income Bracket in Tobaccoville
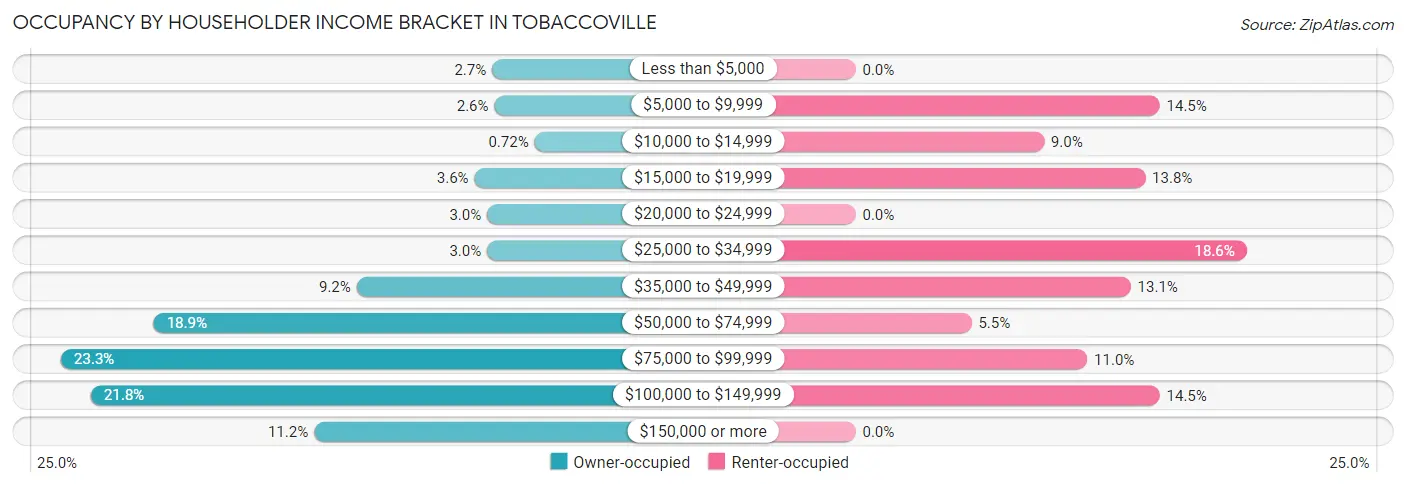
| Income Bracket | Owner-occupied | Renter-occupied |
| Less than $5,000 | 23 (2.7%) | 0 (0.0%) |
| $5,000 to $9,999 | 22 (2.6%) | 21 (14.5%) |
| $10,000 to $14,999 | 6 (0.7%) | 13 (9.0%) |
| $15,000 to $19,999 | 30 (3.6%) | 20 (13.8%) |
| $20,000 to $24,999 | 25 (3.0%) | 0 (0.0%) |
| $25,000 to $34,999 | 25 (3.0%) | 27 (18.6%) |
| $35,000 to $49,999 | 77 (9.2%) | 19 (13.1%) |
| $50,000 to $74,999 | 158 (18.9%) | 8 (5.5%) |
| $75,000 to $99,999 | 195 (23.3%) | 16 (11.0%) |
| $100,000 to $149,999 | 183 (21.8%) | 21 (14.5%) |
| $150,000 or more | 94 (11.2%) | 0 (0.0%) |
| Total | 838 (100.0%) | 145 (100.0%) |
Monthly Housing Cost Tiers in Tobaccoville
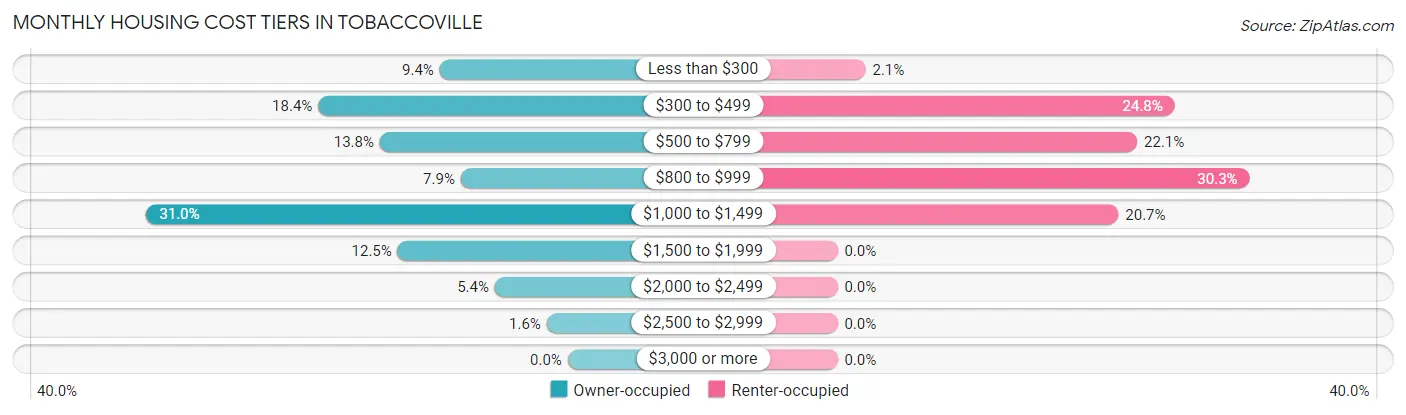
| Monthly Cost | Owner-occupied | Renter-occupied |
| Less than $300 | 79 (9.4%) | 3 (2.1%) |
| $300 to $499 | 154 (18.4%) | 36 (24.8%) |
| $500 to $799 | 116 (13.8%) | 32 (22.1%) |
| $800 to $999 | 66 (7.9%) | 44 (30.3%) |
| $1,000 to $1,499 | 260 (31.0%) | 30 (20.7%) |
| $1,500 to $1,999 | 105 (12.5%) | 0 (0.0%) |
| $2,000 to $2,499 | 45 (5.4%) | 0 (0.0%) |
| $2,500 to $2,999 | 13 (1.5%) | 0 (0.0%) |
| $3,000 or more | 0 (0.0%) | 0 (0.0%) |
| Total | 838 (100.0%) | 145 (100.0%) |
Physical Housing Characteristics in Tobaccoville
Housing Structures in Tobaccoville
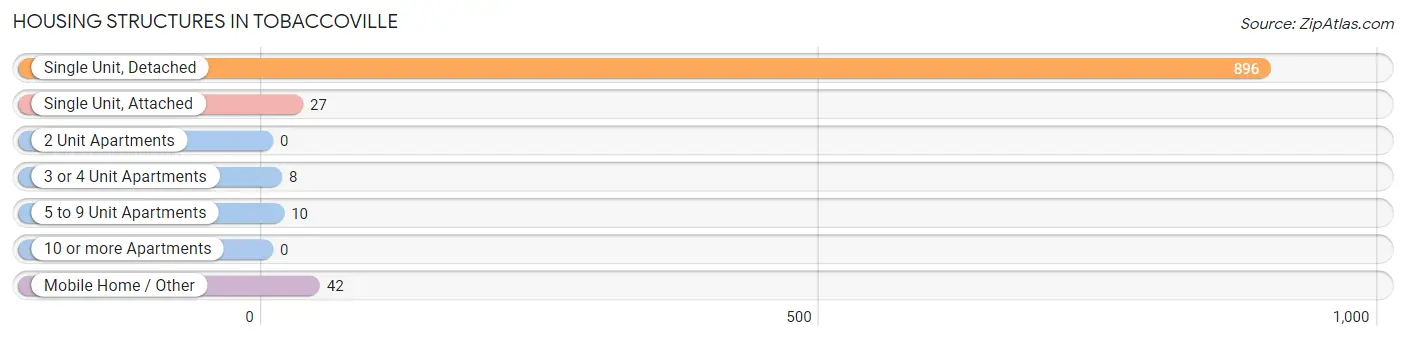
| Structure Type | # Housing Units | % Housing Units |
| Single Unit, Detached | 896 | 91.1% |
| Single Unit, Attached | 27 | 2.8% |
| 2 Unit Apartments | 0 | 0.0% |
| 3 or 4 Unit Apartments | 8 | 0.8% |
| 5 to 9 Unit Apartments | 10 | 1.0% |
| 10 or more Apartments | 0 | 0.0% |
| Mobile Home / Other | 42 | 4.3% |
| Total | 983 | 100.0% |
Housing Structures by Occupancy in Tobaccoville
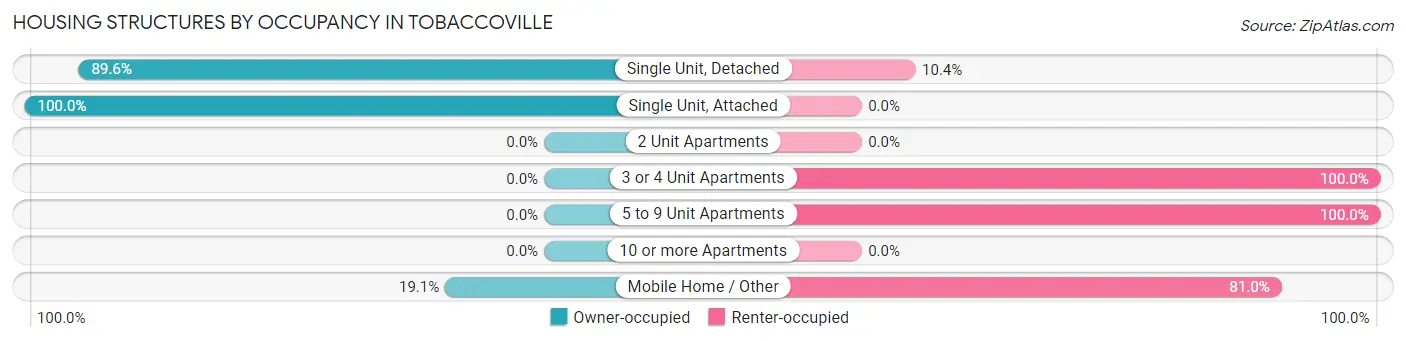
| Structure Type | Owner-occupied | Renter-occupied |
| Single Unit, Detached | 803 (89.6%) | 93 (10.4%) |
| Single Unit, Attached | 27 (100.0%) | 0 (0.0%) |
| 2 Unit Apartments | 0 (0.0%) | 0 (0.0%) |
| 3 or 4 Unit Apartments | 0 (0.0%) | 8 (100.0%) |
| 5 to 9 Unit Apartments | 0 (0.0%) | 10 (100.0%) |
| 10 or more Apartments | 0 (0.0%) | 0 (0.0%) |
| Mobile Home / Other | 8 (19.1%) | 34 (80.9%) |
| Total | 838 (85.3%) | 145 (14.7%) |
Housing Structures by Number of Rooms in Tobaccoville
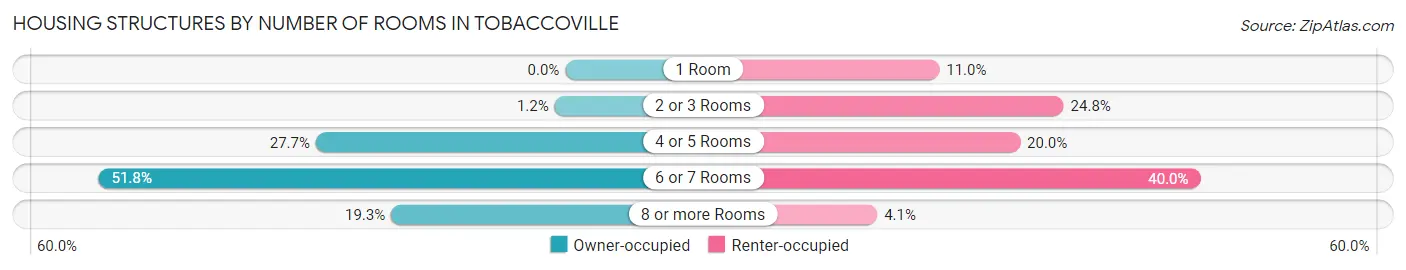
| Number of Rooms | Owner-occupied | Renter-occupied |
| 1 Room | 0 (0.0%) | 16 (11.0%) |
| 2 or 3 Rooms | 10 (1.2%) | 36 (24.8%) |
| 4 or 5 Rooms | 232 (27.7%) | 29 (20.0%) |
| 6 or 7 Rooms | 434 (51.8%) | 58 (40.0%) |
| 8 or more Rooms | 162 (19.3%) | 6 (4.1%) |
| Total | 838 (100.0%) | 145 (100.0%) |
Housing Structure by Heating Type in Tobaccoville
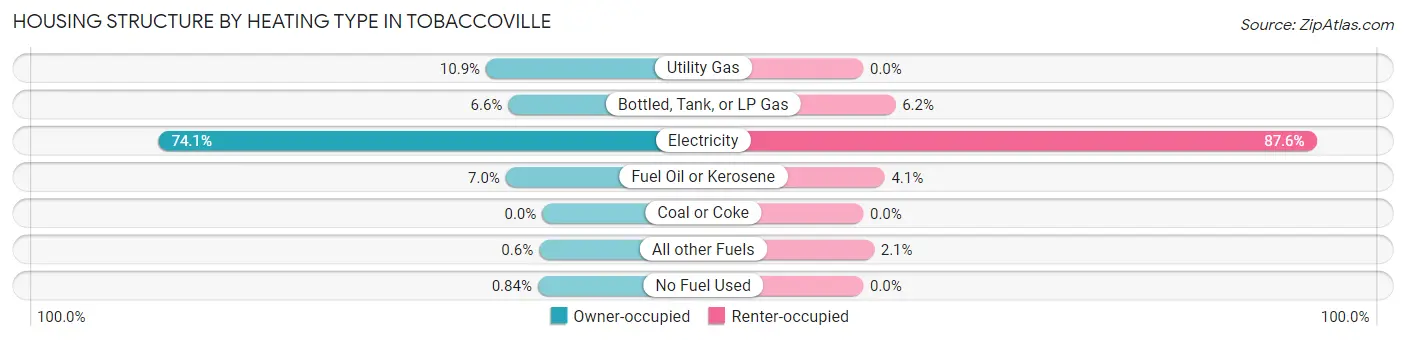
| Heating Type | Owner-occupied | Renter-occupied |
| Utility Gas | 91 (10.9%) | 0 (0.0%) |
| Bottled, Tank, or LP Gas | 55 (6.6%) | 9 (6.2%) |
| Electricity | 621 (74.1%) | 127 (87.6%) |
| Fuel Oil or Kerosene | 59 (7.0%) | 6 (4.1%) |
| Coal or Coke | 0 (0.0%) | 0 (0.0%) |
| All other Fuels | 5 (0.6%) | 3 (2.1%) |
| No Fuel Used | 7 (0.8%) | 0 (0.0%) |
| Total | 838 (100.0%) | 145 (100.0%) |
Household Vehicle Usage in Tobaccoville
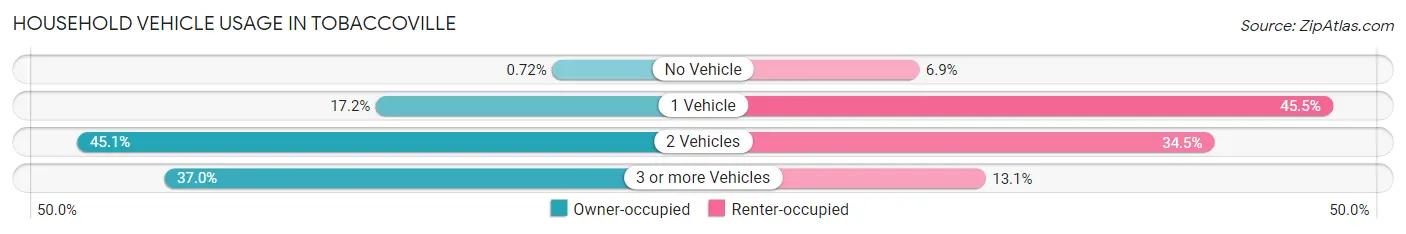
| Vehicles per Household | Owner-occupied | Renter-occupied |
| No Vehicle | 6 (0.7%) | 10 (6.9%) |
| 1 Vehicle | 144 (17.2%) | 66 (45.5%) |
| 2 Vehicles | 378 (45.1%) | 50 (34.5%) |
| 3 or more Vehicles | 310 (37.0%) | 19 (13.1%) |
| Total | 838 (100.0%) | 145 (100.0%) |
Real Estate & Mortgages in Tobaccoville
Real Estate and Mortgage Overview in Tobaccoville
| Characteristic | Without Mortgage | With Mortgage |
| Housing Units | 290 | 548 |
| Median Property Value | $210,500 | $186,800 |
| Median Household Income | $53,611 | $53 |
| Monthly Housing Costs | $429 | $0 |
| Real Estate Taxes | $1,586 | $16 |
Property Value by Mortgage Status in Tobaccoville
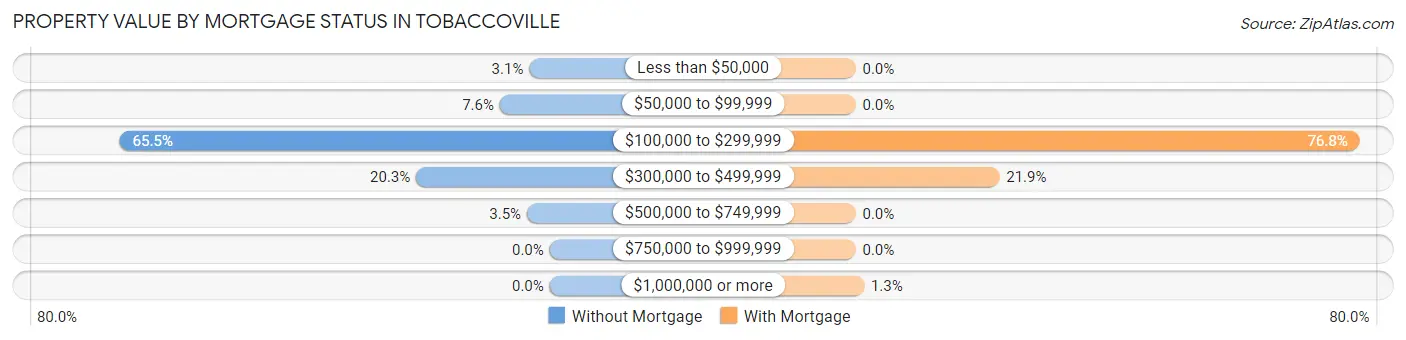
| Property Value | Without Mortgage | With Mortgage |
| Less than $50,000 | 9 (3.1%) | 0 (0.0%) |
| $50,000 to $99,999 | 22 (7.6%) | 0 (0.0%) |
| $100,000 to $299,999 | 190 (65.5%) | 421 (76.8%) |
| $300,000 to $499,999 | 59 (20.3%) | 120 (21.9%) |
| $500,000 to $749,999 | 10 (3.5%) | 0 (0.0%) |
| $750,000 to $999,999 | 0 (0.0%) | 0 (0.0%) |
| $1,000,000 or more | 0 (0.0%) | 7 (1.3%) |
| Total | 290 (100.0%) | 548 (100.0%) |
Household Income by Mortgage Status in Tobaccoville
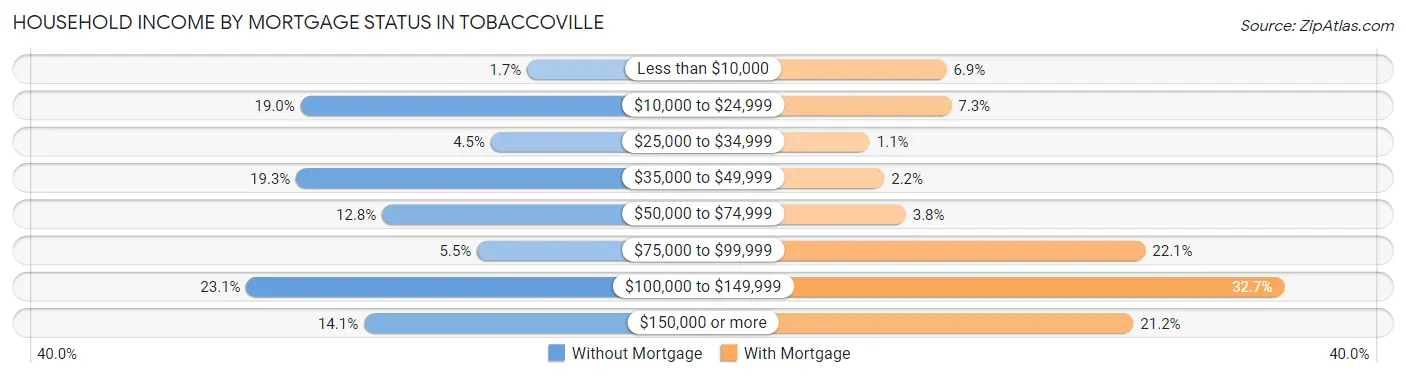
| Household Income | Without Mortgage | With Mortgage |
| Less than $10,000 | 5 (1.7%) | 38 (6.9%) |
| $10,000 to $24,999 | 55 (19.0%) | 40 (7.3%) |
| $25,000 to $34,999 | 13 (4.5%) | 6 (1.1%) |
| $35,000 to $49,999 | 56 (19.3%) | 12 (2.2%) |
| $50,000 to $74,999 | 37 (12.8%) | 21 (3.8%) |
| $75,000 to $99,999 | 16 (5.5%) | 121 (22.1%) |
| $100,000 to $149,999 | 67 (23.1%) | 179 (32.7%) |
| $150,000 or more | 41 (14.1%) | 116 (21.2%) |
| Total | 290 (100.0%) | 548 (100.0%) |
Property Value to Household Income Ratio in Tobaccoville
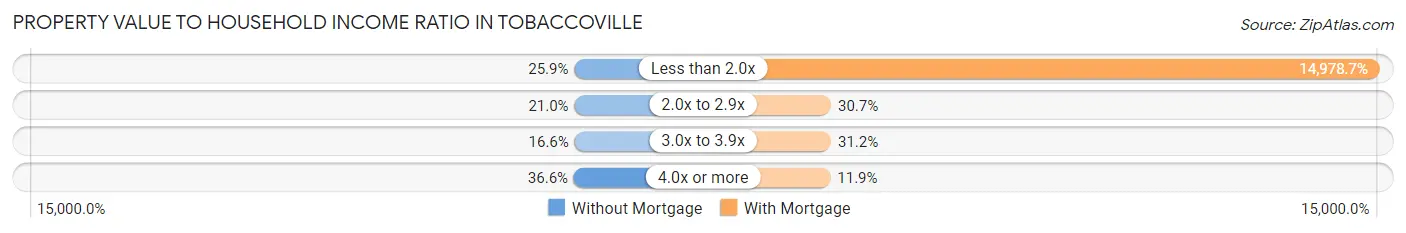
| Value-to-Income Ratio | Without Mortgage | With Mortgage |
| Less than 2.0x | 75 (25.9%) | 82,083 (14,978.6%) |
| 2.0x to 2.9x | 61 (21.0%) | 168 (30.7%) |
| 3.0x to 3.9x | 48 (16.6%) | 171 (31.2%) |
| 4.0x or more | 106 (36.5%) | 65 (11.9%) |
| Total | 290 (100.0%) | 548 (100.0%) |
Real Estate Taxes by Mortgage Status in Tobaccoville
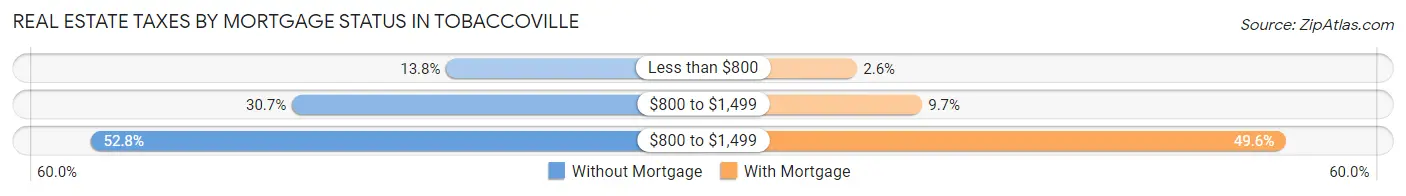
| Property Taxes | Without Mortgage | With Mortgage |
| Less than $800 | 40 (13.8%) | 14 (2.5%) |
| $800 to $1,499 | 89 (30.7%) | 53 (9.7%) |
| $800 to $1,499 | 153 (52.8%) | 272 (49.6%) |
| Total | 290 (100.0%) | 548 (100.0%) |
Health & Disability in Tobaccoville
Health Insurance Coverage by Age in Tobaccoville
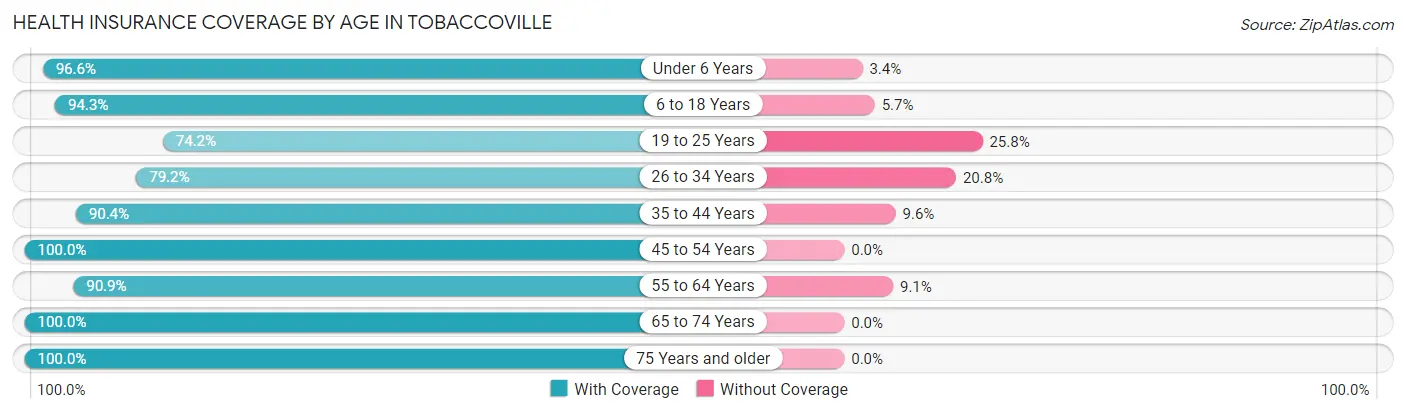
| Age Bracket | With Coverage | Without Coverage |
| Under 6 Years | 343 (96.6%) | 12 (3.4%) |
| 6 to 18 Years | 332 (94.3%) | 20 (5.7%) |
| 19 to 25 Years | 144 (74.2%) | 50 (25.8%) |
| 26 to 34 Years | 209 (79.2%) | 55 (20.8%) |
| 35 to 44 Years | 255 (90.4%) | 27 (9.6%) |
| 45 to 54 Years | 327 (100.0%) | 0 (0.0%) |
| 55 to 64 Years | 350 (90.9%) | 35 (9.1%) |
| 65 to 74 Years | 315 (100.0%) | 0 (0.0%) |
| 75 Years and older | 128 (100.0%) | 0 (0.0%) |
| Total | 2,403 (92.3%) | 199 (7.6%) |
Health Insurance Coverage by Citizenship Status in Tobaccoville
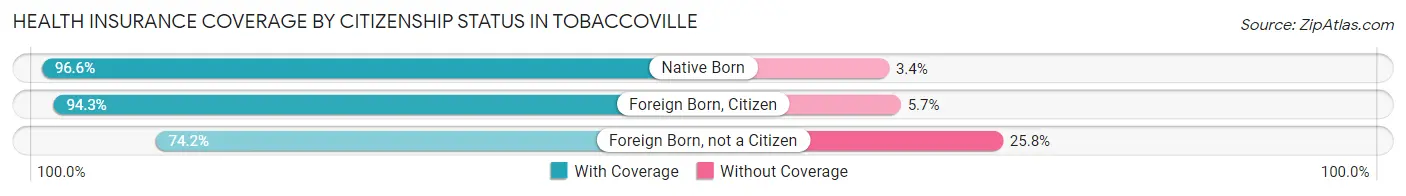
| Citizenship Status | With Coverage | Without Coverage |
| Native Born | 343 (96.6%) | 12 (3.4%) |
| Foreign Born, Citizen | 332 (94.3%) | 20 (5.7%) |
| Foreign Born, not a Citizen | 144 (74.2%) | 50 (25.8%) |
Health Insurance Coverage by Household Income in Tobaccoville
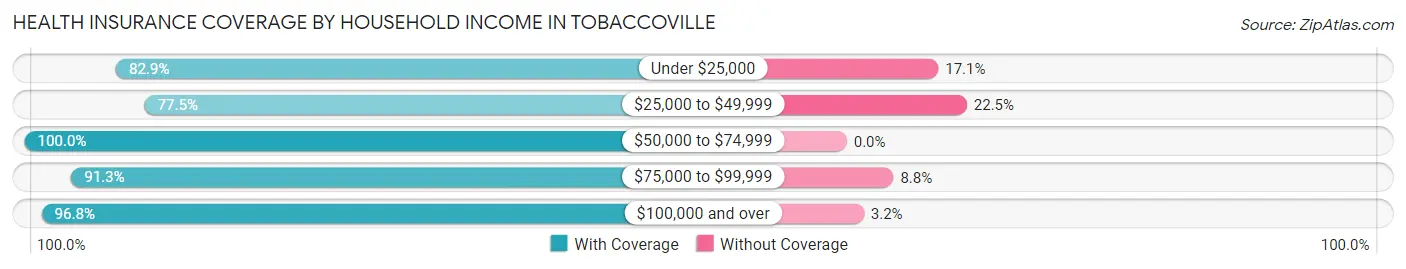
| Household Income | With Coverage | Without Coverage |
| Under $25,000 | 203 (82.9%) | 42 (17.1%) |
| $25,000 to $49,999 | 248 (77.5%) | 72 (22.5%) |
| $50,000 to $74,999 | 490 (100.0%) | 0 (0.0%) |
| $75,000 to $99,999 | 584 (91.2%) | 56 (8.7%) |
| $100,000 and over | 878 (96.8%) | 29 (3.2%) |
Public vs Private Health Insurance Coverage by Age in Tobaccoville
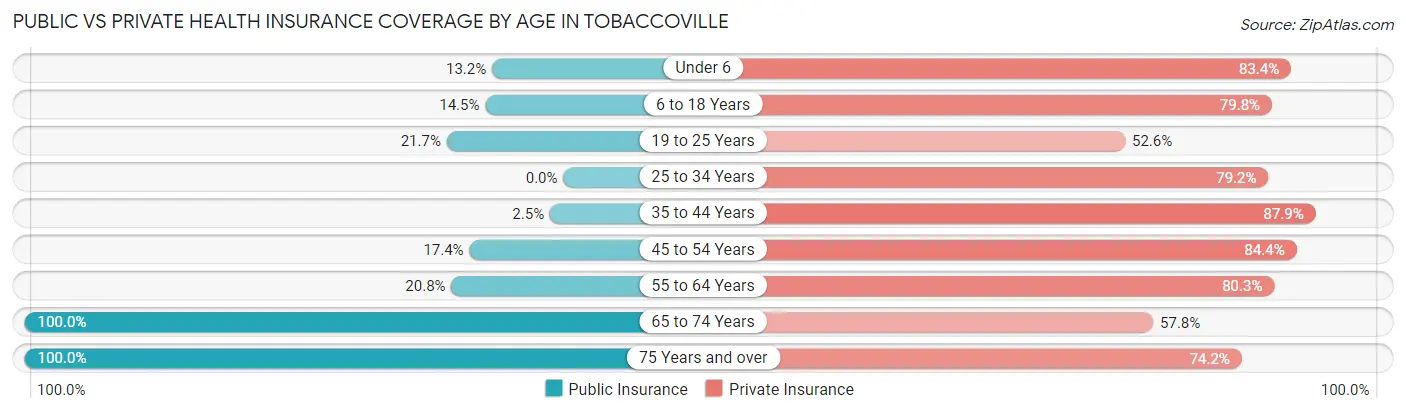
| Age Bracket | Public Insurance | Private Insurance |
| Under 6 | 47 (13.2%) | 296 (83.4%) |
| 6 to 18 Years | 51 (14.5%) | 281 (79.8%) |
| 19 to 25 Years | 42 (21.6%) | 102 (52.6%) |
| 25 to 34 Years | 0 (0.0%) | 209 (79.2%) |
| 35 to 44 Years | 7 (2.5%) | 248 (87.9%) |
| 45 to 54 Years | 57 (17.4%) | 276 (84.4%) |
| 55 to 64 Years | 80 (20.8%) | 309 (80.3%) |
| 65 to 74 Years | 315 (100.0%) | 182 (57.8%) |
| 75 Years and over | 128 (100.0%) | 95 (74.2%) |
| Total | 727 (27.9%) | 1,998 (76.8%) |
Disability Status by Sex by Age in Tobaccoville
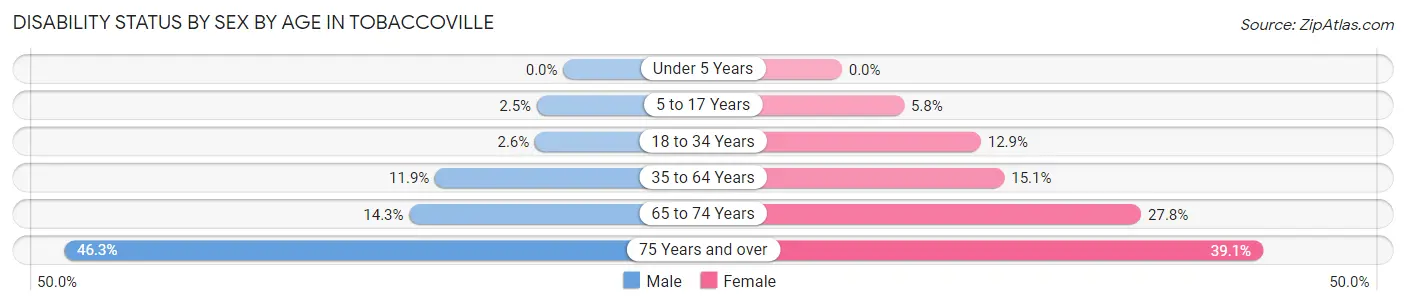
| Age Bracket | Male | Female |
| Under 5 Years | 0 (0.0%) | 0 (0.0%) |
| 5 to 17 Years | 7 (2.5%) | 6 (5.8%) |
| 18 to 34 Years | 5 (2.6%) | 36 (12.9%) |
| 35 to 64 Years | 52 (11.9%) | 84 (15.1%) |
| 65 to 74 Years | 27 (14.3%) | 35 (27.8%) |
| 75 Years and over | 19 (46.3%) | 34 (39.1%) |
Disability Class by Sex by Age in Tobaccoville
Disability Class: Hearing Difficulty
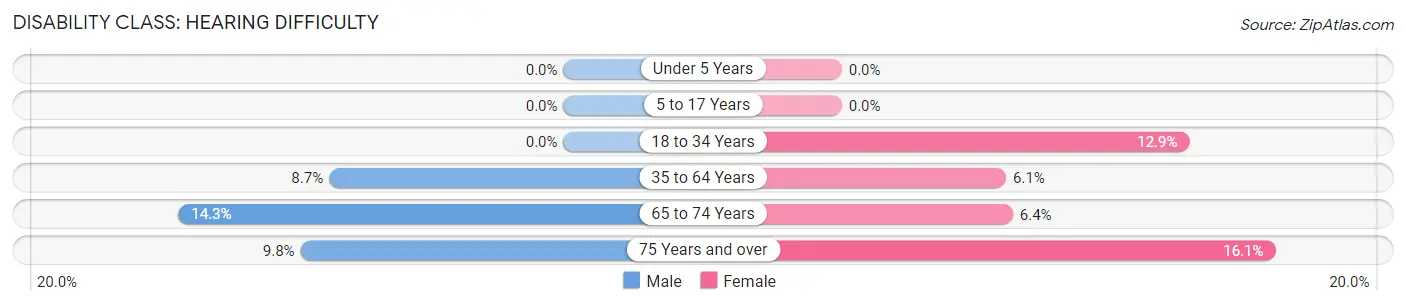
| Age Bracket | Male | Female |
| Under 5 Years | 0 (0.0%) | 0 (0.0%) |
| 5 to 17 Years | 0 (0.0%) | 0 (0.0%) |
| 18 to 34 Years | 0 (0.0%) | 36 (12.9%) |
| 35 to 64 Years | 38 (8.7%) | 34 (6.1%) |
| 65 to 74 Years | 27 (14.3%) | 8 (6.4%) |
| 75 Years and over | 4 (9.8%) | 14 (16.1%) |
Disability Class: Vision Difficulty
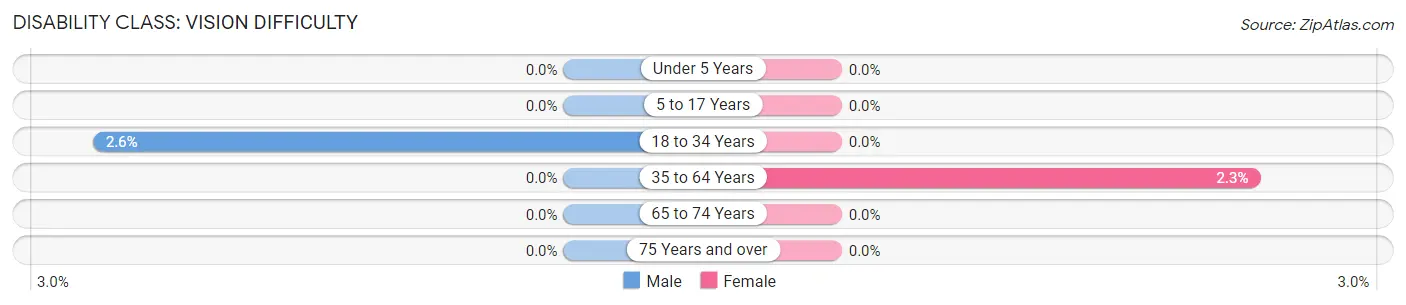
| Age Bracket | Male | Female |
| Under 5 Years | 0 (0.0%) | 0 (0.0%) |
| 5 to 17 Years | 0 (0.0%) | 0 (0.0%) |
| 18 to 34 Years | 5 (2.6%) | 0 (0.0%) |
| 35 to 64 Years | 0 (0.0%) | 13 (2.3%) |
| 65 to 74 Years | 0 (0.0%) | 0 (0.0%) |
| 75 Years and over | 0 (0.0%) | 0 (0.0%) |
Disability Class: Cognitive Difficulty
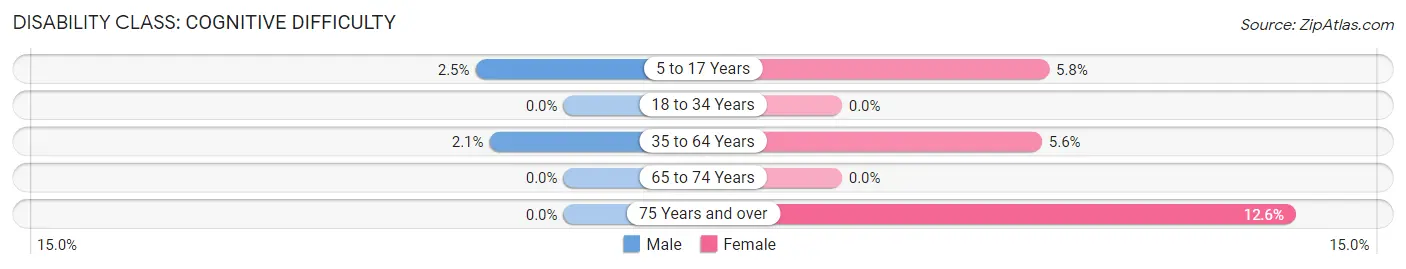
| Age Bracket | Male | Female |
| 5 to 17 Years | 7 (2.5%) | 6 (5.8%) |
| 18 to 34 Years | 0 (0.0%) | 0 (0.0%) |
| 35 to 64 Years | 9 (2.1%) | 31 (5.6%) |
| 65 to 74 Years | 0 (0.0%) | 0 (0.0%) |
| 75 Years and over | 0 (0.0%) | 11 (12.6%) |
Disability Class: Ambulatory Difficulty
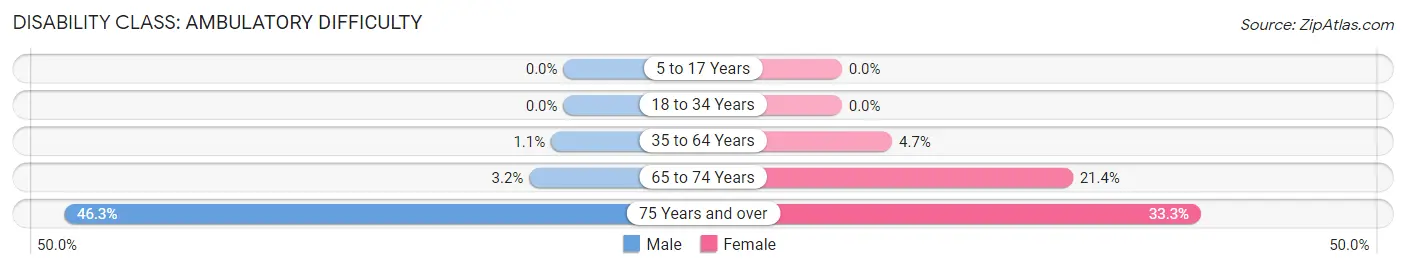
| Age Bracket | Male | Female |
| 5 to 17 Years | 0 (0.0%) | 0 (0.0%) |
| 18 to 34 Years | 0 (0.0%) | 0 (0.0%) |
| 35 to 64 Years | 5 (1.1%) | 26 (4.7%) |
| 65 to 74 Years | 6 (3.2%) | 27 (21.4%) |
| 75 Years and over | 19 (46.3%) | 29 (33.3%) |
Disability Class: Self-Care Difficulty
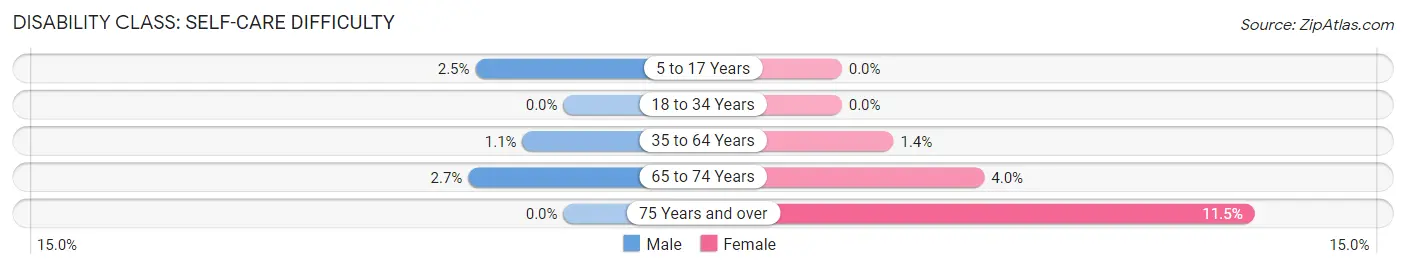
| Age Bracket | Male | Female |
| 5 to 17 Years | 7 (2.5%) | 0 (0.0%) |
| 18 to 34 Years | 0 (0.0%) | 0 (0.0%) |
| 35 to 64 Years | 5 (1.1%) | 8 (1.4%) |
| 65 to 74 Years | 5 (2.6%) | 5 (4.0%) |
| 75 Years and over | 0 (0.0%) | 10 (11.5%) |
Technology Access in Tobaccoville
Computing Device Access in Tobaccoville
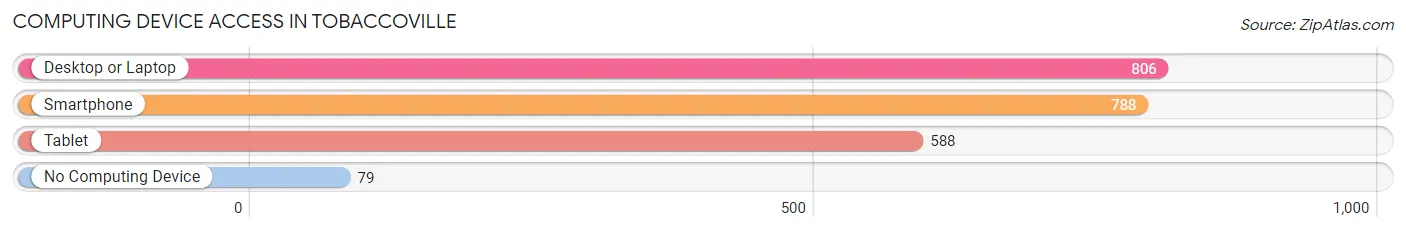
| Device Type | # Households | % Households |
| Desktop or Laptop | 806 | 82.0% |
| Smartphone | 788 | 80.2% |
| Tablet | 588 | 59.8% |
| No Computing Device | 79 | 8.0% |
| Total | 983 | 100.0% |
Internet Access in Tobaccoville
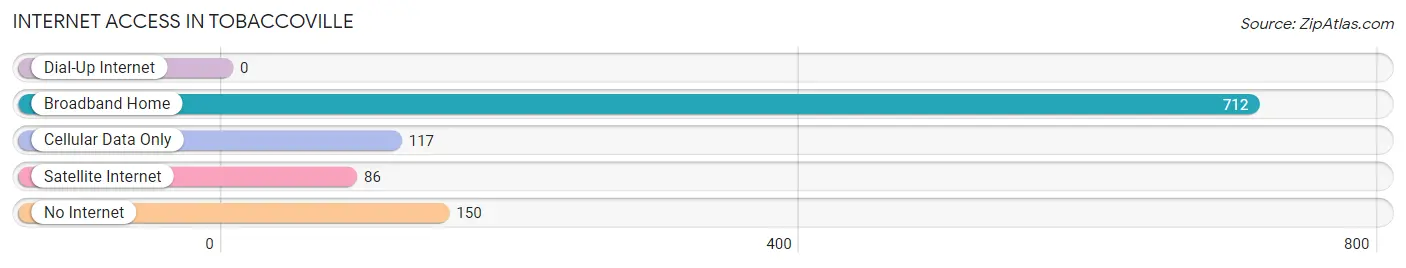
| Internet Type | # Households | % Households |
| Dial-Up Internet | 0 | 0.0% |
| Broadband Home | 712 | 72.4% |
| Cellular Data Only | 117 | 11.9% |
| Satellite Internet | 86 | 8.7% |
| No Internet | 150 | 15.3% |
| Total | 983 | 100.0% |
Tobaccoville Summary
Tobaccoville, North Carolina is a small town located in the foothills of the Blue Ridge Mountains in Forsyth County. The town was founded in 1887 and is named after the tobacco industry that was once prevalent in the area. The town has a population of approximately 1,500 people and is located just north of Winston-Salem.
History
Tobaccoville was founded in 1887 by a group of tobacco farmers who wanted to create a community that was centered around the tobacco industry. The town was originally called “Tobacco Town” but was later changed to Tobaccoville. The town was incorporated in 1891 and the first mayor was elected in 1892.
The town was a major center for the tobacco industry in the early 20th century. The town was home to several tobacco warehouses and factories, as well as a number of tobacco-related businesses. The town was also home to a number of tobacco farmers who grew the crop for sale.
The town experienced a period of decline in the mid-20th century as the tobacco industry began to decline. The town was also affected by the Great Depression and World War II. However, the town has experienced a resurgence in recent years as the tobacco industry has seen a resurgence in popularity.
Geography
Tobaccoville is located in the foothills of the Blue Ridge Mountains in Forsyth County. The town is located just north of Winston-Salem and is bordered by the towns of Kernersville, Walkertown, and Rural Hall. The town is situated on the banks of the Yadkin River and is surrounded by rolling hills and forests.
The town has a total area of 1.2 square miles and is located at an elevation of 890 feet. The town has a humid subtropical climate with hot, humid summers and mild winters.
Economy
Tobaccoville’s economy is largely based on the tobacco industry. The town is home to several tobacco warehouses and factories, as well as a number of tobacco-related businesses. The town is also home to a number of small businesses, including restaurants, retail stores, and service providers.
The town is also home to a number of manufacturing companies, including a furniture manufacturer and a plastics manufacturer. The town is also home to a number of agricultural businesses, including a dairy farm and a number of vegetable farms.
Demographics
Tobaccoville has a population of approximately 1,500 people. The town has a median household income of $41,000 and a median home value of $150,000. The town is predominantly white, with approximately 90% of the population identifying as white. The town also has a small Hispanic population, with approximately 5% of the population identifying as Hispanic.
The town is served by the Winston-Salem/Forsyth County Schools system. The town is also home to a number of churches, including the First Baptist Church of Tobaccoville and the Church of the Good Shepherd.
Conclusion
Tobaccoville, North Carolina is a small town located in the foothills of the Blue Ridge Mountains in Forsyth County. The town was founded in 1887 and is named after the tobacco industry that was once prevalent in the area. The town has a population of approximately 1,500 people and is located just north of Winston-Salem. The town’s economy is largely based on the tobacco industry, as well as a number of small businesses, manufacturing companies, and agricultural businesses. The town is predominantly white, with approximately 90% of the population identifying as white. The town is served by the Winston-Salem/Forsyth County Schools system and is home to a number of churches.
Common Questions
What is Per Capita Income in Tobaccoville?
Per Capita income in Tobaccoville is $30,316.
What is the Median Family Income in Tobaccoville?
Median Family Income in Tobaccoville is $77,346.
What is the Median Household income in Tobaccoville?
Median Household Income in Tobaccoville is $75,673.
What is Income or Wage Gap in Tobaccoville?
Income or Wage Gap in Tobaccoville is 22.5%.
Women in Tobaccoville earn 77.5 cents for every dollar earned by a man.
What is Inequality or Gini Index in Tobaccoville?
Inequality or Gini Index in Tobaccoville is 0.36.
What is the Total Population of Tobaccoville?
Total Population of Tobaccoville is 2,602.
What is the Total Male Population of Tobaccoville?
Total Male Population of Tobaccoville is 1,290.
What is the Total Female Population of Tobaccoville?
Total Female Population of Tobaccoville is 1,312.
What is the Ratio of Males per 100 Females in Tobaccoville?
There are 98.32 Males per 100 Females in Tobaccoville.
What is the Ratio of Females per 100 Males in Tobaccoville?
There are 101.71 Females per 100 Males in Tobaccoville.
What is the Median Population Age in Tobaccoville?
Median Population Age in Tobaccoville is 40.2 Years.
What is the Average Family Size in Tobaccoville
Average Family Size in Tobaccoville is 3.0 People.
What is the Average Household Size in Tobaccoville
Average Household Size in Tobaccoville is 2.6 People.
How Large is the Labor Force in Tobaccoville?
There are 1,179 People in the Labor Forcein in Tobaccoville.
What is the Percentage of People in the Labor Force in Tobaccoville?
59.2% of People are in the Labor Force in Tobaccoville.
What is the Unemployment Rate in Tobaccoville?
Unemployment Rate in Tobaccoville is 4.0%.