Stoneville, NC Map & Demographics
Stoneville Map
Stoneville Overview
$25,424
PER CAPITA INCOME
$51,728
AVG FAMILY INCOME
$50,661
AVG HOUSEHOLD INCOME
$11,396
FAMILY INCOME DEFICIT
0.45
INEQUALITY / GINI INDEX
1,052
TOTAL POPULATION
481
MALE POPULATION
571
FEMALE POPULATION
84.24
MALES / 100 FEMALES
118.71
FEMALES / 100 MALES
38.0
MEDIAN AGE
2.7
AVG FAMILY SIZE
2.2
AVG HOUSEHOLD SIZE
518
LABOR FORCE [ PEOPLE ]
63.6%
PERCENT IN LABOR FORCE
6.8%
UNEMPLOYMENT RATE
Stoneville Zip Codes
Stoneville Area Codes
Income in Stoneville
Income Overview in Stoneville
Per Capita Income in Stoneville is $25,424, while median incomes of families and households are $51,728 and $50,661 respectively.
| Characteristic | Number | Measure |
| Per Capita Income | 1,052 | $25,424 |
| Median Family Income | 322 | $51,728 |
| Mean Family Income | 322 | $71,511 |
| Median Household Income | 474 | $50,661 |
| Mean Household Income | 474 | $60,779 |
| Income Deficit | 322 | $11,396 |
| Wage / Income Gap (%) | 1,052 | 0.00% |
| Wage / Income Gap ($) | 1,052 | 100.00¢ per $1 |
| Gini / Inequality Index | 1,052 | 0.45 |
Earnings by Sex in Stoneville
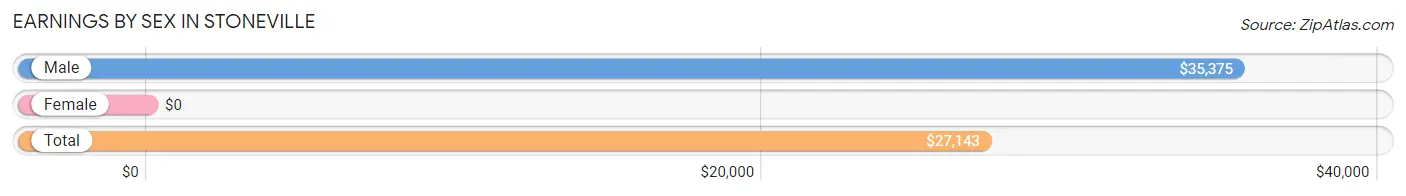
| Sex | Number | Average Earnings |
| Male | 238 (43.4%) | $35,375 |
| Female | 310 (56.6%) | $0 |
| Total | 548 (100.0%) | $27,143 |
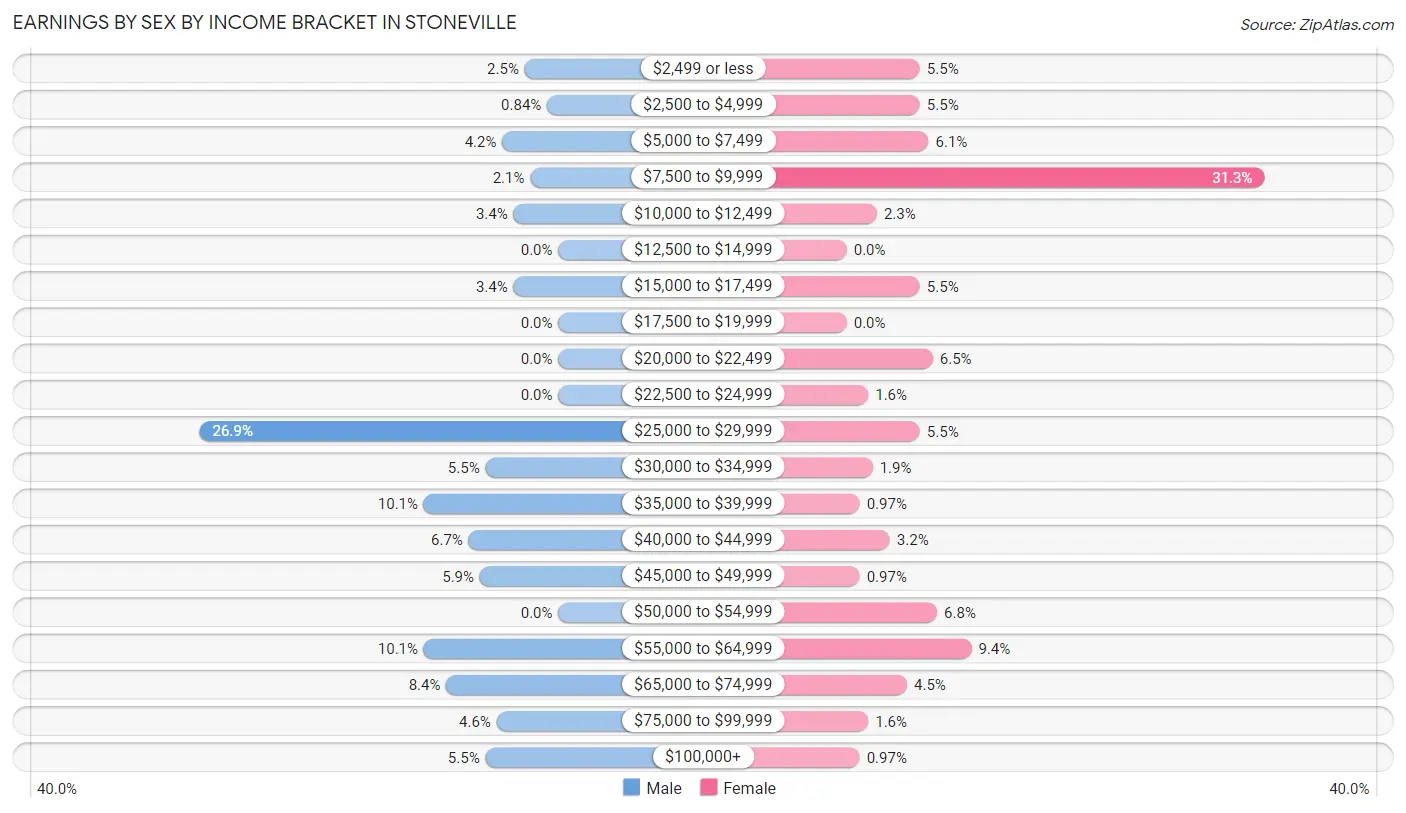
Earnings by Sex by Income Bracket in Stoneville
The most common earnings brackets in Stoneville are $25,000 to $29,999 for men (64 | 26.9%) and $7,500 to $9,999 for women (97 | 31.3%).
| Income | Male | Female |
| $2,499 or less | 6 (2.5%) | 17 (5.5%) |
| $2,500 to $4,999 | 2 (0.8%) | 17 (5.5%) |
| $5,000 to $7,499 | 10 (4.2%) | 19 (6.1%) |
| $7,500 to $9,999 | 5 (2.1%) | 97 (31.3%) |
| $10,000 to $12,499 | 8 (3.4%) | 7 (2.3%) |
| $12,500 to $14,999 | 0 (0.0%) | 0 (0.0%) |
| $15,000 to $17,499 | 8 (3.4%) | 17 (5.5%) |
| $17,500 to $19,999 | 0 (0.0%) | 0 (0.0%) |
| $20,000 to $22,499 | 0 (0.0%) | 20 (6.5%) |
| $22,500 to $24,999 | 0 (0.0%) | 5 (1.6%) |
| $25,000 to $29,999 | 64 (26.9%) | 17 (5.5%) |
| $30,000 to $34,999 | 13 (5.5%) | 6 (1.9%) |
| $35,000 to $39,999 | 24 (10.1%) | 3 (1.0%) |
| $40,000 to $44,999 | 16 (6.7%) | 10 (3.2%) |
| $45,000 to $49,999 | 14 (5.9%) | 3 (1.0%) |
| $50,000 to $54,999 | 0 (0.0%) | 21 (6.8%) |
| $55,000 to $64,999 | 24 (10.1%) | 29 (9.3%) |
| $65,000 to $74,999 | 20 (8.4%) | 14 (4.5%) |
| $75,000 to $99,999 | 11 (4.6%) | 5 (1.6%) |
| $100,000+ | 13 (5.5%) | 3 (1.0%) |
| Total | 238 (100.0%) | 310 (100.0%) |
Earnings by Sex by Educational Attainment in Stoneville
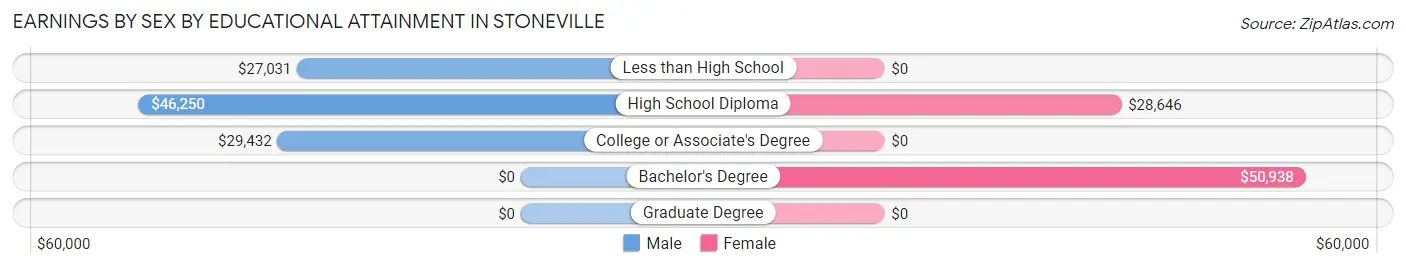
| Educational Attainment | Male Income | Female Income |
| Less than High School | $27,031 | $0 |
| High School Diploma | $46,250 | $28,646 |
| College or Associate's Degree | $29,432 | $0 |
| Bachelor's Degree | - | - |
| Graduate Degree | - | - |
| Total | $37,188 | $0 |
Family Income in Stoneville
Family Income Brackets in Stoneville
According to the Stoneville family income data, there are 114 families falling into the $50,000 to $74,999 income range, which is the most common income bracket and makes up 35.4% of all families. Conversely, the $10,000 to $14,999 income bracket is the least frequent group with only 2 families (0.6%) belonging to this category.
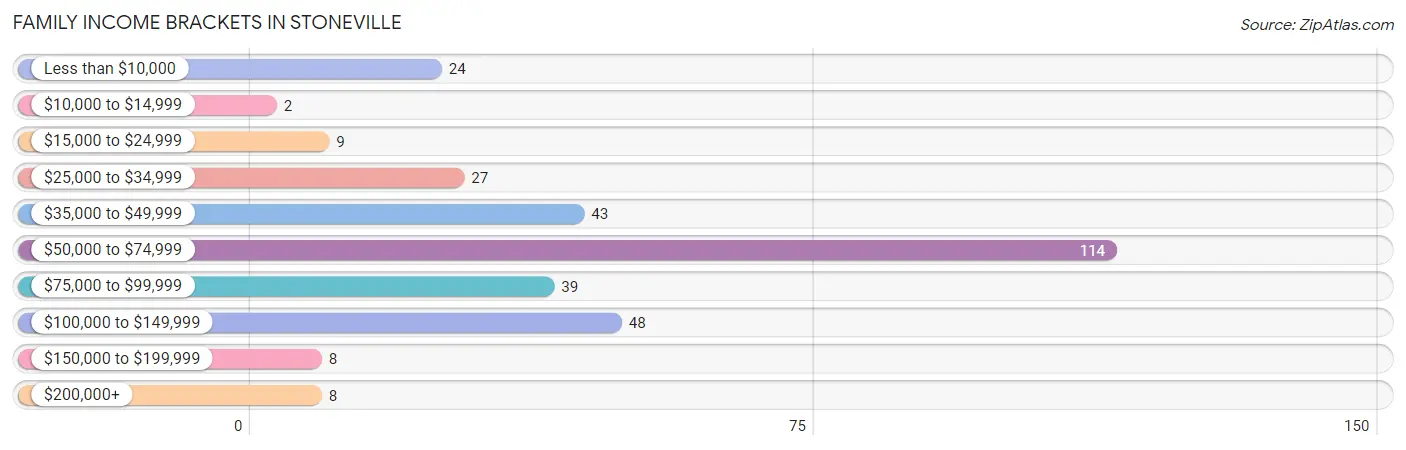
| Income Bracket | # Families | % Families |
| Less than $10,000 | 24 | 7.5% |
| $10,000 to $14,999 | 2 | 0.6% |
| $15,000 to $24,999 | 9 | 2.8% |
| $25,000 to $34,999 | 27 | 8.4% |
| $35,000 to $49,999 | 43 | 13.4% |
| $50,000 to $74,999 | 114 | 35.4% |
| $75,000 to $99,999 | 39 | 12.1% |
| $100,000 to $149,999 | 48 | 14.9% |
| $150,000 to $199,999 | 8 | 2.5% |
| $200,000+ | 8 | 2.5% |
Family Income by Famaliy Size in Stoneville
3-person families (69 | 21.4%) account for the highest median family income in Stoneville with $86,250 per family, while 2-person families (100 | 31.1%) have the highest median income of $32,500 per family member.
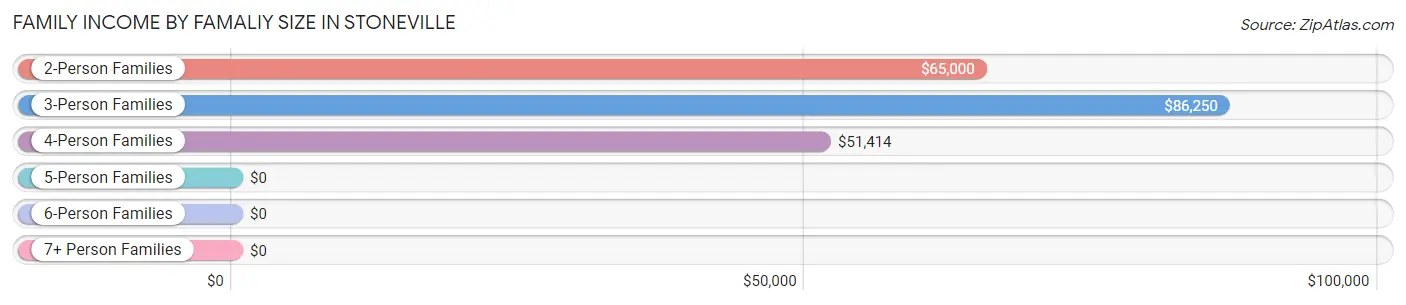
| Income Bracket | # Families | Median Income |
| 2-Person Families | 100 (31.1%) | $65,000 |
| 3-Person Families | 69 (21.4%) | $86,250 |
| 4-Person Families | 118 (36.6%) | $51,414 |
| 5-Person Families | 19 (5.9%) | $0 |
| 6-Person Families | 16 (5.0%) | $0 |
| 7+ Person Families | 0 (0.0%) | $0 |
| Total | 322 (100.0%) | $51,728 |
Family Income by Number of Earners in Stoneville
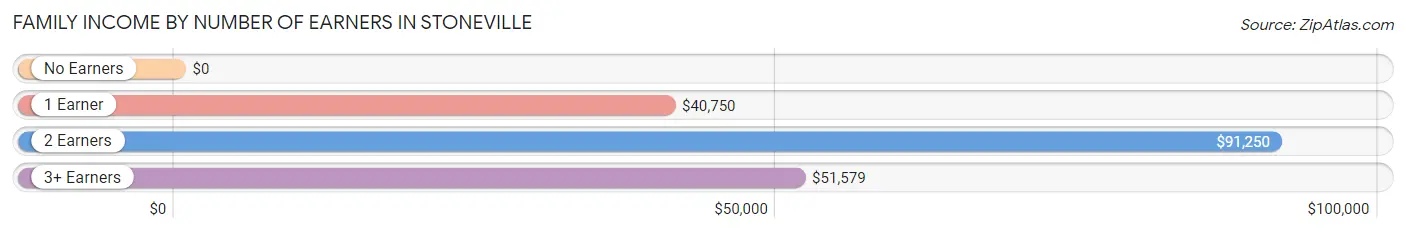
| Number of Earners | # Families | Median Income |
| No Earners | 36 (11.2%) | $0 |
| 1 Earner | 96 (29.8%) | $40,750 |
| 2 Earners | 94 (29.2%) | $91,250 |
| 3+ Earners | 96 (29.8%) | $51,579 |
| Total | 322 (100.0%) | $51,728 |
Household Income in Stoneville
Household Income Brackets in Stoneville
With 129 households falling in the category, the $50,000 to $74,999 income range is the most frequent in Stoneville, accounting for 27.2% of all households. In contrast, only 8 households (1.7%) fall into the $200,000+ income bracket, making it the least populous group.
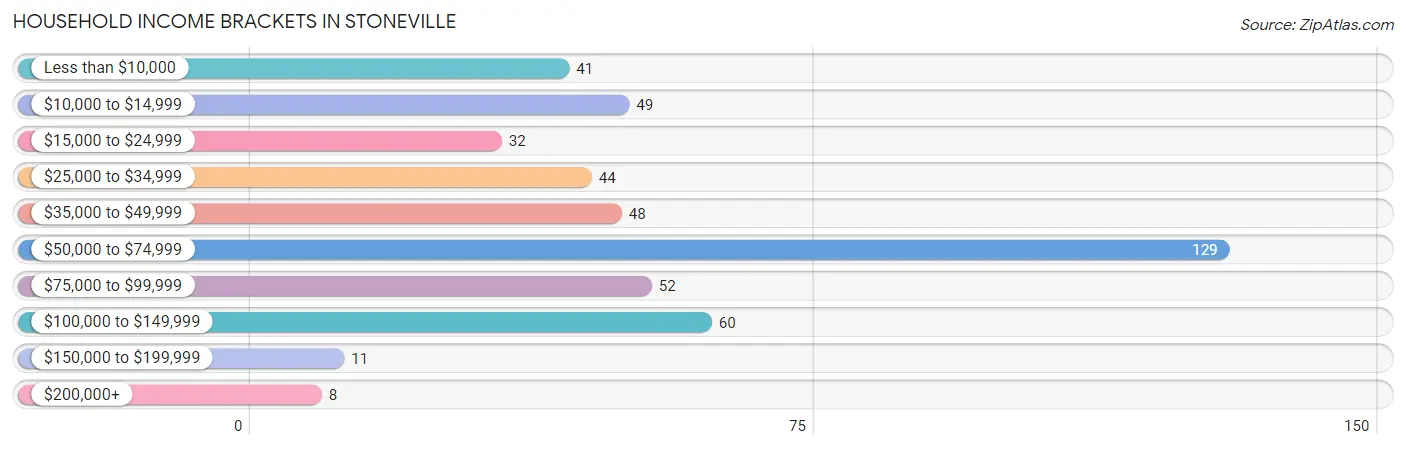
| Income Bracket | # Households | % Households |
| Less than $10,000 | 41 | 8.6% |
| $10,000 to $14,999 | 49 | 10.3% |
| $15,000 to $24,999 | 32 | 6.8% |
| $25,000 to $34,999 | 44 | 9.3% |
| $35,000 to $49,999 | 48 | 10.1% |
| $50,000 to $74,999 | 129 | 27.2% |
| $75,000 to $99,999 | 52 | 11.0% |
| $100,000 to $149,999 | 60 | 12.7% |
| $150,000 to $199,999 | 11 | 2.3% |
| $200,000+ | 8 | 1.7% |
Household Income by Householder Age in Stoneville
The median household income in Stoneville is $50,661, with the highest median household income of $53,750 found in the 65+ years age bracket for the primary householder. A total of 97 households (20.5%) fall into this category. Meanwhile, the 45 to 64 years age bracket for the primary householder has the lowest median household income of $38,696, with 170 households (35.9%) in this group.
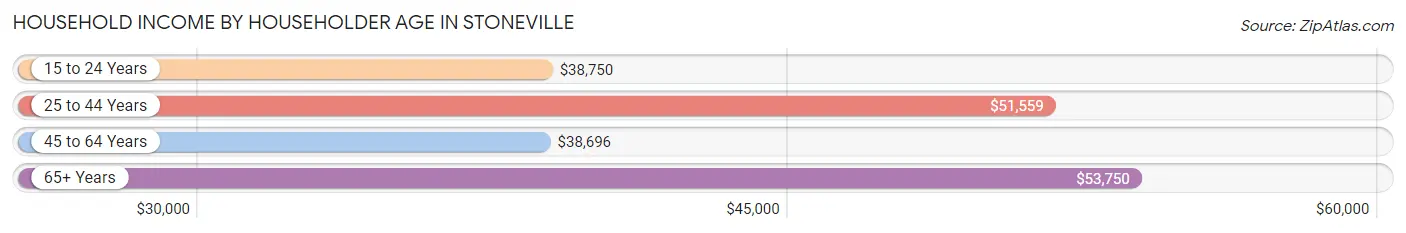
| Income Bracket | # Households | Median Income |
| 15 to 24 Years | 16 (3.4%) | $38,750 |
| 25 to 44 Years | 191 (40.3%) | $51,559 |
| 45 to 64 Years | 170 (35.9%) | $38,696 |
| 65+ Years | 97 (20.5%) | $53,750 |
| Total | 474 (100.0%) | $50,661 |
Poverty in Stoneville
Income Below Poverty by Sex and Age in Stoneville
With 19.4% poverty level for males and 27.7% for females among the residents of Stoneville, under 5 year old males and 6 to 11 year old females are the most vulnerable to poverty, with 32 males (51.6%) and 27 females (87.1%) in their respective age groups living below the poverty level.
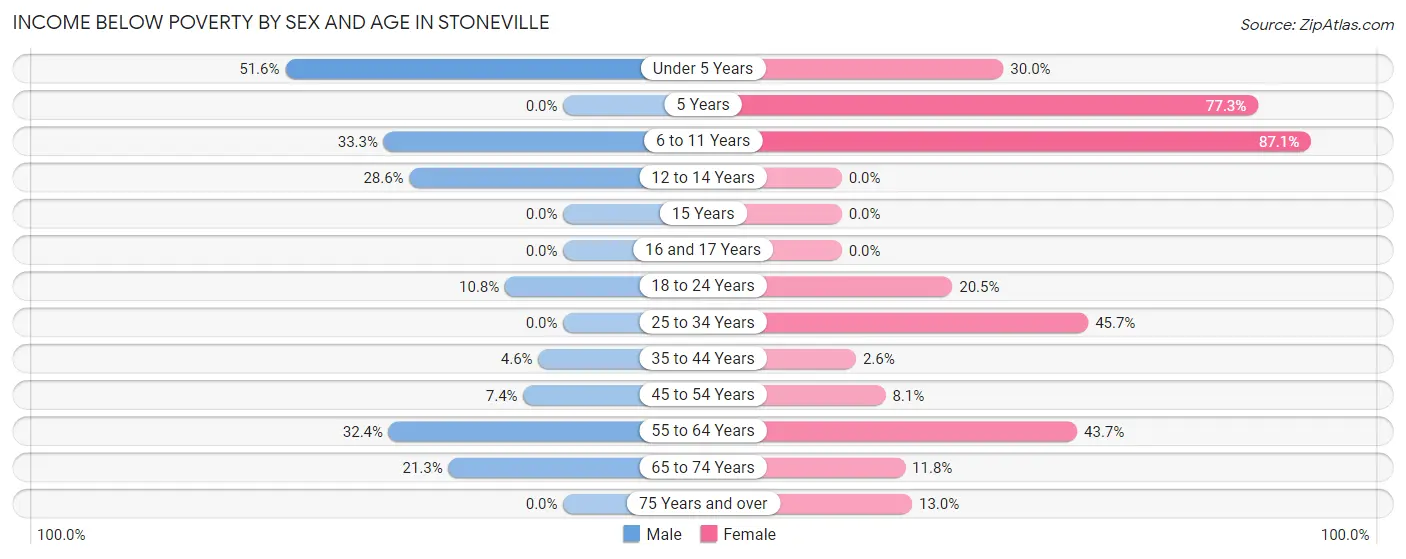
| Age Bracket | Male | Female |
| Under 5 Years | 32 (51.6%) | 12 (30.0%) |
| 5 Years | 0 (0.0%) | 17 (77.3%) |
| 6 to 11 Years | 5 (33.3%) | 27 (87.1%) |
| 12 to 14 Years | 8 (28.6%) | 0 (0.0%) |
| 15 Years | 0 (0.0%) | 0 (0.0%) |
| 16 and 17 Years | 0 (0.0%) | 0 (0.0%) |
| 18 to 24 Years | 4 (10.8%) | 8 (20.5%) |
| 25 to 34 Years | 0 (0.0%) | 43 (45.7%) |
| 35 to 44 Years | 3 (4.6%) | 3 (2.6%) |
| 45 to 54 Years | 4 (7.4%) | 3 (8.1%) |
| 55 to 64 Years | 23 (32.4%) | 38 (43.7%) |
| 65 to 74 Years | 13 (21.3%) | 4 (11.8%) |
| 75 Years and over | 0 (0.0%) | 3 (13.0%) |
| Total | 92 (19.4%) | 158 (27.7%) |
Income Above Poverty by Sex and Age in Stoneville
According to the poverty statistics in Stoneville, males aged 16 and 17 years and females aged 12 to 14 years are the age groups that are most secure financially, with 100.0% of males and 100.0% of females in these age groups living above the poverty line.
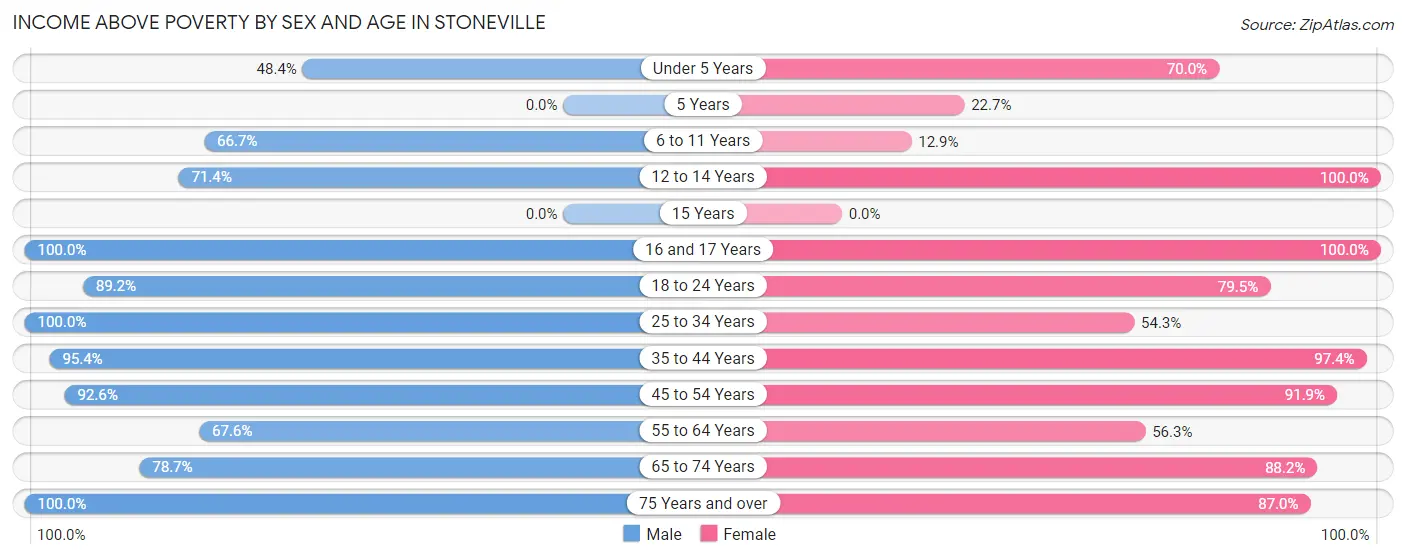
| Age Bracket | Male | Female |
| Under 5 Years | 30 (48.4%) | 28 (70.0%) |
| 5 Years | 0 (0.0%) | 5 (22.7%) |
| 6 to 11 Years | 10 (66.7%) | 4 (12.9%) |
| 12 to 14 Years | 20 (71.4%) | 32 (100.0%) |
| 15 Years | 0 (0.0%) | 0 (0.0%) |
| 16 and 17 Years | 17 (100.0%) | 18 (100.0%) |
| 18 to 24 Years | 33 (89.2%) | 31 (79.5%) |
| 25 to 34 Years | 41 (100.0%) | 51 (54.3%) |
| 35 to 44 Years | 62 (95.4%) | 111 (97.4%) |
| 45 to 54 Years | 50 (92.6%) | 34 (91.9%) |
| 55 to 64 Years | 48 (67.6%) | 49 (56.3%) |
| 65 to 74 Years | 48 (78.7%) | 30 (88.2%) |
| 75 Years and over | 23 (100.0%) | 20 (87.0%) |
| Total | 382 (80.6%) | 413 (72.3%) |
Income Below Poverty Among Married-Couple Families in Stoneville
The poverty statistics for married-couple families in Stoneville show that 4.2% or 9 of the total 214 families live below the poverty line. Families with no children have the highest poverty rate of 9.0%, comprising of 6 families. On the other hand, families with 3 or 4 children have the lowest poverty rate of 0.0%, which includes 0 families.
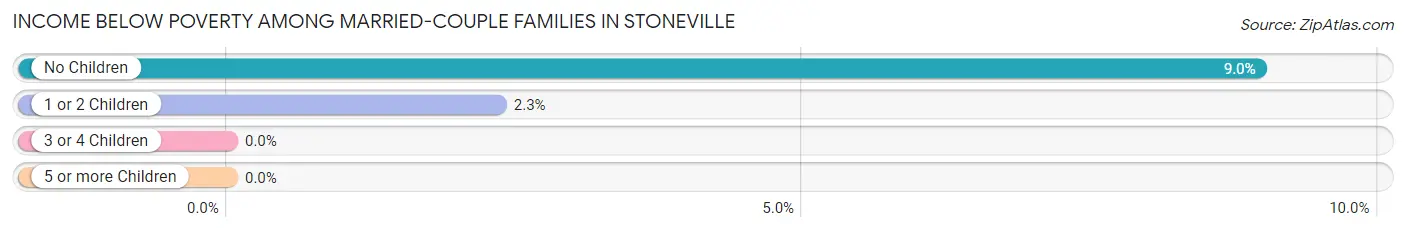
| Children | Above Poverty | Below Poverty |
| No Children | 61 (91.0%) | 6 (9.0%) |
| 1 or 2 Children | 125 (97.7%) | 3 (2.3%) |
| 3 or 4 Children | 19 (100.0%) | 0 (0.0%) |
| 5 or more Children | 0 (0.0%) | 0 (0.0%) |
| Total | 205 (95.8%) | 9 (4.2%) |
Income Below Poverty Among Single-Parent Households in Stoneville
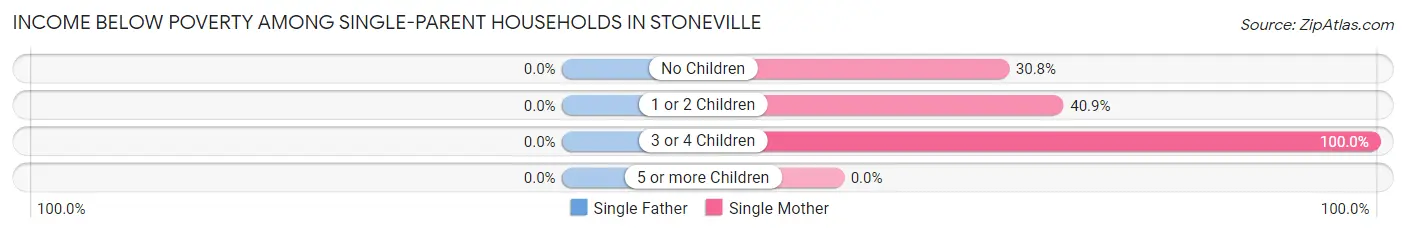
| Children | Single Father | Single Mother |
| No Children | 0 (0.0%) | 8 (30.8%) |
| 1 or 2 Children | 0 (0.0%) | 9 (40.9%) |
| 3 or 4 Children | 0 (0.0%) | 25 (100.0%) |
| 5 or more Children | 0 (0.0%) | 0 (0.0%) |
| Total | 0 (0.0%) | 42 (57.5%) |
Income Below Poverty Among Married-Couple vs Single-Parent Households in Stoneville
The poverty data for Stoneville shows that 9 of the married-couple family households (4.2%) and 42 of the single-parent households (38.9%) are living below the poverty level. Within the married-couple family households, those with no children have the highest poverty rate, with 6 households (9.0%) falling below the poverty line. Among the single-parent households, those with 3 or 4 children have the highest poverty rate, with 25 household (100.0%) living below poverty.
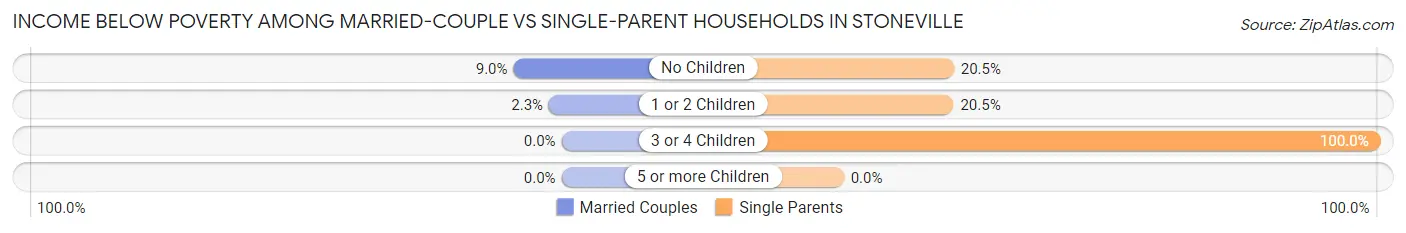
| Children | Married-Couple Families | Single-Parent Households |
| No Children | 6 (9.0%) | 8 (20.5%) |
| 1 or 2 Children | 3 (2.3%) | 9 (20.4%) |
| 3 or 4 Children | 0 (0.0%) | 25 (100.0%) |
| 5 or more Children | 0 (0.0%) | 0 (0.0%) |
| Total | 9 (4.2%) | 42 (38.9%) |
Race in Stoneville
The most populous races in Stoneville are White / Caucasian (804 | 76.4%), Hispanic or Latino (149 | 14.2%), and Two or more Races (98 | 9.3%).
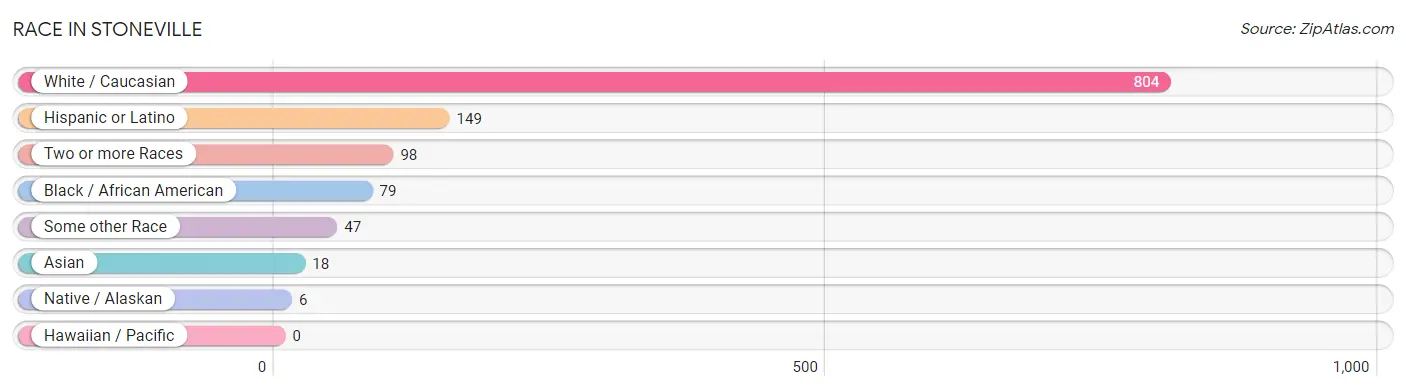
| Race | # Population | % Population |
| Asian | 18 | 1.7% |
| Black / African American | 79 | 7.5% |
| Hawaiian / Pacific | 0 | 0.0% |
| Hispanic or Latino | 149 | 14.2% |
| Native / Alaskan | 6 | 0.6% |
| White / Caucasian | 804 | 76.4% |
| Two or more Races | 98 | 9.3% |
| Some other Race | 47 | 4.5% |
| Total | 1,052 | 100.0% |
Ancestry in Stoneville
The most populous ancestries reported in Stoneville are Irish (187 | 17.8%), American (152 | 14.4%), German (136 | 12.9%), Mexican (136 | 12.9%), and European (90 | 8.6%), together accounting for 66.6% of all Stoneville residents.
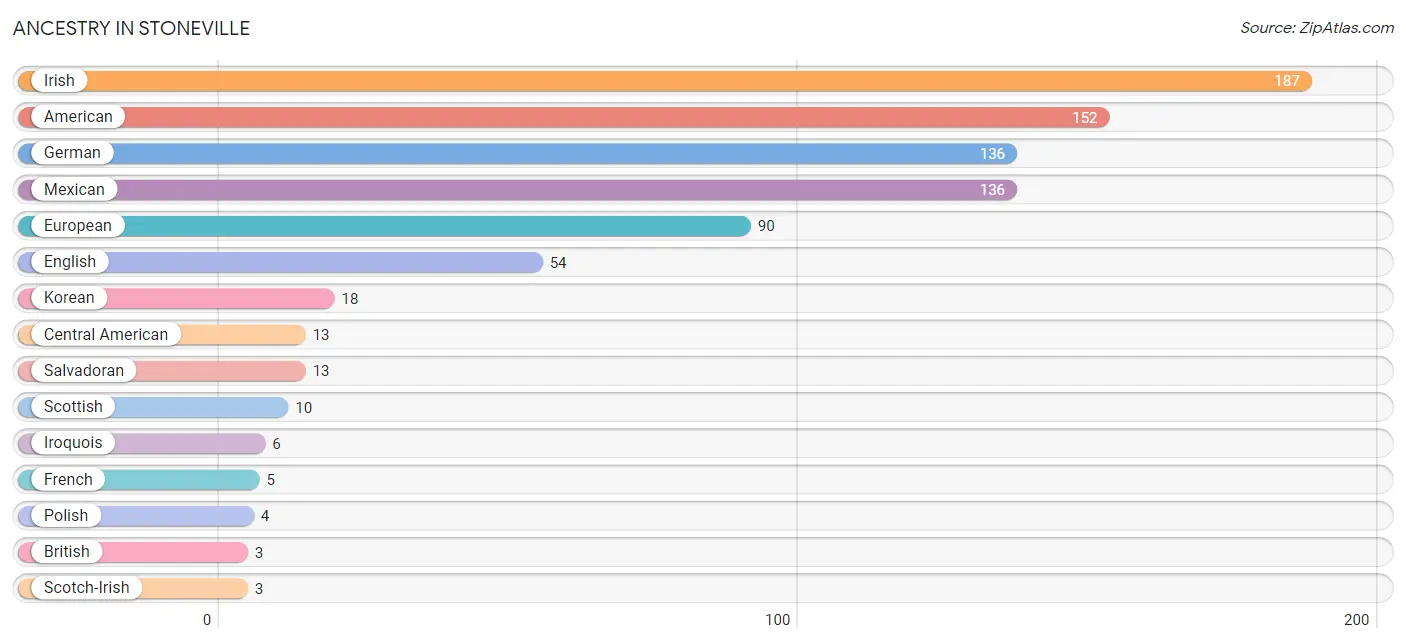
| Ancestry | # Population | % Population |
| American | 152 | 14.4% |
| British | 3 | 0.3% |
| Central American | 13 | 1.2% |
| English | 54 | 5.1% |
| European | 90 | 8.6% |
| French | 5 | 0.5% |
| German | 136 | 12.9% |
| Irish | 187 | 17.8% |
| Iroquois | 6 | 0.6% |
| Korean | 18 | 1.7% |
| Mexican | 136 | 12.9% |
| Polish | 4 | 0.4% |
| Salvadoran | 13 | 1.2% |
| Scotch-Irish | 3 | 0.3% |
| Scottish | 10 | 0.9% | View All 15 Rows |
Immigrants in Stoneville
The most numerous immigrant groups reported in Stoneville came from Central America (27 | 2.6%), Latin America (27 | 2.6%), Asia (18 | 1.7%), Philippines (18 | 1.7%), and South Eastern Asia (18 | 1.7%), together accounting for 10.3% of all Stoneville residents.
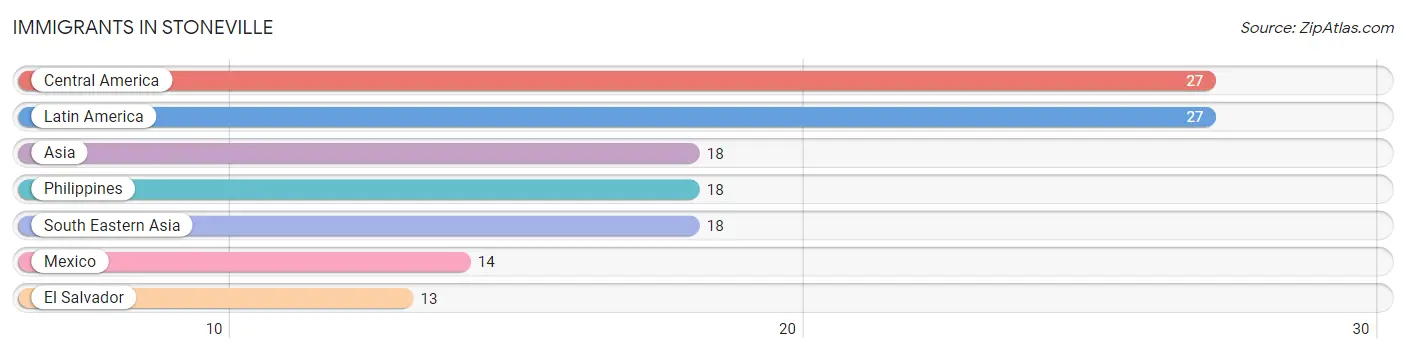
| Immigration Origin | # Population | % Population |
| Asia | 18 | 1.7% |
| Central America | 27 | 2.6% |
| El Salvador | 13 | 1.2% |
| Latin America | 27 | 2.6% |
| Mexico | 14 | 1.3% |
| Philippines | 18 | 1.7% |
| South Eastern Asia | 18 | 1.7% | View All 7 Rows |
Sex and Age in Stoneville
Sex and Age in Stoneville
The most populous age groups in Stoneville are Under 5 Years (69 | 14.3%) for men and 35 to 39 Years (109 | 19.1%) for women.
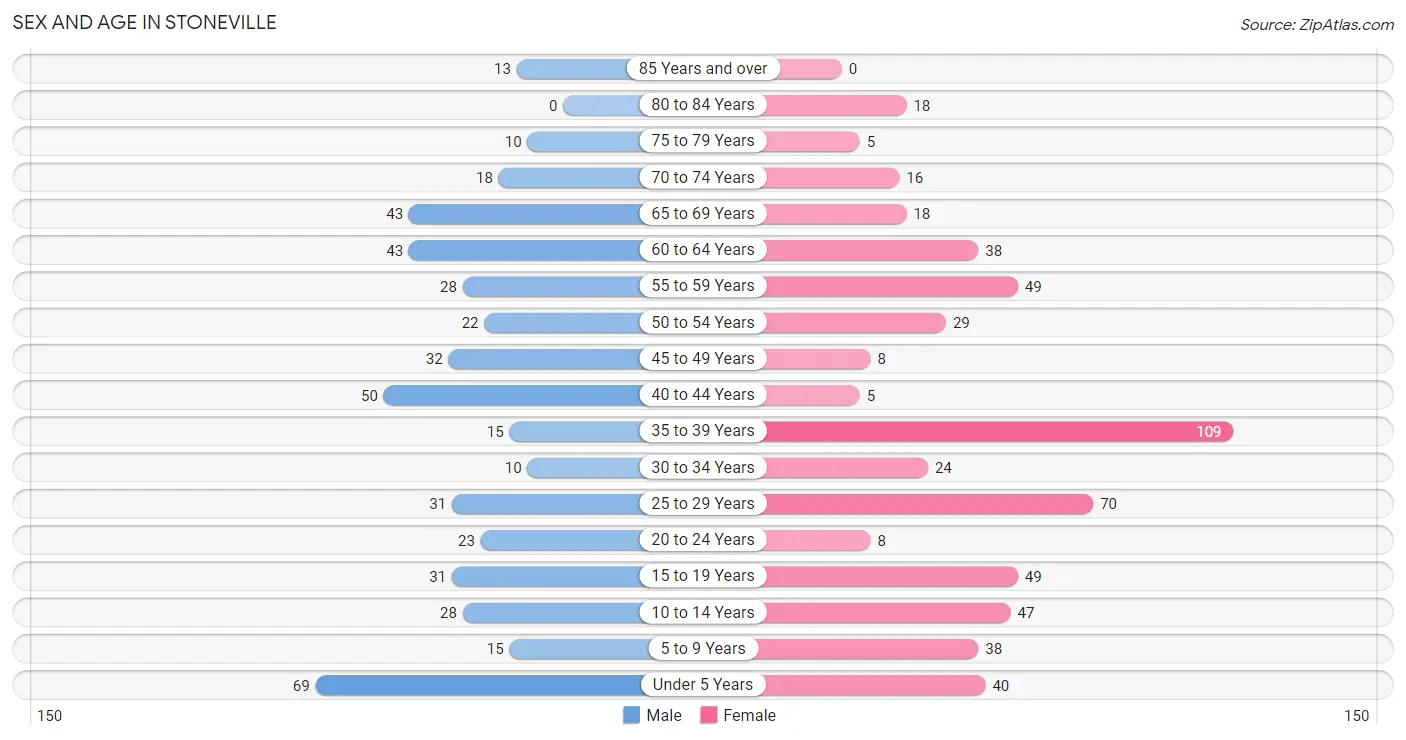
| Age Bracket | Male | Female |
| Under 5 Years | 69 (14.3%) | 40 (7.0%) |
| 5 to 9 Years | 15 (3.1%) | 38 (6.7%) |
| 10 to 14 Years | 28 (5.8%) | 47 (8.2%) |
| 15 to 19 Years | 31 (6.4%) | 49 (8.6%) |
| 20 to 24 Years | 23 (4.8%) | 8 (1.4%) |
| 25 to 29 Years | 31 (6.4%) | 70 (12.3%) |
| 30 to 34 Years | 10 (2.1%) | 24 (4.2%) |
| 35 to 39 Years | 15 (3.1%) | 109 (19.1%) |
| 40 to 44 Years | 50 (10.4%) | 5 (0.9%) |
| 45 to 49 Years | 32 (6.7%) | 8 (1.4%) |
| 50 to 54 Years | 22 (4.6%) | 29 (5.1%) |
| 55 to 59 Years | 28 (5.8%) | 49 (8.6%) |
| 60 to 64 Years | 43 (8.9%) | 38 (6.7%) |
| 65 to 69 Years | 43 (8.9%) | 18 (3.2%) |
| 70 to 74 Years | 18 (3.7%) | 16 (2.8%) |
| 75 to 79 Years | 10 (2.1%) | 5 (0.9%) |
| 80 to 84 Years | 0 (0.0%) | 18 (3.2%) |
| 85 Years and over | 13 (2.7%) | 0 (0.0%) |
| Total | 481 (100.0%) | 571 (100.0%) |
Families and Households in Stoneville
Median Family Size in Stoneville
The median family size in Stoneville is 2.68 persons per family, with single female/mother families (73 | 22.7%) accounting for the largest median family size of 2.96 persons per family. On the other hand, single male/father families (35 | 10.9%) represent the smallest median family size with 2.00 persons per family.
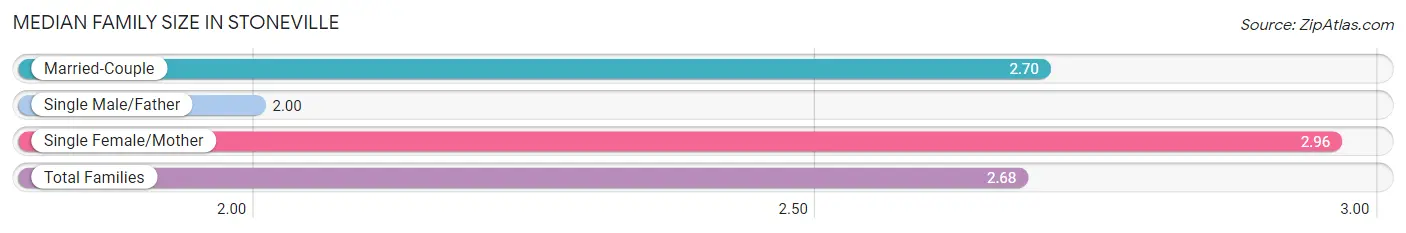
| Family Type | # Families | Family Size |
| Married-Couple | 214 (66.5%) | 2.70 |
| Single Male/Father | 35 (10.9%) | 2.00 |
| Single Female/Mother | 73 (22.7%) | 2.96 |
| Total Families | 322 (100.0%) | 2.68 |
Median Household Size in Stoneville
The median household size in Stoneville is 2.22 persons per household, with single female/mother households (73 | 15.4%) accounting for the largest median household size of 2.96 persons per household. non-family households (152 | 32.1%) represent the smallest median household size with 1.20 persons per household.
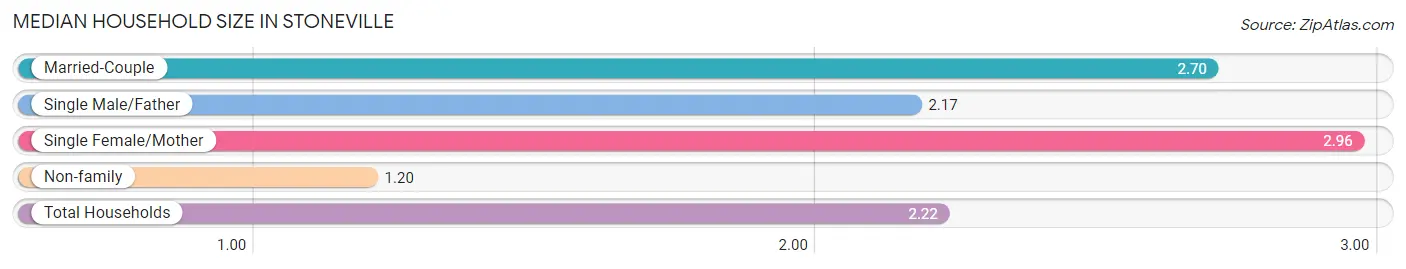
| Household Type | # Households | Household Size |
| Married-Couple | 214 (45.2%) | 2.70 |
| Single Male/Father | 35 (7.4%) | 2.17 |
| Single Female/Mother | 73 (15.4%) | 2.96 |
| Non-family | 152 (32.1%) | 1.20 |
| Total Households | 474 (100.0%) | 2.22 |
Household Size by Marriage Status in Stoneville
Out of a total of 474 households in Stoneville, 322 (67.9%) are family households, while 152 (32.1%) are nonfamily households. The most numerous type of family households are 4-person households, comprising 118, and the most common type of nonfamily households are 1-person households, comprising 123.
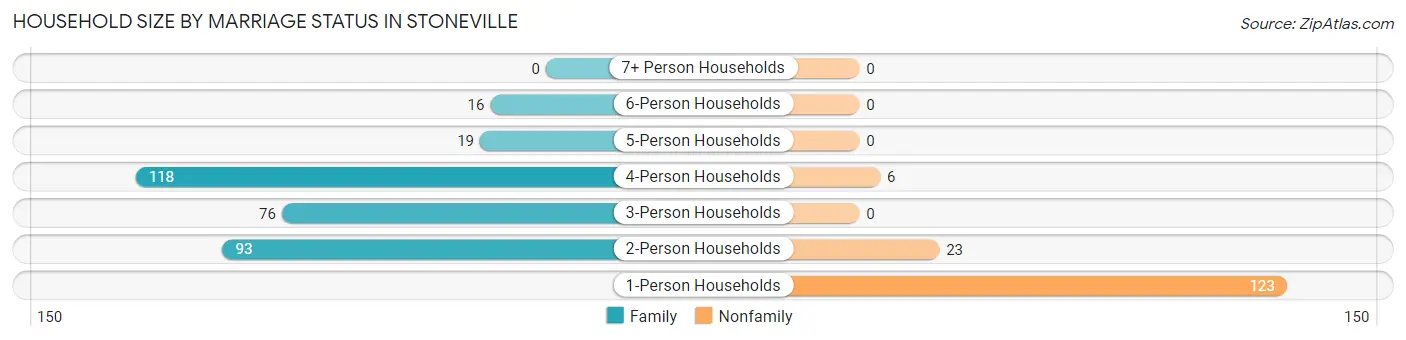
| Household Size | Family Households | Nonfamily Households |
| 1-Person Households | - | 123 (26.0%) |
| 2-Person Households | 93 (19.6%) | 23 (4.9%) |
| 3-Person Households | 76 (16.0%) | 0 (0.0%) |
| 4-Person Households | 118 (24.9%) | 6 (1.3%) |
| 5-Person Households | 19 (4.0%) | 0 (0.0%) |
| 6-Person Households | 16 (3.4%) | 0 (0.0%) |
| 7+ Person Households | 0 (0.0%) | 0 (0.0%) |
| Total | 322 (67.9%) | 152 (32.1%) |
Female Fertility in Stoneville
Fertility by Age in Stoneville
Average fertility rate in Stoneville is 53.0 births per 1,000 women. Women in the age bracket of 20 to 34 years have the highest fertility rate with 147.0 births per 1,000 women. Women in the age bracket of 20 to 34 years acount for 100.0% of all women with births.
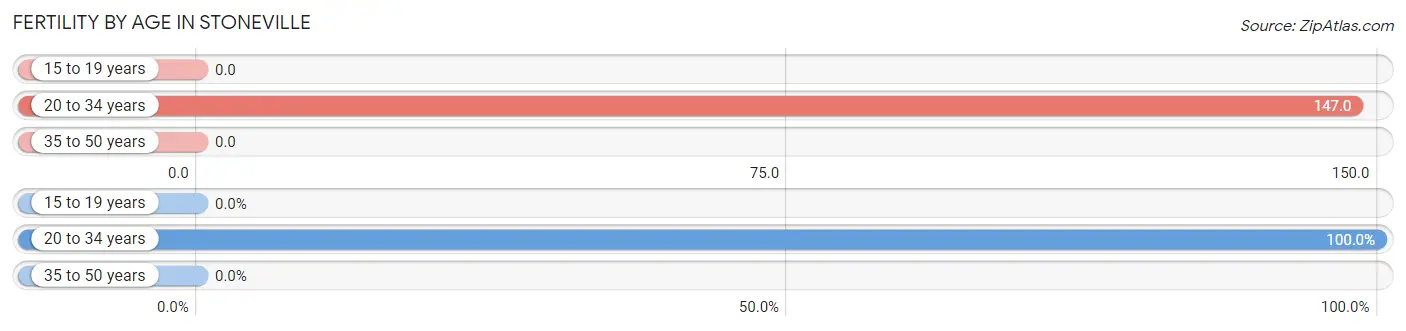
| Age Bracket | Women with Births | Births / 1,000 Women |
| 15 to 19 years | 0 (0.0%) | 0.0 |
| 20 to 34 years | 15 (100.0%) | 147.0 |
| 35 to 50 years | 0 (0.0%) | 0.0 |
| Total | 15 (100.0%) | 53.0 |
Fertility by Age by Marriage Status in Stoneville
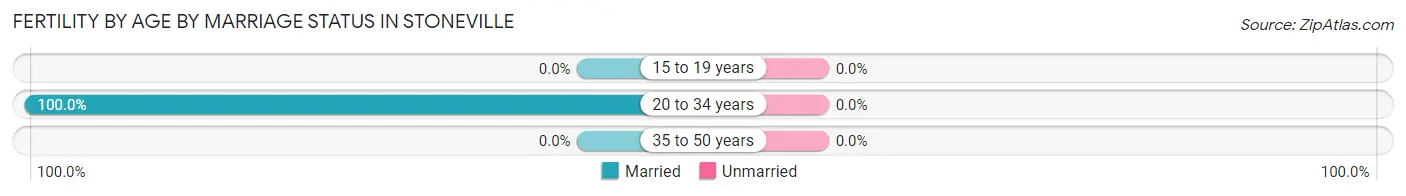
| Age Bracket | Married | Unmarried |
| 15 to 19 years | 0 (0.0%) | 0 (0.0%) |
| 20 to 34 years | 15 (100.0%) | 0 (0.0%) |
| 35 to 50 years | 0 (0.0%) | 0 (0.0%) |
| Total | 15 (100.0%) | 0 (0.0%) |
Fertility by Education in Stoneville
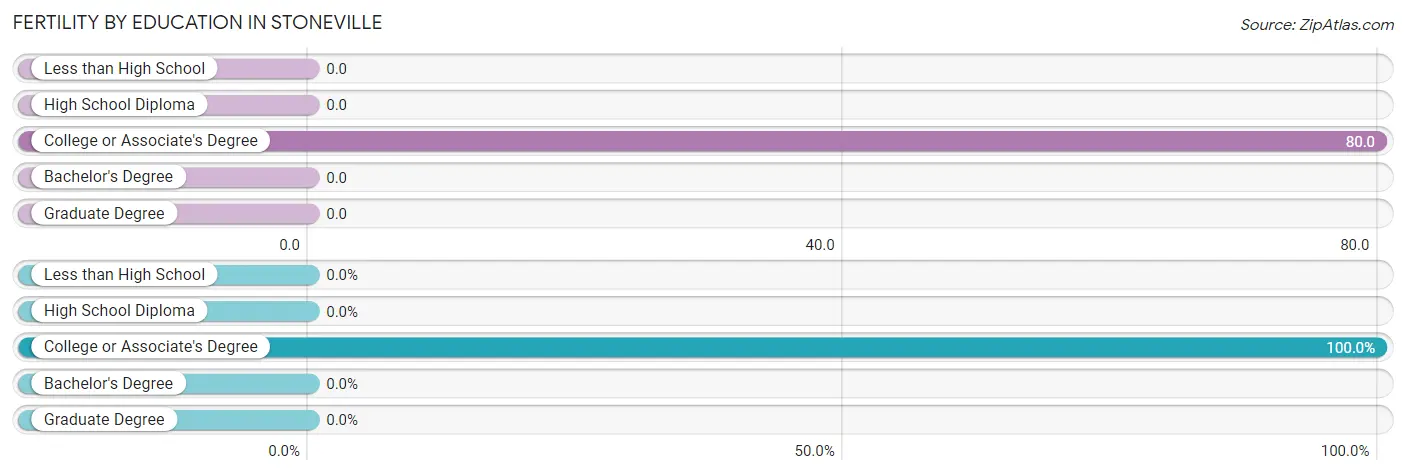
| Educational Attainment | Women with Births | Births / 1,000 Women |
| Less than High School | 0 (0.0%) | 0.0 |
| High School Diploma | 0 (0.0%) | 0.0 |
| College or Associate's Degree | 15 (100.0%) | 80.0 |
| Bachelor's Degree | 0 (0.0%) | 0.0 |
| Graduate Degree | 0 (0.0%) | 0.0 |
| Total | 15 (100.0%) | 53.0 |
Fertility by Education by Marriage Status in Stoneville
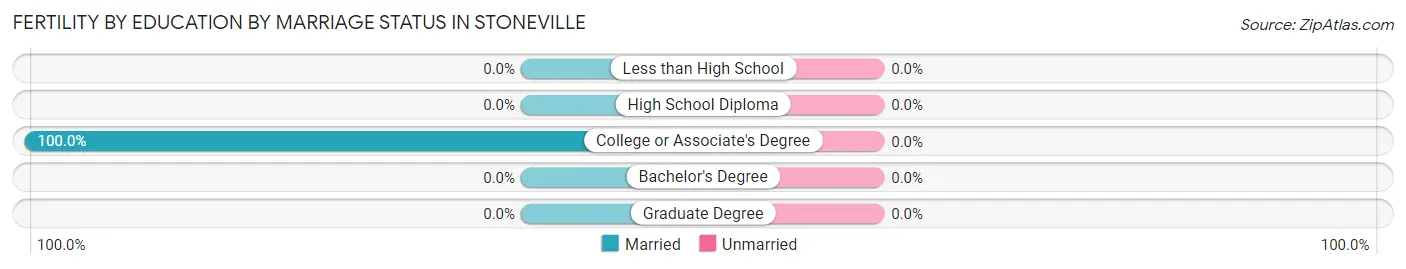
| Educational Attainment | Married | Unmarried |
| Less than High School | 0 (0.0%) | 0 (0.0%) |
| High School Diploma | 0 (0.0%) | 0 (0.0%) |
| College or Associate's Degree | 15 (100.0%) | 0 (0.0%) |
| Bachelor's Degree | 0 (0.0%) | 0 (0.0%) |
| Graduate Degree | 0 (0.0%) | 0 (0.0%) |
| Total | 15 (100.0%) | 0 (0.0%) |
Employment Characteristics in Stoneville
Employment by Class of Employer in Stoneville
Among the 470 employed individuals in Stoneville, private company employees (264 | 56.2%), self-employed (not incorporated) (122 | 26.0%), and not-for-profit organizations (29 | 6.2%) make up the most common classes of employment.
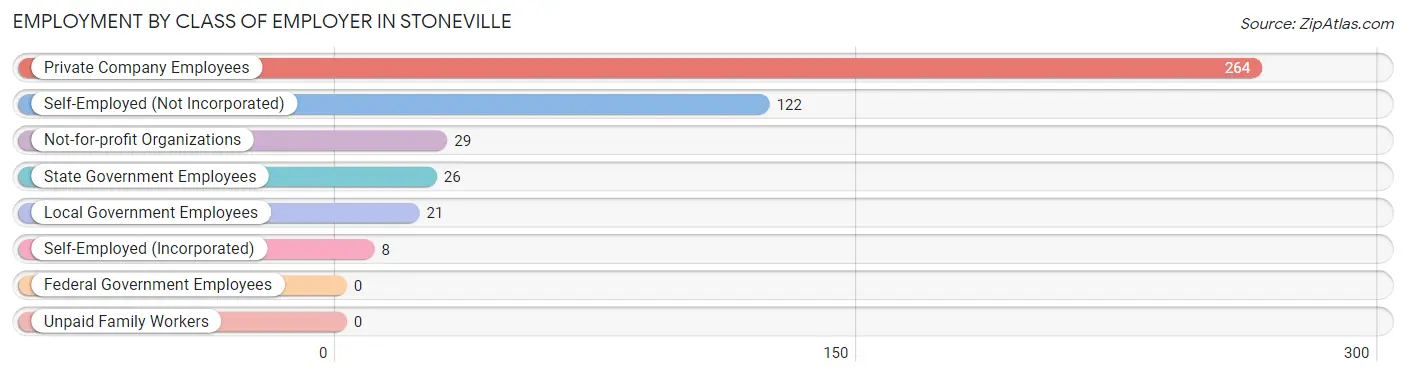
| Employer Class | # Employees | % Employees |
| Private Company Employees | 264 | 56.2% |
| Self-Employed (Incorporated) | 8 | 1.7% |
| Self-Employed (Not Incorporated) | 122 | 26.0% |
| Not-for-profit Organizations | 29 | 6.2% |
| Local Government Employees | 21 | 4.5% |
| State Government Employees | 26 | 5.5% |
| Federal Government Employees | 0 | 0.0% |
| Unpaid Family Workers | 0 | 0.0% |
| Total | 470 | 100.0% |
Employment Status by Age in Stoneville
According to the labor force statistics for Stoneville, out of the total population over 16 years of age (815), 63.6% or 518 individuals are in the labor force, with 6.8% or 35 of them unemployed. The age group with the highest labor force participation rate is 25 to 29 years, with 100.0% or 101 individuals in the labor force. Within the labor force, the 16 to 19 years age range has the highest percentage of unemployed individuals, with 31.9% or 15 of them being unemployed.
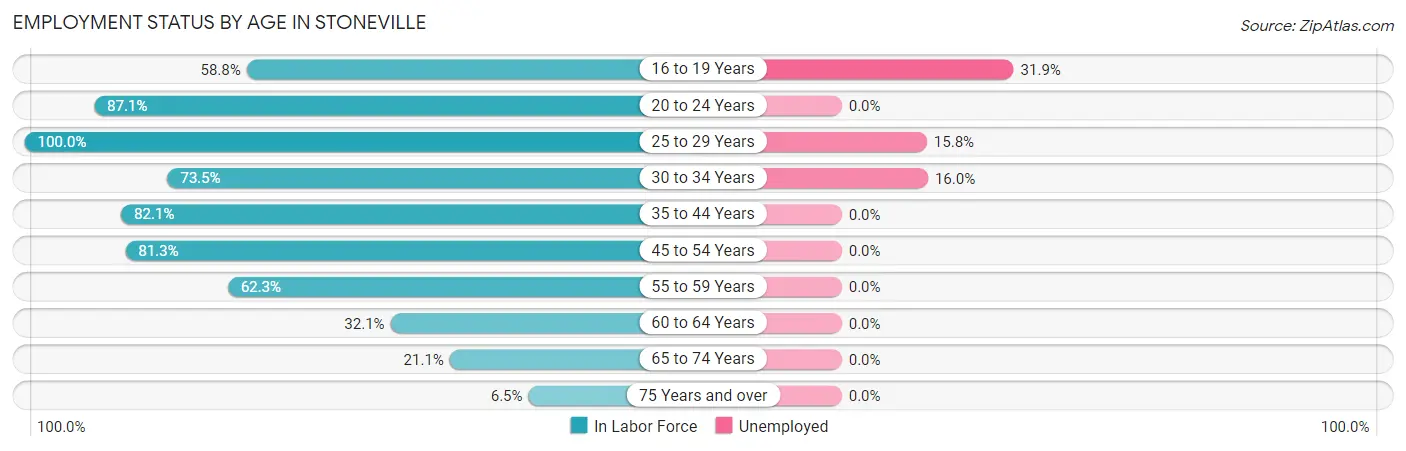
| Age Bracket | In Labor Force | Unemployed |
| 16 to 19 Years | 47 (58.8%) | 15 (31.9%) |
| 20 to 24 Years | 27 (87.1%) | 0 (0.0%) |
| 25 to 29 Years | 101 (100.0%) | 16 (15.8%) |
| 30 to 34 Years | 25 (73.5%) | 4 (16.0%) |
| 35 to 44 Years | 147 (82.1%) | 0 (0.0%) |
| 45 to 54 Years | 74 (81.3%) | 0 (0.0%) |
| 55 to 59 Years | 48 (62.3%) | 0 (0.0%) |
| 60 to 64 Years | 26 (32.1%) | 0 (0.0%) |
| 65 to 74 Years | 20 (21.1%) | 0 (0.0%) |
| 75 Years and over | 3 (6.5%) | 0 (0.0%) |
| Total | 518 (63.6%) | 35 (6.8%) |
Employment Status by Educational Attainment in Stoneville
According to labor force statistics for Stoneville, 74.8% of individuals (421) out of the total population between 25 and 64 years of age (563) are in the labor force, with 4.8% or 20 of them being unemployed. The group with the highest labor force participation rate are those with the educational attainment of college / associate degree, with 82.7% or 230 individuals in the labor force. Within the labor force, individuals with college / associate degree education have the highest percentage of unemployment, with 8.7% or 20 of them being unemployed.
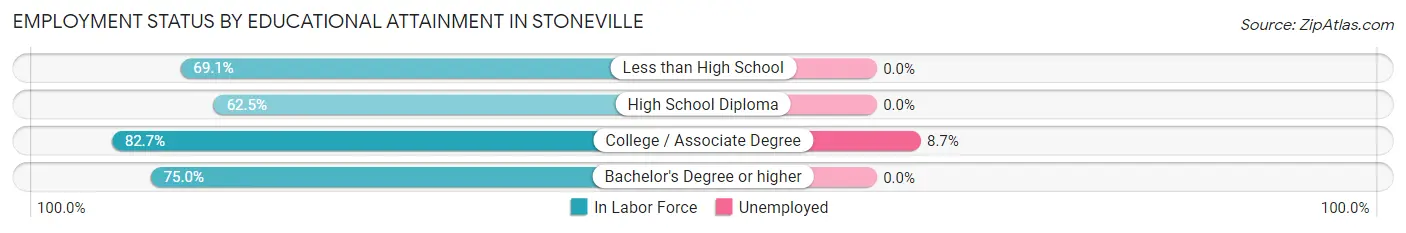
| Educational Attainment | In Labor Force | Unemployed |
| Less than High School | 67 (69.1%) | 0 (0.0%) |
| High School Diploma | 85 (62.5%) | 0 (0.0%) |
| College / Associate Degree | 230 (82.7%) | 24 (8.7%) |
| Bachelor's Degree or higher | 39 (75.0%) | 0 (0.0%) |
| Total | 421 (74.8%) | 27 (4.8%) |
Employment Occupations by Sex in Stoneville
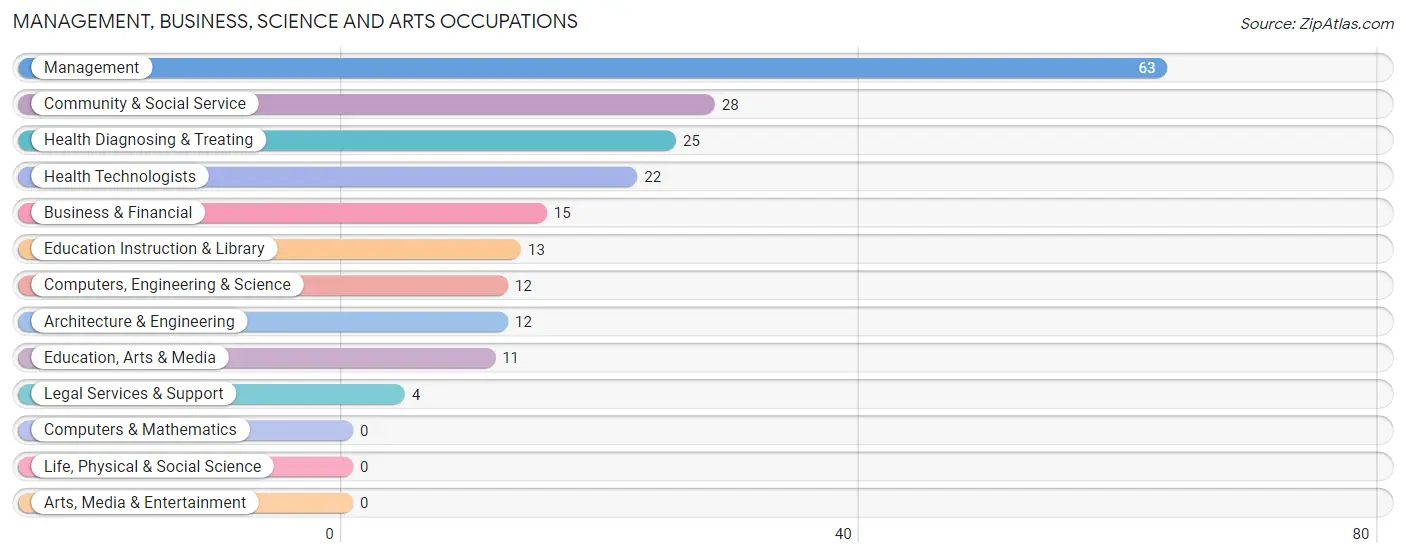
Management, Business, Science and Arts Occupations
The most common Management, Business, Science and Arts occupations in Stoneville are Management (63 | 13.0%), Community & Social Service (28 | 5.8%), Health Diagnosing & Treating (25 | 5.2%), Health Technologists (22 | 4.5%), and Business & Financial (15 | 3.1%).
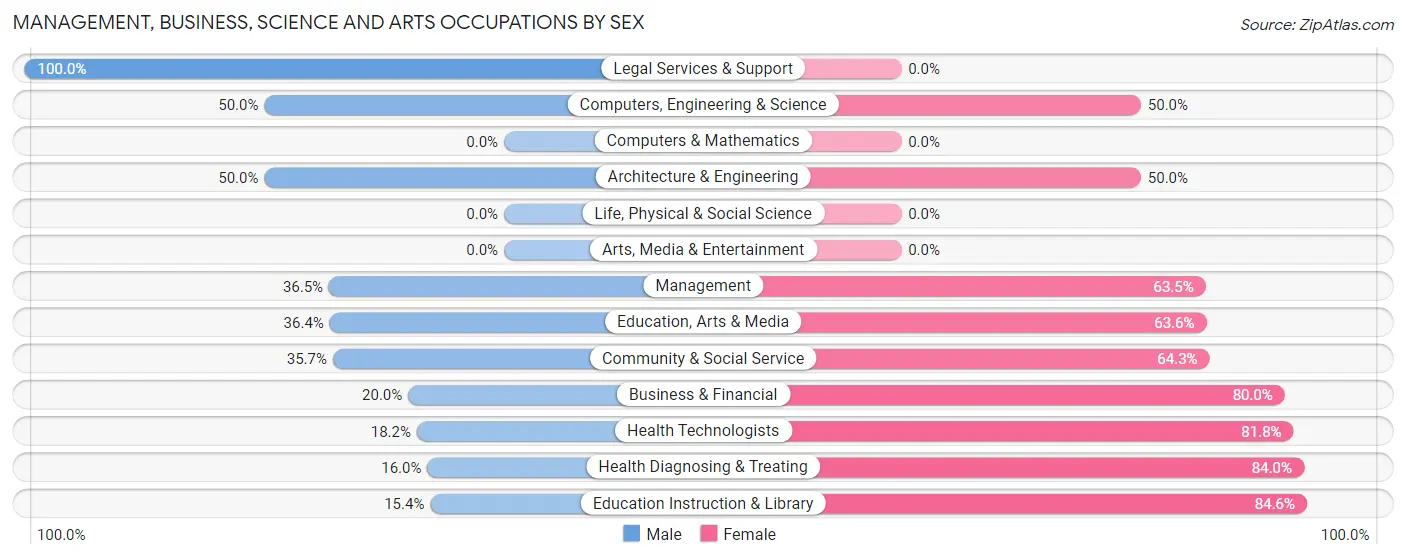
Management, Business, Science and Arts Occupations by Sex
Within the Management, Business, Science and Arts occupations in Stoneville, the most male-oriented occupations are Legal Services & Support (100.0%), Computers, Engineering & Science (50.0%), and Architecture & Engineering (50.0%), while the most female-oriented occupations are Education Instruction & Library (84.6%), Health Diagnosing & Treating (84.0%), and Health Technologists (81.8%).
| Occupation | Male | Female |
| Management | 23 (36.5%) | 40 (63.5%) |
| Business & Financial | 3 (20.0%) | 12 (80.0%) |
| Computers, Engineering & Science | 6 (50.0%) | 6 (50.0%) |
| Computers & Mathematics | 0 (0.0%) | 0 (0.0%) |
| Architecture & Engineering | 6 (50.0%) | 6 (50.0%) |
| Life, Physical & Social Science | 0 (0.0%) | 0 (0.0%) |
| Community & Social Service | 10 (35.7%) | 18 (64.3%) |
| Education, Arts & Media | 4 (36.4%) | 7 (63.6%) |
| Legal Services & Support | 4 (100.0%) | 0 (0.0%) |
| Education Instruction & Library | 2 (15.4%) | 11 (84.6%) |
| Arts, Media & Entertainment | 0 (0.0%) | 0 (0.0%) |
| Health Diagnosing & Treating | 4 (16.0%) | 21 (84.0%) |
| Health Technologists | 4 (18.2%) | 18 (81.8%) |
| Total (Category) | 46 (32.2%) | 97 (67.8%) |
| Total (Overall) | 230 (47.6%) | 253 (52.4%) |
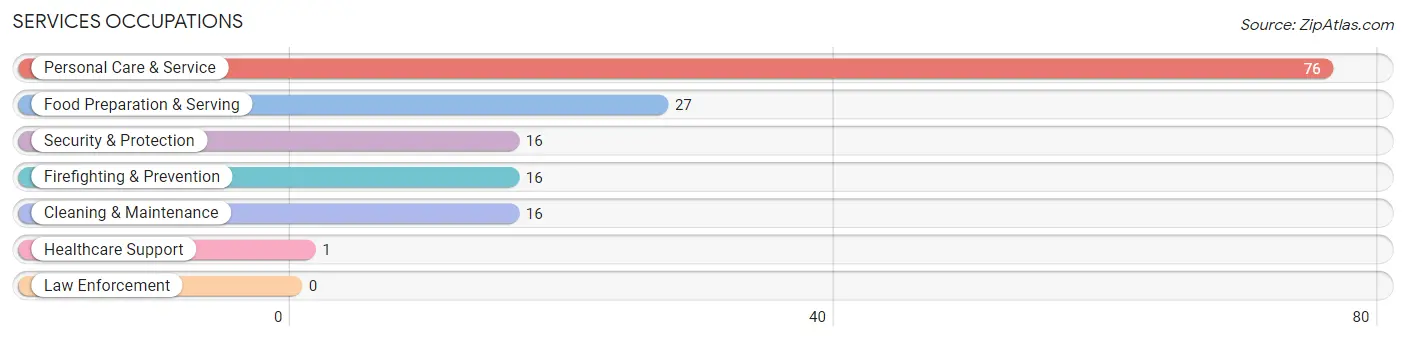
Services Occupations
The most common Services occupations in Stoneville are Personal Care & Service (76 | 15.7%), Food Preparation & Serving (27 | 5.6%), Security & Protection (16 | 3.3%), Firefighting & Prevention (16 | 3.3%), and Cleaning & Maintenance (16 | 3.3%).
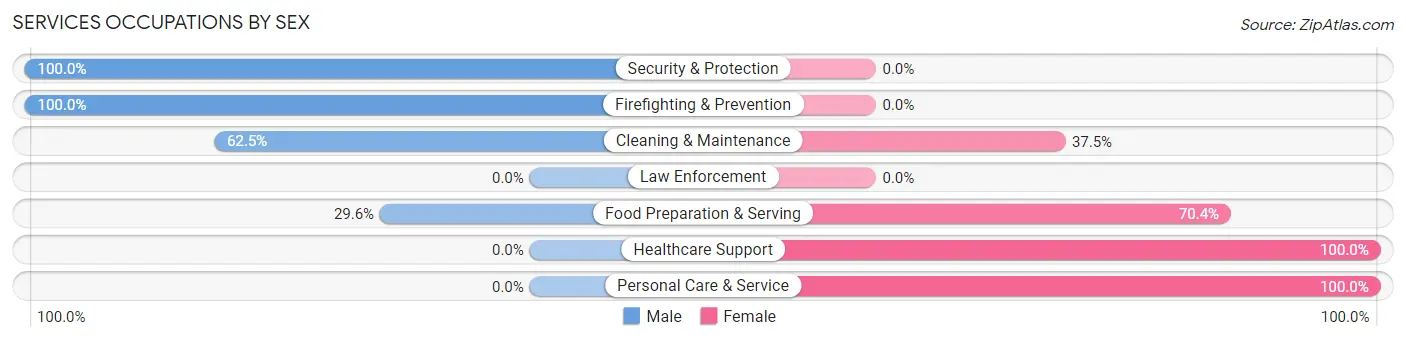
Services Occupations by Sex
Within the Services occupations in Stoneville, the most male-oriented occupations are Security & Protection (100.0%), Firefighting & Prevention (100.0%), and Cleaning & Maintenance (62.5%), while the most female-oriented occupations are Healthcare Support (100.0%), Personal Care & Service (100.0%), and Food Preparation & Serving (70.4%).
| Occupation | Male | Female |
| Healthcare Support | 0 (0.0%) | 1 (100.0%) |
| Security & Protection | 16 (100.0%) | 0 (0.0%) |
| Firefighting & Prevention | 16 (100.0%) | 0 (0.0%) |
| Law Enforcement | 0 (0.0%) | 0 (0.0%) |
| Food Preparation & Serving | 8 (29.6%) | 19 (70.4%) |
| Cleaning & Maintenance | 10 (62.5%) | 6 (37.5%) |
| Personal Care & Service | 0 (0.0%) | 76 (100.0%) |
| Total (Category) | 34 (25.0%) | 102 (75.0%) |
| Total (Overall) | 230 (47.6%) | 253 (52.4%) |
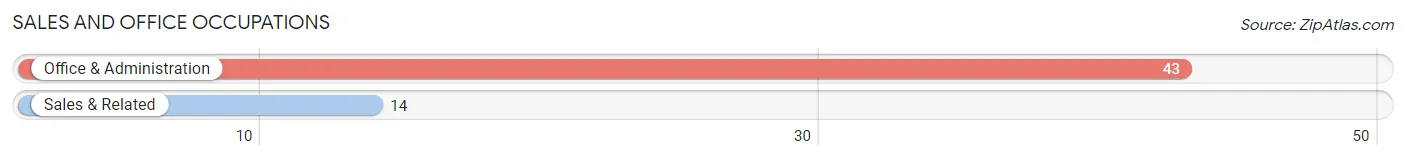
Sales and Office Occupations
The most common Sales and Office occupations in Stoneville are Office & Administration (43 | 8.9%), and Sales & Related (14 | 2.9%).
Sales and Office Occupations by Sex
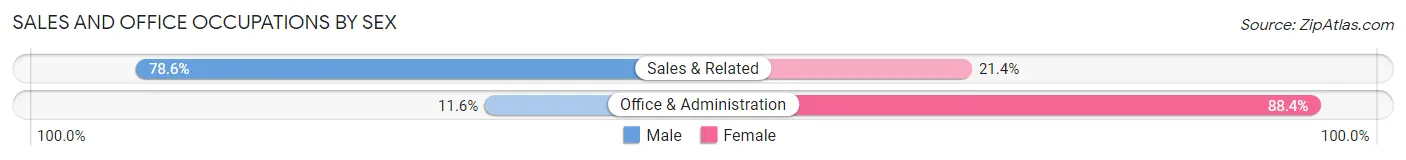
| Occupation | Male | Female |
| Sales & Related | 11 (78.6%) | 3 (21.4%) |
| Office & Administration | 5 (11.6%) | 38 (88.4%) |
| Total (Category) | 16 (28.1%) | 41 (71.9%) |
| Total (Overall) | 230 (47.6%) | 253 (52.4%) |
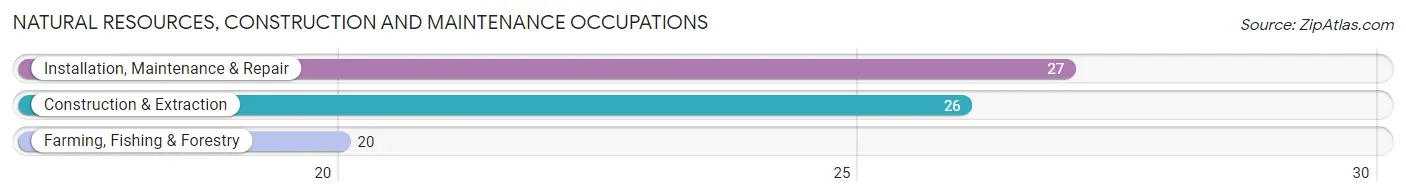
Natural Resources, Construction and Maintenance Occupations
The most common Natural Resources, Construction and Maintenance occupations in Stoneville are Installation, Maintenance & Repair (27 | 5.6%), Construction & Extraction (26 | 5.4%), and Farming, Fishing & Forestry (20 | 4.1%).
Natural Resources, Construction and Maintenance Occupations by Sex
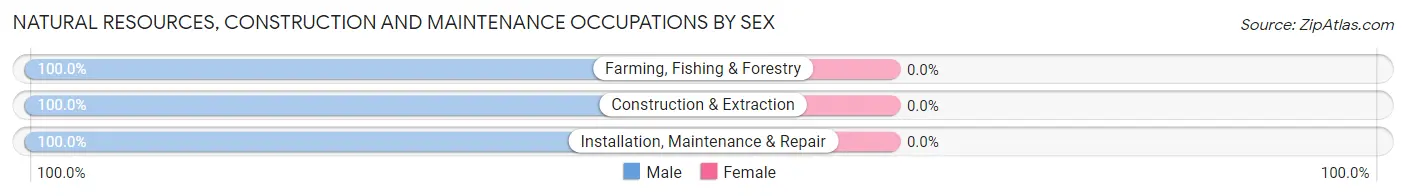
| Occupation | Male | Female |
| Farming, Fishing & Forestry | 20 (100.0%) | 0 (0.0%) |
| Construction & Extraction | 26 (100.0%) | 0 (0.0%) |
| Installation, Maintenance & Repair | 27 (100.0%) | 0 (0.0%) |
| Total (Category) | 73 (100.0%) | 0 (0.0%) |
| Total (Overall) | 230 (47.6%) | 253 (52.4%) |
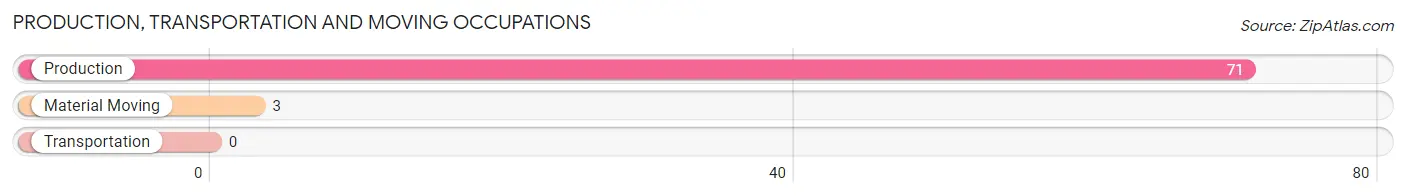
Production, Transportation and Moving Occupations
The most common Production, Transportation and Moving occupations in Stoneville are Production (71 | 14.7%), and Material Moving (3 | 0.6%).
Production, Transportation and Moving Occupations by Sex
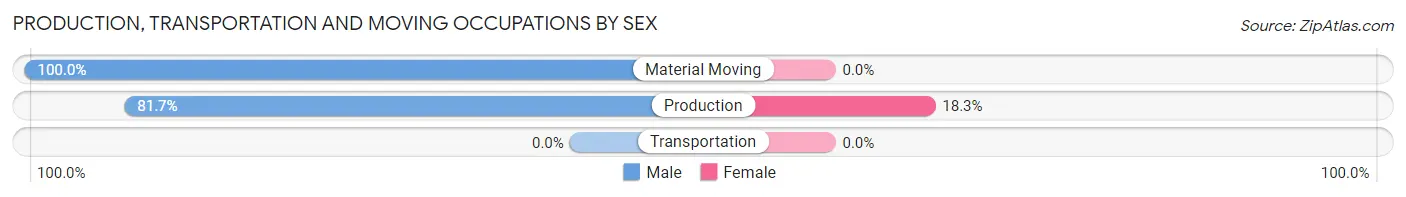
| Occupation | Male | Female |
| Production | 58 (81.7%) | 13 (18.3%) |
| Transportation | 0 (0.0%) | 0 (0.0%) |
| Material Moving | 3 (100.0%) | 0 (0.0%) |
| Total (Category) | 61 (82.4%) | 13 (17.6%) |
| Total (Overall) | 230 (47.6%) | 253 (52.4%) |
Employment Industries by Sex in Stoneville
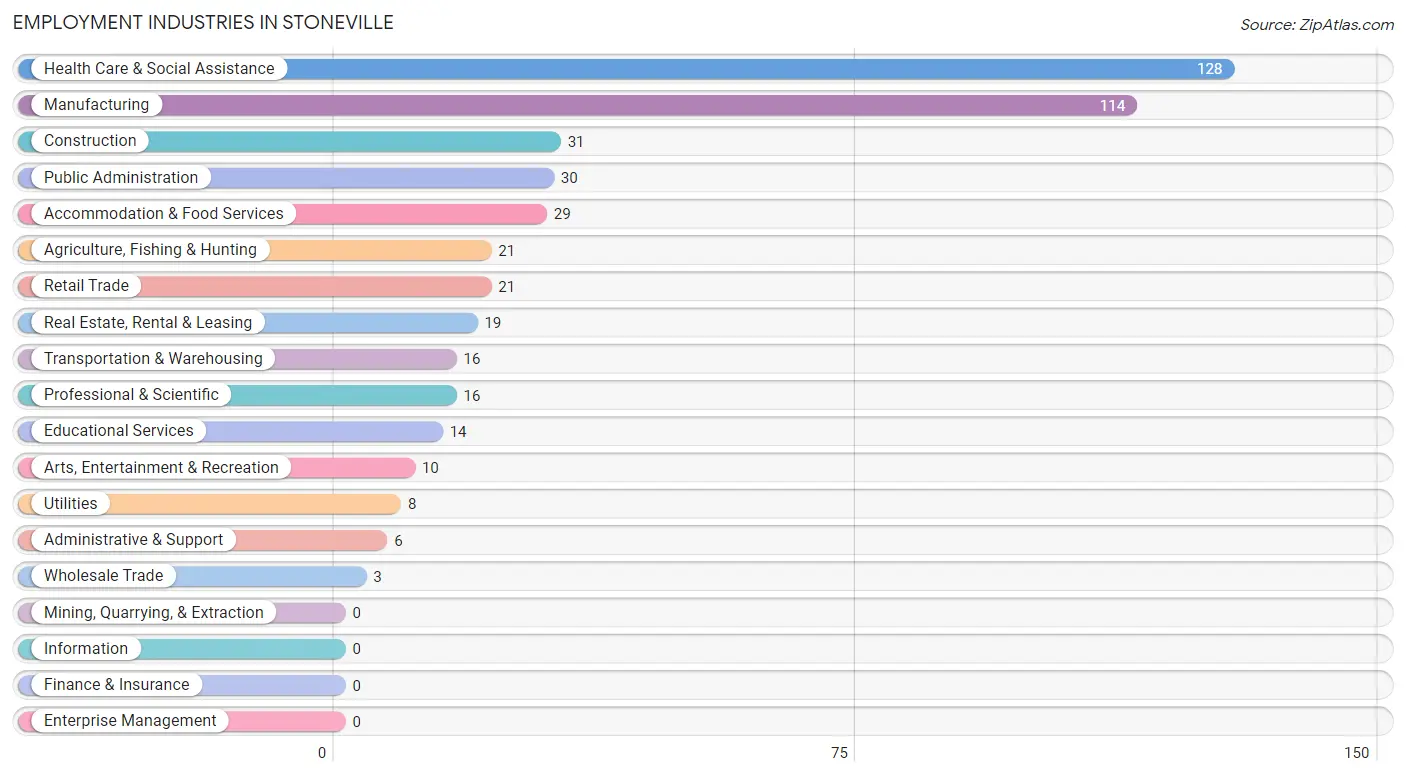
Employment Industries in Stoneville
The major employment industries in Stoneville include Health Care & Social Assistance (128 | 26.5%), Manufacturing (114 | 23.6%), Construction (31 | 6.4%), Public Administration (30 | 6.2%), and Accommodation & Food Services (29 | 6.0%).
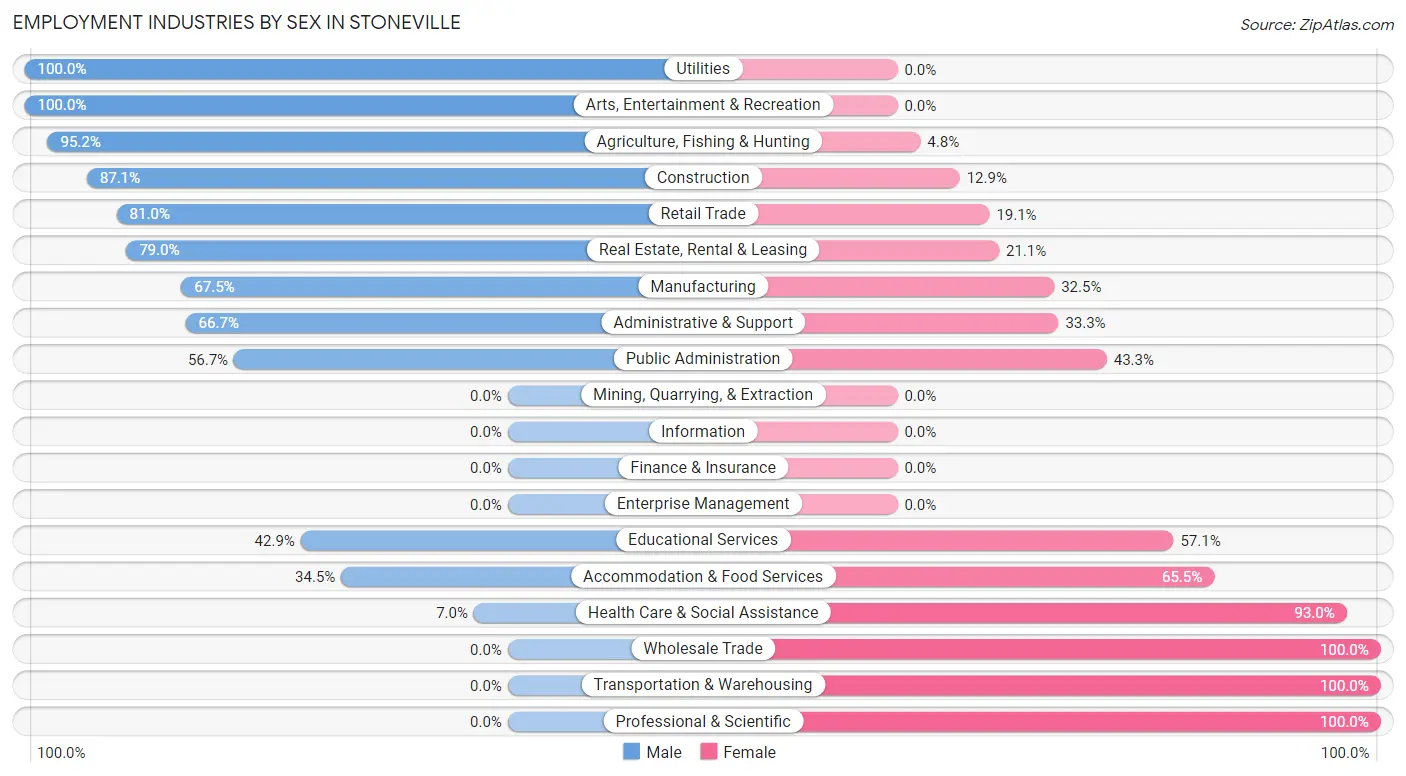
Employment Industries by Sex in Stoneville
The Stoneville industries that see more men than women are Utilities (100.0%), Arts, Entertainment & Recreation (100.0%), and Agriculture, Fishing & Hunting (95.2%), whereas the industries that tend to have a higher number of women are Wholesale Trade (100.0%), Transportation & Warehousing (100.0%), and Professional & Scientific (100.0%).
| Industry | Male | Female |
| Agriculture, Fishing & Hunting | 20 (95.2%) | 1 (4.8%) |
| Mining, Quarrying, & Extraction | 0 (0.0%) | 0 (0.0%) |
| Construction | 27 (87.1%) | 4 (12.9%) |
| Manufacturing | 77 (67.5%) | 37 (32.5%) |
| Wholesale Trade | 0 (0.0%) | 3 (100.0%) |
| Retail Trade | 17 (80.9%) | 4 (19.1%) |
| Transportation & Warehousing | 0 (0.0%) | 16 (100.0%) |
| Utilities | 8 (100.0%) | 0 (0.0%) |
| Information | 0 (0.0%) | 0 (0.0%) |
| Finance & Insurance | 0 (0.0%) | 0 (0.0%) |
| Real Estate, Rental & Leasing | 15 (78.9%) | 4 (21.0%) |
| Professional & Scientific | 0 (0.0%) | 16 (100.0%) |
| Enterprise Management | 0 (0.0%) | 0 (0.0%) |
| Administrative & Support | 4 (66.7%) | 2 (33.3%) |
| Educational Services | 6 (42.9%) | 8 (57.1%) |
| Health Care & Social Assistance | 9 (7.0%) | 119 (93.0%) |
| Arts, Entertainment & Recreation | 10 (100.0%) | 0 (0.0%) |
| Accommodation & Food Services | 10 (34.5%) | 19 (65.5%) |
| Public Administration | 17 (56.7%) | 13 (43.3%) |
| Total | 230 (47.6%) | 253 (52.4%) |
Education in Stoneville
School Enrollment in Stoneville
The most common levels of schooling among the 213 students in Stoneville are middle school (50 | 23.5%), high school (49 | 23.0%), and elementary school (41 | 19.3%).
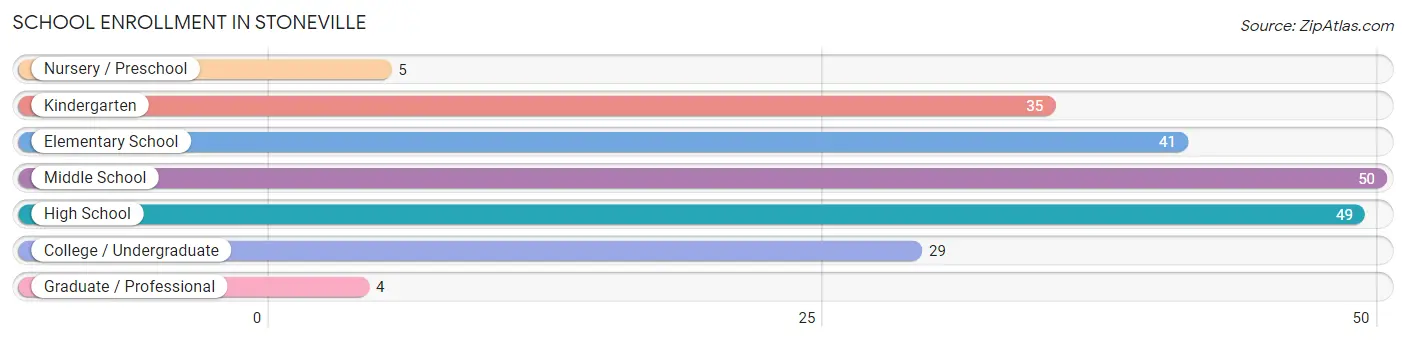
| School Level | # Students | % Students |
| Nursery / Preschool | 5 | 2.4% |
| Kindergarten | 35 | 16.4% |
| Elementary School | 41 | 19.3% |
| Middle School | 50 | 23.5% |
| High School | 49 | 23.0% |
| College / Undergraduate | 29 | 13.6% |
| Graduate / Professional | 4 | 1.9% |
| Total | 213 | 100.0% |
School Enrollment by Age by Funding Source in Stoneville
Out of a total of 213 students who are enrolled in schools in Stoneville, 35 (16.4%) attend a private institution, while the remaining 178 (83.6%) are enrolled in public schools. The age group of 35 years and over has the highest likelihood of being enrolled in private schools, with 4 (100.0% in the age bracket) enrolled. Conversely, the age group of 18 to 19 year olds has the lowest likelihood of being enrolled in a private school, with 20 (100.0% in the age bracket) attending a public institution.
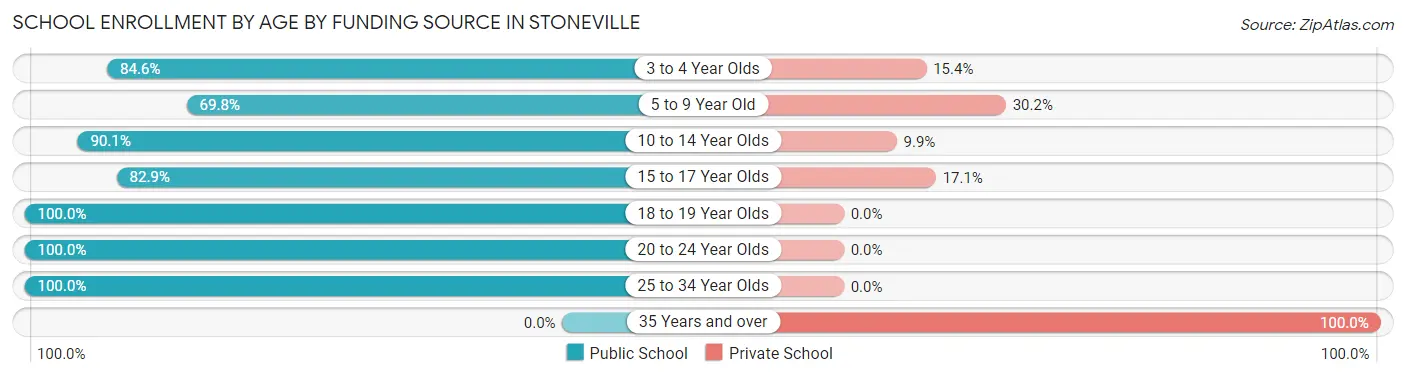
| Age Bracket | Public School | Private School |
| 3 to 4 Year Olds | 11 (84.6%) | 2 (15.4%) |
| 5 to 9 Year Old | 37 (69.8%) | 16 (30.2%) |
| 10 to 14 Year Olds | 64 (90.1%) | 7 (9.9%) |
| 15 to 17 Year Olds | 29 (82.9%) | 6 (17.1%) |
| 18 to 19 Year Olds | 20 (100.0%) | 0 (0.0%) |
| 20 to 24 Year Olds | 8 (100.0%) | 0 (0.0%) |
| 25 to 34 Year Olds | 9 (100.0%) | 0 (0.0%) |
| 35 Years and over | 0 (0.0%) | 4 (100.0%) |
| Total | 178 (83.6%) | 35 (16.4%) |
Educational Attainment by Field of Study in Stoneville
Social sciences (25 | 29.4%), liberal arts & history (10 | 11.8%), arts & humanities (10 | 11.8%), education (9 | 10.6%), and engineering (7 | 8.2%) are the most common fields of study among 85 individuals in Stoneville who have obtained a bachelor's degree or higher.
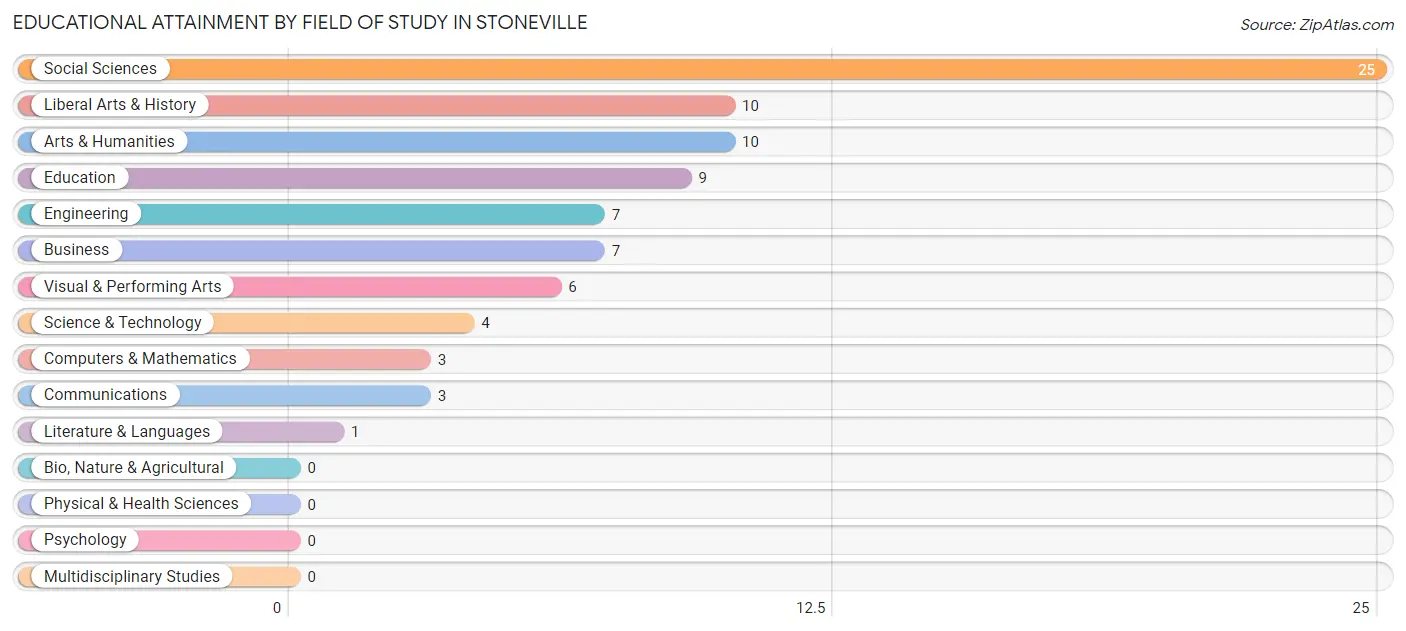
| Field of Study | # Graduates | % Graduates |
| Computers & Mathematics | 3 | 3.5% |
| Bio, Nature & Agricultural | 0 | 0.0% |
| Physical & Health Sciences | 0 | 0.0% |
| Psychology | 0 | 0.0% |
| Social Sciences | 25 | 29.4% |
| Engineering | 7 | 8.2% |
| Multidisciplinary Studies | 0 | 0.0% |
| Science & Technology | 4 | 4.7% |
| Business | 7 | 8.2% |
| Education | 9 | 10.6% |
| Literature & Languages | 1 | 1.2% |
| Liberal Arts & History | 10 | 11.8% |
| Visual & Performing Arts | 6 | 7.1% |
| Communications | 3 | 3.5% |
| Arts & Humanities | 10 | 11.8% |
| Total | 85 | 100.0% |
Transportation & Commute in Stoneville
Vehicle Availability by Sex in Stoneville
The most prevalent vehicle ownership categories in Stoneville are males with 3 vehicles (72, accounting for 31.9%) and females with 3 vehicles (26, making up 29.5%).
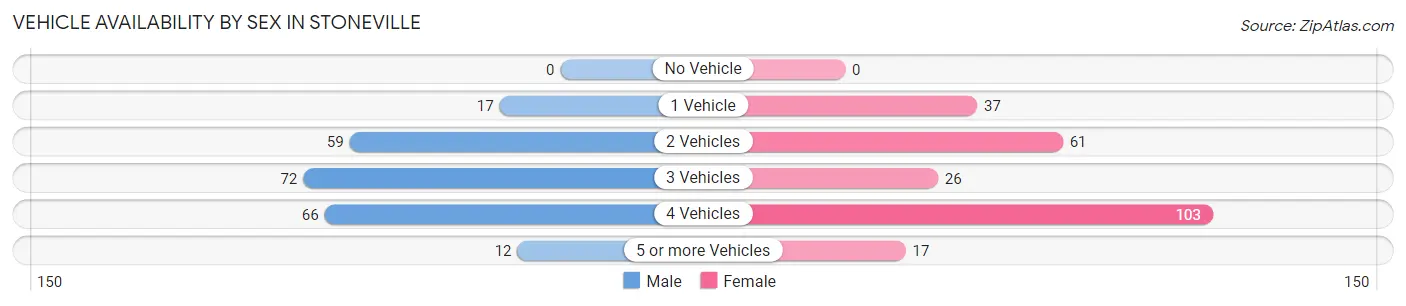
| Vehicles Available | Male | Female |
| No Vehicle | 0 (0.0%) | 0 (0.0%) |
| 1 Vehicle | 17 (7.5%) | 37 (15.2%) |
| 2 Vehicles | 59 (26.1%) | 61 (25.0%) |
| 3 Vehicles | 72 (31.9%) | 26 (10.7%) |
| 4 Vehicles | 66 (29.2%) | 103 (42.2%) |
| 5 or more Vehicles | 12 (5.3%) | 17 (7.0%) |
| Total | 226 (100.0%) | 244 (100.0%) |
Commute Time in Stoneville
The most frequently occuring commute durations in Stoneville are 15 to 19 minutes (97 commuters, 20.8%), 20 to 24 minutes (89 commuters, 19.1%), and 45 to 59 minutes (77 commuters, 16.5%).
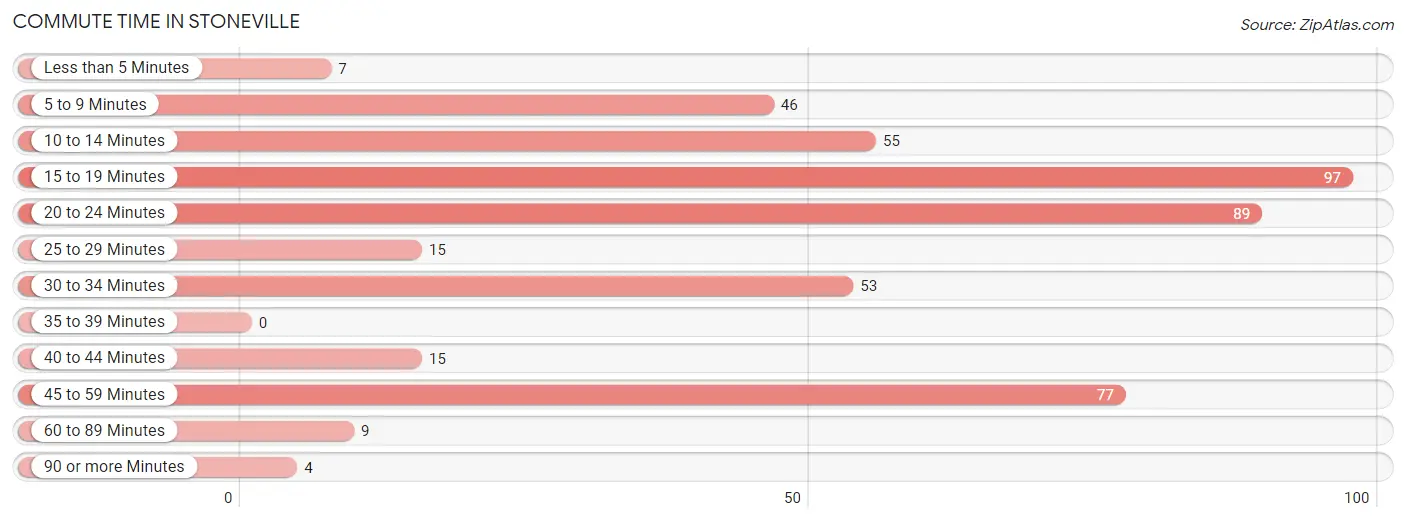
| Commute Time | # Commuters | % Commuters |
| Less than 5 Minutes | 7 | 1.5% |
| 5 to 9 Minutes | 46 | 9.9% |
| 10 to 14 Minutes | 55 | 11.8% |
| 15 to 19 Minutes | 97 | 20.8% |
| 20 to 24 Minutes | 89 | 19.1% |
| 25 to 29 Minutes | 15 | 3.2% |
| 30 to 34 Minutes | 53 | 11.4% |
| 35 to 39 Minutes | 0 | 0.0% |
| 40 to 44 Minutes | 15 | 3.2% |
| 45 to 59 Minutes | 77 | 16.5% |
| 60 to 89 Minutes | 9 | 1.9% |
| 90 or more Minutes | 4 | 0.9% |
Commute Time by Sex in Stoneville
The most common commute times in Stoneville are 20 to 24 minutes (59 commuters, 26.1%) for males and 15 to 19 minutes (91 commuters, 37.8%) for females.
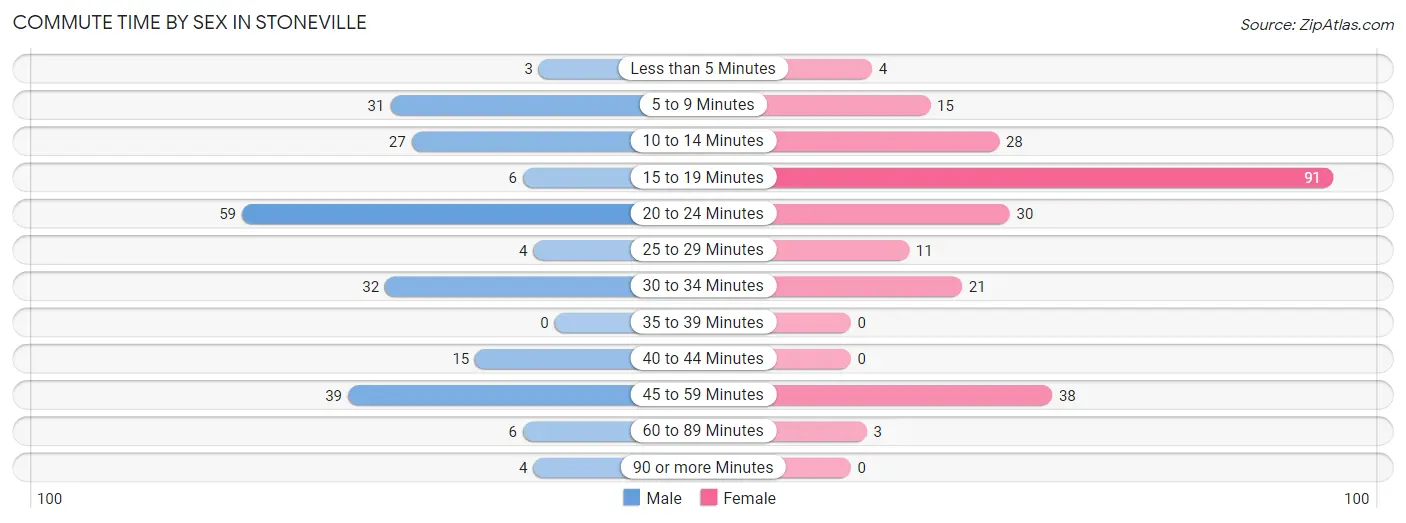
| Commute Time | Male | Female |
| Less than 5 Minutes | 3 (1.3%) | 4 (1.7%) |
| 5 to 9 Minutes | 31 (13.7%) | 15 (6.2%) |
| 10 to 14 Minutes | 27 (11.9%) | 28 (11.6%) |
| 15 to 19 Minutes | 6 (2.6%) | 91 (37.8%) |
| 20 to 24 Minutes | 59 (26.1%) | 30 (12.4%) |
| 25 to 29 Minutes | 4 (1.8%) | 11 (4.6%) |
| 30 to 34 Minutes | 32 (14.2%) | 21 (8.7%) |
| 35 to 39 Minutes | 0 (0.0%) | 0 (0.0%) |
| 40 to 44 Minutes | 15 (6.6%) | 0 (0.0%) |
| 45 to 59 Minutes | 39 (17.3%) | 38 (15.8%) |
| 60 to 89 Minutes | 6 (2.6%) | 3 (1.2%) |
| 90 or more Minutes | 4 (1.8%) | 0 (0.0%) |
Time of Departure to Work by Sex in Stoneville
The most frequent times of departure to work in Stoneville are 6:30 AM to 6:59 AM (43, 19.0%) for males and 7:30 AM to 7:59 AM (92, 38.2%) for females.
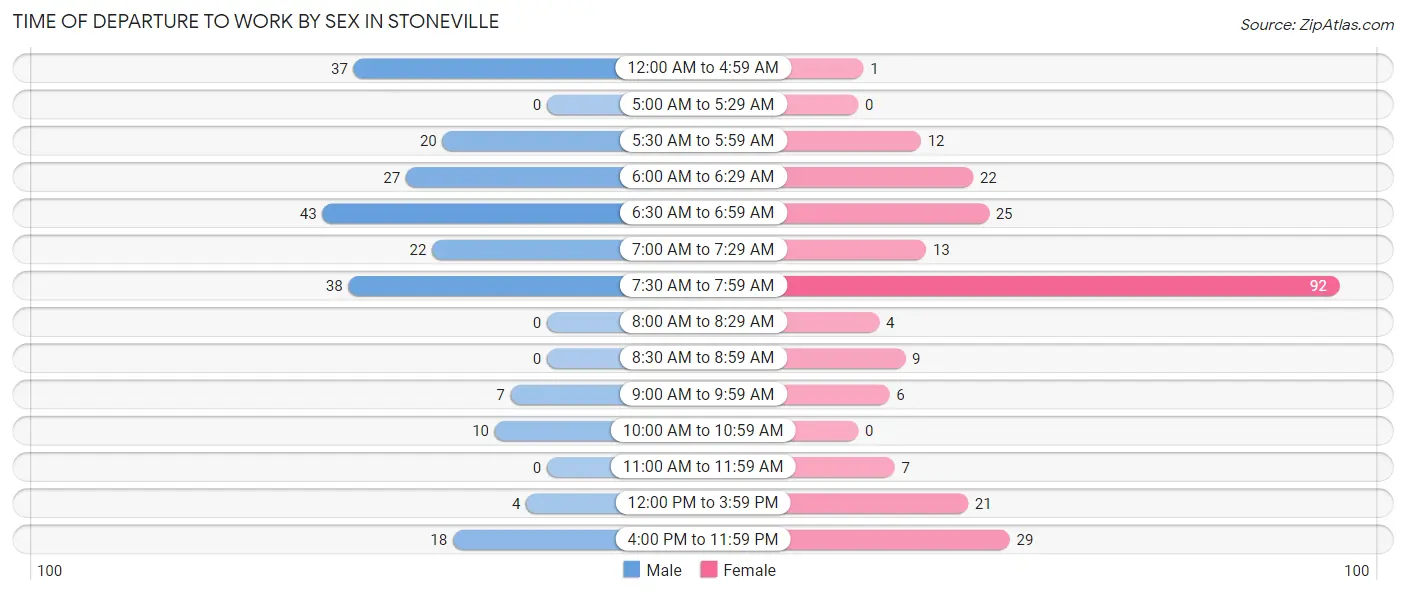
| Time of Departure | Male | Female |
| 12:00 AM to 4:59 AM | 37 (16.4%) | 1 (0.4%) |
| 5:00 AM to 5:29 AM | 0 (0.0%) | 0 (0.0%) |
| 5:30 AM to 5:59 AM | 20 (8.8%) | 12 (5.0%) |
| 6:00 AM to 6:29 AM | 27 (11.9%) | 22 (9.1%) |
| 6:30 AM to 6:59 AM | 43 (19.0%) | 25 (10.4%) |
| 7:00 AM to 7:29 AM | 22 (9.7%) | 13 (5.4%) |
| 7:30 AM to 7:59 AM | 38 (16.8%) | 92 (38.2%) |
| 8:00 AM to 8:29 AM | 0 (0.0%) | 4 (1.7%) |
| 8:30 AM to 8:59 AM | 0 (0.0%) | 9 (3.7%) |
| 9:00 AM to 9:59 AM | 7 (3.1%) | 6 (2.5%) |
| 10:00 AM to 10:59 AM | 10 (4.4%) | 0 (0.0%) |
| 11:00 AM to 11:59 AM | 0 (0.0%) | 7 (2.9%) |
| 12:00 PM to 3:59 PM | 4 (1.8%) | 21 (8.7%) |
| 4:00 PM to 11:59 PM | 18 (8.0%) | 29 (12.0%) |
| Total | 226 (100.0%) | 241 (100.0%) |
Housing Occupancy in Stoneville
Occupancy by Ownership in Stoneville
Of the total 474 dwellings in Stoneville, owner-occupied units account for 267 (56.3%), while renter-occupied units make up 207 (43.7%).
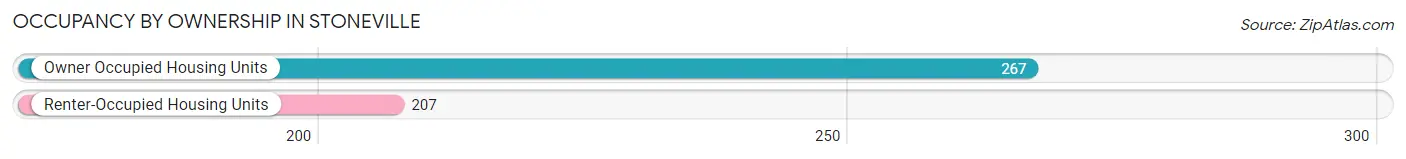
| Occupancy | # Housing Units | % Housing Units |
| Owner Occupied Housing Units | 267 | 56.3% |
| Renter-Occupied Housing Units | 207 | 43.7% |
| Total Occupied Housing Units | 474 | 100.0% |
Occupancy by Household Size in Stoneville
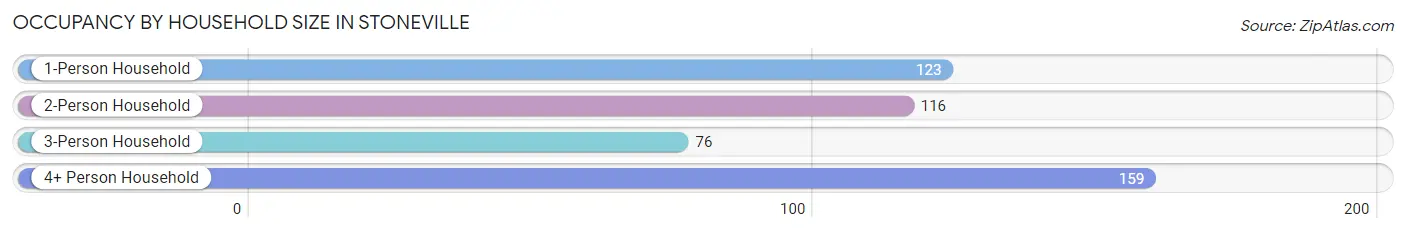
| Household Size | # Housing Units | % Housing Units |
| 1-Person Household | 123 | 26.0% |
| 2-Person Household | 116 | 24.5% |
| 3-Person Household | 76 | 16.0% |
| 4+ Person Household | 159 | 33.5% |
| Total Housing Units | 474 | 100.0% |
Occupancy by Ownership by Household Size in Stoneville
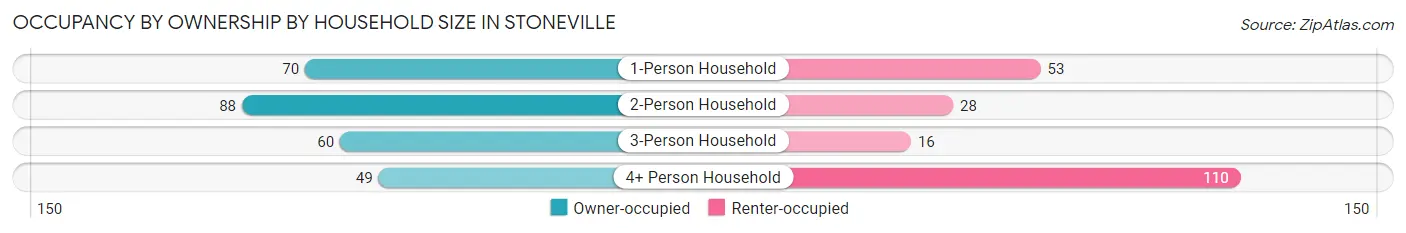
| Household Size | Owner-occupied | Renter-occupied |
| 1-Person Household | 70 (56.9%) | 53 (43.1%) |
| 2-Person Household | 88 (75.9%) | 28 (24.1%) |
| 3-Person Household | 60 (78.9%) | 16 (21.0%) |
| 4+ Person Household | 49 (30.8%) | 110 (69.2%) |
| Total Housing Units | 267 (56.3%) | 207 (43.7%) |
Occupancy by Educational Attainment in Stoneville
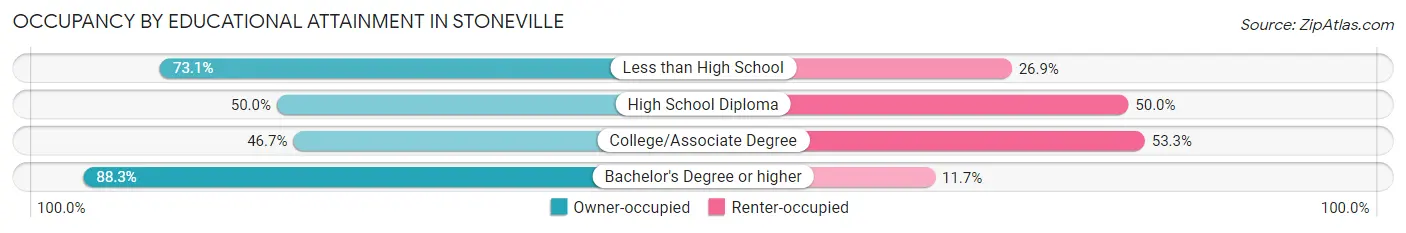
| Household Size | Owner-occupied | Renter-occupied |
| Less than High School | 49 (73.1%) | 18 (26.9%) |
| High School Diploma | 43 (50.0%) | 43 (50.0%) |
| College/Associate Degree | 122 (46.7%) | 139 (53.3%) |
| Bachelor's Degree or higher | 53 (88.3%) | 7 (11.7%) |
Occupancy by Age of Householder in Stoneville
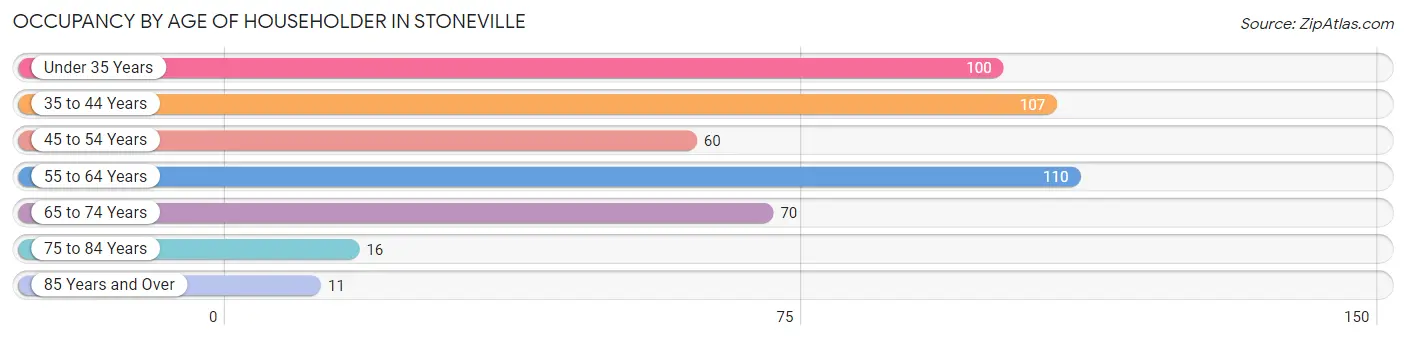
| Age Bracket | # Households | % Households |
| Under 35 Years | 100 | 21.1% |
| 35 to 44 Years | 107 | 22.6% |
| 45 to 54 Years | 60 | 12.7% |
| 55 to 64 Years | 110 | 23.2% |
| 65 to 74 Years | 70 | 14.8% |
| 75 to 84 Years | 16 | 3.4% |
| 85 Years and Over | 11 | 2.3% |
| Total | 474 | 100.0% |
Housing Finances in Stoneville
Median Income by Occupancy in Stoneville
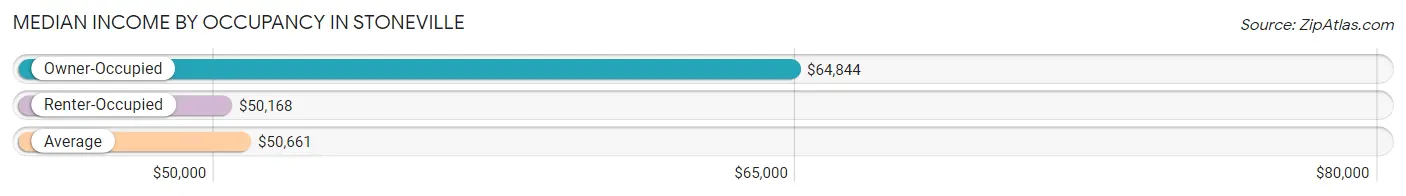
| Occupancy Type | # Households | Median Income |
| Owner-Occupied | 267 (56.3%) | $64,844 |
| Renter-Occupied | 207 (43.7%) | $50,168 |
| Average | 474 (100.0%) | $50,661 |
Occupancy by Householder Income Bracket in Stoneville
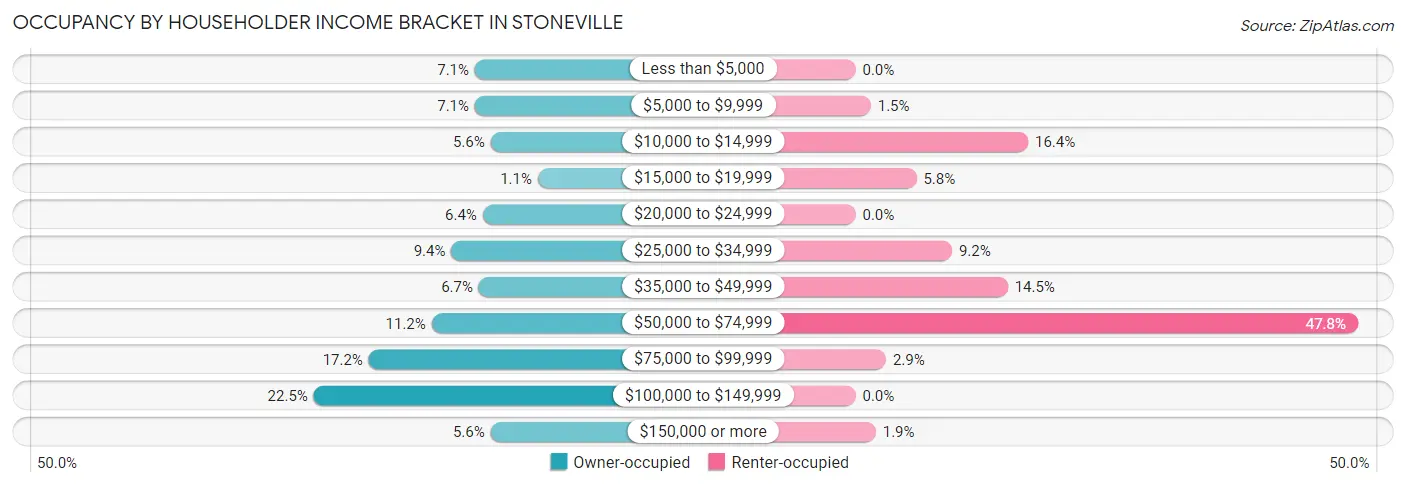
| Income Bracket | Owner-occupied | Renter-occupied |
| Less than $5,000 | 19 (7.1%) | 0 (0.0%) |
| $5,000 to $9,999 | 19 (7.1%) | 3 (1.5%) |
| $10,000 to $14,999 | 15 (5.6%) | 34 (16.4%) |
| $15,000 to $19,999 | 3 (1.1%) | 12 (5.8%) |
| $20,000 to $24,999 | 17 (6.4%) | 0 (0.0%) |
| $25,000 to $34,999 | 25 (9.4%) | 19 (9.2%) |
| $35,000 to $49,999 | 18 (6.7%) | 30 (14.5%) |
| $50,000 to $74,999 | 30 (11.2%) | 99 (47.8%) |
| $75,000 to $99,999 | 46 (17.2%) | 6 (2.9%) |
| $100,000 to $149,999 | 60 (22.5%) | 0 (0.0%) |
| $150,000 or more | 15 (5.6%) | 4 (1.9%) |
| Total | 267 (100.0%) | 207 (100.0%) |
Monthly Housing Cost Tiers in Stoneville
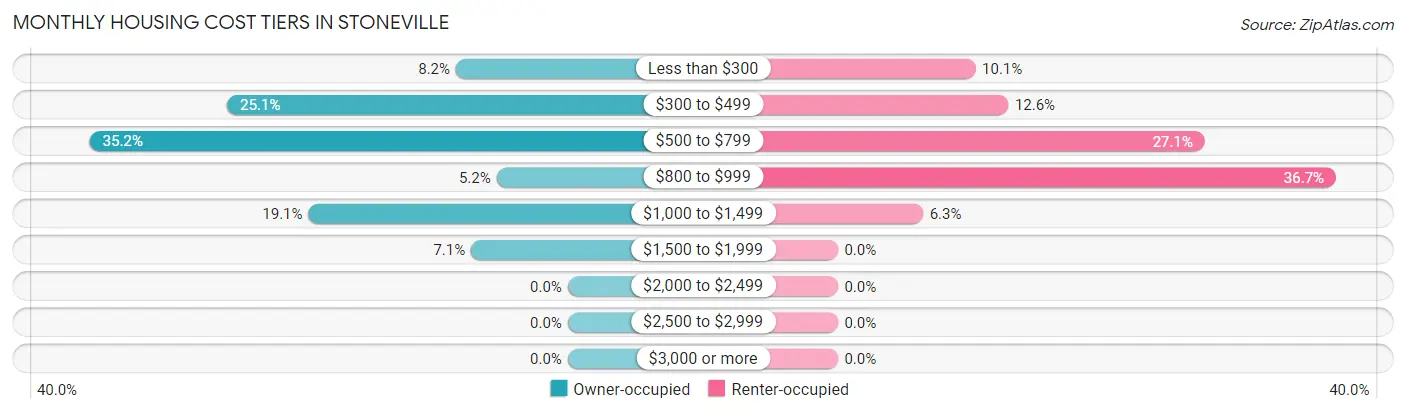
| Monthly Cost | Owner-occupied | Renter-occupied |
| Less than $300 | 22 (8.2%) | 21 (10.1%) |
| $300 to $499 | 67 (25.1%) | 26 (12.6%) |
| $500 to $799 | 94 (35.2%) | 56 (27.1%) |
| $800 to $999 | 14 (5.2%) | 76 (36.7%) |
| $1,000 to $1,499 | 51 (19.1%) | 13 (6.3%) |
| $1,500 to $1,999 | 19 (7.1%) | 0 (0.0%) |
| $2,000 to $2,499 | 0 (0.0%) | 0 (0.0%) |
| $2,500 to $2,999 | 0 (0.0%) | 0 (0.0%) |
| $3,000 or more | 0 (0.0%) | 0 (0.0%) |
| Total | 267 (100.0%) | 207 (100.0%) |
Physical Housing Characteristics in Stoneville
Housing Structures in Stoneville
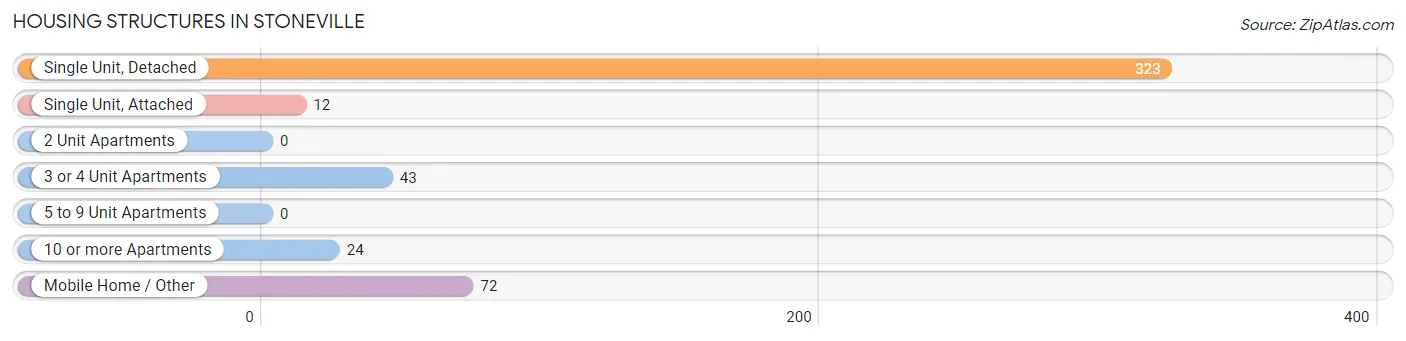
| Structure Type | # Housing Units | % Housing Units |
| Single Unit, Detached | 323 | 68.1% |
| Single Unit, Attached | 12 | 2.5% |
| 2 Unit Apartments | 0 | 0.0% |
| 3 or 4 Unit Apartments | 43 | 9.1% |
| 5 to 9 Unit Apartments | 0 | 0.0% |
| 10 or more Apartments | 24 | 5.1% |
| Mobile Home / Other | 72 | 15.2% |
| Total | 474 | 100.0% |
Housing Structures by Occupancy in Stoneville
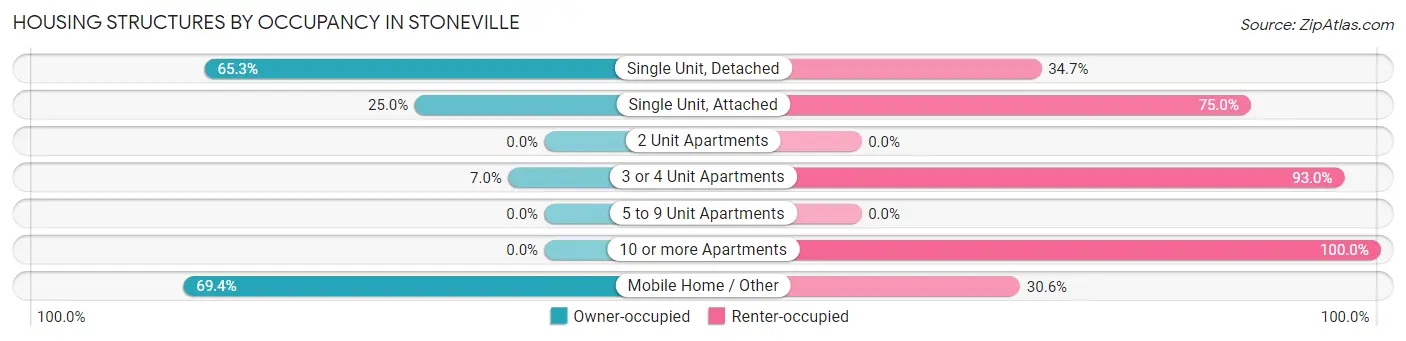
| Structure Type | Owner-occupied | Renter-occupied |
| Single Unit, Detached | 211 (65.3%) | 112 (34.7%) |
| Single Unit, Attached | 3 (25.0%) | 9 (75.0%) |
| 2 Unit Apartments | 0 (0.0%) | 0 (0.0%) |
| 3 or 4 Unit Apartments | 3 (7.0%) | 40 (93.0%) |
| 5 to 9 Unit Apartments | 0 (0.0%) | 0 (0.0%) |
| 10 or more Apartments | 0 (0.0%) | 24 (100.0%) |
| Mobile Home / Other | 50 (69.4%) | 22 (30.6%) |
| Total | 267 (56.3%) | 207 (43.7%) |
Housing Structures by Number of Rooms in Stoneville
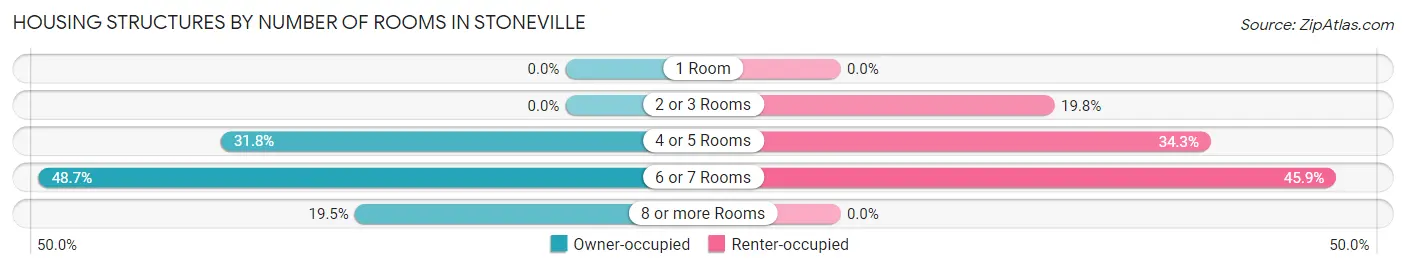
| Number of Rooms | Owner-occupied | Renter-occupied |
| 1 Room | 0 (0.0%) | 0 (0.0%) |
| 2 or 3 Rooms | 0 (0.0%) | 41 (19.8%) |
| 4 or 5 Rooms | 85 (31.8%) | 71 (34.3%) |
| 6 or 7 Rooms | 130 (48.7%) | 95 (45.9%) |
| 8 or more Rooms | 52 (19.5%) | 0 (0.0%) |
| Total | 267 (100.0%) | 207 (100.0%) |
Housing Structure by Heating Type in Stoneville
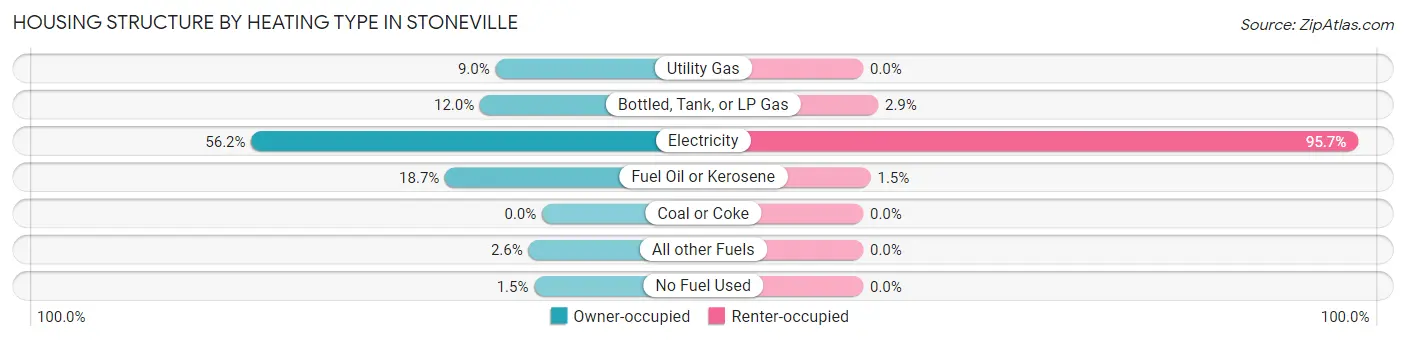
| Heating Type | Owner-occupied | Renter-occupied |
| Utility Gas | 24 (9.0%) | 0 (0.0%) |
| Bottled, Tank, or LP Gas | 32 (12.0%) | 6 (2.9%) |
| Electricity | 150 (56.2%) | 198 (95.7%) |
| Fuel Oil or Kerosene | 50 (18.7%) | 3 (1.5%) |
| Coal or Coke | 0 (0.0%) | 0 (0.0%) |
| All other Fuels | 7 (2.6%) | 0 (0.0%) |
| No Fuel Used | 4 (1.5%) | 0 (0.0%) |
| Total | 267 (100.0%) | 207 (100.0%) |
Household Vehicle Usage in Stoneville
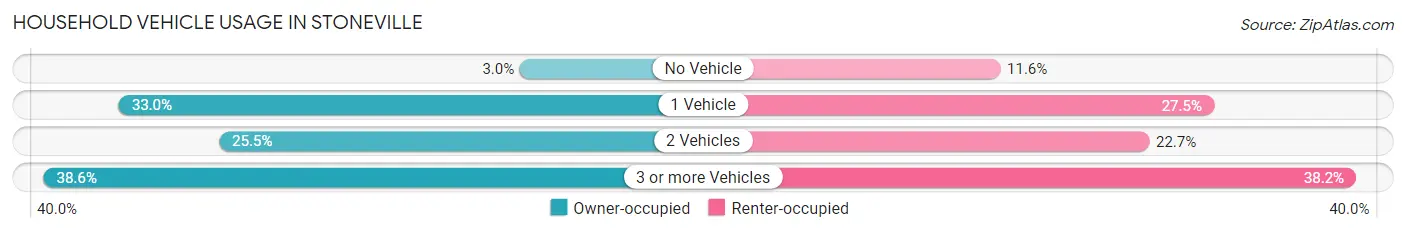
| Vehicles per Household | Owner-occupied | Renter-occupied |
| No Vehicle | 8 (3.0%) | 24 (11.6%) |
| 1 Vehicle | 88 (33.0%) | 57 (27.5%) |
| 2 Vehicles | 68 (25.5%) | 47 (22.7%) |
| 3 or more Vehicles | 103 (38.6%) | 79 (38.2%) |
| Total | 267 (100.0%) | 207 (100.0%) |
Real Estate & Mortgages in Stoneville
Real Estate and Mortgage Overview in Stoneville
| Characteristic | Without Mortgage | With Mortgage |
| Housing Units | 172 | 95 |
| Median Property Value | $102,300 | $185,400 |
| Median Household Income | $37,500 | $5 |
| Monthly Housing Costs | $485 | $0 |
| Real Estate Taxes | $1,125 | $18 |
Property Value by Mortgage Status in Stoneville
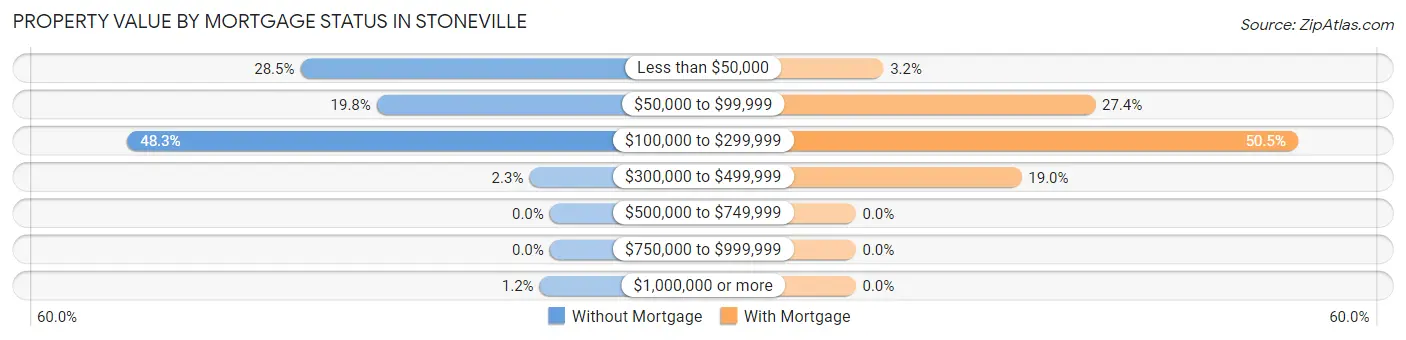
| Property Value | Without Mortgage | With Mortgage |
| Less than $50,000 | 49 (28.5%) | 3 (3.2%) |
| $50,000 to $99,999 | 34 (19.8%) | 26 (27.4%) |
| $100,000 to $299,999 | 83 (48.3%) | 48 (50.5%) |
| $300,000 to $499,999 | 4 (2.3%) | 18 (19.0%) |
| $500,000 to $749,999 | 0 (0.0%) | 0 (0.0%) |
| $750,000 to $999,999 | 0 (0.0%) | 0 (0.0%) |
| $1,000,000 or more | 2 (1.2%) | 0 (0.0%) |
| Total | 172 (100.0%) | 95 (100.0%) |
Household Income by Mortgage Status in Stoneville
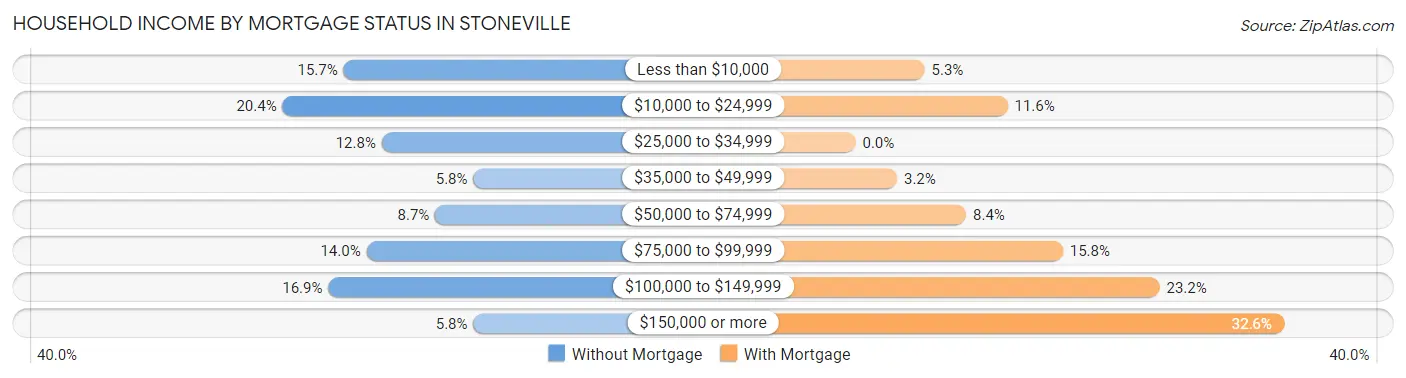
| Household Income | Without Mortgage | With Mortgage |
| Less than $10,000 | 27 (15.7%) | 5 (5.3%) |
| $10,000 to $24,999 | 35 (20.3%) | 11 (11.6%) |
| $25,000 to $34,999 | 22 (12.8%) | 0 (0.0%) |
| $35,000 to $49,999 | 10 (5.8%) | 3 (3.2%) |
| $50,000 to $74,999 | 15 (8.7%) | 8 (8.4%) |
| $75,000 to $99,999 | 24 (14.0%) | 15 (15.8%) |
| $100,000 to $149,999 | 29 (16.9%) | 22 (23.2%) |
| $150,000 or more | 10 (5.8%) | 31 (32.6%) |
| Total | 172 (100.0%) | 95 (100.0%) |
Property Value to Household Income Ratio in Stoneville
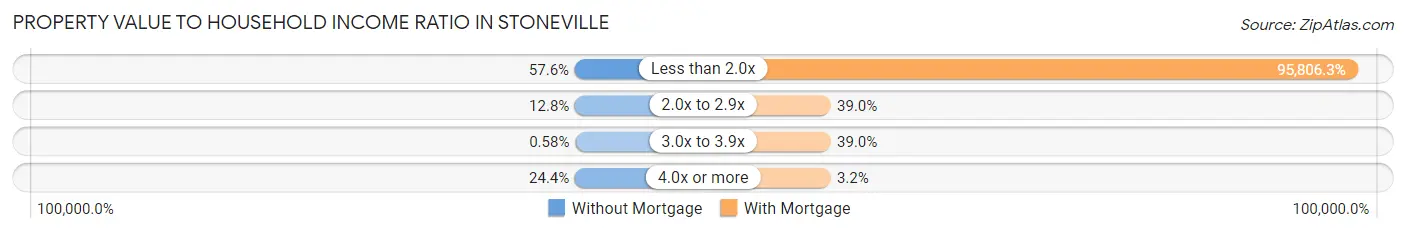
| Value-to-Income Ratio | Without Mortgage | With Mortgage |
| Less than 2.0x | 99 (57.6%) | 91,016 (95,806.3%) |
| 2.0x to 2.9x | 22 (12.8%) | 37 (39.0%) |
| 3.0x to 3.9x | 1 (0.6%) | 37 (39.0%) |
| 4.0x or more | 42 (24.4%) | 3 (3.2%) |
| Total | 172 (100.0%) | 95 (100.0%) |
Real Estate Taxes by Mortgage Status in Stoneville
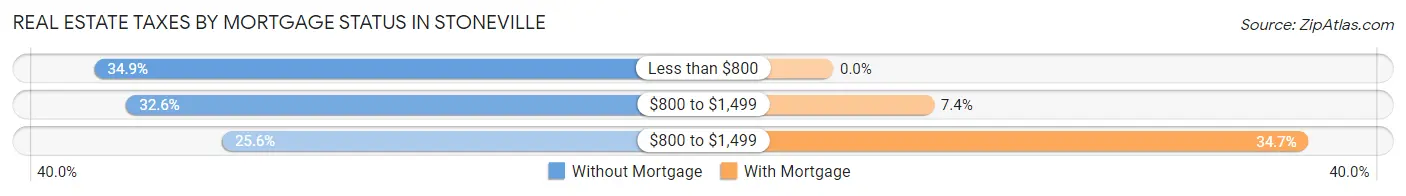
| Property Taxes | Without Mortgage | With Mortgage |
| Less than $800 | 60 (34.9%) | 0 (0.0%) |
| $800 to $1,499 | 56 (32.6%) | 7 (7.4%) |
| $800 to $1,499 | 44 (25.6%) | 33 (34.7%) |
| Total | 172 (100.0%) | 95 (100.0%) |
Health & Disability in Stoneville
Health Insurance Coverage by Age in Stoneville
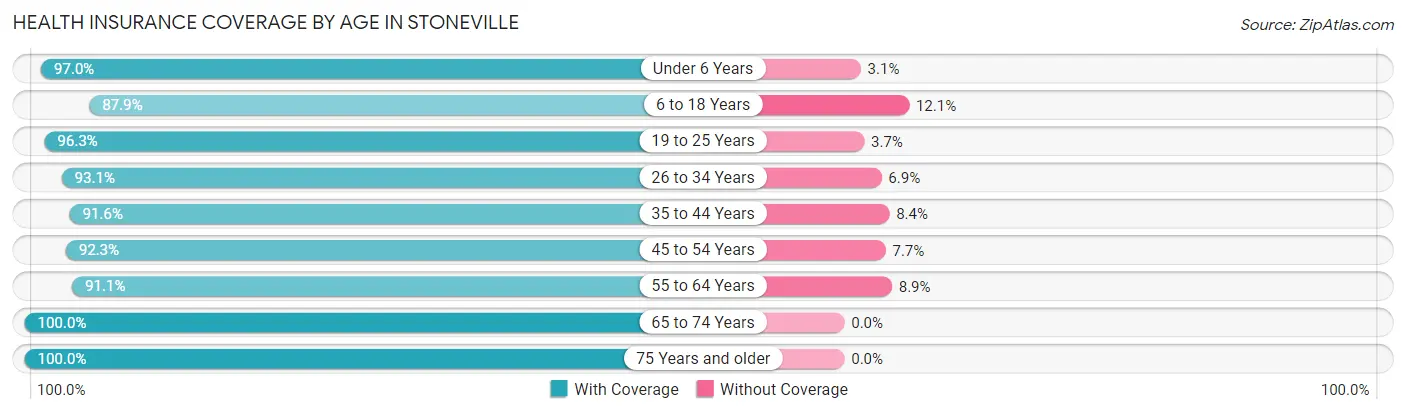
| Age Bracket | With Coverage | Without Coverage |
| Under 6 Years | 127 (97.0%) | 4 (3.0%) |
| 6 to 18 Years | 124 (87.9%) | 17 (12.1%) |
| 19 to 25 Years | 78 (96.3%) | 3 (3.7%) |
| 26 to 34 Years | 121 (93.1%) | 9 (6.9%) |
| 35 to 44 Years | 164 (91.6%) | 15 (8.4%) |
| 45 to 54 Years | 84 (92.3%) | 7 (7.7%) |
| 55 to 64 Years | 144 (91.1%) | 14 (8.9%) |
| 65 to 74 Years | 95 (100.0%) | 0 (0.0%) |
| 75 Years and older | 46 (100.0%) | 0 (0.0%) |
| Total | 983 (93.4%) | 69 (6.6%) |
Health Insurance Coverage by Citizenship Status in Stoneville
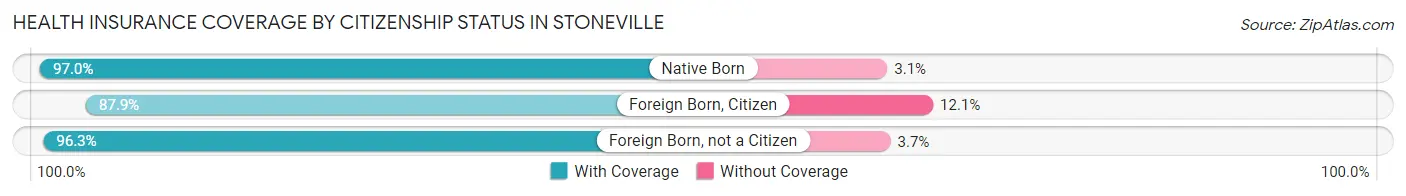
| Citizenship Status | With Coverage | Without Coverage |
| Native Born | 127 (97.0%) | 4 (3.0%) |
| Foreign Born, Citizen | 124 (87.9%) | 17 (12.1%) |
| Foreign Born, not a Citizen | 78 (96.3%) | 3 (3.7%) |
Health Insurance Coverage by Household Income in Stoneville
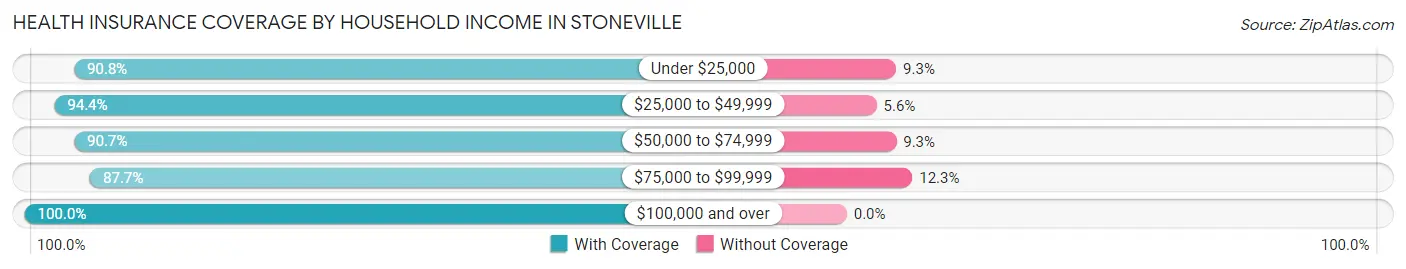
| Household Income | With Coverage | Without Coverage |
| Under $25,000 | 157 (90.7%) | 16 (9.2%) |
| $25,000 to $49,999 | 254 (94.4%) | 15 (5.6%) |
| $50,000 to $74,999 | 235 (90.7%) | 24 (9.3%) |
| $75,000 to $99,999 | 100 (87.7%) | 14 (12.3%) |
| $100,000 and over | 237 (100.0%) | 0 (0.0%) |
Public vs Private Health Insurance Coverage by Age in Stoneville
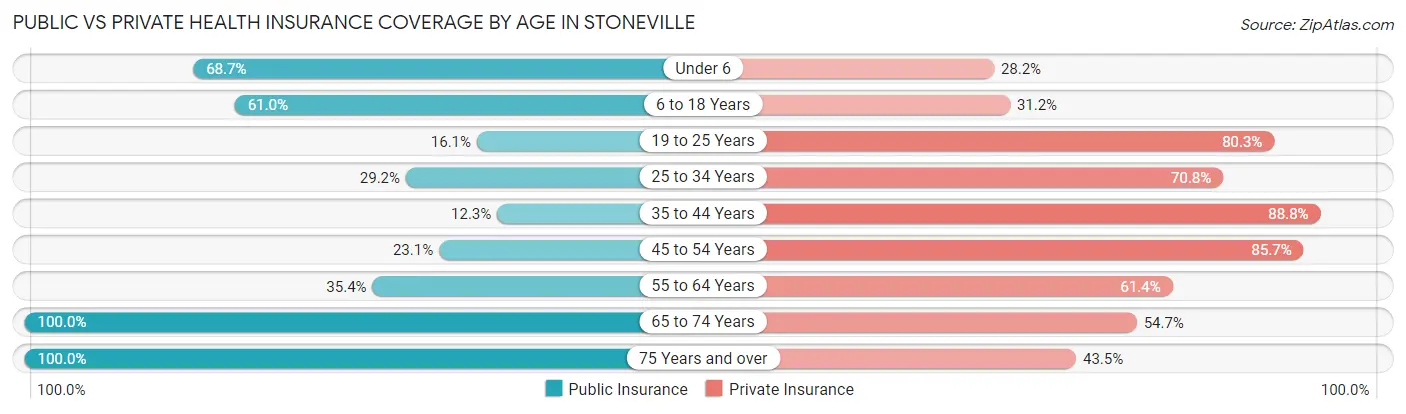
| Age Bracket | Public Insurance | Private Insurance |
| Under 6 | 90 (68.7%) | 37 (28.2%) |
| 6 to 18 Years | 86 (61.0%) | 44 (31.2%) |
| 19 to 25 Years | 13 (16.1%) | 65 (80.2%) |
| 25 to 34 Years | 38 (29.2%) | 92 (70.8%) |
| 35 to 44 Years | 22 (12.3%) | 159 (88.8%) |
| 45 to 54 Years | 21 (23.1%) | 78 (85.7%) |
| 55 to 64 Years | 56 (35.4%) | 97 (61.4%) |
| 65 to 74 Years | 95 (100.0%) | 52 (54.7%) |
| 75 Years and over | 46 (100.0%) | 20 (43.5%) |
| Total | 467 (44.4%) | 644 (61.2%) |
Disability Status by Sex by Age in Stoneville
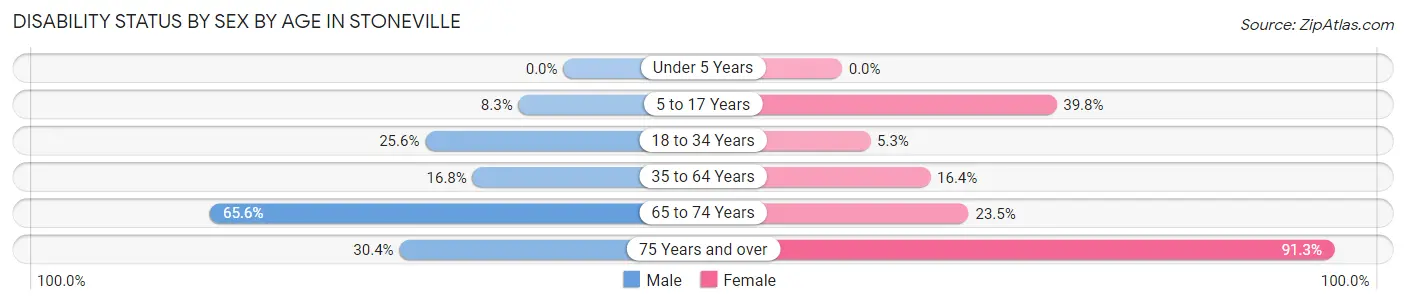
| Age Bracket | Male | Female |
| Under 5 Years | 0 (0.0%) | 0 (0.0%) |
| 5 to 17 Years | 5 (8.3%) | 41 (39.8%) |
| 18 to 34 Years | 20 (25.6%) | 7 (5.3%) |
| 35 to 64 Years | 32 (16.8%) | 39 (16.4%) |
| 65 to 74 Years | 40 (65.6%) | 8 (23.5%) |
| 75 Years and over | 7 (30.4%) | 21 (91.3%) |
Disability Class by Sex by Age in Stoneville
Disability Class: Hearing Difficulty
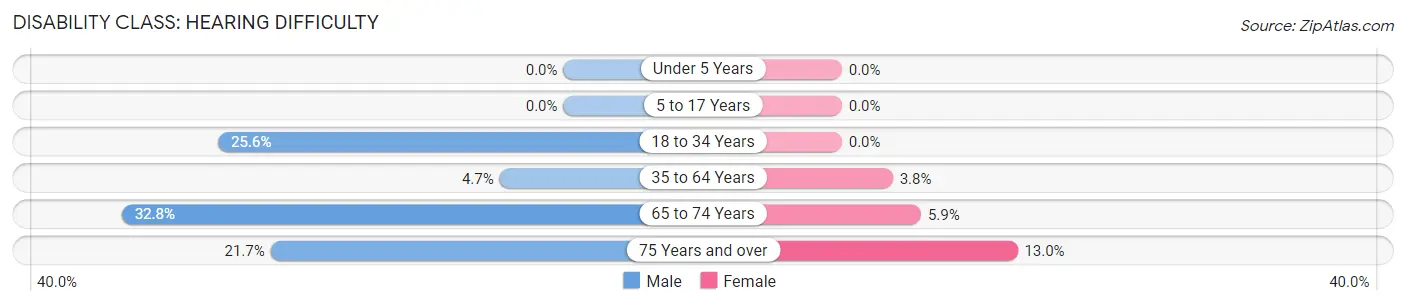
| Age Bracket | Male | Female |
| Under 5 Years | 0 (0.0%) | 0 (0.0%) |
| 5 to 17 Years | 0 (0.0%) | 0 (0.0%) |
| 18 to 34 Years | 20 (25.6%) | 0 (0.0%) |
| 35 to 64 Years | 9 (4.7%) | 9 (3.8%) |
| 65 to 74 Years | 20 (32.8%) | 2 (5.9%) |
| 75 Years and over | 5 (21.7%) | 3 (13.0%) |
Disability Class: Vision Difficulty
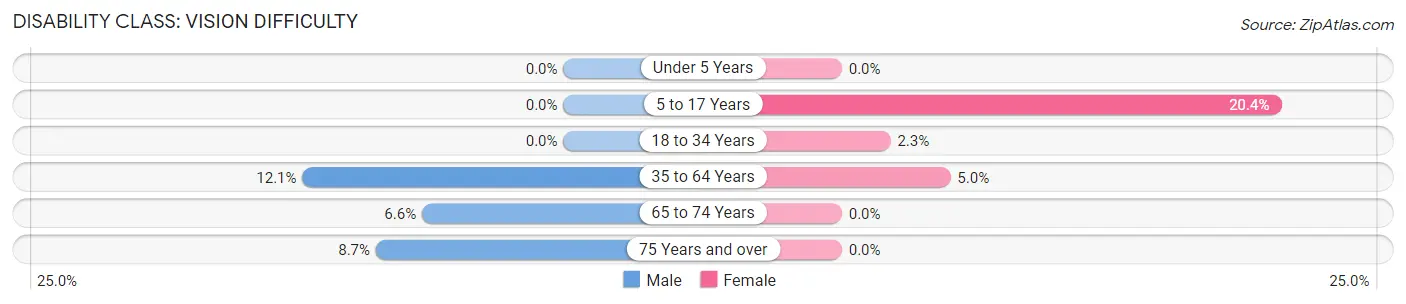
| Age Bracket | Male | Female |
| Under 5 Years | 0 (0.0%) | 0 (0.0%) |
| 5 to 17 Years | 0 (0.0%) | 21 (20.4%) |
| 18 to 34 Years | 0 (0.0%) | 3 (2.3%) |
| 35 to 64 Years | 23 (12.1%) | 12 (5.0%) |
| 65 to 74 Years | 4 (6.6%) | 0 (0.0%) |
| 75 Years and over | 2 (8.7%) | 0 (0.0%) |
Disability Class: Cognitive Difficulty
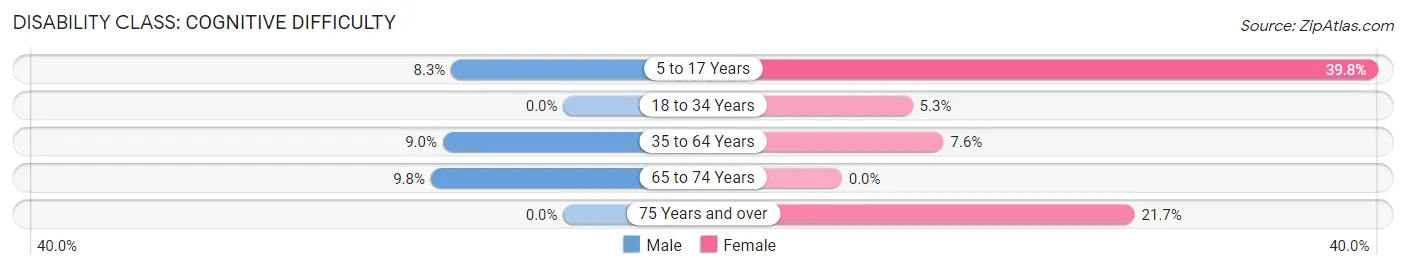
| Age Bracket | Male | Female |
| 5 to 17 Years | 5 (8.3%) | 41 (39.8%) |
| 18 to 34 Years | 0 (0.0%) | 7 (5.3%) |
| 35 to 64 Years | 17 (8.9%) | 18 (7.6%) |
| 65 to 74 Years | 6 (9.8%) | 0 (0.0%) |
| 75 Years and over | 0 (0.0%) | 5 (21.7%) |
Disability Class: Ambulatory Difficulty
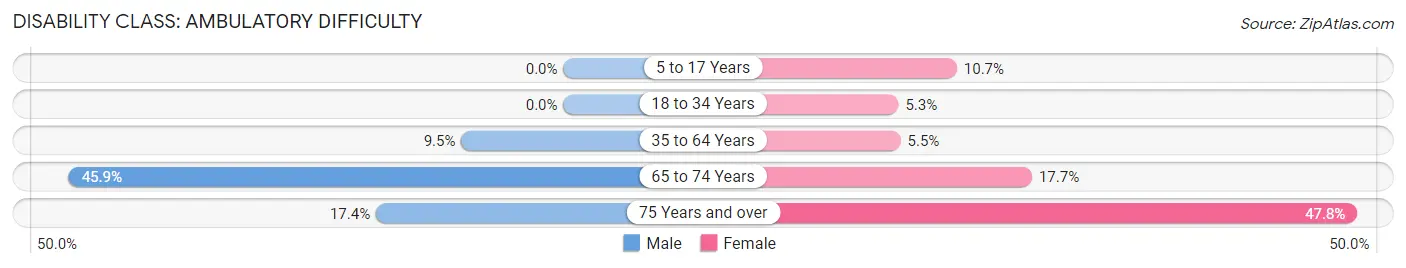
| Age Bracket | Male | Female |
| 5 to 17 Years | 0 (0.0%) | 11 (10.7%) |
| 18 to 34 Years | 0 (0.0%) | 7 (5.3%) |
| 35 to 64 Years | 18 (9.5%) | 13 (5.5%) |
| 65 to 74 Years | 28 (45.9%) | 6 (17.6%) |
| 75 Years and over | 4 (17.4%) | 11 (47.8%) |
Disability Class: Self-Care Difficulty
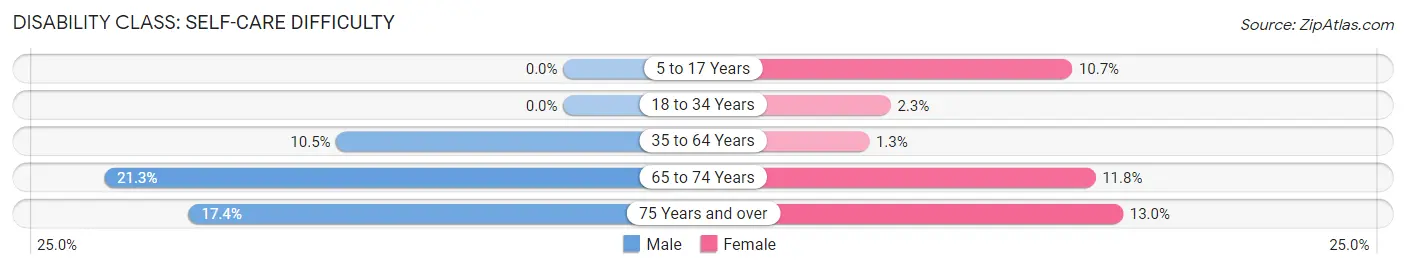
| Age Bracket | Male | Female |
| 5 to 17 Years | 0 (0.0%) | 11 (10.7%) |
| 18 to 34 Years | 0 (0.0%) | 3 (2.3%) |
| 35 to 64 Years | 20 (10.5%) | 3 (1.3%) |
| 65 to 74 Years | 13 (21.3%) | 4 (11.8%) |
| 75 Years and over | 4 (17.4%) | 3 (13.0%) |
Technology Access in Stoneville
Computing Device Access in Stoneville
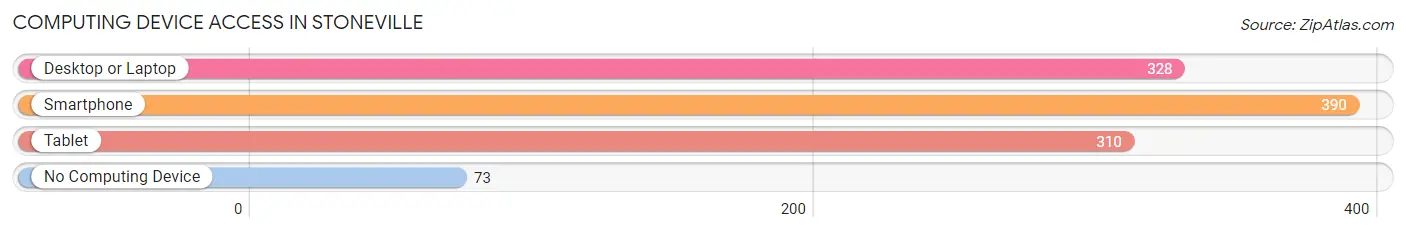
| Device Type | # Households | % Households |
| Desktop or Laptop | 328 | 69.2% |
| Smartphone | 390 | 82.3% |
| Tablet | 310 | 65.4% |
| No Computing Device | 73 | 15.4% |
| Total | 474 | 100.0% |
Internet Access in Stoneville
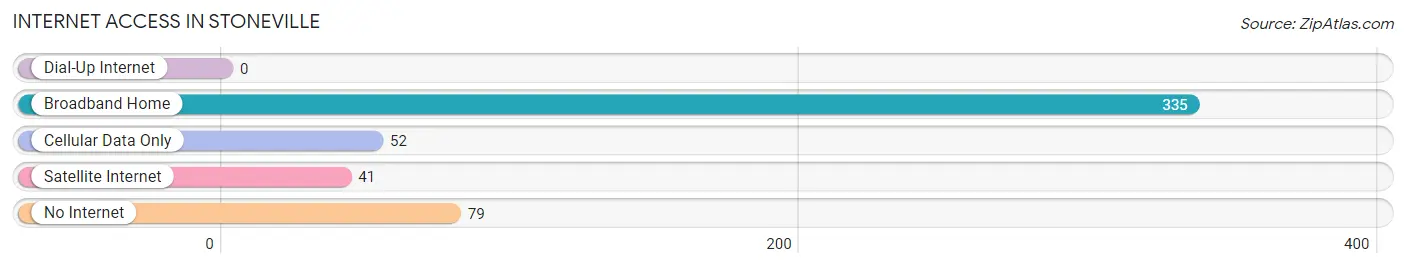
| Internet Type | # Households | % Households |
| Dial-Up Internet | 0 | 0.0% |
| Broadband Home | 335 | 70.7% |
| Cellular Data Only | 52 | 11.0% |
| Satellite Internet | 41 | 8.6% |
| No Internet | 79 | 16.7% |
| Total | 474 | 100.0% |
Stoneville Summary
History
The town of Stoneville, North Carolina is located in Rockingham County, in the heart of the Piedmont region of the state. The town was founded in 1883 by the Stoneville Manufacturing Company, which was established to produce cotton and woolen goods. The company was owned by the Stone family, who had previously owned a cotton mill in nearby Reidsville. The town was named after the family, and the Stone family continued to own and operate the mill until the early 20th century.
The town of Stoneville grew rapidly in the late 19th and early 20th centuries, as the Stoneville Manufacturing Company expanded its operations and attracted new businesses. By the 1920s, the town had become a major center for the production of textiles, and the Stoneville Manufacturing Company was one of the largest employers in the area. The town also had a thriving retail sector, with several stores and restaurants.
In the mid-20th century, the textile industry in Stoneville began to decline, as the industry shifted to other parts of the country. The Stoneville Manufacturing Company closed its doors in the 1950s, and the town's economy shifted to other industries, such as furniture manufacturing and agriculture.
Geography
Stoneville is located in the Piedmont region of North Carolina, in the foothills of the Blue Ridge Mountains. The town is situated on the banks of the Dan River, and is surrounded by rolling hills and forests. The town is located approximately 30 miles north of Greensboro, and is accessible via Interstate 85 and US Highway 220.
The climate in Stoneville is mild, with hot summers and cool winters. The average annual temperature is around 60 degrees Fahrenheit, and the average annual precipitation is around 40 inches.
Economy
The economy of Stoneville is largely based on agriculture and manufacturing. The town is home to several furniture manufacturing companies, as well as several agricultural businesses. The town is also home to several retail stores and restaurants.
The town is also home to several educational institutions, including Rockingham Community College and the Stoneville Technical Institute. The town is also home to several churches, and is served by the Rockingham County School System.
Demographics
As of the 2010 census, the population of Stoneville was 2,845. The racial makeup of the town was 79.3% White, 16.2% African American, 0.3% Native American, 0.7% Asian, 0.1% Pacific Islander, and 3.4% from other races. The median household income was $35,938, and the median family income was $41,944. The per capita income was $17,845.
The town is served by the Rockingham County School System, and is home to several churches. The town is also home to several parks and recreational facilities, including the Stoneville Community Park and the Stoneville Recreation Center.
Common Questions
What is Per Capita Income in Stoneville?
Per Capita income in Stoneville is $25,424.
What is the Median Family Income in Stoneville?
Median Family Income in Stoneville is $51,728.
What is the Median Household income in Stoneville?
Median Household Income in Stoneville is $50,661.
What is Family Income Deficit in Stoneville?
Family Income Deficit in Stoneville is $11,396.
Families that are below poverty line in Stoneville earn $11,396 less on average than the poverty threshold level.
What is Inequality or Gini Index in Stoneville?
Inequality or Gini Index in Stoneville is 0.45.
What is the Total Population of Stoneville?
Total Population of Stoneville is 1,052.
What is the Total Male Population of Stoneville?
Total Male Population of Stoneville is 481.
What is the Total Female Population of Stoneville?
Total Female Population of Stoneville is 571.
What is the Ratio of Males per 100 Females in Stoneville?
There are 84.24 Males per 100 Females in Stoneville.
What is the Ratio of Females per 100 Males in Stoneville?
There are 118.71 Females per 100 Males in Stoneville.
What is the Median Population Age in Stoneville?
Median Population Age in Stoneville is 38.0 Years.
What is the Average Family Size in Stoneville
Average Family Size in Stoneville is 2.7 People.
What is the Average Household Size in Stoneville
Average Household Size in Stoneville is 2.2 People.
How Large is the Labor Force in Stoneville?
There are 518 People in the Labor Forcein in Stoneville.
What is the Percentage of People in the Labor Force in Stoneville?
63.6% of People are in the Labor Force in Stoneville.
What is the Unemployment Rate in Stoneville?
Unemployment Rate in Stoneville is 6.8%.