Randleman, NC Map & Demographics
Randleman Map
Randleman Overview
$26,360
PER CAPITA INCOME
$81,705
AVG FAMILY INCOME
$63,040
AVG HOUSEHOLD INCOME
51.6%
WAGE / INCOME GAP [ % ]
48.4¢/ $1
WAGE / INCOME GAP [ $ ]
0.45
INEQUALITY / GINI INDEX
4,573
TOTAL POPULATION
2,304
MALE POPULATION
2,269
FEMALE POPULATION
101.54
MALES / 100 FEMALES
98.48
FEMALES / 100 MALES
33.5
MEDIAN AGE
3.9
AVG FAMILY SIZE
3.0
AVG HOUSEHOLD SIZE
1,979
LABOR FORCE [ PEOPLE ]
58.5%
PERCENT IN LABOR FORCE
2.0%
UNEMPLOYMENT RATE
Randleman Zip Codes
Randleman Area Codes
Income in Randleman
Income Overview in Randleman
Per Capita Income in Randleman is $26,360, while median incomes of families and households are $81,705 and $63,040 respectively.
| Characteristic | Number | Measure |
| Per Capita Income | 4,573 | $26,360 |
| Median Family Income | 991 | $81,705 |
| Mean Family Income | 991 | $96,199 |
| Median Household Income | 1,523 | $63,040 |
| Mean Household Income | 1,523 | $76,160 |
| Income Deficit | 991 | $0 |
| Wage / Income Gap (%) | 4,573 | 51.60% |
| Wage / Income Gap ($) | 4,573 | 48.40¢ per $1 |
| Gini / Inequality Index | 4,573 | 0.45 |
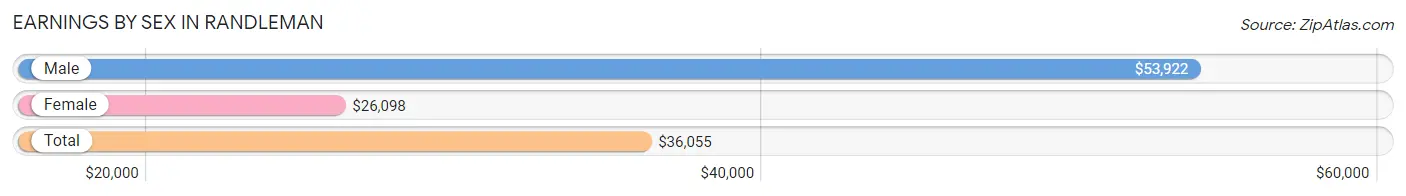
Earnings by Sex in Randleman
Average Earnings in Randleman are $36,055, $53,922 for men and $26,098 for women, a difference of 51.6%.
| Sex | Number | Average Earnings |
| Male | 983 (44.5%) | $53,922 |
| Female | 1,227 (55.5%) | $26,098 |
| Total | 2,210 (100.0%) | $36,055 |
Earnings by Sex by Income Bracket in Randleman
The most common earnings brackets in Randleman are $100,000+ for men (208 | 21.2%) and $2,499 or less for women (226 | 18.4%).
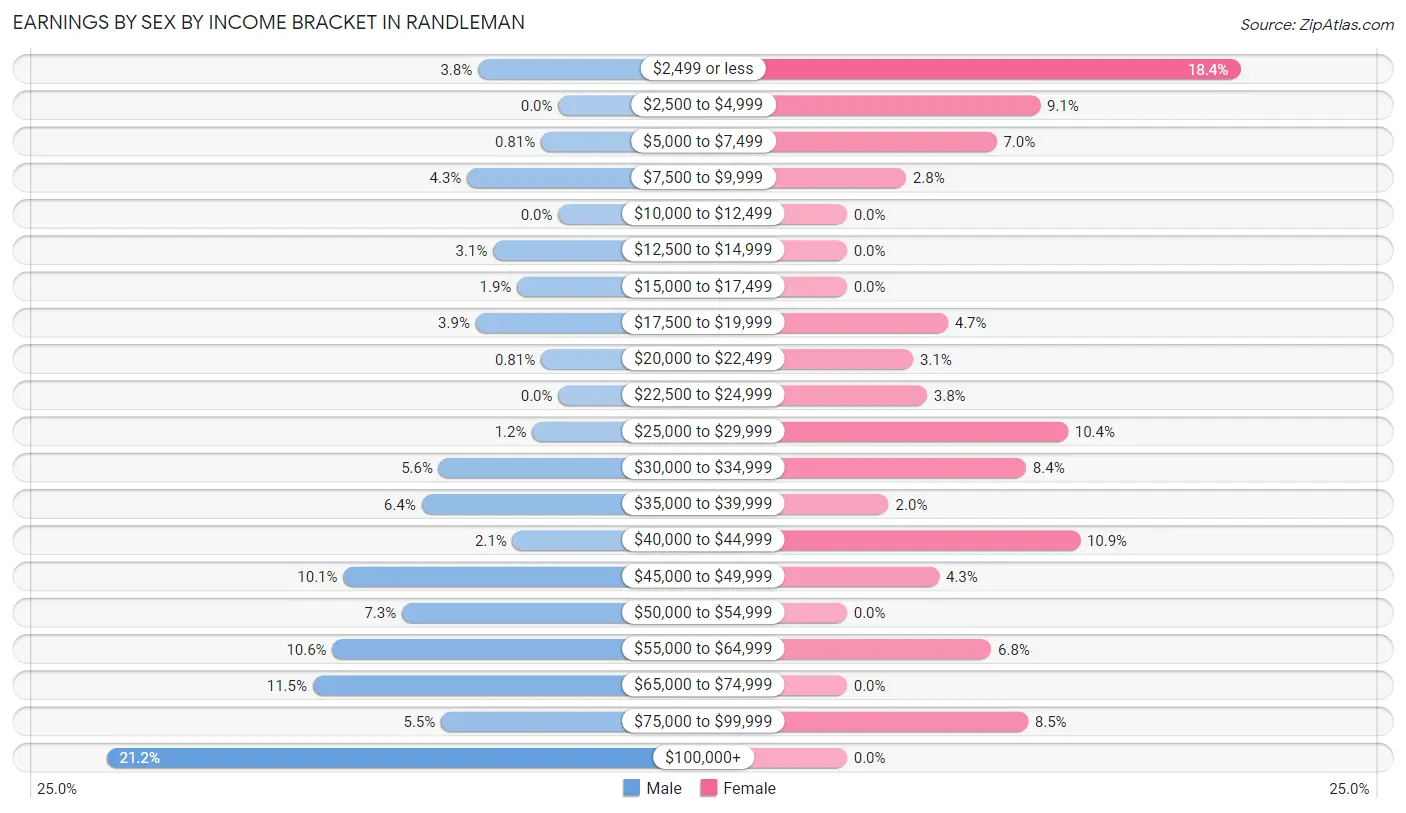
| Income | Male | Female |
| $2,499 or less | 37 (3.8%) | 226 (18.4%) |
| $2,500 to $4,999 | 0 (0.0%) | 111 (9.0%) |
| $5,000 to $7,499 | 8 (0.8%) | 86 (7.0%) |
| $7,500 to $9,999 | 42 (4.3%) | 34 (2.8%) |
| $10,000 to $12,499 | 0 (0.0%) | 0 (0.0%) |
| $12,500 to $14,999 | 30 (3.0%) | 0 (0.0%) |
| $15,000 to $17,499 | 19 (1.9%) | 0 (0.0%) |
| $17,500 to $19,999 | 38 (3.9%) | 58 (4.7%) |
| $20,000 to $22,499 | 8 (0.8%) | 38 (3.1%) |
| $22,500 to $24,999 | 0 (0.0%) | 46 (3.7%) |
| $25,000 to $29,999 | 12 (1.2%) | 127 (10.3%) |
| $30,000 to $34,999 | 55 (5.6%) | 103 (8.4%) |
| $35,000 to $39,999 | 63 (6.4%) | 24 (2.0%) |
| $40,000 to $44,999 | 21 (2.1%) | 134 (10.9%) |
| $45,000 to $49,999 | 99 (10.1%) | 53 (4.3%) |
| $50,000 to $54,999 | 72 (7.3%) | 0 (0.0%) |
| $55,000 to $64,999 | 104 (10.6%) | 83 (6.8%) |
| $65,000 to $74,999 | 113 (11.5%) | 0 (0.0%) |
| $75,000 to $99,999 | 54 (5.5%) | 104 (8.5%) |
| $100,000+ | 208 (21.2%) | 0 (0.0%) |
| Total | 983 (100.0%) | 1,227 (100.0%) |
Earnings by Sex by Educational Attainment in Randleman
Average earnings in Randleman are $54,957 for men and $32,948 for women, a difference of 40.1%. Men with an educational attainment of college or associate's degree enjoy the highest average annual earnings of $60,086, while those with less than high school education earn the least with $21,250. Women with an educational attainment of bachelor's degree earn the most with the average annual earnings of $48,125, while those with high school diploma education have the smallest earnings of $28,429.
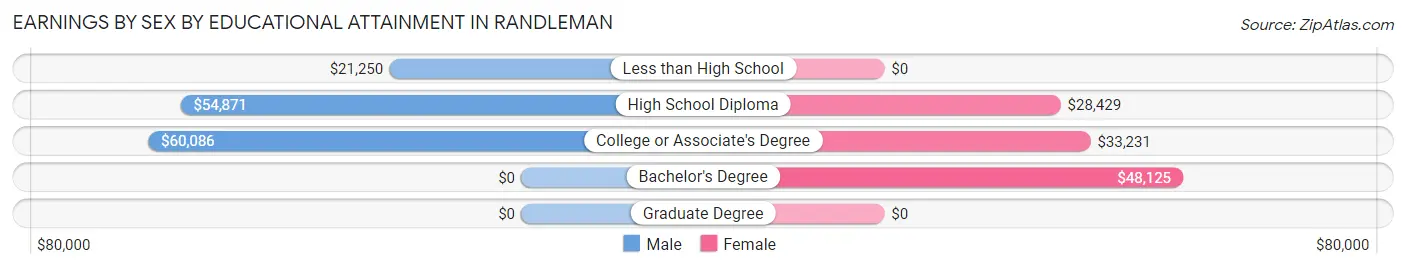
| Educational Attainment | Male Income | Female Income |
| Less than High School | $21,250 | $0 |
| High School Diploma | $54,871 | $28,429 |
| College or Associate's Degree | $60,086 | $33,231 |
| Bachelor's Degree | - | - |
| Graduate Degree | - | - |
| Total | $54,957 | $32,948 |
Family Income in Randleman
Family Income Brackets in Randleman
According to the Randleman family income data, there are 249 families falling into the $100,000 to $149,999 income range, which is the most common income bracket and makes up 25.1% of all families.
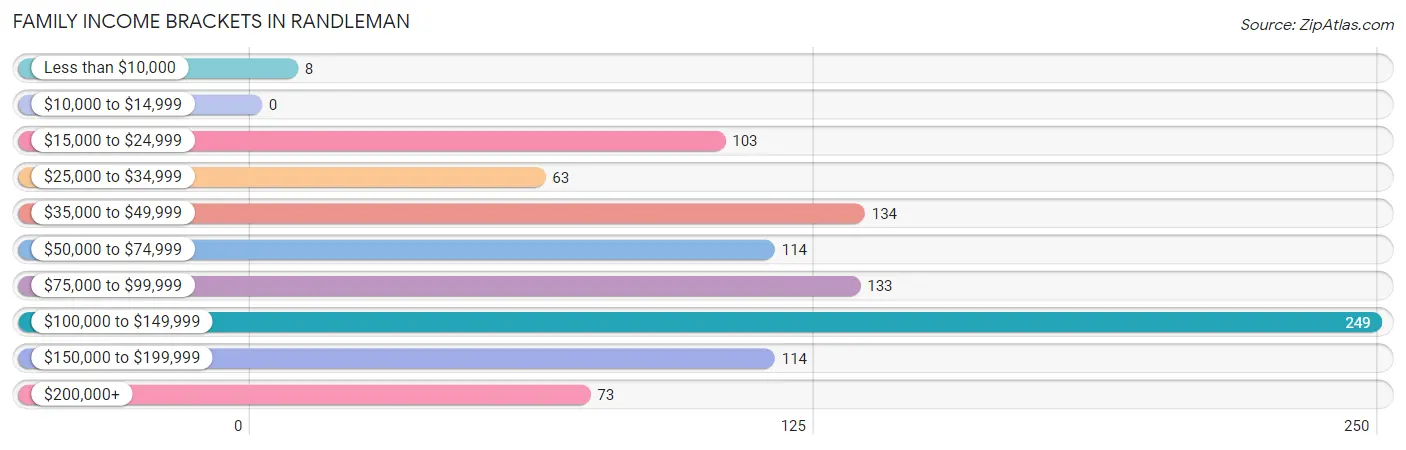
| Income Bracket | # Families | % Families |
| Less than $10,000 | 8 | 0.8% |
| $10,000 to $14,999 | 0 | 0.0% |
| $15,000 to $24,999 | 103 | 10.4% |
| $25,000 to $34,999 | 63 | 6.4% |
| $35,000 to $49,999 | 134 | 13.5% |
| $50,000 to $74,999 | 114 | 11.5% |
| $75,000 to $99,999 | 133 | 13.4% |
| $100,000 to $149,999 | 249 | 25.1% |
| $150,000 to $199,999 | 114 | 11.5% |
| $200,000+ | 73 | 7.4% |
Family Income by Famaliy Size in Randleman
2-person families (480 | 48.4%) account for the highest median family income in Randleman with $103,750 per family, while 2-person families (480 | 48.4%) have the highest median income of $51,875 per family member.
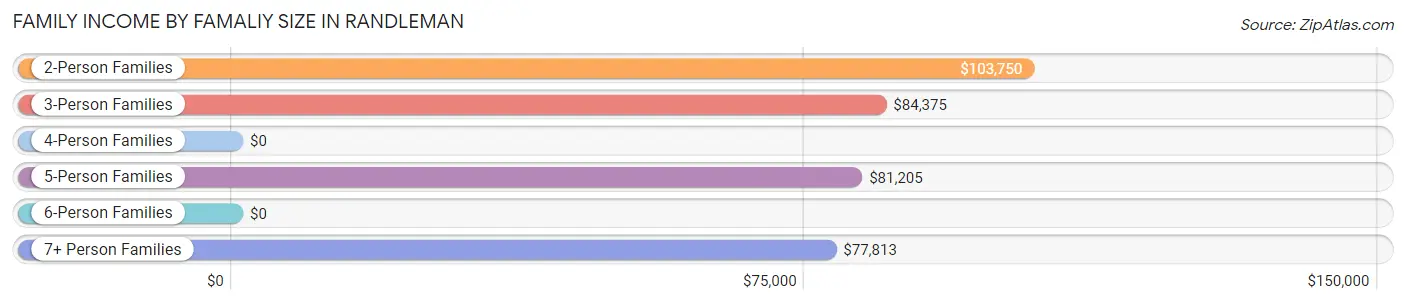
| Income Bracket | # Families | Median Income |
| 2-Person Families | 480 (48.4%) | $103,750 |
| 3-Person Families | 176 (17.8%) | $84,375 |
| 4-Person Families | 201 (20.3%) | $0 |
| 5-Person Families | 58 (5.9%) | $81,205 |
| 6-Person Families | 34 (3.4%) | $0 |
| 7+ Person Families | 42 (4.2%) | $77,813 |
| Total | 991 (100.0%) | $81,705 |
Family Income by Number of Earners in Randleman
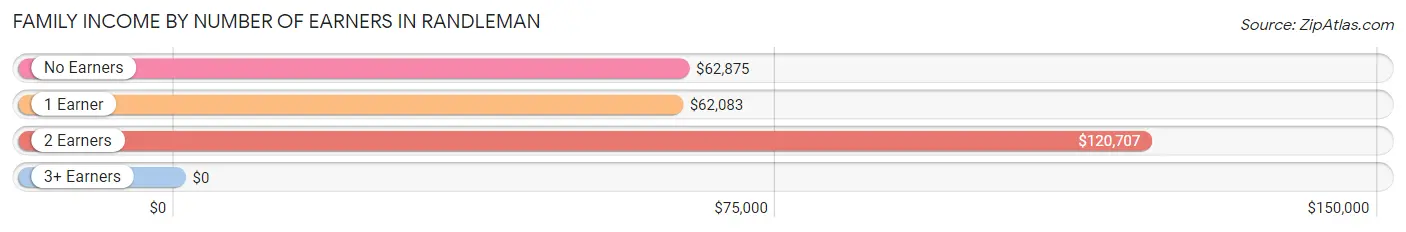
| Number of Earners | # Families | Median Income |
| No Earners | 104 (10.5%) | $62,875 |
| 1 Earner | 365 (36.8%) | $62,083 |
| 2 Earners | 457 (46.1%) | $120,707 |
| 3+ Earners | 65 (6.6%) | $0 |
| Total | 991 (100.0%) | $81,705 |
Household Income in Randleman
Household Income Brackets in Randleman
With 267 households falling in the category, the $50,000 to $74,999 income range is the most frequent in Randleman, accounting for 17.5% of all households. In contrast, only 59 households (3.9%) fall into the $10,000 to $14,999 income bracket, making it the least populous group.
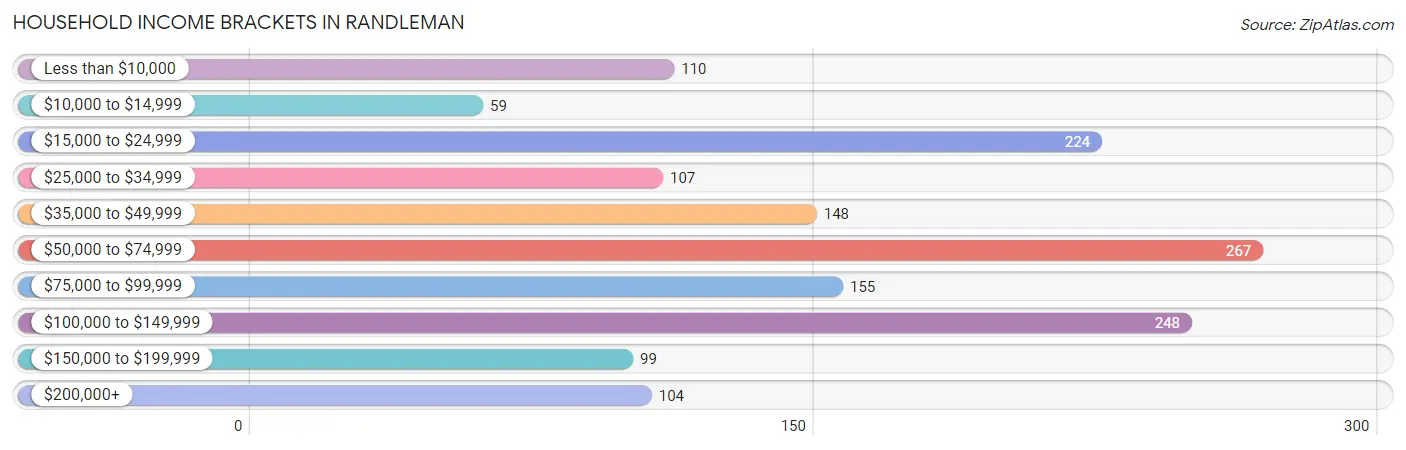
| Income Bracket | # Households | % Households |
| Less than $10,000 | 110 | 7.2% |
| $10,000 to $14,999 | 59 | 3.9% |
| $15,000 to $24,999 | 224 | 14.7% |
| $25,000 to $34,999 | 107 | 7.0% |
| $35,000 to $49,999 | 148 | 9.7% |
| $50,000 to $74,999 | 267 | 17.5% |
| $75,000 to $99,999 | 155 | 10.2% |
| $100,000 to $149,999 | 248 | 16.3% |
| $150,000 to $199,999 | 99 | 6.5% |
| $200,000+ | 104 | 6.8% |
Household Income by Householder Age in Randleman
The median household income in Randleman is $63,040, with the highest median household income of $72,375 found in the 25 to 44 years age bracket for the primary householder. A total of 494 households (32.4%) fall into this category. Meanwhile, the 15 to 24 years age bracket for the primary householder has the lowest median household income of $0, with 11 households (0.7%) in this group.
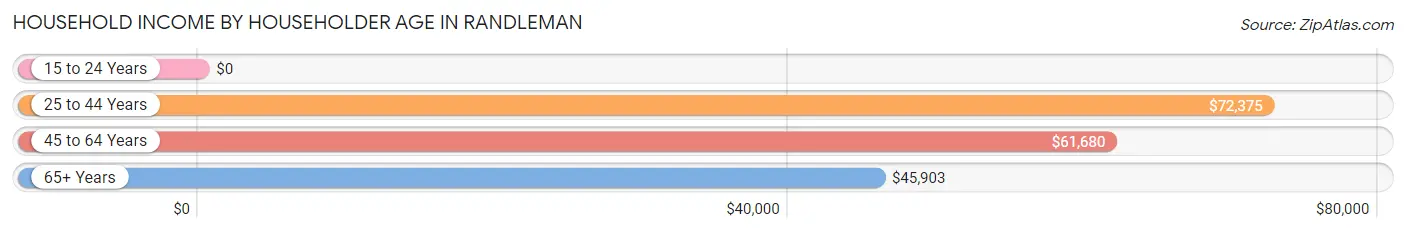
| Income Bracket | # Households | Median Income |
| 15 to 24 Years | 11 (0.7%) | $0 |
| 25 to 44 Years | 494 (32.4%) | $72,375 |
| 45 to 64 Years | 647 (42.5%) | $61,680 |
| 65+ Years | 371 (24.4%) | $45,903 |
| Total | 1,523 (100.0%) | $63,040 |
Poverty in Randleman
Income Below Poverty by Sex and Age in Randleman
With 31.2% poverty level for males and 25.3% for females among the residents of Randleman, under 5 year old males and 18 to 24 year old females are the most vulnerable to poverty, with 296 males (64.1%) and 291 females (85.3%) in their respective age groups living below the poverty level.
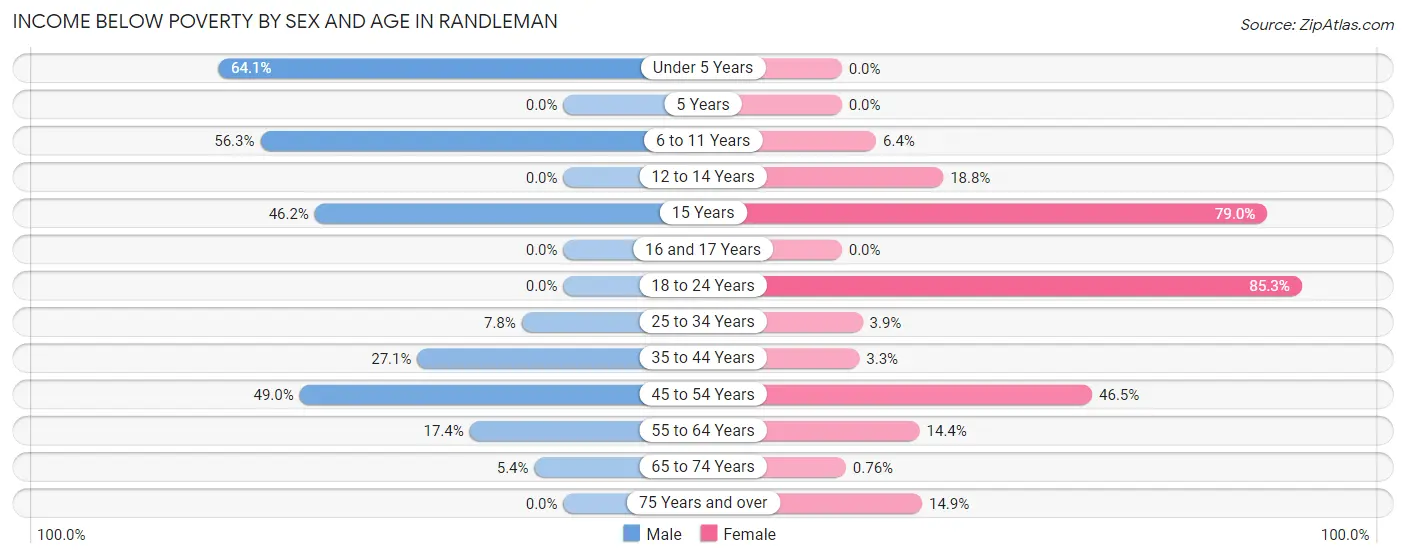
| Age Bracket | Male | Female |
| Under 5 Years | 296 (64.1%) | 0 (0.0%) |
| 5 Years | 0 (0.0%) | 0 (0.0%) |
| 6 to 11 Years | 99 (56.2%) | 10 (6.4%) |
| 12 to 14 Years | 0 (0.0%) | 16 (18.8%) |
| 15 Years | 12 (46.2%) | 30 (78.9%) |
| 16 and 17 Years | 0 (0.0%) | 0 (0.0%) |
| 18 to 24 Years | 0 (0.0%) | 291 (85.3%) |
| 25 to 34 Years | 22 (7.7%) | 10 (3.9%) |
| 35 to 44 Years | 61 (27.1%) | 6 (3.3%) |
| 45 to 54 Years | 166 (49.0%) | 151 (46.5%) |
| 55 to 64 Years | 51 (17.4%) | 41 (14.4%) |
| 65 to 74 Years | 7 (5.4%) | 2 (0.8%) |
| 75 Years and over | 0 (0.0%) | 14 (14.9%) |
| Total | 714 (31.2%) | 571 (25.3%) |
Income Above Poverty by Sex and Age in Randleman
According to the poverty statistics in Randleman, males aged 5 years and females aged under 5 years are the age groups that are most secure financially, with 100.0% of males and 100.0% of females in these age groups living above the poverty line.
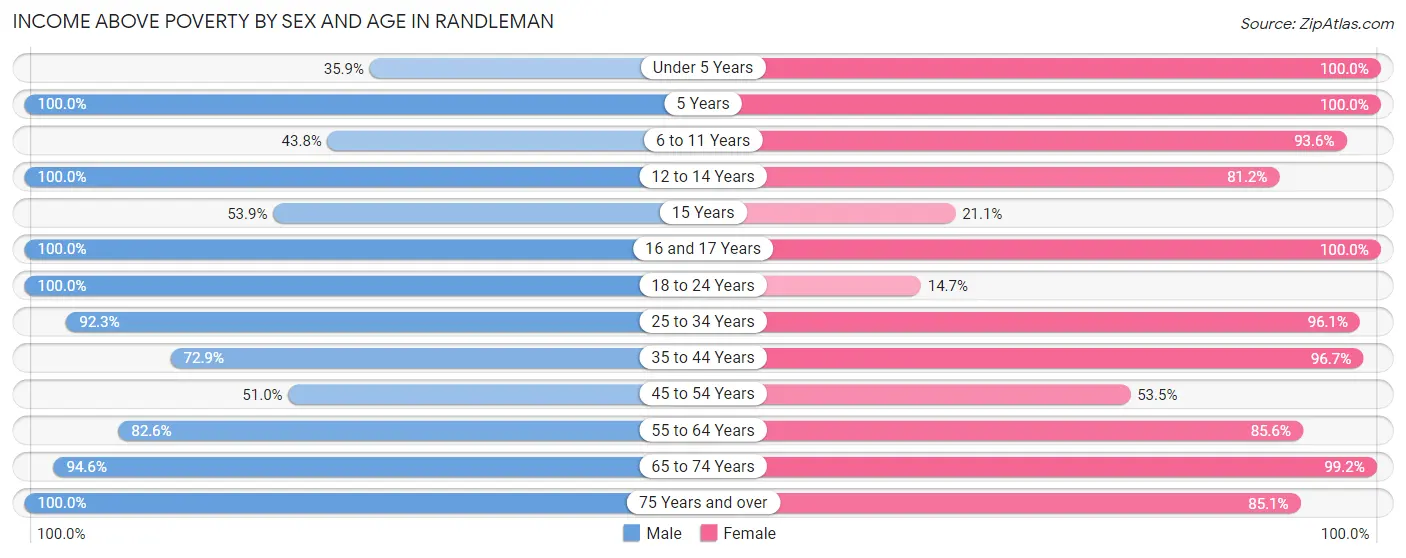
| Age Bracket | Male | Female |
| Under 5 Years | 166 (35.9%) | 134 (100.0%) |
| 5 Years | 31 (100.0%) | 12 (100.0%) |
| 6 to 11 Years | 77 (43.8%) | 147 (93.6%) |
| 12 to 14 Years | 43 (100.0%) | 69 (81.2%) |
| 15 Years | 14 (53.8%) | 8 (21.0%) |
| 16 and 17 Years | 99 (100.0%) | 82 (100.0%) |
| 18 to 24 Years | 81 (100.0%) | 50 (14.7%) |
| 25 to 34 Years | 262 (92.2%) | 249 (96.1%) |
| 35 to 44 Years | 164 (72.9%) | 178 (96.7%) |
| 45 to 54 Years | 173 (51.0%) | 174 (53.5%) |
| 55 to 64 Years | 242 (82.6%) | 243 (85.6%) |
| 65 to 74 Years | 123 (94.6%) | 260 (99.2%) |
| 75 Years and over | 101 (100.0%) | 80 (85.1%) |
| Total | 1,576 (68.8%) | 1,686 (74.7%) |
Income Below Poverty Among Married-Couple Families in Randleman
The poverty statistics for married-couple families in Randleman show that 12.3% or 101 of the total 822 families live below the poverty line. Families with 1 or 2 children have the highest poverty rate of 33.9%, comprising of 101 families. On the other hand, families with no children have the lowest poverty rate of 0.0%, which includes 0 families.
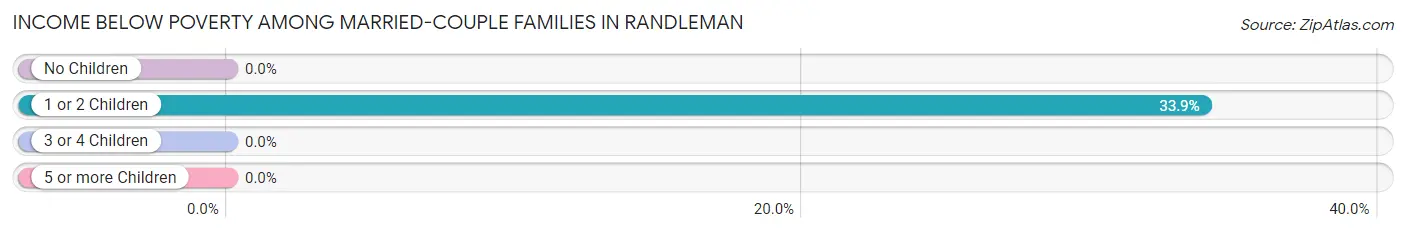
| Children | Above Poverty | Below Poverty |
| No Children | 423 (100.0%) | 0 (0.0%) |
| 1 or 2 Children | 197 (66.1%) | 101 (33.9%) |
| 3 or 4 Children | 59 (100.0%) | 0 (0.0%) |
| 5 or more Children | 42 (100.0%) | 0 (0.0%) |
| Total | 721 (87.7%) | 101 (12.3%) |
Income Below Poverty Among Single-Parent Households in Randleman
| Children | Single Father | Single Mother |
| No Children | 0 (0.0%) | 0 (0.0%) |
| 1 or 2 Children | 0 (0.0%) | 10 (11.8%) |
| 3 or 4 Children | 0 (0.0%) | 0 (0.0%) |
| 5 or more Children | 0 (0.0%) | 0 (0.0%) |
| Total | 0 (0.0%) | 10 (9.2%) |
Income Below Poverty Among Married-Couple vs Single-Parent Households in Randleman
The poverty data for Randleman shows that 101 of the married-couple family households (12.3%) and 10 of the single-parent households (5.9%) are living below the poverty level. Within the married-couple family households, those with 1 or 2 children have the highest poverty rate, with 101 households (33.9%) falling below the poverty line. Among the single-parent households, those with 1 or 2 children have the highest poverty rate, with 10 household (8.3%) living below poverty.
| Children | Married-Couple Families | Single-Parent Households |
| No Children | 0 (0.0%) | 0 (0.0%) |
| 1 or 2 Children | 101 (33.9%) | 10 (8.3%) |
| 3 or 4 Children | 0 (0.0%) | 0 (0.0%) |
| 5 or more Children | 0 (0.0%) | 0 (0.0%) |
| Total | 101 (12.3%) | 10 (5.9%) |
Race in Randleman
The most populous races in Randleman are White / Caucasian (3,852 | 84.2%), Hispanic or Latino (423 | 9.2%), and Two or more Races (394 | 8.6%).
| Race | # Population | % Population |
| Asian | 0 | 0.0% |
| Black / African American | 167 | 3.6% |
| Hawaiian / Pacific | 0 | 0.0% |
| Hispanic or Latino | 423 | 9.2% |
| Native / Alaskan | 80 | 1.8% |
| White / Caucasian | 3,852 | 84.2% |
| Two or more Races | 394 | 8.6% |
| Some other Race | 80 | 1.8% |
| Total | 4,573 | 100.0% |
Ancestry in Randleman
The most populous ancestries reported in Randleman are German (927 | 20.3%), Scotch-Irish (803 | 17.6%), English (466 | 10.2%), American (445 | 9.7%), and Mexican (401 | 8.8%), together accounting for 66.5% of all Randleman residents.
| Ancestry | # Population | % Population |
| African | 50 | 1.1% |
| American | 445 | 9.7% |
| Apache | 69 | 1.5% |
| Arab | 60 | 1.3% |
| Cherokee | 67 | 1.5% |
| Chippewa | 8 | 0.2% |
| Dutch | 8 | 0.2% |
| English | 466 | 10.2% |
| European | 4 | 0.1% |
| French | 204 | 4.5% |
| French Canadian | 25 | 0.5% |
| German | 927 | 20.3% |
| Greek | 28 | 0.6% |
| Iraqi | 60 | 1.3% |
| Irish | 189 | 4.1% |
| Italian | 93 | 2.0% |
| Lumbee | 8 | 0.2% |
| Mexican | 401 | 8.8% |
| Mexican American Indian | 64 | 1.4% |
| Nigerian | 16 | 0.4% |
| Norwegian | 26 | 0.6% |
| Polish | 51 | 1.1% |
| Puerto Rican | 22 | 0.5% |
| Scotch-Irish | 803 | 17.6% |
| Scottish | 241 | 5.3% |
| Subsaharan African | 66 | 1.4% |
| Thai | 16 | 0.4% | View All 27 Rows |
Immigrants in Randleman
The most numerous immigrant groups reported in Randleman came from Central America (132 | 2.9%), Latin America (132 | 2.9%), Mexico (132 | 2.9%), Asia (22 | 0.5%), and Iraq (22 | 0.5%), together accounting for 9.6% of all Randleman residents.
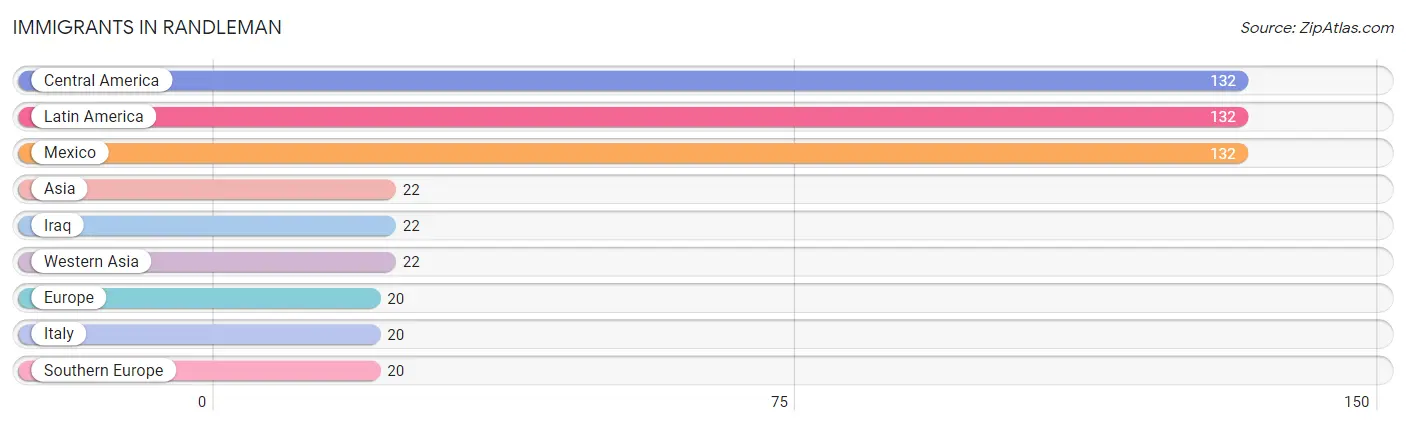
| Immigration Origin | # Population | % Population |
| Asia | 22 | 0.5% |
| Central America | 132 | 2.9% |
| Europe | 20 | 0.4% |
| Iraq | 22 | 0.5% |
| Italy | 20 | 0.4% |
| Latin America | 132 | 2.9% |
| Mexico | 132 | 2.9% |
| Southern Europe | 20 | 0.4% |
| Western Asia | 22 | 0.5% | View All 9 Rows |
Sex and Age in Randleman
Sex and Age in Randleman
The most populous age groups in Randleman are Under 5 Years (476 | 20.7%) for men and 20 to 24 Years (235 | 10.4%) for women.
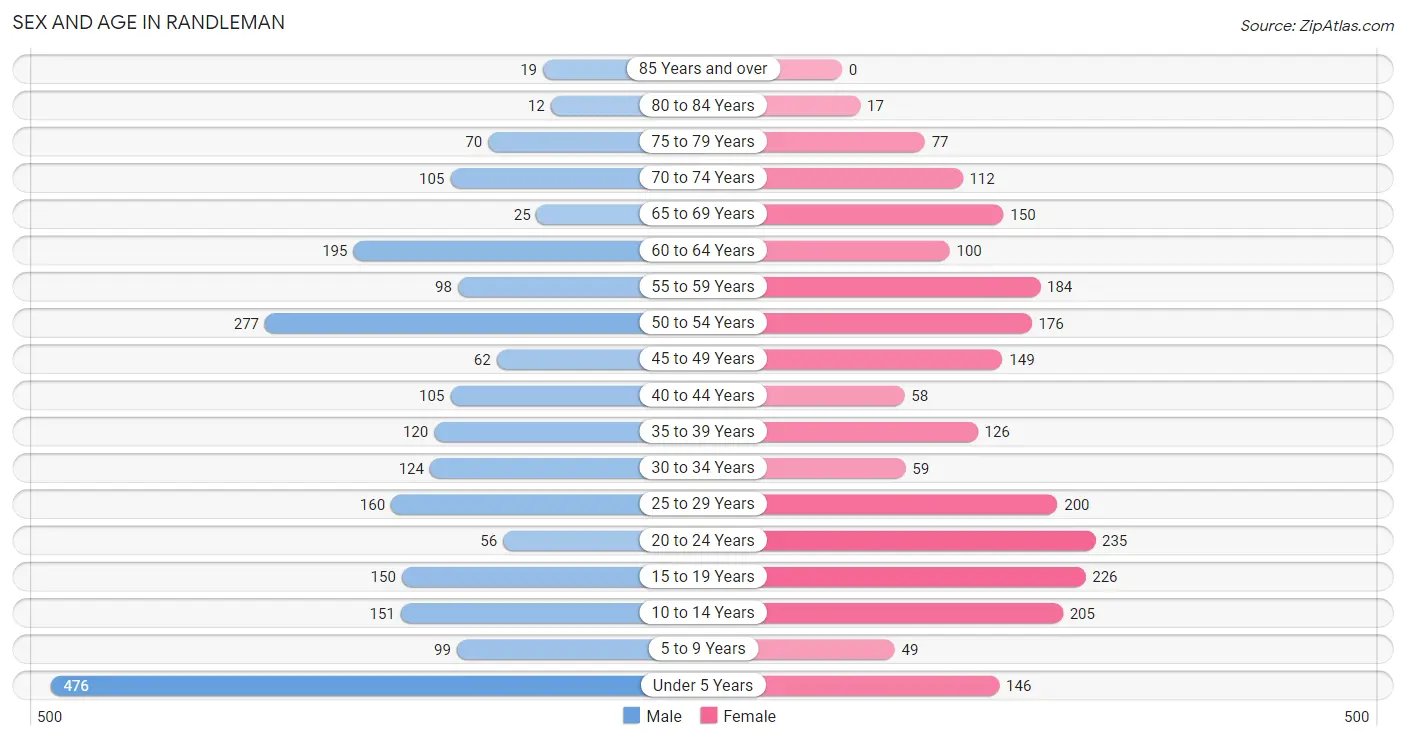
| Age Bracket | Male | Female |
| Under 5 Years | 476 (20.7%) | 146 (6.4%) |
| 5 to 9 Years | 99 (4.3%) | 49 (2.2%) |
| 10 to 14 Years | 151 (6.6%) | 205 (9.0%) |
| 15 to 19 Years | 150 (6.5%) | 226 (10.0%) |
| 20 to 24 Years | 56 (2.4%) | 235 (10.4%) |
| 25 to 29 Years | 160 (6.9%) | 200 (8.8%) |
| 30 to 34 Years | 124 (5.4%) | 59 (2.6%) |
| 35 to 39 Years | 120 (5.2%) | 126 (5.6%) |
| 40 to 44 Years | 105 (4.6%) | 58 (2.6%) |
| 45 to 49 Years | 62 (2.7%) | 149 (6.6%) |
| 50 to 54 Years | 277 (12.0%) | 176 (7.8%) |
| 55 to 59 Years | 98 (4.3%) | 184 (8.1%) |
| 60 to 64 Years | 195 (8.5%) | 100 (4.4%) |
| 65 to 69 Years | 25 (1.1%) | 150 (6.6%) |
| 70 to 74 Years | 105 (4.6%) | 112 (4.9%) |
| 75 to 79 Years | 70 (3.0%) | 77 (3.4%) |
| 80 to 84 Years | 12 (0.5%) | 17 (0.7%) |
| 85 Years and over | 19 (0.8%) | 0 (0.0%) |
| Total | 2,304 (100.0%) | 2,269 (100.0%) |
Families and Households in Randleman
Median Family Size in Randleman
The median family size in Randleman is 3.91 persons per family, with single female/mother families (109 | 11.0%) accounting for the largest median family size of 8.09 persons per family. On the other hand, single male/father families (60 | 6.0%) represent the smallest median family size with 2.52 persons per family.
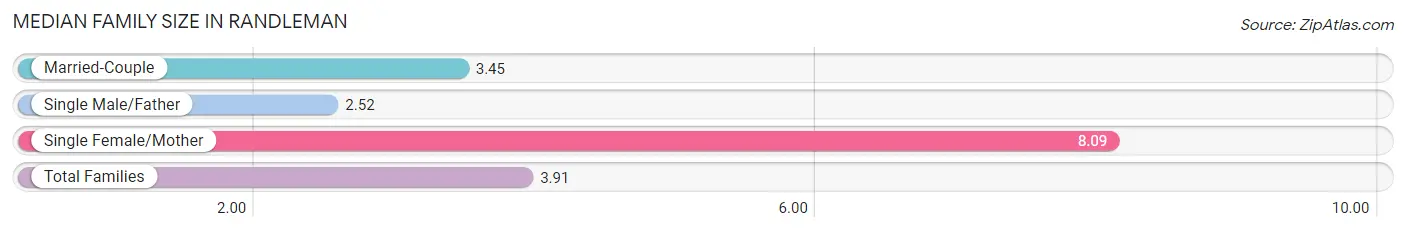
| Family Type | # Families | Family Size |
| Married-Couple | 822 (83.0%) | 3.45 |
| Single Male/Father | 60 (6.0%) | 2.52 |
| Single Female/Mother | 109 (11.0%) | 8.09 |
| Total Families | 991 (100.0%) | 3.91 |
Median Household Size in Randleman
The median household size in Randleman is 3.00 persons per household, with single female/mother households (109 | 7.2%) accounting for the largest median household size of 8.31 persons per household. non-family households (532 | 34.9%) represent the smallest median household size with 1.17 persons per household.
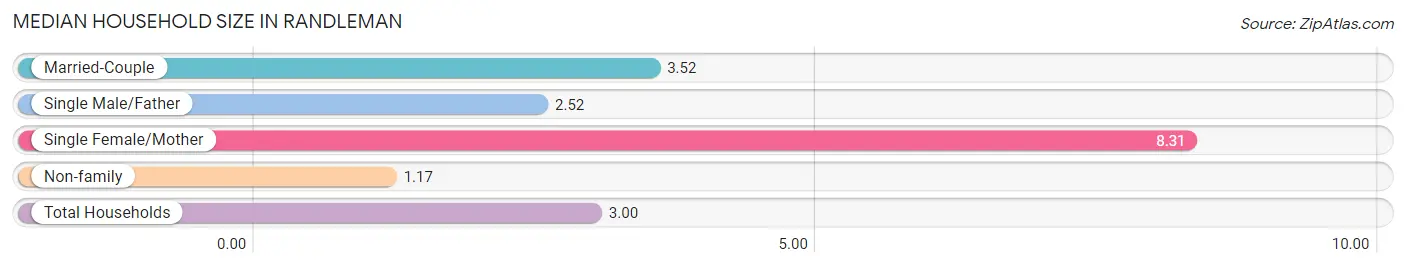
| Household Type | # Households | Household Size |
| Married-Couple | 822 (54.0%) | 3.52 |
| Single Male/Father | 60 (3.9%) | 2.52 |
| Single Female/Mother | 109 (7.2%) | 8.31 |
| Non-family | 532 (34.9%) | 1.17 |
| Total Households | 1,523 (100.0%) | 3.00 |
Household Size by Marriage Status in Randleman
Out of a total of 1,523 households in Randleman, 991 (65.1%) are family households, while 532 (34.9%) are nonfamily households. The most numerous type of family households are 2-person households, comprising 416, and the most common type of nonfamily households are 1-person households, comprising 468.
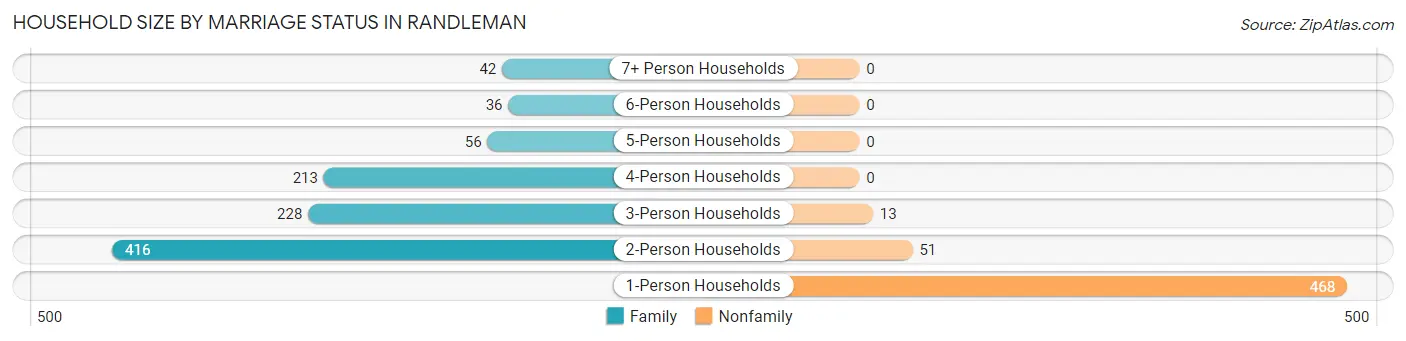
| Household Size | Family Households | Nonfamily Households |
| 1-Person Households | - | 468 (30.7%) |
| 2-Person Households | 416 (27.3%) | 51 (3.4%) |
| 3-Person Households | 228 (15.0%) | 13 (0.9%) |
| 4-Person Households | 213 (14.0%) | 0 (0.0%) |
| 5-Person Households | 56 (3.7%) | 0 (0.0%) |
| 6-Person Households | 36 (2.4%) | 0 (0.0%) |
| 7+ Person Households | 42 (2.8%) | 0 (0.0%) |
| Total | 991 (65.1%) | 532 (34.9%) |
Female Fertility in Randleman
Fertility by Age in Randleman
Average fertility rate in Randleman is 33.0 births per 1,000 women. Women in the age bracket of 20 to 34 years have the highest fertility rate with 73.0 births per 1,000 women. Women in the age bracket of 20 to 34 years acount for 100.0% of all women with births.
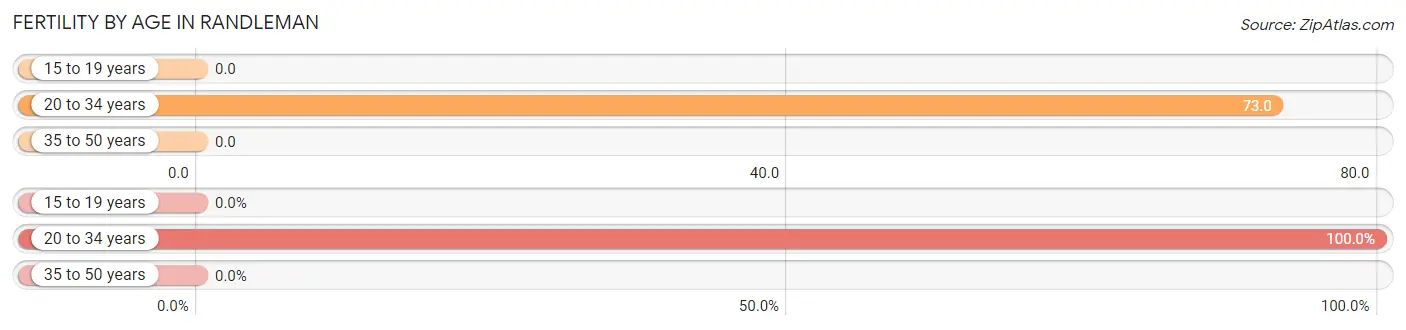
| Age Bracket | Women with Births | Births / 1,000 Women |
| 15 to 19 years | 0 (0.0%) | 0.0 |
| 20 to 34 years | 36 (100.0%) | 73.0 |
| 35 to 50 years | 0 (0.0%) | 0.0 |
| Total | 36 (100.0%) | 33.0 |
Fertility by Age by Marriage Status in Randleman
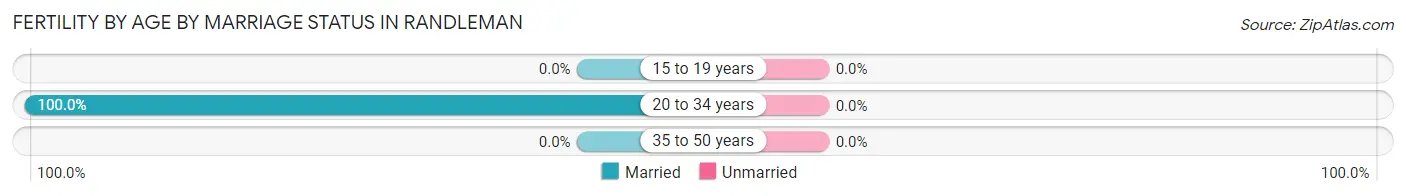
| Age Bracket | Married | Unmarried |
| 15 to 19 years | 0 (0.0%) | 0 (0.0%) |
| 20 to 34 years | 36 (100.0%) | 0 (0.0%) |
| 35 to 50 years | 0 (0.0%) | 0 (0.0%) |
| Total | 36 (100.0%) | 0 (0.0%) |
Fertility by Education in Randleman
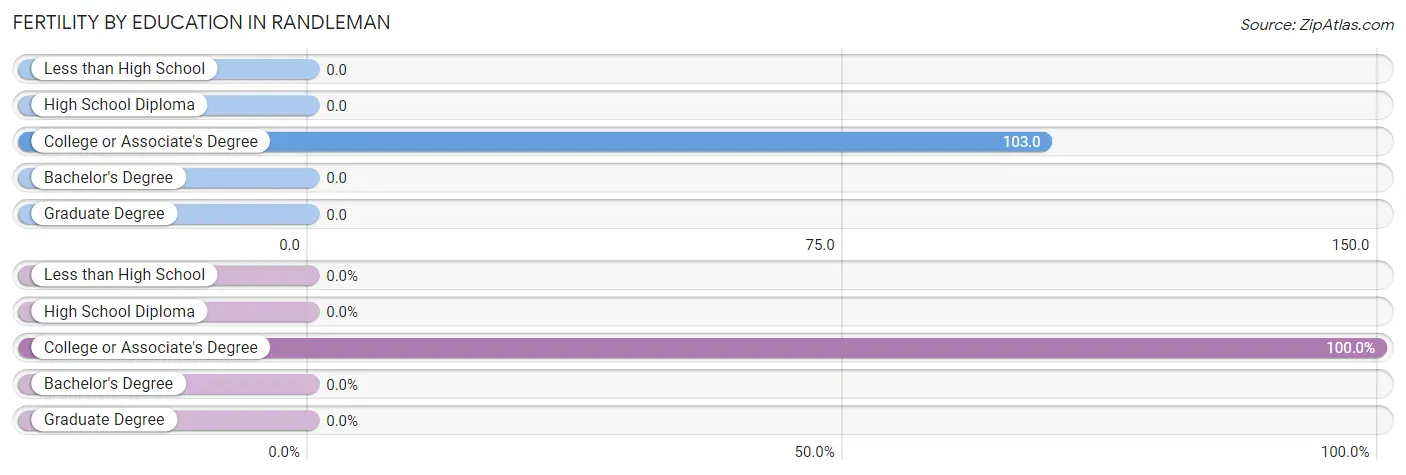
| Educational Attainment | Women with Births | Births / 1,000 Women |
| Less than High School | 0 (0.0%) | 0.0 |
| High School Diploma | 0 (0.0%) | 0.0 |
| College or Associate's Degree | 36 (100.0%) | 103.0 |
| Bachelor's Degree | 0 (0.0%) | 0.0 |
| Graduate Degree | 0 (0.0%) | 0.0 |
| Total | 36 (100.0%) | 33.0 |
Fertility by Education by Marriage Status in Randleman
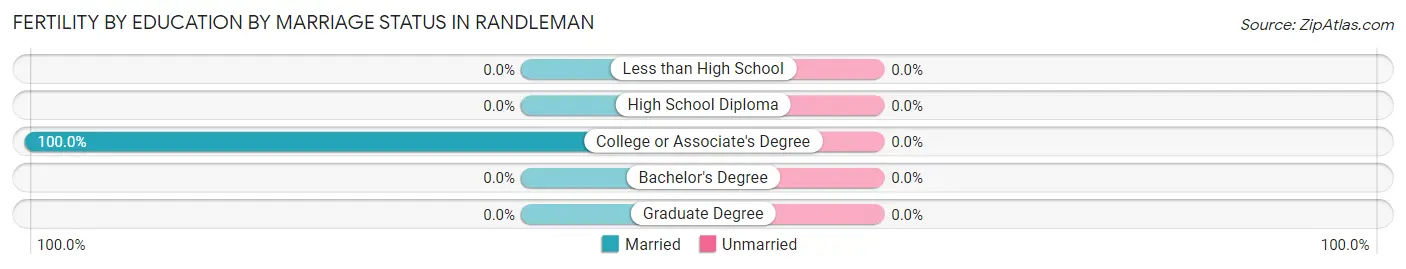
| Educational Attainment | Married | Unmarried |
| Less than High School | 0 (0.0%) | 0 (0.0%) |
| High School Diploma | 0 (0.0%) | 0 (0.0%) |
| College or Associate's Degree | 36 (100.0%) | 0 (0.0%) |
| Bachelor's Degree | 0 (0.0%) | 0 (0.0%) |
| Graduate Degree | 0 (0.0%) | 0 (0.0%) |
| Total | 36 (100.0%) | 0 (0.0%) |
Employment Characteristics in Randleman
Employment by Class of Employer in Randleman
Among the 1,932 employed individuals in Randleman, private company employees (1,312 | 67.9%), self-employed (not incorporated) (177 | 9.2%), and not-for-profit organizations (135 | 7.0%) make up the most common classes of employment.
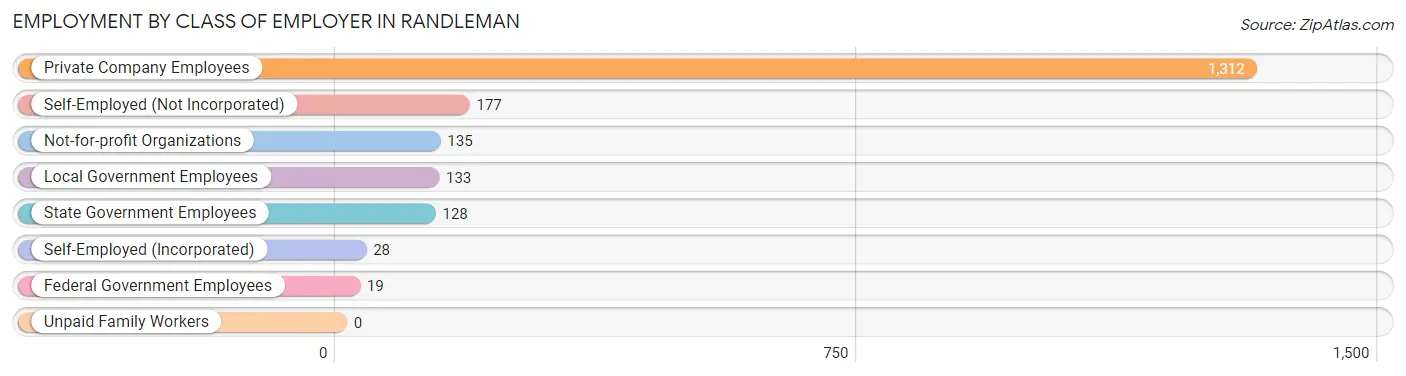
| Employer Class | # Employees | % Employees |
| Private Company Employees | 1,312 | 67.9% |
| Self-Employed (Incorporated) | 28 | 1.5% |
| Self-Employed (Not Incorporated) | 177 | 9.2% |
| Not-for-profit Organizations | 135 | 7.0% |
| Local Government Employees | 133 | 6.9% |
| State Government Employees | 128 | 6.6% |
| Federal Government Employees | 19 | 1.0% |
| Unpaid Family Workers | 0 | 0.0% |
| Total | 1,932 | 100.0% |
Employment Status by Age in Randleman
According to the labor force statistics for Randleman, out of the total population over 16 years of age (3,383), 58.5% or 1,979 individuals are in the labor force, with 2.0% or 40 of them unemployed. The age group with the highest labor force participation rate is 35 to 44 years, with 88.3% or 361 individuals in the labor force. Within the labor force, the 30 to 34 years age range has the highest percentage of unemployed individuals, with 9.4% or 13 of them being unemployed.
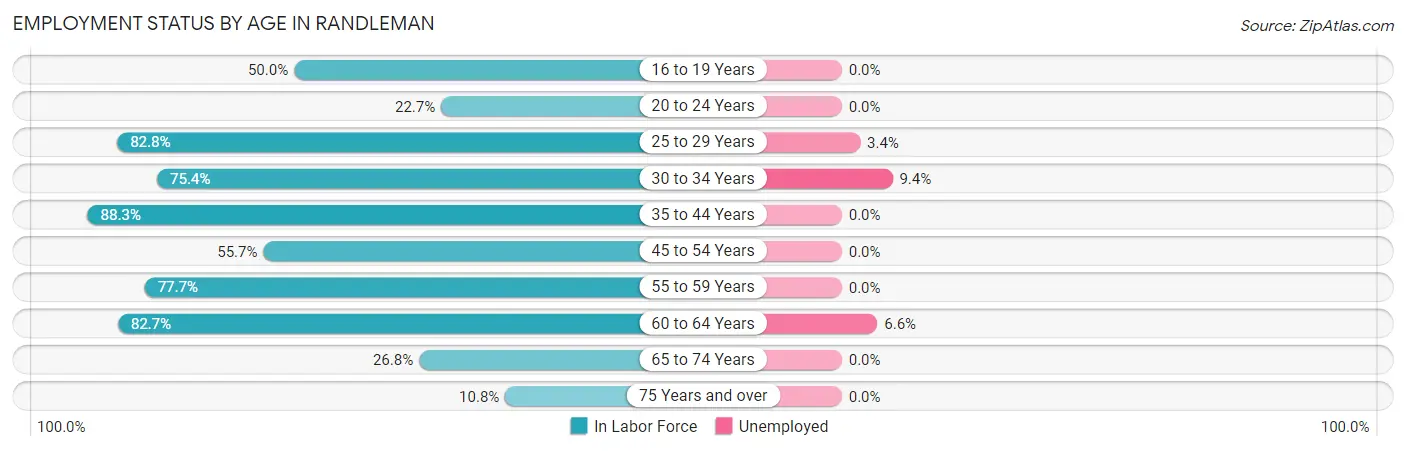
| Age Bracket | In Labor Force | Unemployed |
| 16 to 19 Years | 156 (50.0%) | 0 (0.0%) |
| 20 to 24 Years | 66 (22.7%) | 0 (0.0%) |
| 25 to 29 Years | 298 (82.8%) | 10 (3.4%) |
| 30 to 34 Years | 138 (75.4%) | 13 (9.4%) |
| 35 to 44 Years | 361 (88.3%) | 0 (0.0%) |
| 45 to 54 Years | 370 (55.7%) | 0 (0.0%) |
| 55 to 59 Years | 219 (77.7%) | 0 (0.0%) |
| 60 to 64 Years | 244 (82.7%) | 16 (6.6%) |
| 65 to 74 Years | 105 (26.8%) | 0 (0.0%) |
| 75 Years and over | 21 (10.8%) | 0 (0.0%) |
| Total | 1,979 (58.5%) | 40 (2.0%) |
Employment Status by Educational Attainment in Randleman
According to labor force statistics for Randleman, 74.3% of individuals (1,629) out of the total population between 25 and 64 years of age (2,193) are in the labor force, with 2.4% or 39 of them being unemployed. The group with the highest labor force participation rate are those with the educational attainment of bachelor's degree or higher, with 100.0% or 298 individuals in the labor force. Within the labor force, individuals with bachelor's degree or higher education have the highest percentage of unemployment, with 5.4% or 16 of them being unemployed.
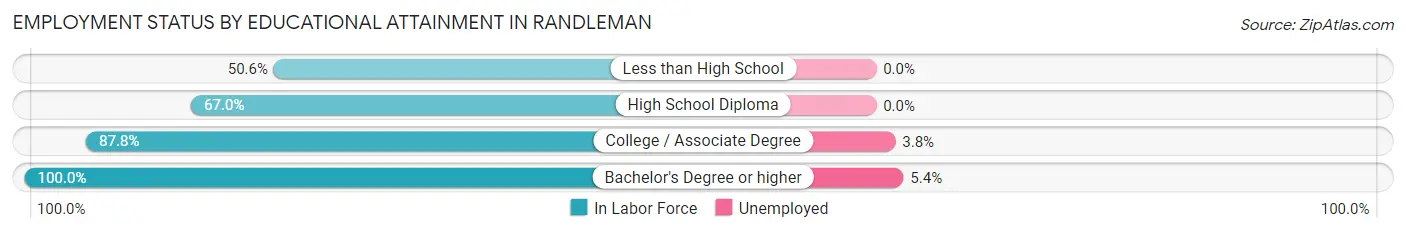
| Educational Attainment | In Labor Force | Unemployed |
| Less than High School | 248 (50.6%) | 0 (0.0%) |
| High School Diploma | 481 (67.0%) | 0 (0.0%) |
| College / Associate Degree | 603 (87.8%) | 26 (3.8%) |
| Bachelor's Degree or higher | 298 (100.0%) | 16 (5.4%) |
| Total | 1,629 (74.3%) | 53 (2.4%) |
Employment Occupations by Sex in Randleman
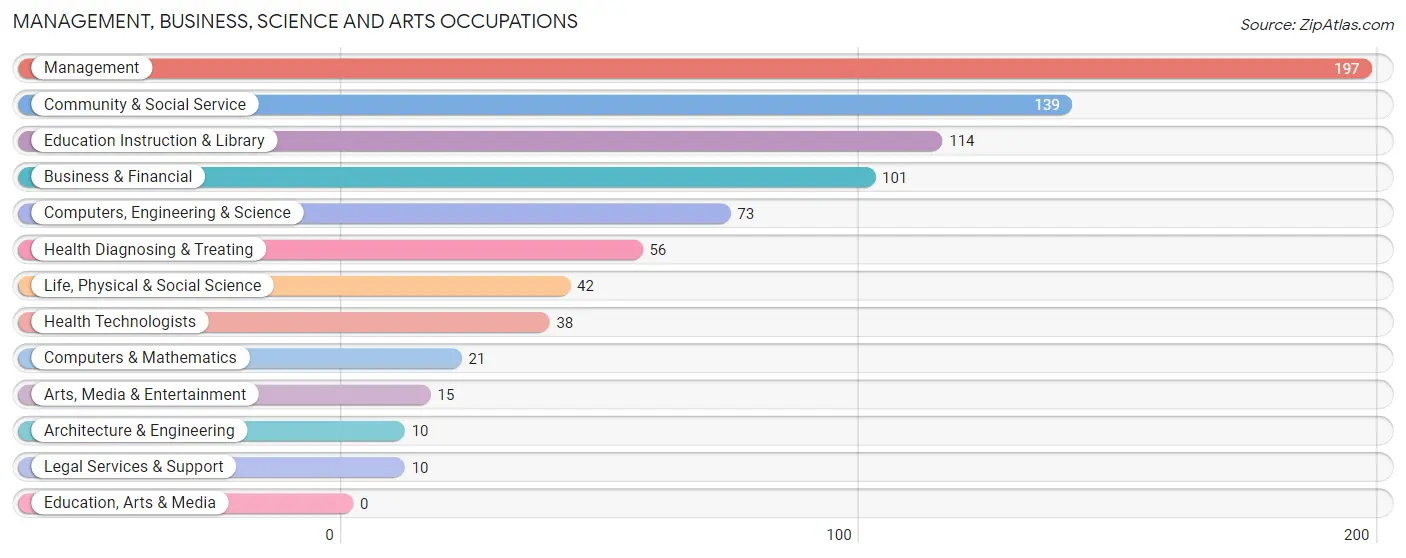
Management, Business, Science and Arts Occupations
The most common Management, Business, Science and Arts occupations in Randleman are Management (197 | 10.2%), Community & Social Service (139 | 7.2%), Education Instruction & Library (114 | 5.9%), Business & Financial (101 | 5.2%), and Computers, Engineering & Science (73 | 3.8%).
Management, Business, Science and Arts Occupations by Sex
Within the Management, Business, Science and Arts occupations in Randleman, the most male-oriented occupations are Computers, Engineering & Science (100.0%), Computers & Mathematics (100.0%), and Architecture & Engineering (100.0%), while the most female-oriented occupations are Legal Services & Support (100.0%), Education Instruction & Library (72.8%), and Community & Social Service (71.9%).
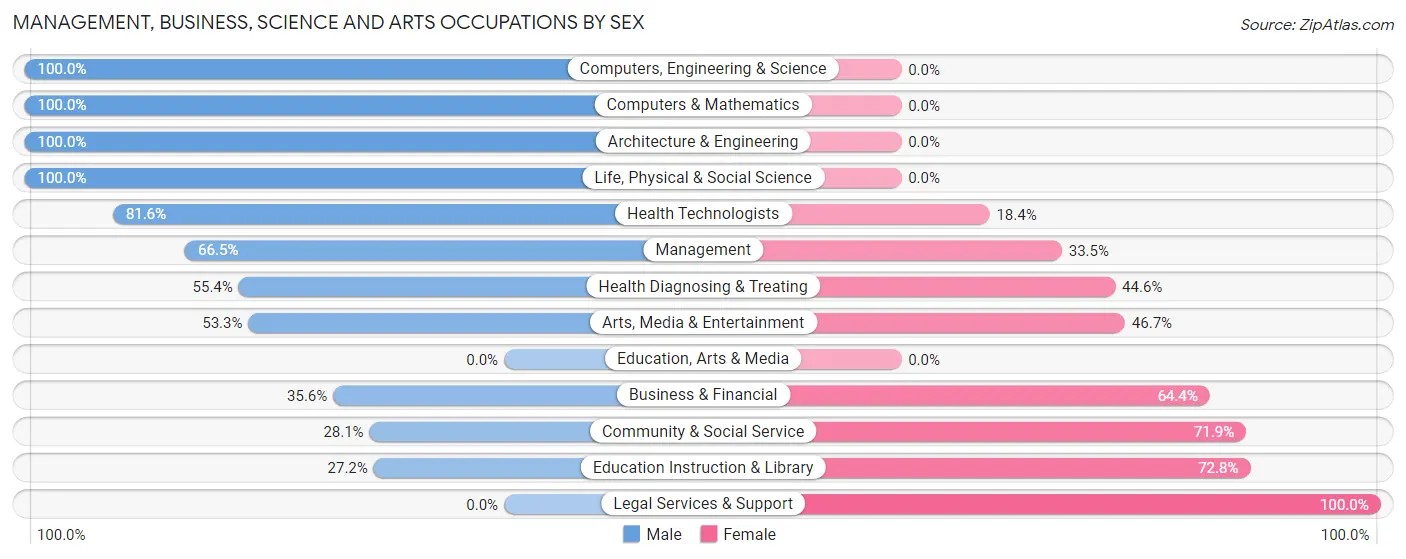
| Occupation | Male | Female |
| Management | 131 (66.5%) | 66 (33.5%) |
| Business & Financial | 36 (35.6%) | 65 (64.4%) |
| Computers, Engineering & Science | 73 (100.0%) | 0 (0.0%) |
| Computers & Mathematics | 21 (100.0%) | 0 (0.0%) |
| Architecture & Engineering | 10 (100.0%) | 0 (0.0%) |
| Life, Physical & Social Science | 42 (100.0%) | 0 (0.0%) |
| Community & Social Service | 39 (28.1%) | 100 (71.9%) |
| Education, Arts & Media | 0 (0.0%) | 0 (0.0%) |
| Legal Services & Support | 0 (0.0%) | 10 (100.0%) |
| Education Instruction & Library | 31 (27.2%) | 83 (72.8%) |
| Arts, Media & Entertainment | 8 (53.3%) | 7 (46.7%) |
| Health Diagnosing & Treating | 31 (55.4%) | 25 (44.6%) |
| Health Technologists | 31 (81.6%) | 7 (18.4%) |
| Total (Category) | 310 (54.8%) | 256 (45.2%) |
| Total (Overall) | 946 (48.8%) | 993 (51.2%) |
Services Occupations
The most common Services occupations in Randleman are Healthcare Support (111 | 5.7%), Personal Care & Service (97 | 5.0%), Food Preparation & Serving (84 | 4.3%), Cleaning & Maintenance (69 | 3.6%), and Security & Protection (23 | 1.2%).
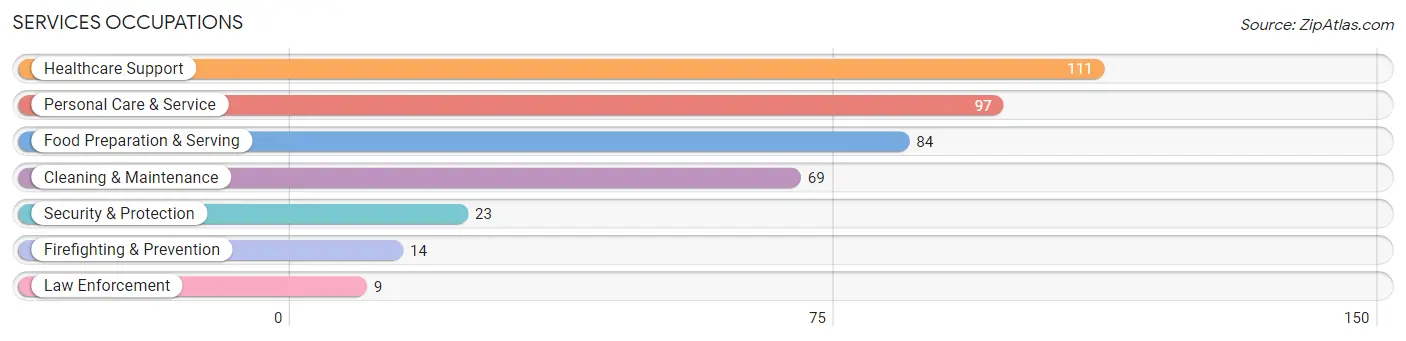
Services Occupations by Sex
Within the Services occupations in Randleman, the most male-oriented occupations are Security & Protection (100.0%), Firefighting & Prevention (100.0%), and Law Enforcement (100.0%), while the most female-oriented occupations are Food Preparation & Serving (100.0%), Personal Care & Service (100.0%), and Healthcare Support (89.2%).
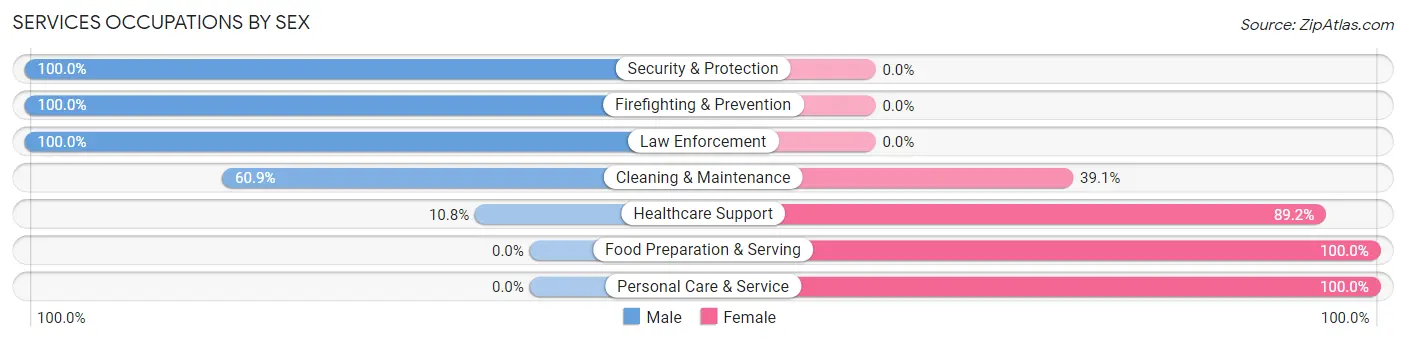
| Occupation | Male | Female |
| Healthcare Support | 12 (10.8%) | 99 (89.2%) |
| Security & Protection | 23 (100.0%) | 0 (0.0%) |
| Firefighting & Prevention | 14 (100.0%) | 0 (0.0%) |
| Law Enforcement | 9 (100.0%) | 0 (0.0%) |
| Food Preparation & Serving | 0 (0.0%) | 84 (100.0%) |
| Cleaning & Maintenance | 42 (60.9%) | 27 (39.1%) |
| Personal Care & Service | 0 (0.0%) | 97 (100.0%) |
| Total (Category) | 77 (20.1%) | 307 (79.9%) |
| Total (Overall) | 946 (48.8%) | 993 (51.2%) |
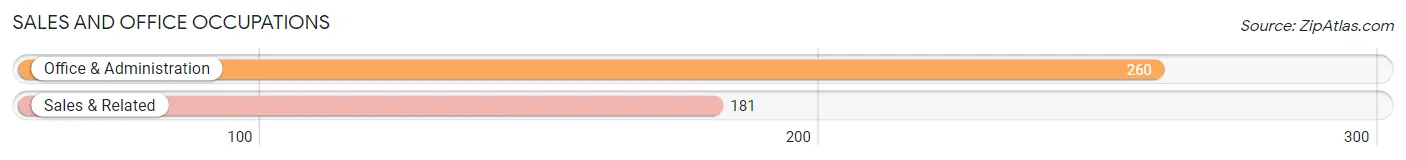
Sales and Office Occupations
The most common Sales and Office occupations in Randleman are Office & Administration (260 | 13.4%), and Sales & Related (181 | 9.3%).
Sales and Office Occupations by Sex
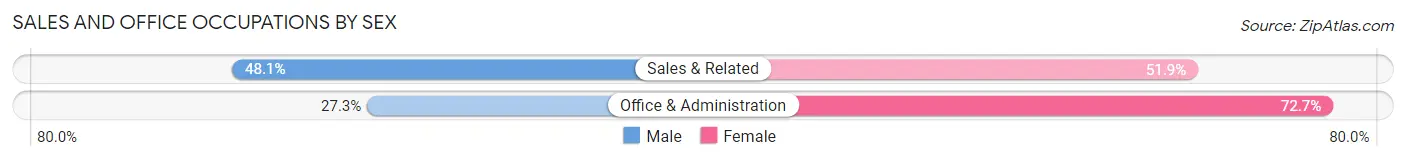
| Occupation | Male | Female |
| Sales & Related | 87 (48.1%) | 94 (51.9%) |
| Office & Administration | 71 (27.3%) | 189 (72.7%) |
| Total (Category) | 158 (35.8%) | 283 (64.2%) |
| Total (Overall) | 946 (48.8%) | 993 (51.2%) |
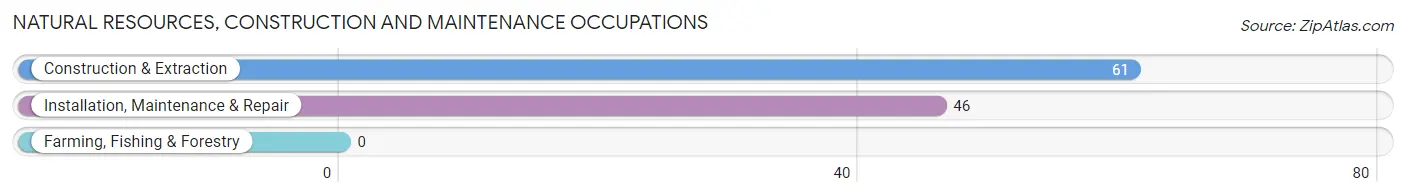
Natural Resources, Construction and Maintenance Occupations
The most common Natural Resources, Construction and Maintenance occupations in Randleman are Construction & Extraction (61 | 3.2%), and Installation, Maintenance & Repair (46 | 2.4%).
Natural Resources, Construction and Maintenance Occupations by Sex
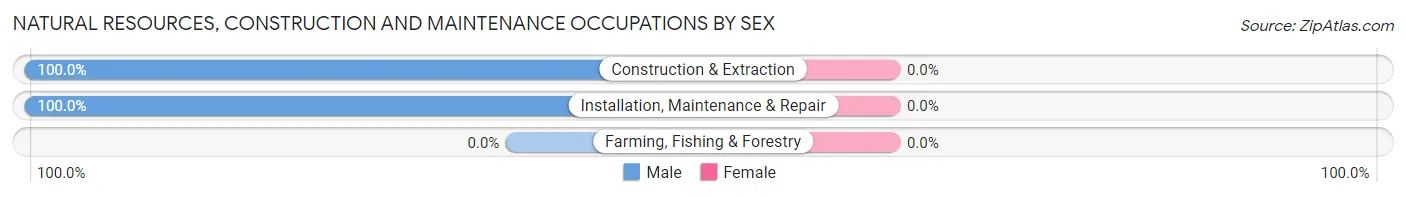
| Occupation | Male | Female |
| Farming, Fishing & Forestry | 0 (0.0%) | 0 (0.0%) |
| Construction & Extraction | 61 (100.0%) | 0 (0.0%) |
| Installation, Maintenance & Repair | 46 (100.0%) | 0 (0.0%) |
| Total (Category) | 107 (100.0%) | 0 (0.0%) |
| Total (Overall) | 946 (48.8%) | 993 (51.2%) |
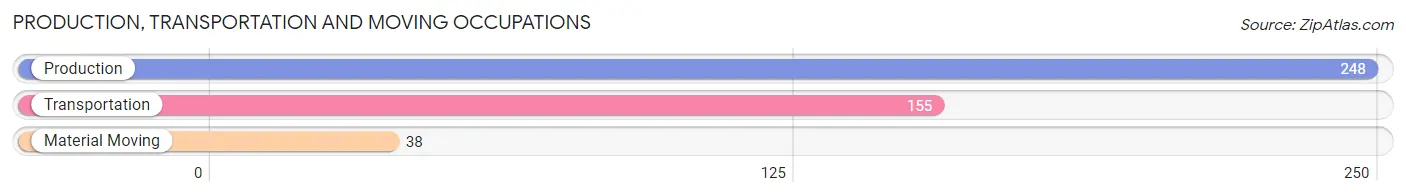
Production, Transportation and Moving Occupations
The most common Production, Transportation and Moving occupations in Randleman are Production (248 | 12.8%), Transportation (155 | 8.0%), and Material Moving (38 | 2.0%).
Production, Transportation and Moving Occupations by Sex
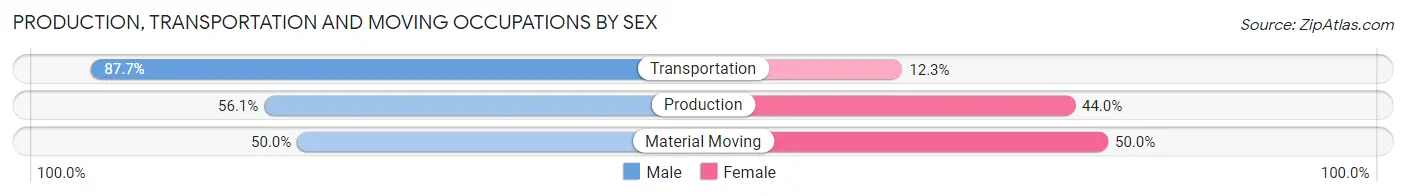
| Occupation | Male | Female |
| Production | 139 (56.0%) | 109 (44.0%) |
| Transportation | 136 (87.7%) | 19 (12.3%) |
| Material Moving | 19 (50.0%) | 19 (50.0%) |
| Total (Category) | 294 (66.7%) | 147 (33.3%) |
| Total (Overall) | 946 (48.8%) | 993 (51.2%) |
Employment Industries by Sex in Randleman
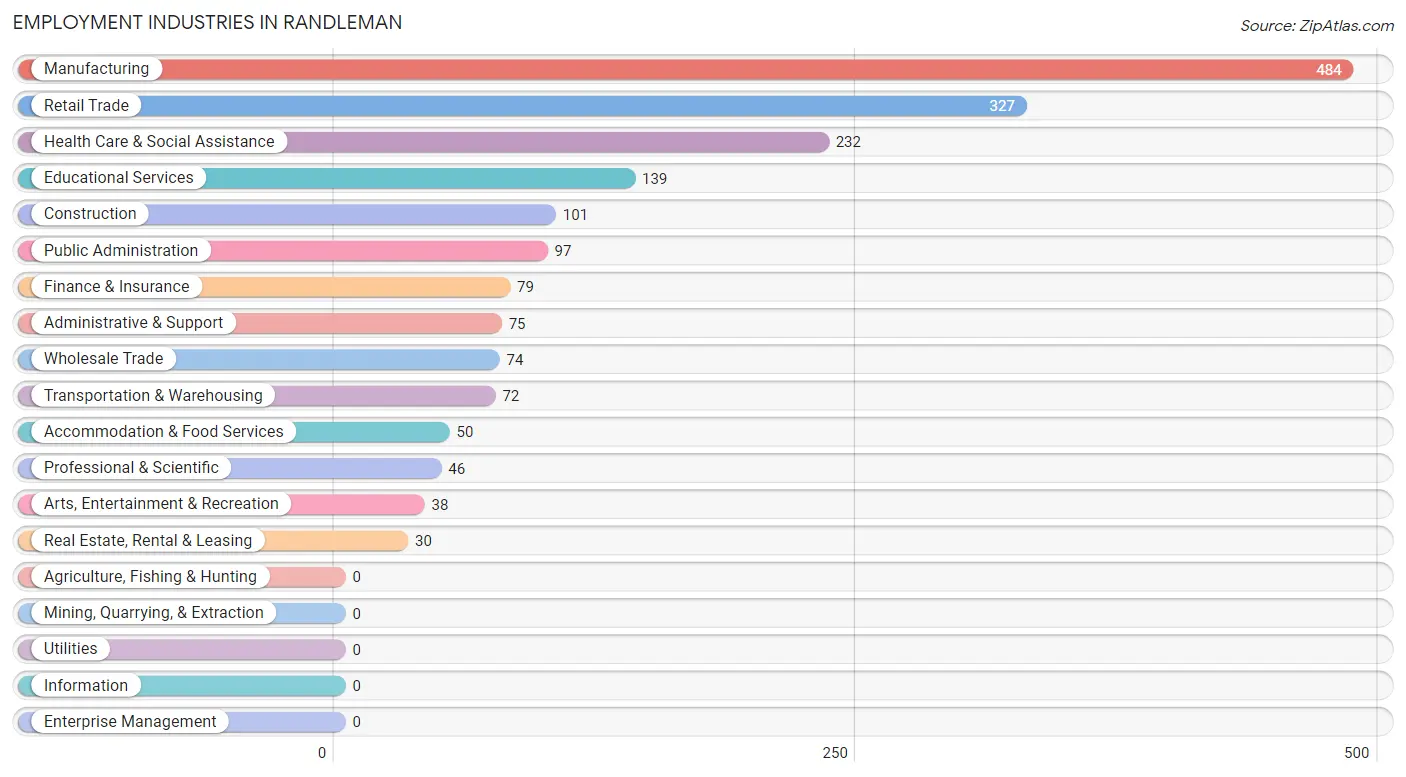
Employment Industries in Randleman
The major employment industries in Randleman include Manufacturing (484 | 25.0%), Retail Trade (327 | 16.9%), Health Care & Social Assistance (232 | 12.0%), Educational Services (139 | 7.2%), and Construction (101 | 5.2%).
Employment Industries by Sex in Randleman
The Randleman industries that see more men than women are Construction (100.0%), Transportation & Warehousing (76.4%), and Arts, Entertainment & Recreation (73.7%), whereas the industries that tend to have a higher number of women are Accommodation & Food Services (100.0%), Educational Services (91.4%), and Professional & Scientific (82.6%).
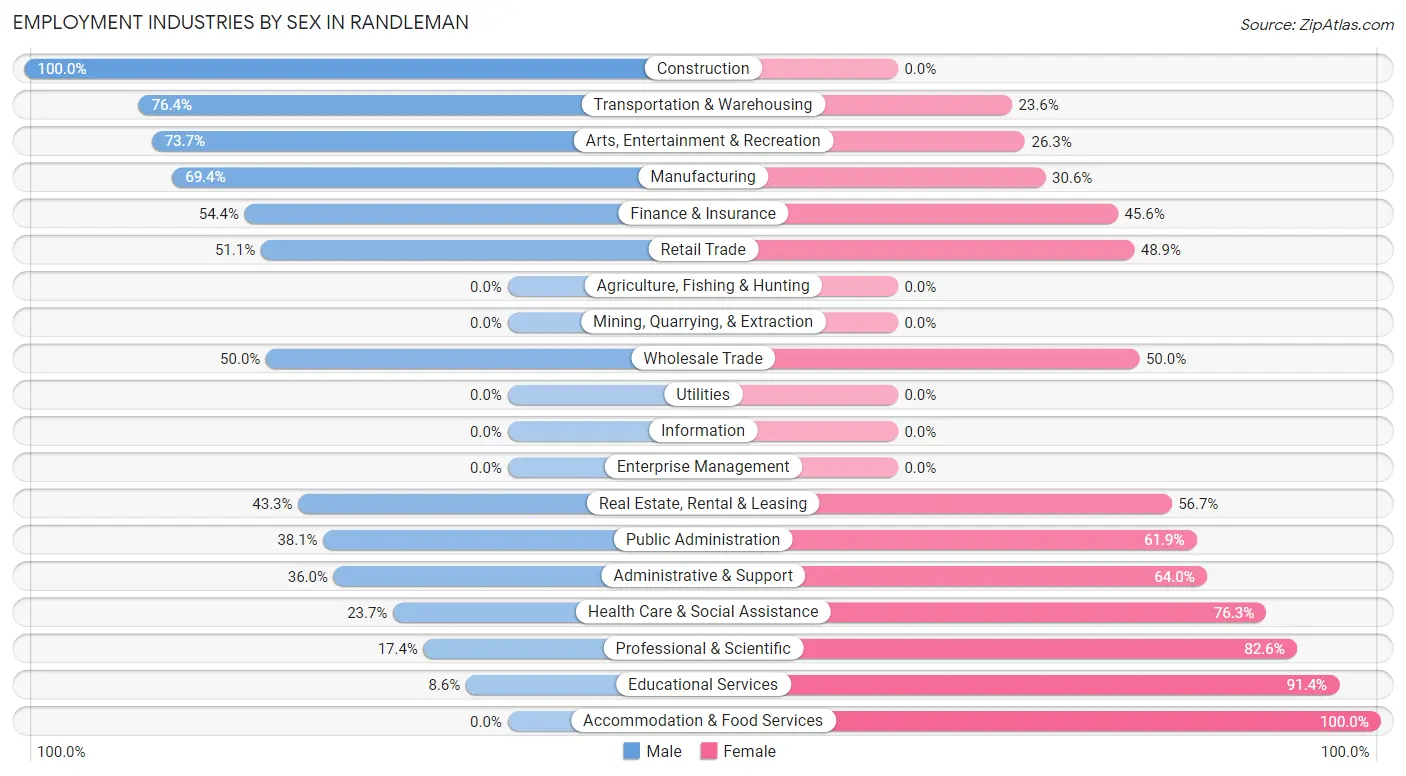
| Industry | Male | Female |
| Agriculture, Fishing & Hunting | 0 (0.0%) | 0 (0.0%) |
| Mining, Quarrying, & Extraction | 0 (0.0%) | 0 (0.0%) |
| Construction | 101 (100.0%) | 0 (0.0%) |
| Manufacturing | 336 (69.4%) | 148 (30.6%) |
| Wholesale Trade | 37 (50.0%) | 37 (50.0%) |
| Retail Trade | 167 (51.1%) | 160 (48.9%) |
| Transportation & Warehousing | 55 (76.4%) | 17 (23.6%) |
| Utilities | 0 (0.0%) | 0 (0.0%) |
| Information | 0 (0.0%) | 0 (0.0%) |
| Finance & Insurance | 43 (54.4%) | 36 (45.6%) |
| Real Estate, Rental & Leasing | 13 (43.3%) | 17 (56.7%) |
| Professional & Scientific | 8 (17.4%) | 38 (82.6%) |
| Enterprise Management | 0 (0.0%) | 0 (0.0%) |
| Administrative & Support | 27 (36.0%) | 48 (64.0%) |
| Educational Services | 12 (8.6%) | 127 (91.4%) |
| Health Care & Social Assistance | 55 (23.7%) | 177 (76.3%) |
| Arts, Entertainment & Recreation | 28 (73.7%) | 10 (26.3%) |
| Accommodation & Food Services | 0 (0.0%) | 50 (100.0%) |
| Public Administration | 37 (38.1%) | 60 (61.9%) |
| Total | 946 (48.8%) | 993 (51.2%) |
Education in Randleman
School Enrollment in Randleman
The most common levels of schooling among the 939 students in Randleman are middle school (303 | 32.3%), high school (254 | 27.1%), and college / undergraduate (209 | 22.3%).
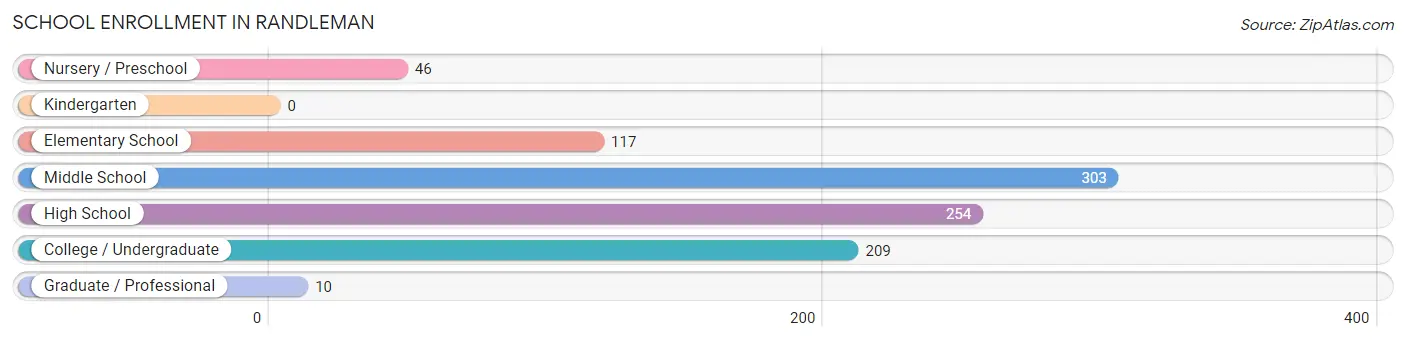
| School Level | # Students | % Students |
| Nursery / Preschool | 46 | 4.9% |
| Kindergarten | 0 | 0.0% |
| Elementary School | 117 | 12.5% |
| Middle School | 303 | 32.3% |
| High School | 254 | 27.1% |
| College / Undergraduate | 209 | 22.3% |
| Graduate / Professional | 10 | 1.1% |
| Total | 939 | 100.0% |
School Enrollment by Age by Funding Source in Randleman
Out of a total of 939 students who are enrolled in schools in Randleman, 193 (20.6%) attend a private institution, while the remaining 746 (79.4%) are enrolled in public schools. The age group of 18 to 19 year olds has the highest likelihood of being enrolled in private schools, with 78 (63.9% in the age bracket) enrolled. Conversely, the age group of 5 to 9 year old has the lowest likelihood of being enrolled in a private school, with 117 (100.0% in the age bracket) attending a public institution.
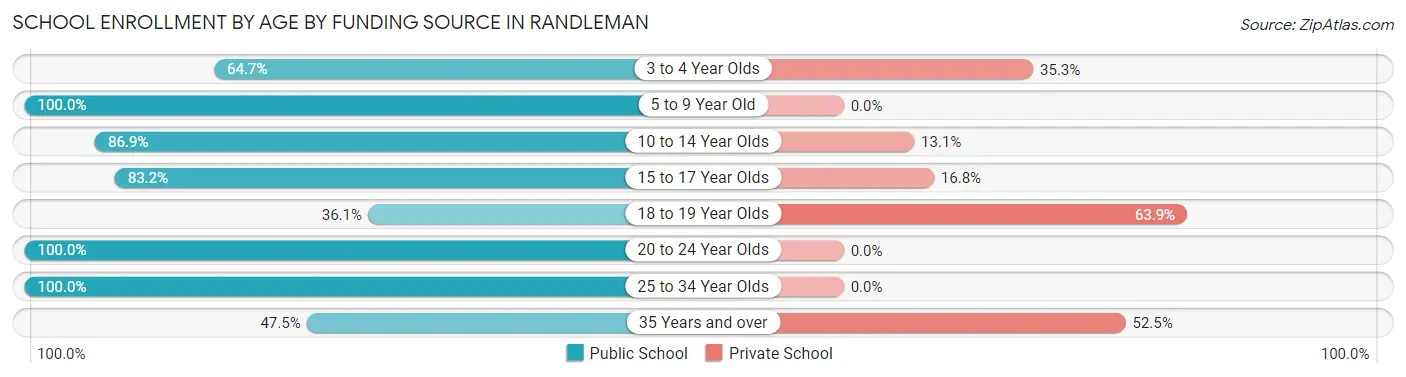
| Age Bracket | Public School | Private School |
| 3 to 4 Year Olds | 22 (64.7%) | 12 (35.3%) |
| 5 to 9 Year Old | 117 (100.0%) | 0 (0.0%) |
| 10 to 14 Year Olds | 291 (86.9%) | 44 (13.1%) |
| 15 to 17 Year Olds | 188 (83.2%) | 38 (16.8%) |
| 18 to 19 Year Olds | 44 (36.1%) | 78 (63.9%) |
| 20 to 24 Year Olds | 34 (100.0%) | 0 (0.0%) |
| 25 to 34 Year Olds | 31 (100.0%) | 0 (0.0%) |
| 35 Years and over | 19 (47.5%) | 21 (52.5%) |
| Total | 746 (79.4%) | 193 (20.6%) |
Educational Attainment by Field of Study in Randleman
Visual & performing arts (66 | 19.5%), science & technology (65 | 19.2%), business (58 | 17.2%), education (47 | 13.9%), and liberal arts & history (39 | 11.5%) are the most common fields of study among 338 individuals in Randleman who have obtained a bachelor's degree or higher.
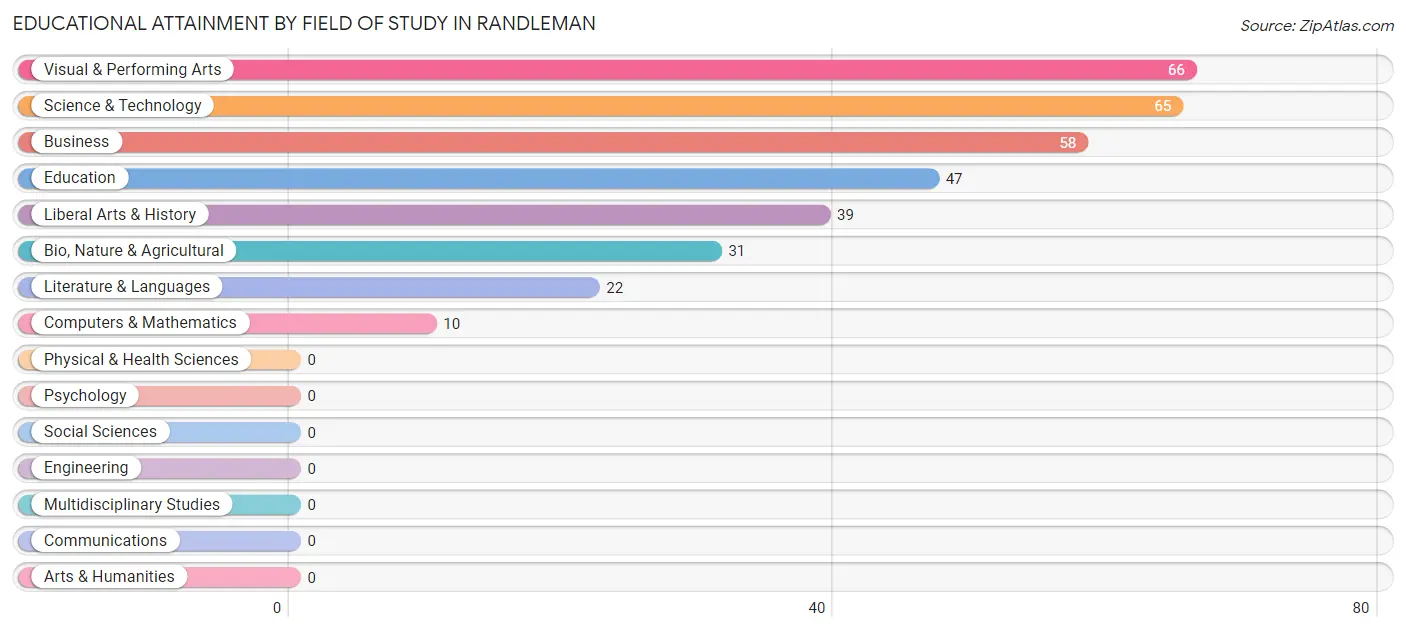
| Field of Study | # Graduates | % Graduates |
| Computers & Mathematics | 10 | 3.0% |
| Bio, Nature & Agricultural | 31 | 9.2% |
| Physical & Health Sciences | 0 | 0.0% |
| Psychology | 0 | 0.0% |
| Social Sciences | 0 | 0.0% |
| Engineering | 0 | 0.0% |
| Multidisciplinary Studies | 0 | 0.0% |
| Science & Technology | 65 | 19.2% |
| Business | 58 | 17.2% |
| Education | 47 | 13.9% |
| Literature & Languages | 22 | 6.5% |
| Liberal Arts & History | 39 | 11.5% |
| Visual & Performing Arts | 66 | 19.5% |
| Communications | 0 | 0.0% |
| Arts & Humanities | 0 | 0.0% |
| Total | 338 | 100.0% |
Transportation & Commute in Randleman
Vehicle Availability by Sex in Randleman
The most prevalent vehicle ownership categories in Randleman are males with 2 vehicles (369, accounting for 39.0%) and females with 2 vehicles (417, making up 37.4%).
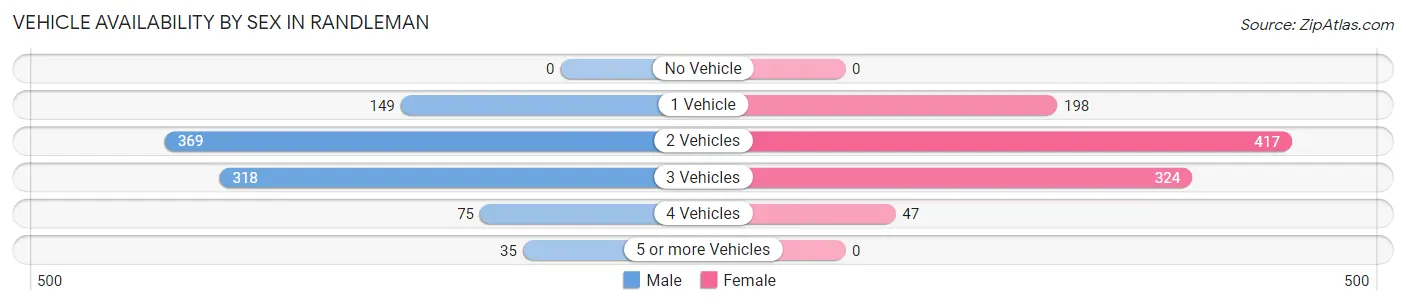
| Vehicles Available | Male | Female |
| No Vehicle | 0 (0.0%) | 0 (0.0%) |
| 1 Vehicle | 149 (15.8%) | 198 (20.1%) |
| 2 Vehicles | 369 (39.0%) | 417 (42.3%) |
| 3 Vehicles | 318 (33.6%) | 324 (32.9%) |
| 4 Vehicles | 75 (7.9%) | 47 (4.8%) |
| 5 or more Vehicles | 35 (3.7%) | 0 (0.0%) |
| Total | 946 (100.0%) | 986 (100.0%) |
Commute Time in Randleman
The most frequently occuring commute durations in Randleman are 20 to 24 minutes (459 commuters, 25.5%), 10 to 14 minutes (257 commuters, 14.3%), and 30 to 34 minutes (220 commuters, 12.2%).
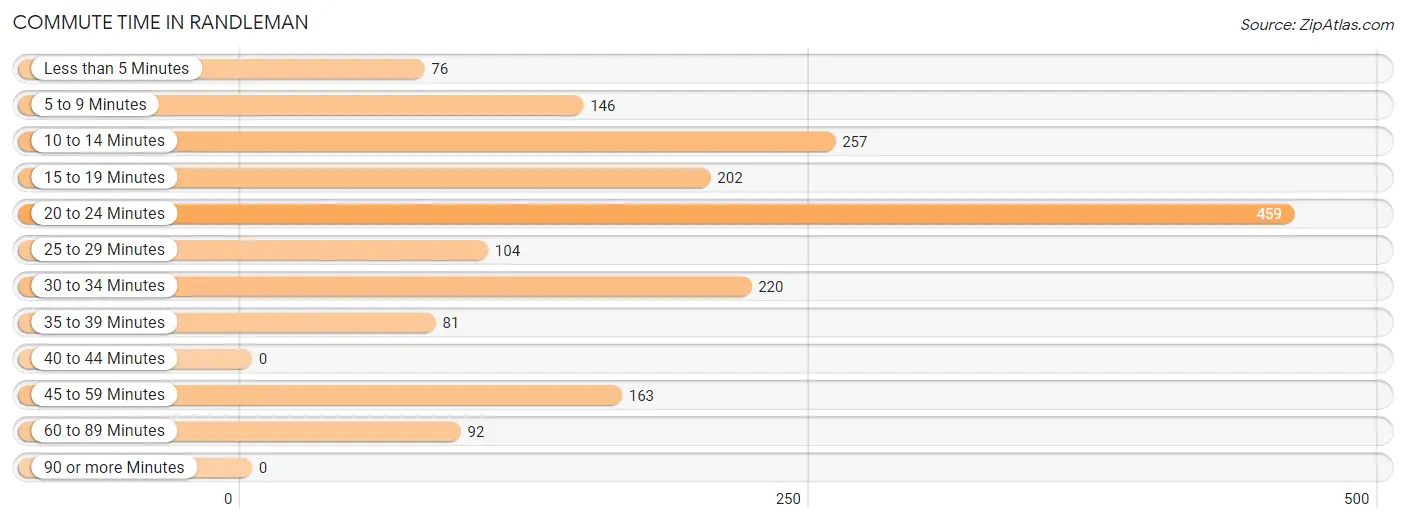
| Commute Time | # Commuters | % Commuters |
| Less than 5 Minutes | 76 | 4.2% |
| 5 to 9 Minutes | 146 | 8.1% |
| 10 to 14 Minutes | 257 | 14.3% |
| 15 to 19 Minutes | 202 | 11.2% |
| 20 to 24 Minutes | 459 | 25.5% |
| 25 to 29 Minutes | 104 | 5.8% |
| 30 to 34 Minutes | 220 | 12.2% |
| 35 to 39 Minutes | 81 | 4.5% |
| 40 to 44 Minutes | 0 | 0.0% |
| 45 to 59 Minutes | 163 | 9.1% |
| 60 to 89 Minutes | 92 | 5.1% |
| 90 or more Minutes | 0 | 0.0% |
Commute Time by Sex in Randleman
The most common commute times in Randleman are 20 to 24 minutes (159 commuters, 18.0%) for males and 20 to 24 minutes (300 commuters, 32.8%) for females.
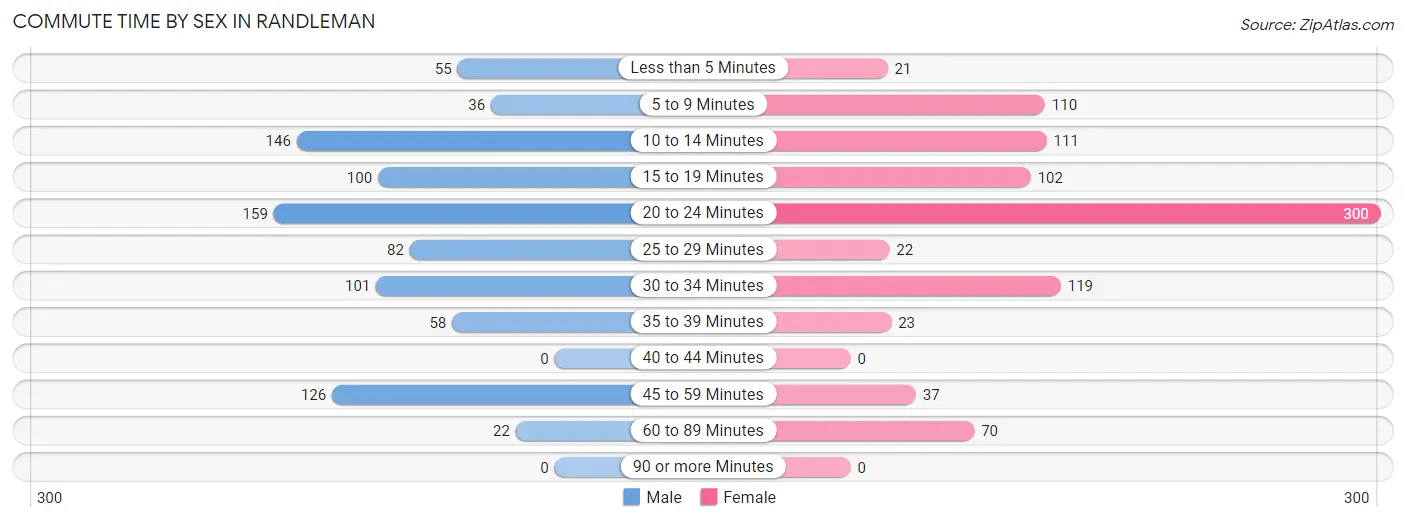
| Commute Time | Male | Female |
| Less than 5 Minutes | 55 (6.2%) | 21 (2.3%) |
| 5 to 9 Minutes | 36 (4.1%) | 110 (12.0%) |
| 10 to 14 Minutes | 146 (16.5%) | 111 (12.1%) |
| 15 to 19 Minutes | 100 (11.3%) | 102 (11.2%) |
| 20 to 24 Minutes | 159 (18.0%) | 300 (32.8%) |
| 25 to 29 Minutes | 82 (9.3%) | 22 (2.4%) |
| 30 to 34 Minutes | 101 (11.4%) | 119 (13.0%) |
| 35 to 39 Minutes | 58 (6.6%) | 23 (2.5%) |
| 40 to 44 Minutes | 0 (0.0%) | 0 (0.0%) |
| 45 to 59 Minutes | 126 (14.2%) | 37 (4.0%) |
| 60 to 89 Minutes | 22 (2.5%) | 70 (7.6%) |
| 90 or more Minutes | 0 (0.0%) | 0 (0.0%) |
Time of Departure to Work by Sex in Randleman
The most frequent times of departure to work in Randleman are 6:00 AM to 6:29 AM (202, 22.8%) for males and 7:30 AM to 7:59 AM (219, 23.9%) for females.
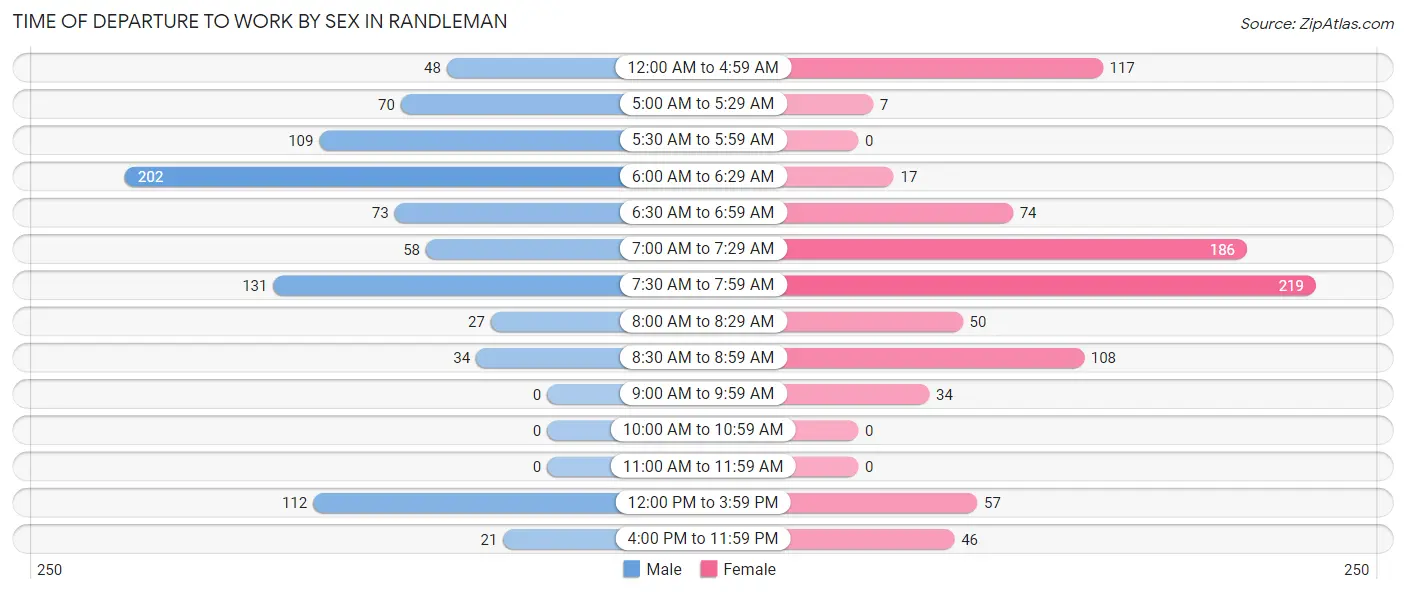
| Time of Departure | Male | Female |
| 12:00 AM to 4:59 AM | 48 (5.4%) | 117 (12.8%) |
| 5:00 AM to 5:29 AM | 70 (7.9%) | 7 (0.8%) |
| 5:30 AM to 5:59 AM | 109 (12.3%) | 0 (0.0%) |
| 6:00 AM to 6:29 AM | 202 (22.8%) | 17 (1.9%) |
| 6:30 AM to 6:59 AM | 73 (8.3%) | 74 (8.1%) |
| 7:00 AM to 7:29 AM | 58 (6.6%) | 186 (20.3%) |
| 7:30 AM to 7:59 AM | 131 (14.8%) | 219 (23.9%) |
| 8:00 AM to 8:29 AM | 27 (3.0%) | 50 (5.5%) |
| 8:30 AM to 8:59 AM | 34 (3.8%) | 108 (11.8%) |
| 9:00 AM to 9:59 AM | 0 (0.0%) | 34 (3.7%) |
| 10:00 AM to 10:59 AM | 0 (0.0%) | 0 (0.0%) |
| 11:00 AM to 11:59 AM | 0 (0.0%) | 0 (0.0%) |
| 12:00 PM to 3:59 PM | 112 (12.7%) | 57 (6.2%) |
| 4:00 PM to 11:59 PM | 21 (2.4%) | 46 (5.0%) |
| Total | 885 (100.0%) | 915 (100.0%) |
Housing Occupancy in Randleman
Occupancy by Ownership in Randleman
Of the total 1,523 dwellings in Randleman, owner-occupied units account for 1,028 (67.5%), while renter-occupied units make up 495 (32.5%).
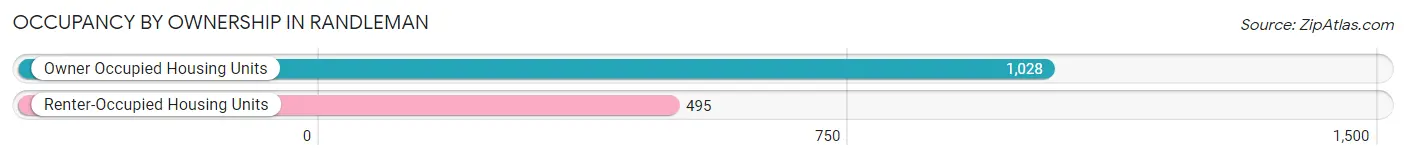
| Occupancy | # Housing Units | % Housing Units |
| Owner Occupied Housing Units | 1,028 | 67.5% |
| Renter-Occupied Housing Units | 495 | 32.5% |
| Total Occupied Housing Units | 1,523 | 100.0% |
Occupancy by Household Size in Randleman
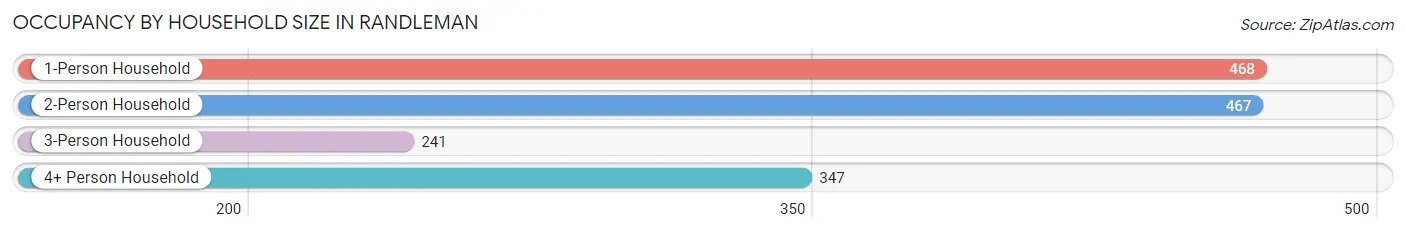
| Household Size | # Housing Units | % Housing Units |
| 1-Person Household | 468 | 30.7% |
| 2-Person Household | 467 | 30.7% |
| 3-Person Household | 241 | 15.8% |
| 4+ Person Household | 347 | 22.8% |
| Total Housing Units | 1,523 | 100.0% |
Occupancy by Ownership by Household Size in Randleman
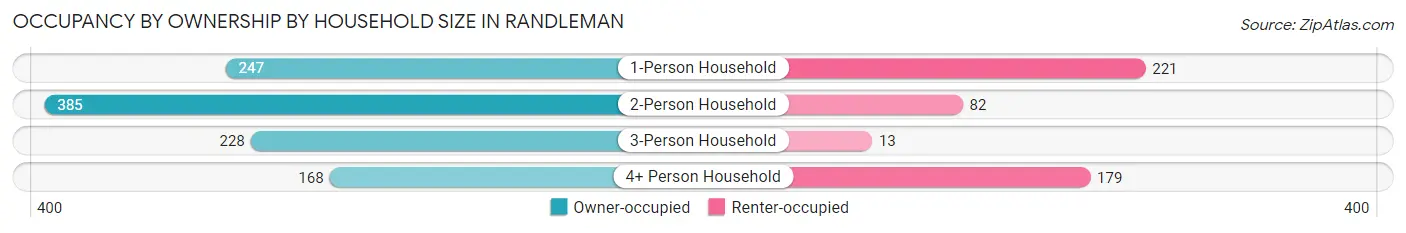
| Household Size | Owner-occupied | Renter-occupied |
| 1-Person Household | 247 (52.8%) | 221 (47.2%) |
| 2-Person Household | 385 (82.4%) | 82 (17.6%) |
| 3-Person Household | 228 (94.6%) | 13 (5.4%) |
| 4+ Person Household | 168 (48.4%) | 179 (51.6%) |
| Total Housing Units | 1,028 (67.5%) | 495 (32.5%) |
Occupancy by Educational Attainment in Randleman
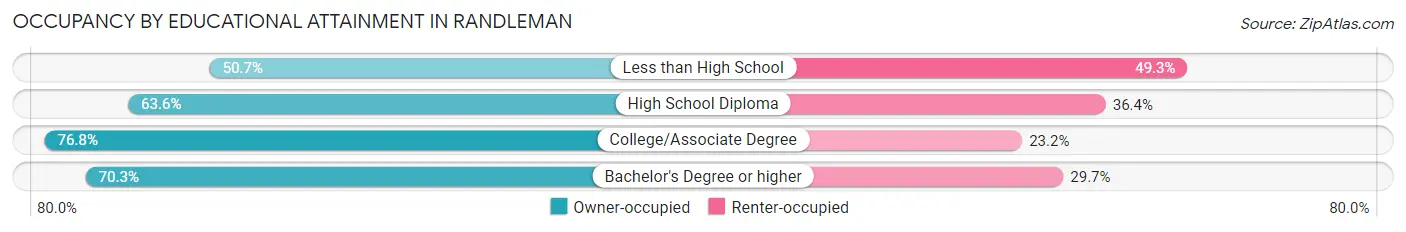
| Household Size | Owner-occupied | Renter-occupied |
| Less than High School | 115 (50.7%) | 112 (49.3%) |
| High School Diploma | 337 (63.6%) | 193 (36.4%) |
| College/Associate Degree | 441 (76.8%) | 133 (23.2%) |
| Bachelor's Degree or higher | 135 (70.3%) | 57 (29.7%) |
Occupancy by Age of Householder in Randleman
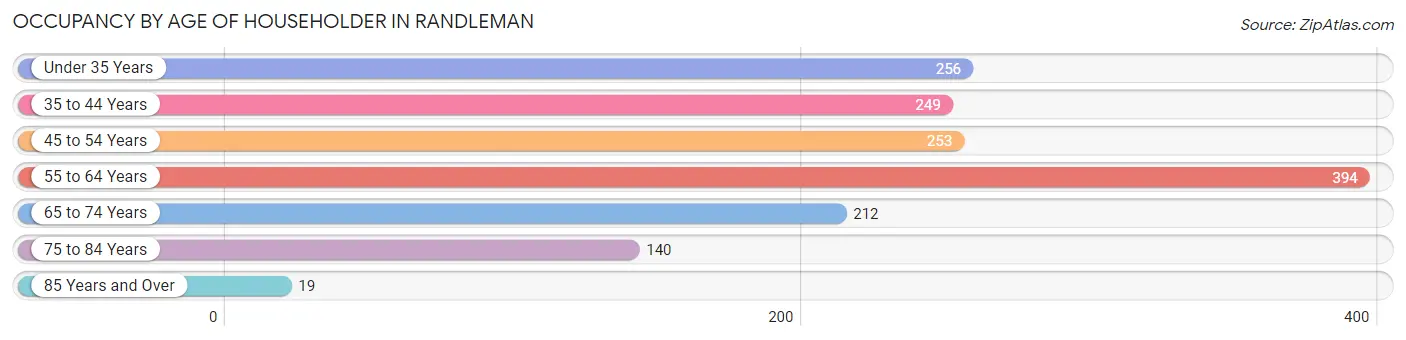
| Age Bracket | # Households | % Households |
| Under 35 Years | 256 | 16.8% |
| 35 to 44 Years | 249 | 16.4% |
| 45 to 54 Years | 253 | 16.6% |
| 55 to 64 Years | 394 | 25.9% |
| 65 to 74 Years | 212 | 13.9% |
| 75 to 84 Years | 140 | 9.2% |
| 85 Years and Over | 19 | 1.3% |
| Total | 1,523 | 100.0% |
Housing Finances in Randleman
Median Income by Occupancy in Randleman
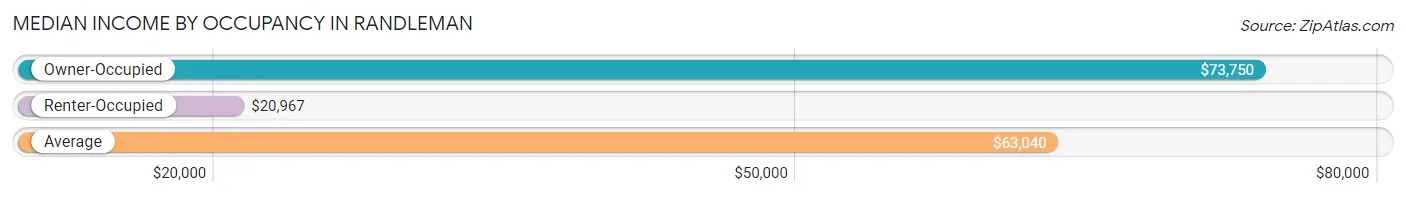
| Occupancy Type | # Households | Median Income |
| Owner-Occupied | 1,028 (67.5%) | $73,750 |
| Renter-Occupied | 495 (32.5%) | $20,967 |
| Average | 1,523 (100.0%) | $63,040 |
Occupancy by Householder Income Bracket in Randleman
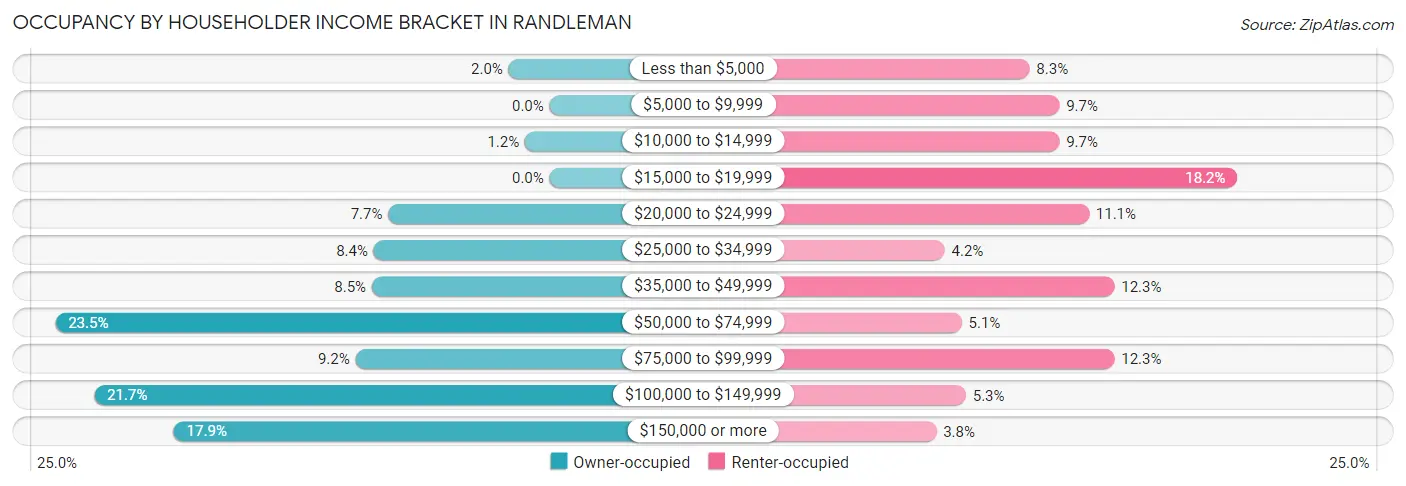
| Income Bracket | Owner-occupied | Renter-occupied |
| Less than $5,000 | 20 (1.9%) | 41 (8.3%) |
| $5,000 to $9,999 | 0 (0.0%) | 48 (9.7%) |
| $10,000 to $14,999 | 12 (1.2%) | 48 (9.7%) |
| $15,000 to $19,999 | 0 (0.0%) | 90 (18.2%) |
| $20,000 to $24,999 | 79 (7.7%) | 55 (11.1%) |
| $25,000 to $34,999 | 86 (8.4%) | 21 (4.2%) |
| $35,000 to $49,999 | 87 (8.5%) | 61 (12.3%) |
| $50,000 to $74,999 | 242 (23.5%) | 25 (5.1%) |
| $75,000 to $99,999 | 95 (9.2%) | 61 (12.3%) |
| $100,000 to $149,999 | 223 (21.7%) | 26 (5.2%) |
| $150,000 or more | 184 (17.9%) | 19 (3.8%) |
| Total | 1,028 (100.0%) | 495 (100.0%) |
Monthly Housing Cost Tiers in Randleman
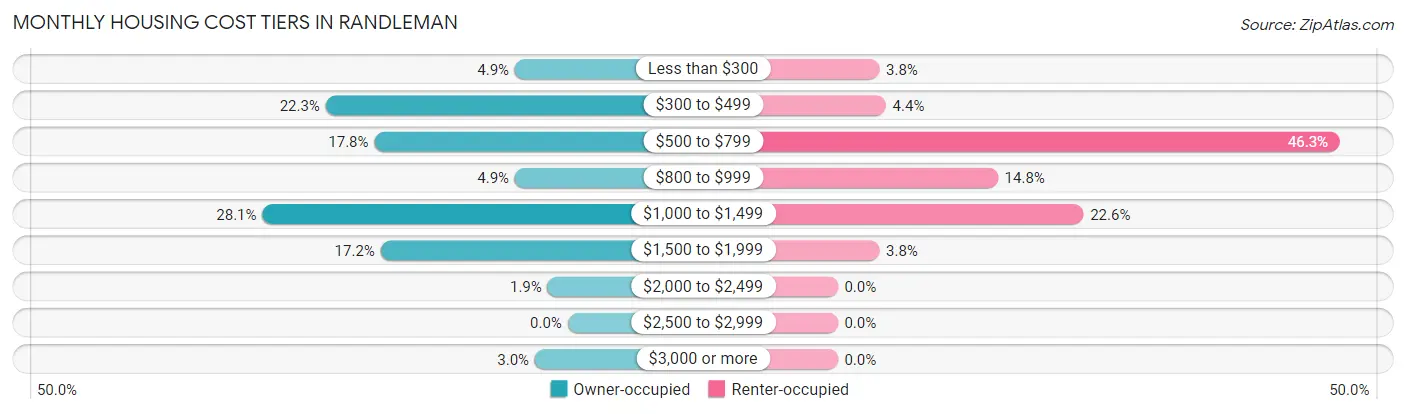
| Monthly Cost | Owner-occupied | Renter-occupied |
| Less than $300 | 50 (4.9%) | 19 (3.8%) |
| $300 to $499 | 229 (22.3%) | 22 (4.4%) |
| $500 to $799 | 183 (17.8%) | 229 (46.3%) |
| $800 to $999 | 50 (4.9%) | 73 (14.7%) |
| $1,000 to $1,499 | 289 (28.1%) | 112 (22.6%) |
| $1,500 to $1,999 | 177 (17.2%) | 19 (3.8%) |
| $2,000 to $2,499 | 19 (1.8%) | 0 (0.0%) |
| $2,500 to $2,999 | 0 (0.0%) | 0 (0.0%) |
| $3,000 or more | 31 (3.0%) | 0 (0.0%) |
| Total | 1,028 (100.0%) | 495 (100.0%) |
Physical Housing Characteristics in Randleman
Housing Structures in Randleman
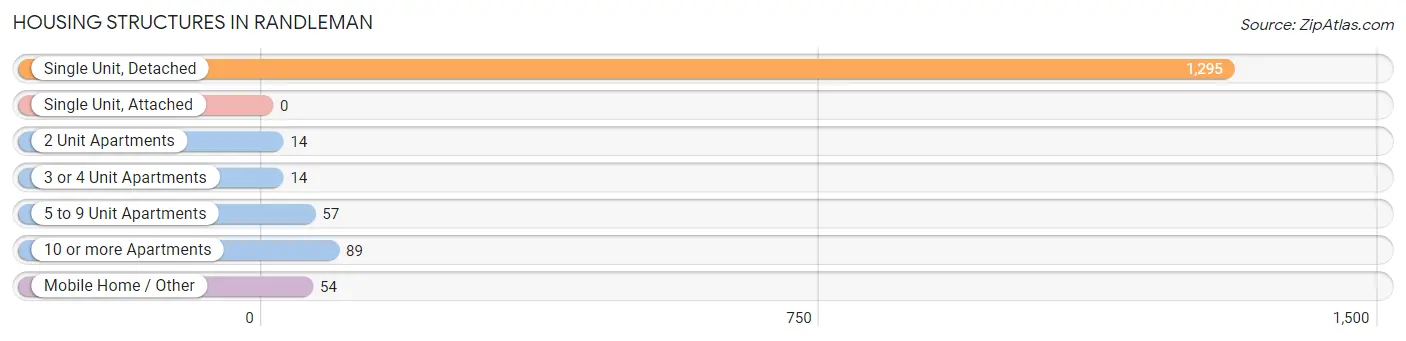
| Structure Type | # Housing Units | % Housing Units |
| Single Unit, Detached | 1,295 | 85.0% |
| Single Unit, Attached | 0 | 0.0% |
| 2 Unit Apartments | 14 | 0.9% |
| 3 or 4 Unit Apartments | 14 | 0.9% |
| 5 to 9 Unit Apartments | 57 | 3.7% |
| 10 or more Apartments | 89 | 5.8% |
| Mobile Home / Other | 54 | 3.5% |
| Total | 1,523 | 100.0% |
Housing Structures by Occupancy in Randleman
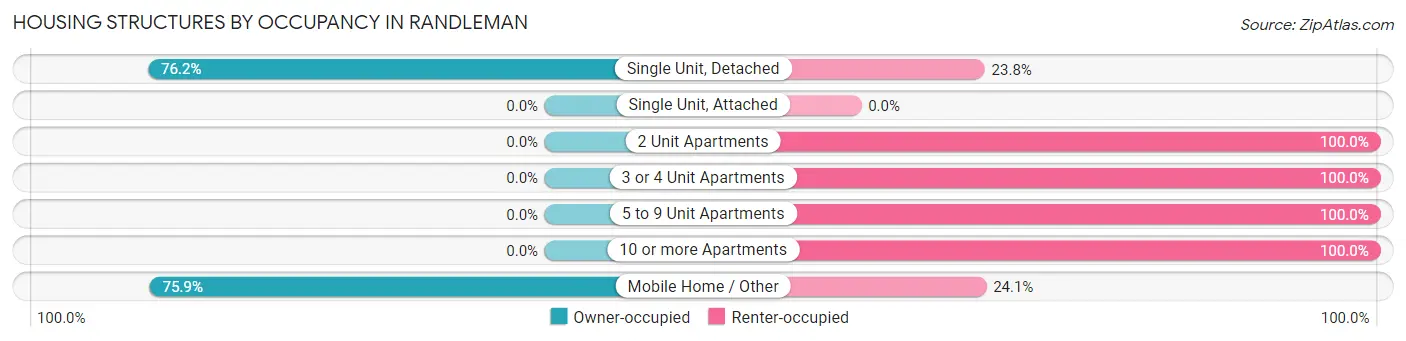
| Structure Type | Owner-occupied | Renter-occupied |
| Single Unit, Detached | 987 (76.2%) | 308 (23.8%) |
| Single Unit, Attached | 0 (0.0%) | 0 (0.0%) |
| 2 Unit Apartments | 0 (0.0%) | 14 (100.0%) |
| 3 or 4 Unit Apartments | 0 (0.0%) | 14 (100.0%) |
| 5 to 9 Unit Apartments | 0 (0.0%) | 57 (100.0%) |
| 10 or more Apartments | 0 (0.0%) | 89 (100.0%) |
| Mobile Home / Other | 41 (75.9%) | 13 (24.1%) |
| Total | 1,028 (67.5%) | 495 (32.5%) |
Housing Structures by Number of Rooms in Randleman
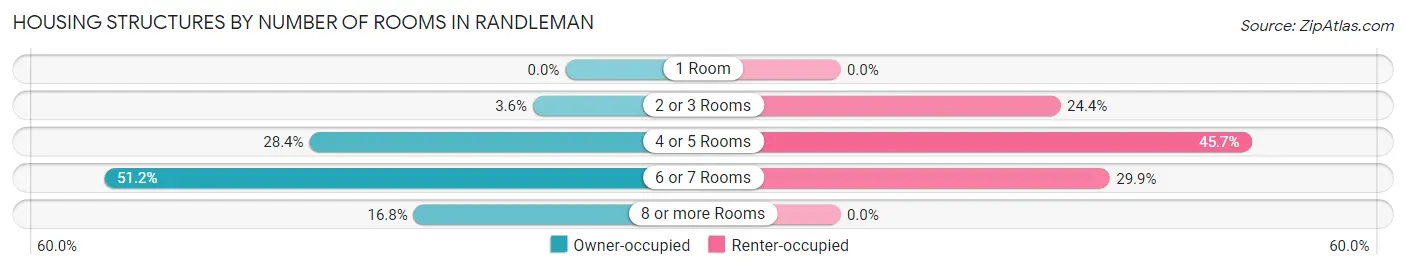
| Number of Rooms | Owner-occupied | Renter-occupied |
| 1 Room | 0 (0.0%) | 0 (0.0%) |
| 2 or 3 Rooms | 37 (3.6%) | 121 (24.4%) |
| 4 or 5 Rooms | 292 (28.4%) | 226 (45.7%) |
| 6 or 7 Rooms | 526 (51.2%) | 148 (29.9%) |
| 8 or more Rooms | 173 (16.8%) | 0 (0.0%) |
| Total | 1,028 (100.0%) | 495 (100.0%) |
Housing Structure by Heating Type in Randleman
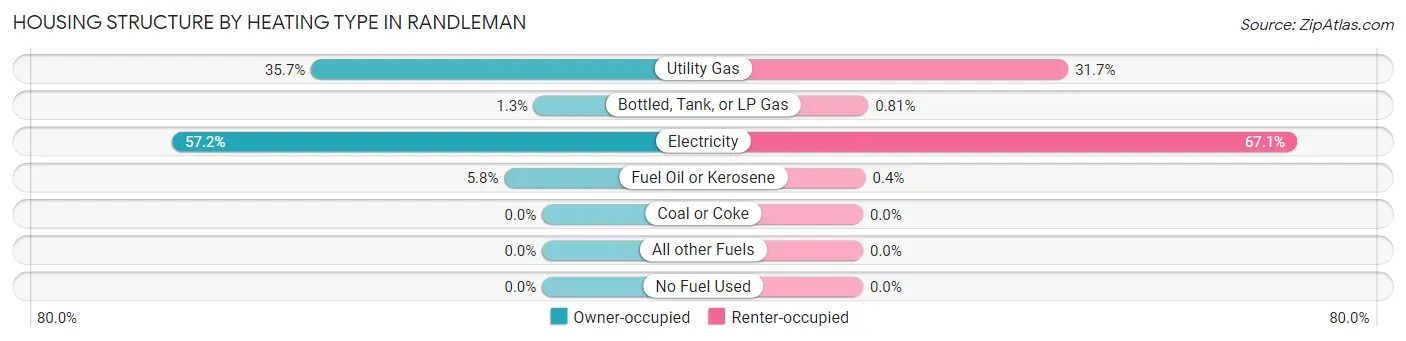
| Heating Type | Owner-occupied | Renter-occupied |
| Utility Gas | 367 (35.7%) | 157 (31.7%) |
| Bottled, Tank, or LP Gas | 13 (1.3%) | 4 (0.8%) |
| Electricity | 588 (57.2%) | 332 (67.1%) |
| Fuel Oil or Kerosene | 60 (5.8%) | 2 (0.4%) |
| Coal or Coke | 0 (0.0%) | 0 (0.0%) |
| All other Fuels | 0 (0.0%) | 0 (0.0%) |
| No Fuel Used | 0 (0.0%) | 0 (0.0%) |
| Total | 1,028 (100.0%) | 495 (100.0%) |
Household Vehicle Usage in Randleman
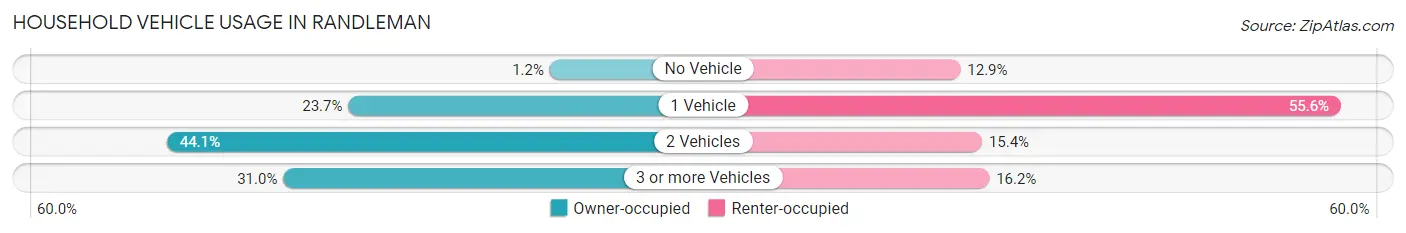
| Vehicles per Household | Owner-occupied | Renter-occupied |
| No Vehicle | 12 (1.2%) | 64 (12.9%) |
| 1 Vehicle | 244 (23.7%) | 275 (55.6%) |
| 2 Vehicles | 453 (44.1%) | 76 (15.3%) |
| 3 or more Vehicles | 319 (31.0%) | 80 (16.2%) |
| Total | 1,028 (100.0%) | 495 (100.0%) |
Real Estate & Mortgages in Randleman
Real Estate and Mortgage Overview in Randleman
| Characteristic | Without Mortgage | With Mortgage |
| Housing Units | 410 | 618 |
| Median Property Value | $123,700 | $170,100 |
| Median Household Income | - | - |
| Monthly Housing Costs | $455 | $31 |
| Real Estate Taxes | $1,384 | $16 |
Property Value by Mortgage Status in Randleman
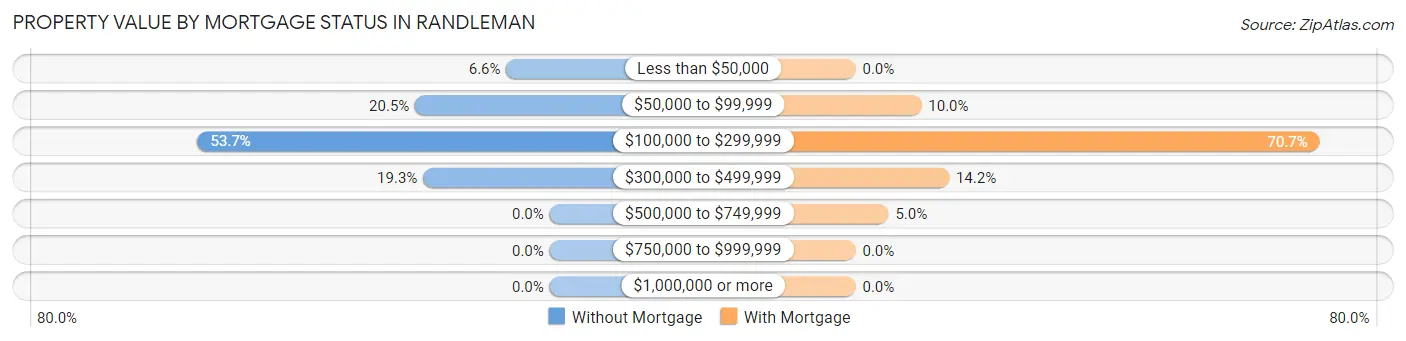
| Property Value | Without Mortgage | With Mortgage |
| Less than $50,000 | 27 (6.6%) | 0 (0.0%) |
| $50,000 to $99,999 | 84 (20.5%) | 62 (10.0%) |
| $100,000 to $299,999 | 220 (53.7%) | 437 (70.7%) |
| $300,000 to $499,999 | 79 (19.3%) | 88 (14.2%) |
| $500,000 to $749,999 | 0 (0.0%) | 31 (5.0%) |
| $750,000 to $999,999 | 0 (0.0%) | 0 (0.0%) |
| $1,000,000 or more | 0 (0.0%) | 0 (0.0%) |
| Total | 410 (100.0%) | 618 (100.0%) |
Household Income by Mortgage Status in Randleman
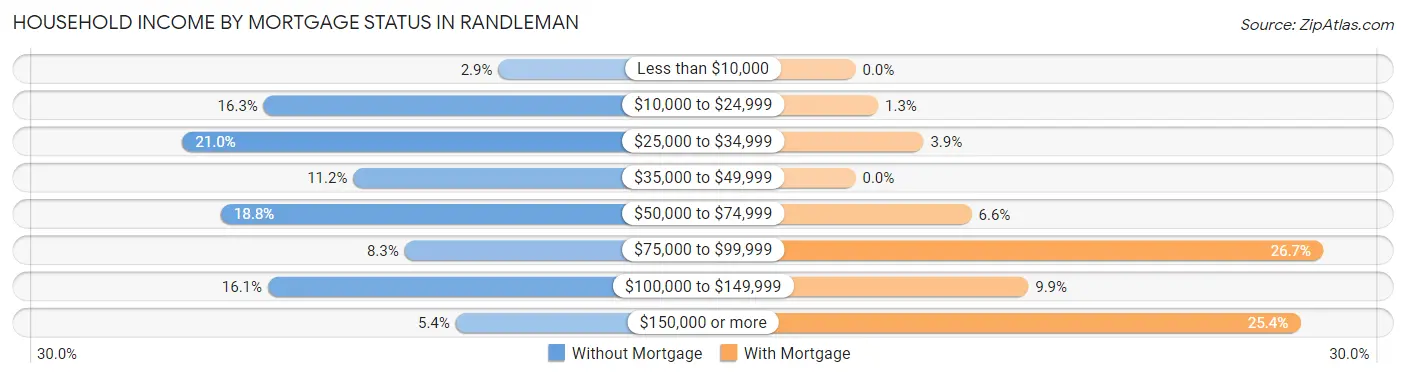
| Household Income | Without Mortgage | With Mortgage |
| Less than $10,000 | 12 (2.9%) | 0 (0.0%) |
| $10,000 to $24,999 | 67 (16.3%) | 8 (1.3%) |
| $25,000 to $34,999 | 86 (21.0%) | 24 (3.9%) |
| $35,000 to $49,999 | 46 (11.2%) | 0 (0.0%) |
| $50,000 to $74,999 | 77 (18.8%) | 41 (6.6%) |
| $75,000 to $99,999 | 34 (8.3%) | 165 (26.7%) |
| $100,000 to $149,999 | 66 (16.1%) | 61 (9.9%) |
| $150,000 or more | 22 (5.4%) | 157 (25.4%) |
| Total | 410 (100.0%) | 618 (100.0%) |
Property Value to Household Income Ratio in Randleman
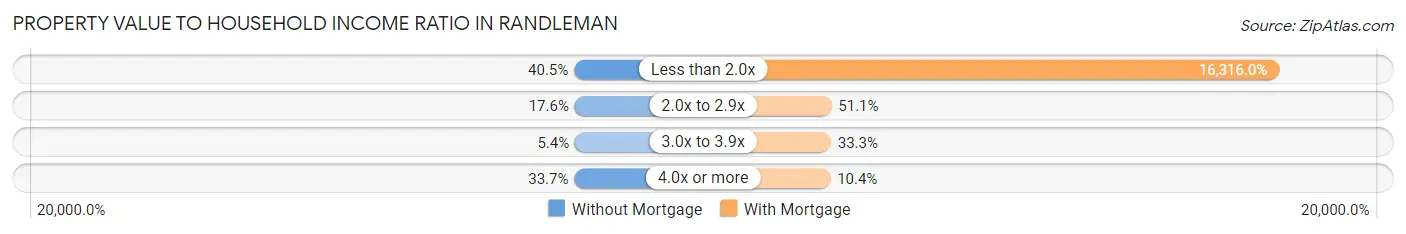
| Value-to-Income Ratio | Without Mortgage | With Mortgage |
| Less than 2.0x | 166 (40.5%) | 100,833 (16,316.0%) |
| 2.0x to 2.9x | 72 (17.6%) | 316 (51.1%) |
| 3.0x to 3.9x | 22 (5.4%) | 206 (33.3%) |
| 4.0x or more | 138 (33.7%) | 64 (10.4%) |
| Total | 410 (100.0%) | 618 (100.0%) |
Real Estate Taxes by Mortgage Status in Randleman
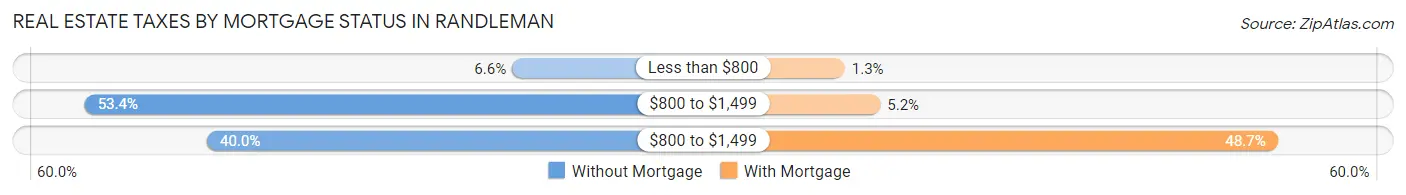
| Property Taxes | Without Mortgage | With Mortgage |
| Less than $800 | 27 (6.6%) | 8 (1.3%) |
| $800 to $1,499 | 219 (53.4%) | 32 (5.2%) |
| $800 to $1,499 | 164 (40.0%) | 301 (48.7%) |
| Total | 410 (100.0%) | 618 (100.0%) |
Health & Disability in Randleman
Health Insurance Coverage by Age in Randleman
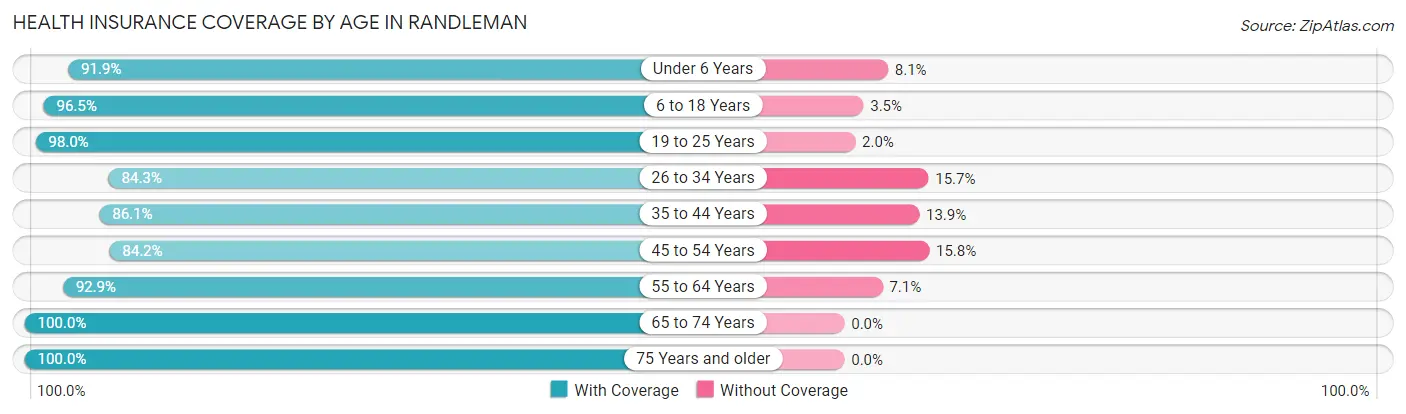
| Age Bracket | With Coverage | Without Coverage |
| Under 6 Years | 611 (91.9%) | 54 (8.1%) |
| 6 to 18 Years | 791 (96.5%) | 29 (3.5%) |
| 19 to 25 Years | 340 (98.0%) | 7 (2.0%) |
| 26 to 34 Years | 425 (84.3%) | 79 (15.7%) |
| 35 to 44 Years | 352 (86.1%) | 57 (13.9%) |
| 45 to 54 Years | 559 (84.2%) | 105 (15.8%) |
| 55 to 64 Years | 536 (92.9%) | 41 (7.1%) |
| 65 to 74 Years | 392 (100.0%) | 0 (0.0%) |
| 75 Years and older | 195 (100.0%) | 0 (0.0%) |
| Total | 4,201 (91.9%) | 372 (8.1%) |
Health Insurance Coverage by Citizenship Status in Randleman
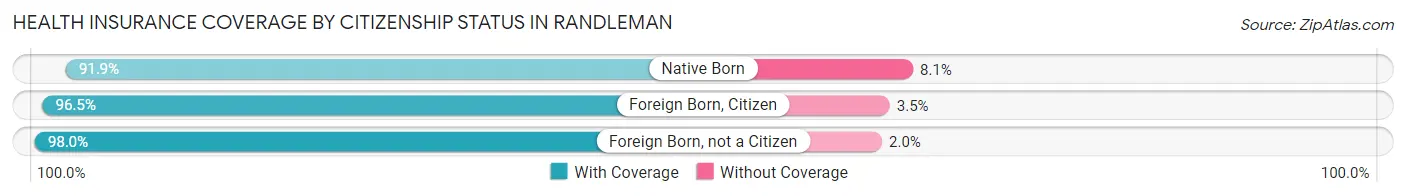
| Citizenship Status | With Coverage | Without Coverage |
| Native Born | 611 (91.9%) | 54 (8.1%) |
| Foreign Born, Citizen | 791 (96.5%) | 29 (3.5%) |
| Foreign Born, not a Citizen | 340 (98.0%) | 7 (2.0%) |
Health Insurance Coverage by Household Income in Randleman
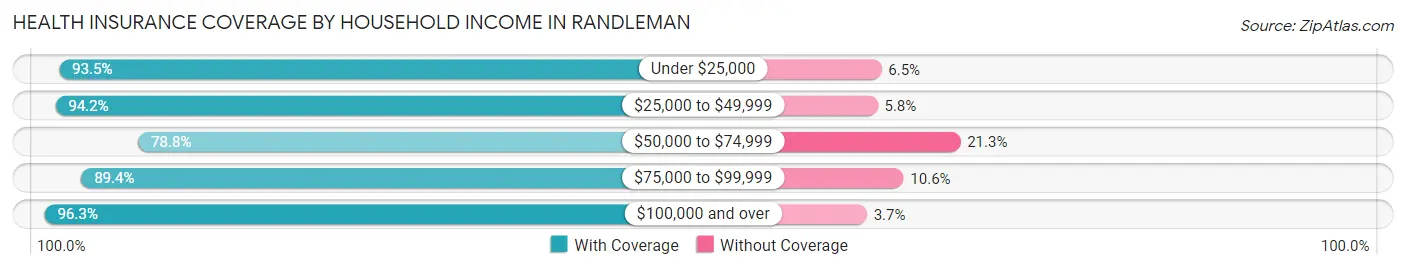
| Household Income | With Coverage | Without Coverage |
| Under $25,000 | 1,285 (93.5%) | 89 (6.5%) |
| $25,000 to $49,999 | 556 (94.2%) | 34 (5.8%) |
| $50,000 to $74,999 | 478 (78.7%) | 129 (21.2%) |
| $75,000 to $99,999 | 590 (89.4%) | 70 (10.6%) |
| $100,000 and over | 1,292 (96.3%) | 50 (3.7%) |
Public vs Private Health Insurance Coverage by Age in Randleman
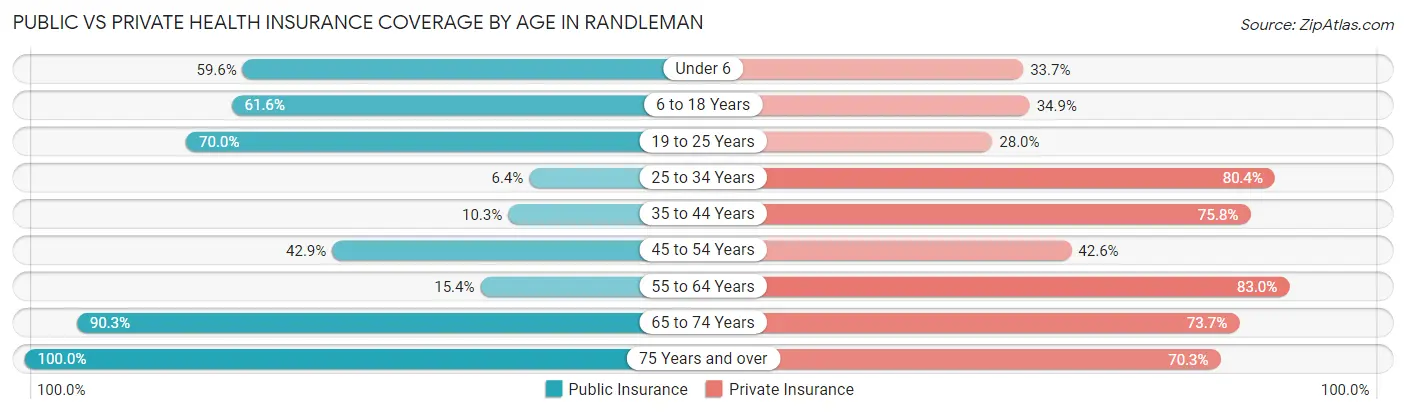
| Age Bracket | Public Insurance | Private Insurance |
| Under 6 | 396 (59.6%) | 224 (33.7%) |
| 6 to 18 Years | 505 (61.6%) | 286 (34.9%) |
| 19 to 25 Years | 243 (70.0%) | 97 (28.0%) |
| 25 to 34 Years | 32 (6.4%) | 405 (80.4%) |
| 35 to 44 Years | 42 (10.3%) | 310 (75.8%) |
| 45 to 54 Years | 285 (42.9%) | 283 (42.6%) |
| 55 to 64 Years | 89 (15.4%) | 479 (83.0%) |
| 65 to 74 Years | 354 (90.3%) | 289 (73.7%) |
| 75 Years and over | 195 (100.0%) | 137 (70.3%) |
| Total | 2,141 (46.8%) | 2,510 (54.9%) |
Disability Status by Sex by Age in Randleman
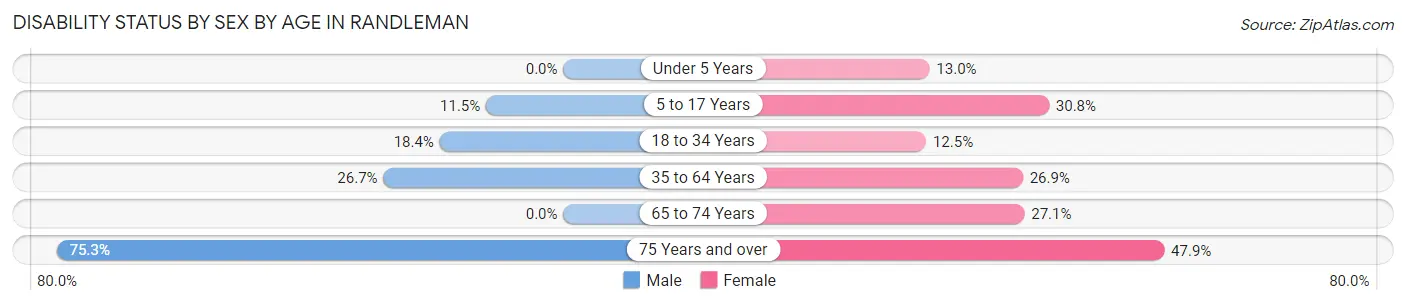
| Age Bracket | Male | Female |
| Under 5 Years | 0 (0.0%) | 19 (13.0%) |
| 5 to 17 Years | 43 (11.5%) | 115 (30.7%) |
| 18 to 34 Years | 67 (18.4%) | 75 (12.5%) |
| 35 to 64 Years | 229 (26.7%) | 213 (26.9%) |
| 65 to 74 Years | 0 (0.0%) | 71 (27.1%) |
| 75 Years and over | 76 (75.2%) | 45 (47.9%) |
Disability Class by Sex by Age in Randleman
Disability Class: Hearing Difficulty
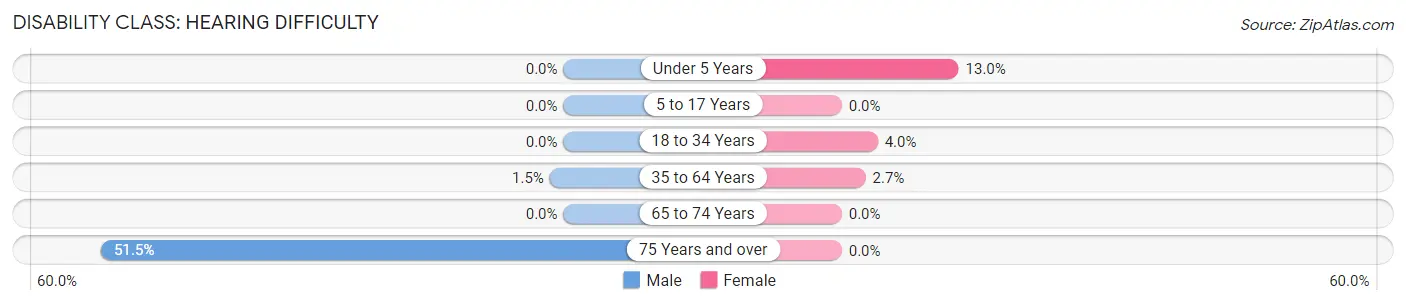
| Age Bracket | Male | Female |
| Under 5 Years | 0 (0.0%) | 19 (13.0%) |
| 5 to 17 Years | 0 (0.0%) | 0 (0.0%) |
| 18 to 34 Years | 0 (0.0%) | 24 (4.0%) |
| 35 to 64 Years | 13 (1.5%) | 21 (2.6%) |
| 65 to 74 Years | 0 (0.0%) | 0 (0.0%) |
| 75 Years and over | 52 (51.5%) | 0 (0.0%) |
Disability Class: Vision Difficulty
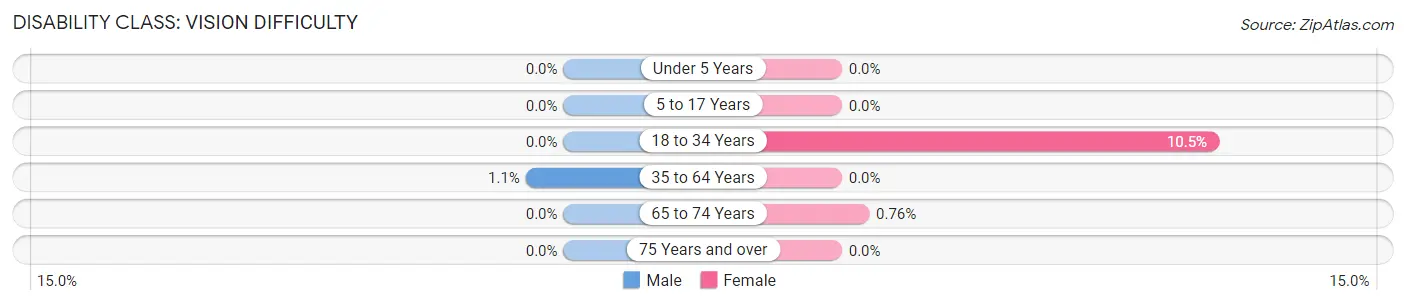
| Age Bracket | Male | Female |
| Under 5 Years | 0 (0.0%) | 0 (0.0%) |
| 5 to 17 Years | 0 (0.0%) | 0 (0.0%) |
| 18 to 34 Years | 0 (0.0%) | 63 (10.5%) |
| 35 to 64 Years | 9 (1.1%) | 0 (0.0%) |
| 65 to 74 Years | 0 (0.0%) | 2 (0.8%) |
| 75 Years and over | 0 (0.0%) | 0 (0.0%) |
Disability Class: Cognitive Difficulty
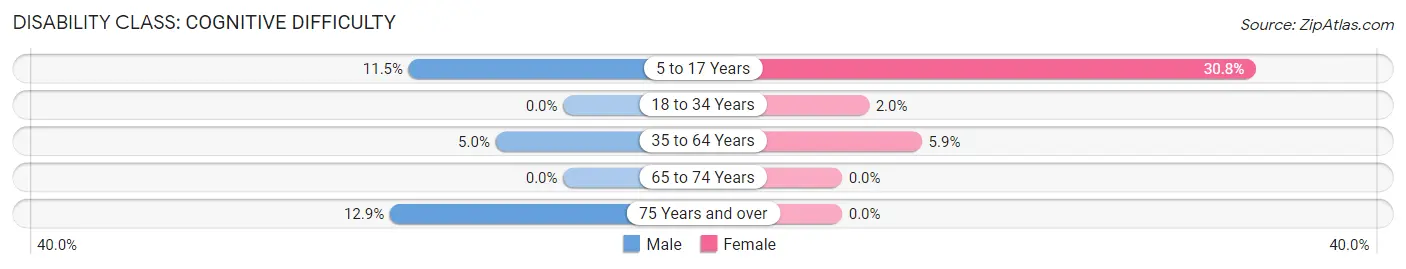
| Age Bracket | Male | Female |
| 5 to 17 Years | 43 (11.5%) | 115 (30.7%) |
| 18 to 34 Years | 0 (0.0%) | 12 (2.0%) |
| 35 to 64 Years | 43 (5.0%) | 47 (5.9%) |
| 65 to 74 Years | 0 (0.0%) | 0 (0.0%) |
| 75 Years and over | 13 (12.9%) | 0 (0.0%) |
Disability Class: Ambulatory Difficulty
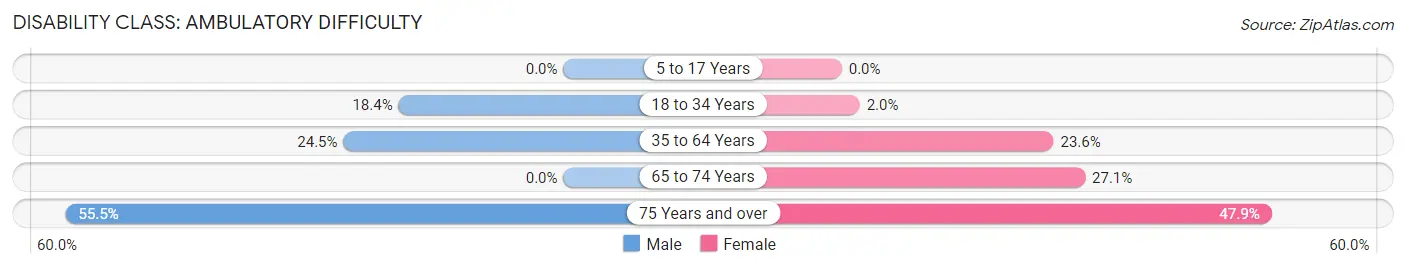
| Age Bracket | Male | Female |
| 5 to 17 Years | 0 (0.0%) | 0 (0.0%) |
| 18 to 34 Years | 67 (18.4%) | 12 (2.0%) |
| 35 to 64 Years | 210 (24.5%) | 187 (23.6%) |
| 65 to 74 Years | 0 (0.0%) | 71 (27.1%) |
| 75 Years and over | 56 (55.4%) | 45 (47.9%) |
Disability Class: Self-Care Difficulty
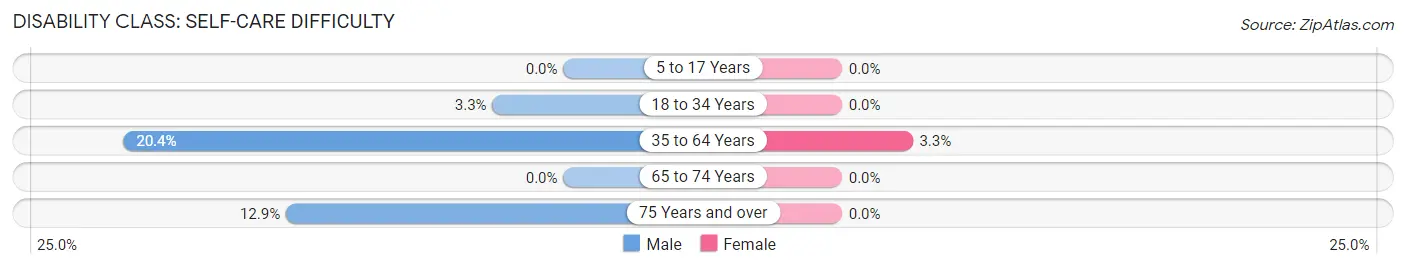
| Age Bracket | Male | Female |
| 5 to 17 Years | 0 (0.0%) | 0 (0.0%) |
| 18 to 34 Years | 12 (3.3%) | 0 (0.0%) |
| 35 to 64 Years | 175 (20.4%) | 26 (3.3%) |
| 65 to 74 Years | 0 (0.0%) | 0 (0.0%) |
| 75 Years and over | 13 (12.9%) | 0 (0.0%) |
Technology Access in Randleman
Computing Device Access in Randleman
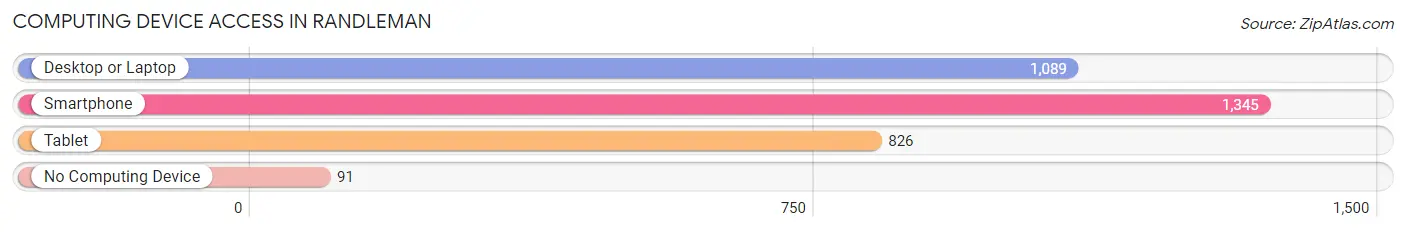
| Device Type | # Households | % Households |
| Desktop or Laptop | 1,089 | 71.5% |
| Smartphone | 1,345 | 88.3% |
| Tablet | 826 | 54.2% |
| No Computing Device | 91 | 6.0% |
| Total | 1,523 | 100.0% |
Internet Access in Randleman
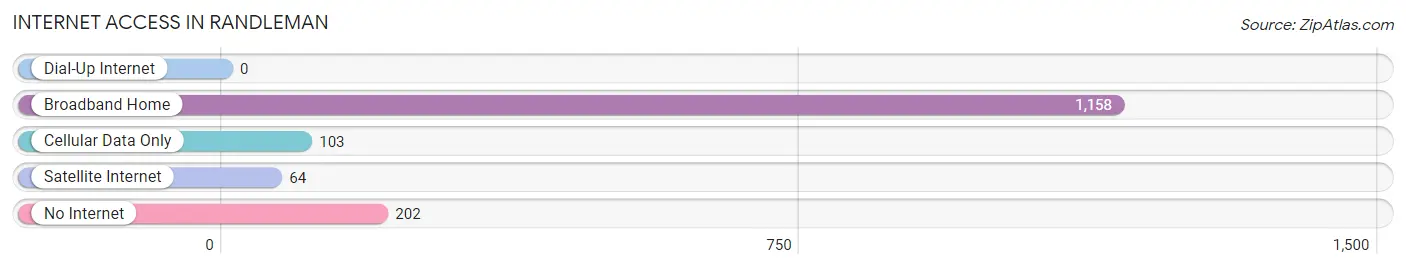
| Internet Type | # Households | % Households |
| Dial-Up Internet | 0 | 0.0% |
| Broadband Home | 1,158 | 76.0% |
| Cellular Data Only | 103 | 6.8% |
| Satellite Internet | 64 | 4.2% |
| No Internet | 202 | 13.3% |
| Total | 1,523 | 100.0% |
Randleman Summary
Randleman, North Carolina is a small town located in Randolph County in the central part of the state. It is situated in the Piedmont region of North Carolina, and is part of the Greensboro-Winston-Salem-High Point metropolitan area. The town has a population of 4,845 as of the 2010 census, and is the county seat of Randolph County.
History
Randleman was founded in 1795 by William Randleman, a Revolutionary War veteran. The town was originally known as Randleman’s Crossroads, and was a small farming community. In 1868, the town was officially incorporated as Randleman. The town grew slowly over the years, and by the early 20th century, it had become a center for the textile industry. The town was also home to several furniture factories, and was known as the “Furniture Capital of the World”.
Geography
Randleman is located in the Piedmont region of North Carolina, and is situated in the center of Randolph County. The town is located at the intersection of US Highway 220 and NC Highway 49. The town is located approximately 30 miles south of Greensboro, and is part of the Greensboro-Winston-Salem-High Point metropolitan area. The town is situated at an elevation of 845 feet above sea level.
Economy
Randleman’s economy is largely based on the furniture and textile industries. The town is home to several furniture factories, and is known as the “Furniture Capital of the World”. The town is also home to several textile mills, and is a major producer of textiles. The town is also home to several small businesses, including restaurants, retail stores, and service providers.
Demographics
As of the 2010 census, Randleman had a population of 4,845. The racial makeup of the town was 87.3% White, 8.2% African American, 0.7% Native American, 0.4% Asian, 0.1% Pacific Islander, 1.7% from other races, and 1.6% from two or more races. Hispanic or Latino of any race were 4.2% of the population. The median household income was $35,945, and the median family income was $41,944. The per capita income was $17,945.
Randleman is a small town with a rich history and a diverse economy. The town is home to several furniture and textile factories, and is a major producer of textiles. The town is also home to several small businesses, and is a popular destination for tourists. The town has a population of 4,845, and is a diverse community with a variety of racial and ethnic backgrounds.
Common Questions
What is Per Capita Income in Randleman?
Per Capita income in Randleman is $26,360.
What is the Median Family Income in Randleman?
Median Family Income in Randleman is $81,705.
What is the Median Household income in Randleman?
Median Household Income in Randleman is $63,040.
What is Income or Wage Gap in Randleman?
Income or Wage Gap in Randleman is 51.6%.
Women in Randleman earn 48.4 cents for every dollar earned by a man.
What is Inequality or Gini Index in Randleman?
Inequality or Gini Index in Randleman is 0.45.
What is the Total Population of Randleman?
Total Population of Randleman is 4,573.
What is the Total Male Population of Randleman?
Total Male Population of Randleman is 2,304.
What is the Total Female Population of Randleman?
Total Female Population of Randleman is 2,269.
What is the Ratio of Males per 100 Females in Randleman?
There are 101.54 Males per 100 Females in Randleman.
What is the Ratio of Females per 100 Males in Randleman?
There are 98.48 Females per 100 Males in Randleman.
What is the Median Population Age in Randleman?
Median Population Age in Randleman is 33.5 Years.
What is the Average Family Size in Randleman
Average Family Size in Randleman is 3.9 People.
What is the Average Household Size in Randleman
Average Household Size in Randleman is 3.0 People.
How Large is the Labor Force in Randleman?
There are 1,979 People in the Labor Forcein in Randleman.
What is the Percentage of People in the Labor Force in Randleman?
58.5% of People are in the Labor Force in Randleman.
What is the Unemployment Rate in Randleman?
Unemployment Rate in Randleman is 2.0%.