Morehead City, NC Map & Demographics
Morehead City Map
Morehead City Overview
$39,557
PER CAPITA INCOME
$84,237
AVG FAMILY INCOME
$51,716
AVG HOUSEHOLD INCOME
22.2%
WAGE / INCOME GAP [ % ]
77.8¢/ $1
WAGE / INCOME GAP [ $ ]
0.48
INEQUALITY / GINI INDEX
9,632
TOTAL POPULATION
4,446
MALE POPULATION
5,186
FEMALE POPULATION
85.73
MALES / 100 FEMALES
116.64
FEMALES / 100 MALES
46.3
MEDIAN AGE
2.7
AVG FAMILY SIZE
1.9
AVG HOUSEHOLD SIZE
4,654
LABOR FORCE [ PEOPLE ]
57.4%
PERCENT IN LABOR FORCE
3.7%
UNEMPLOYMENT RATE
Morehead City Zip Codes
Morehead City Area Codes
Income in Morehead City
Income Overview in Morehead City
Per Capita Income in Morehead City is $39,557, while median incomes of families and households are $84,237 and $51,716 respectively.
| Characteristic | Number | Measure |
| Per Capita Income | 9,632 | $39,557 |
| Median Family Income | 2,389 | $84,237 |
| Mean Family Income | 2,389 | $104,254 |
| Median Household Income | 4,961 | $51,716 |
| Mean Household Income | 4,961 | $76,683 |
| Income Deficit | 2,389 | $0 |
| Wage / Income Gap (%) | 9,632 | 22.23% |
| Wage / Income Gap ($) | 9,632 | 77.77¢ per $1 |
| Gini / Inequality Index | 9,632 | 0.48 |
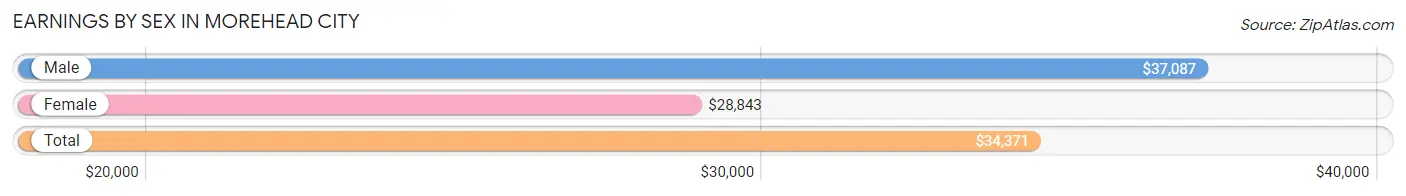
Earnings by Sex in Morehead City
Average Earnings in Morehead City are $34,371, $37,087 for men and $28,843 for women, a difference of 22.2%.
| Sex | Number | Average Earnings |
| Male | 2,413 (49.2%) | $37,087 |
| Female | 2,488 (50.8%) | $28,843 |
| Total | 4,901 (100.0%) | $34,371 |
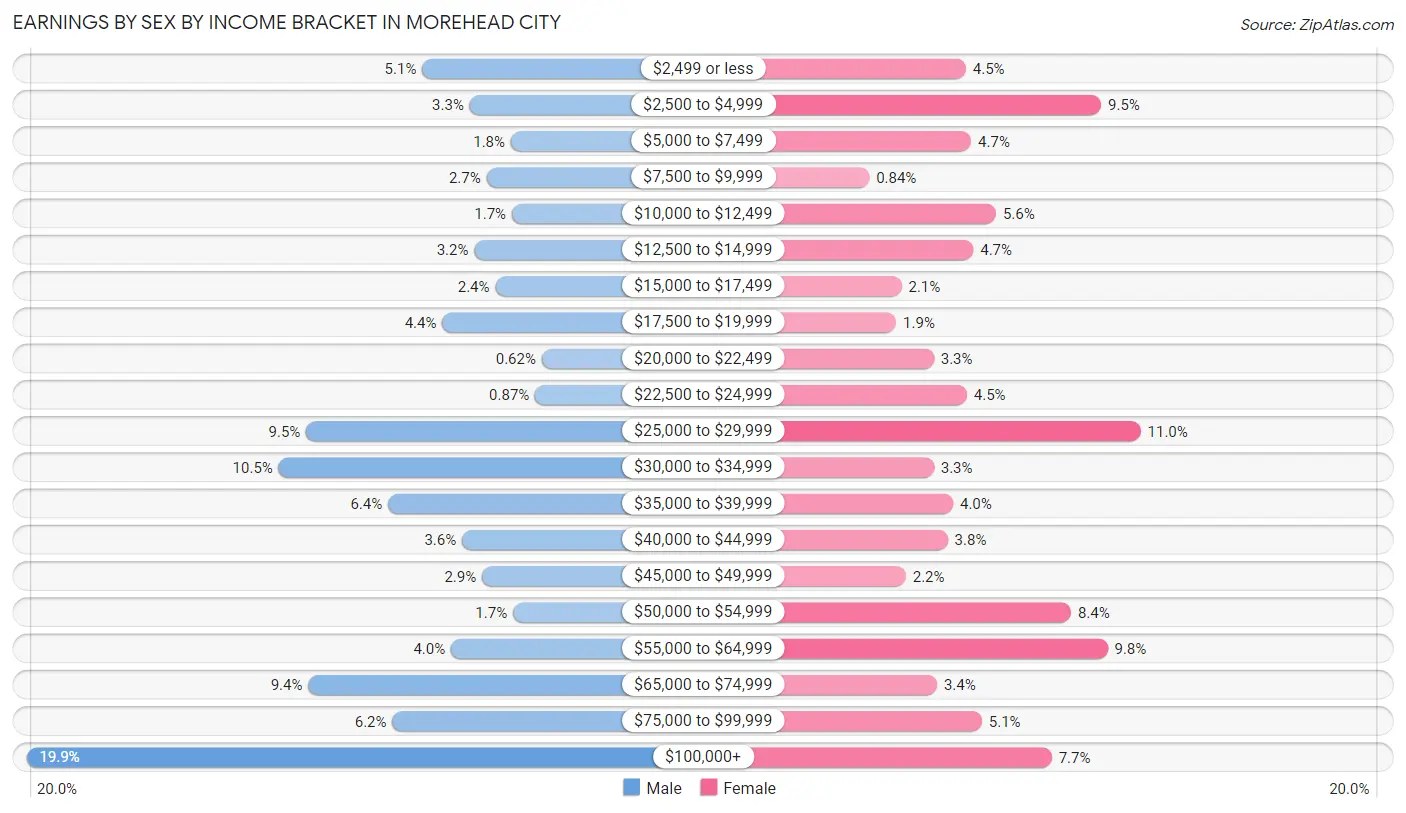
Earnings by Sex by Income Bracket in Morehead City
The most common earnings brackets in Morehead City are $100,000+ for men (481 | 19.9%) and $25,000 to $29,999 for women (274 | 11.0%).
| Income | Male | Female |
| $2,499 or less | 123 (5.1%) | 111 (4.5%) |
| $2,500 to $4,999 | 80 (3.3%) | 237 (9.5%) |
| $5,000 to $7,499 | 43 (1.8%) | 116 (4.7%) |
| $7,500 to $9,999 | 65 (2.7%) | 21 (0.8%) |
| $10,000 to $12,499 | 42 (1.7%) | 139 (5.6%) |
| $12,500 to $14,999 | 76 (3.2%) | 118 (4.7%) |
| $15,000 to $17,499 | 57 (2.4%) | 51 (2.1%) |
| $17,500 to $19,999 | 105 (4.3%) | 46 (1.8%) |
| $20,000 to $22,499 | 15 (0.6%) | 81 (3.3%) |
| $22,500 to $24,999 | 21 (0.9%) | 112 (4.5%) |
| $25,000 to $29,999 | 228 (9.5%) | 274 (11.0%) |
| $30,000 to $34,999 | 253 (10.5%) | 81 (3.3%) |
| $35,000 to $39,999 | 154 (6.4%) | 99 (4.0%) |
| $40,000 to $44,999 | 87 (3.6%) | 94 (3.8%) |
| $45,000 to $49,999 | 69 (2.9%) | 55 (2.2%) |
| $50,000 to $54,999 | 41 (1.7%) | 209 (8.4%) |
| $55,000 to $64,999 | 97 (4.0%) | 243 (9.8%) |
| $65,000 to $74,999 | 226 (9.4%) | 84 (3.4%) |
| $75,000 to $99,999 | 150 (6.2%) | 126 (5.1%) |
| $100,000+ | 481 (19.9%) | 191 (7.7%) |
| Total | 2,413 (100.0%) | 2,488 (100.0%) |
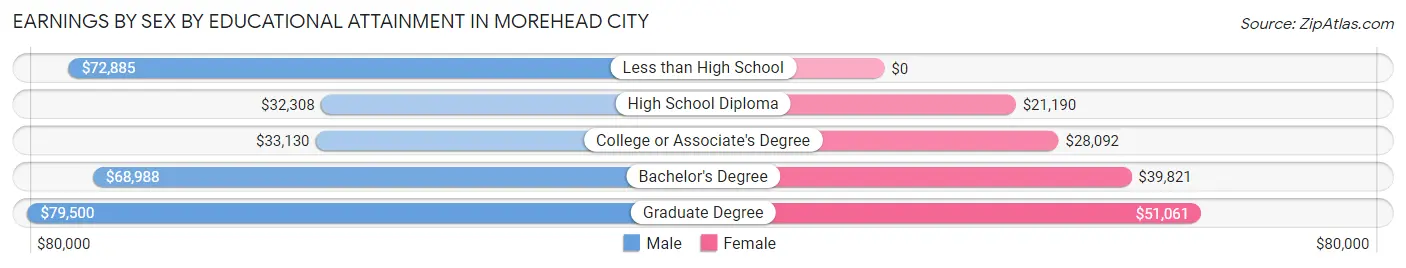
Earnings by Sex by Educational Attainment in Morehead City
Average earnings in Morehead City are $42,399 for men and $31,385 for women, a difference of 26.0%. Men with an educational attainment of graduate degree enjoy the highest average annual earnings of $79,500, while those with high school diploma education earn the least with $32,308. Women with an educational attainment of graduate degree earn the most with the average annual earnings of $51,061, while those with high school diploma education have the smallest earnings of $21,190.
| Educational Attainment | Male Income | Female Income |
| Less than High School | $72,885 | $0 |
| High School Diploma | $32,308 | $21,190 |
| College or Associate's Degree | $33,130 | $28,092 |
| Bachelor's Degree | $68,988 | $39,821 |
| Graduate Degree | $79,500 | $51,061 |
| Total | $42,399 | $31,385 |
Family Income in Morehead City
Family Income Brackets in Morehead City
According to the Morehead City family income data, there are 504 families falling into the $100,000 to $149,999 income range, which is the most common income bracket and makes up 21.1% of all families. Conversely, the less than $10,000 income bracket is the least frequent group with only 76 families (3.2%) belonging to this category.
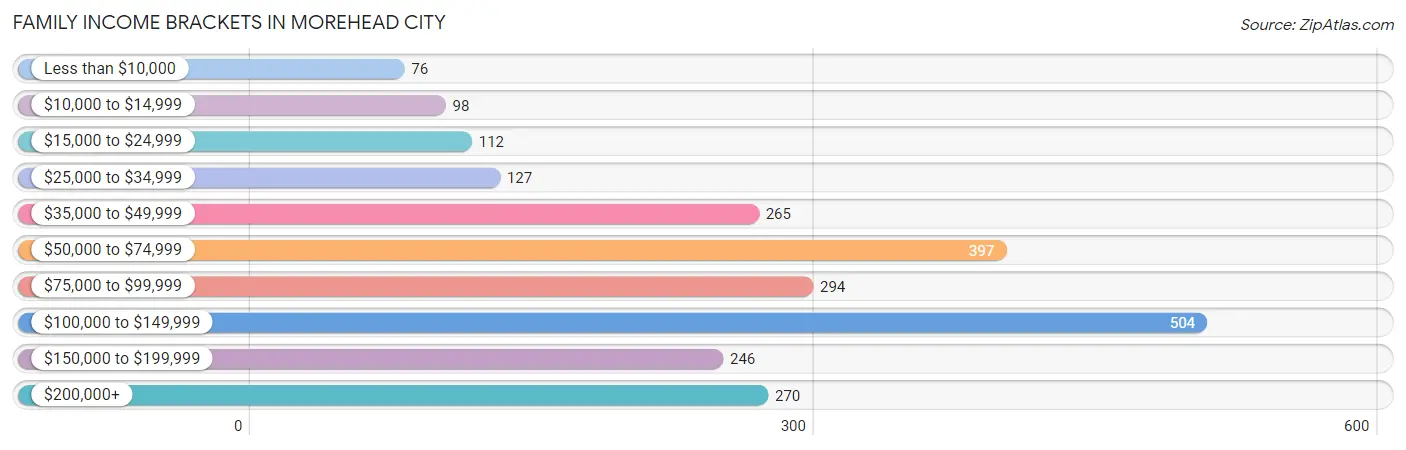
| Income Bracket | # Families | % Families |
| Less than $10,000 | 76 | 3.2% |
| $10,000 to $14,999 | 98 | 4.1% |
| $15,000 to $24,999 | 112 | 4.7% |
| $25,000 to $34,999 | 127 | 5.3% |
| $35,000 to $49,999 | 265 | 11.1% |
| $50,000 to $74,999 | 397 | 16.6% |
| $75,000 to $99,999 | 294 | 12.3% |
| $100,000 to $149,999 | 504 | 21.1% |
| $150,000 to $199,999 | 246 | 10.3% |
| $200,000+ | 270 | 11.3% |
Family Income by Famaliy Size in Morehead City
5-person families (56 | 2.3%) account for the highest median family income in Morehead City with $171,818 per family, while 2-person families (1,275 | 53.4%) have the highest median income of $42,470 per family member.
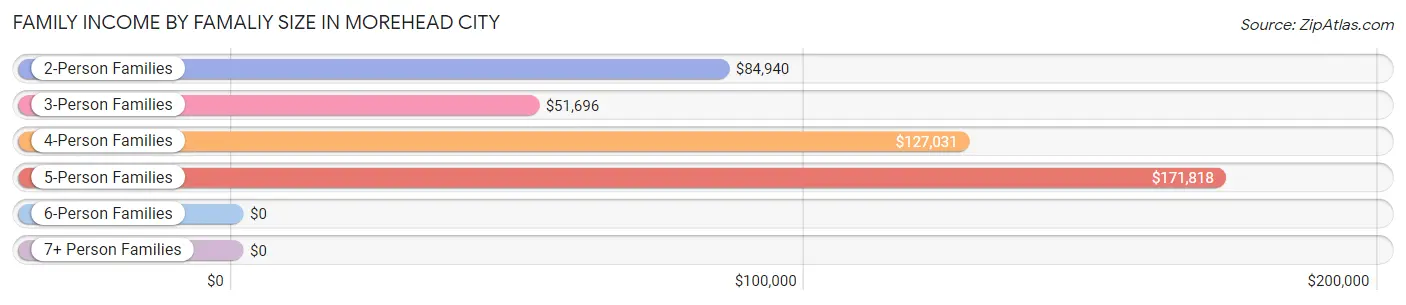
| Income Bracket | # Families | Median Income |
| 2-Person Families | 1,275 (53.4%) | $84,940 |
| 3-Person Families | 733 (30.7%) | $51,696 |
| 4-Person Families | 300 (12.6%) | $127,031 |
| 5-Person Families | 56 (2.3%) | $171,818 |
| 6-Person Families | 18 (0.7%) | $0 |
| 7+ Person Families | 7 (0.3%) | $0 |
| Total | 2,389 (100.0%) | $84,237 |
Family Income by Number of Earners in Morehead City
The median family income in Morehead City is $84,237, with families comprising 3+ earners (82) having the highest median family income of $141,250, while families with no earners (439) have the lowest median family income of $48,750, accounting for 3.4% and 18.4% of families, respectively.
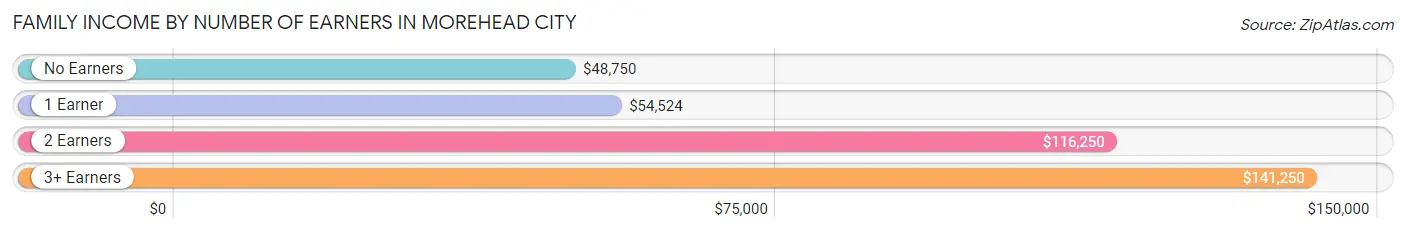
| Number of Earners | # Families | Median Income |
| No Earners | 439 (18.4%) | $48,750 |
| 1 Earner | 916 (38.3%) | $54,524 |
| 2 Earners | 952 (39.9%) | $116,250 |
| 3+ Earners | 82 (3.4%) | $141,250 |
| Total | 2,389 (100.0%) | $84,237 |
Household Income in Morehead City
Household Income Brackets in Morehead City
With 848 households falling in the category, the $50,000 to $74,999 income range is the most frequent in Morehead City, accounting for 17.1% of all households. In contrast, only 218 households (4.4%) fall into the $10,000 to $14,999 income bracket, making it the least populous group.
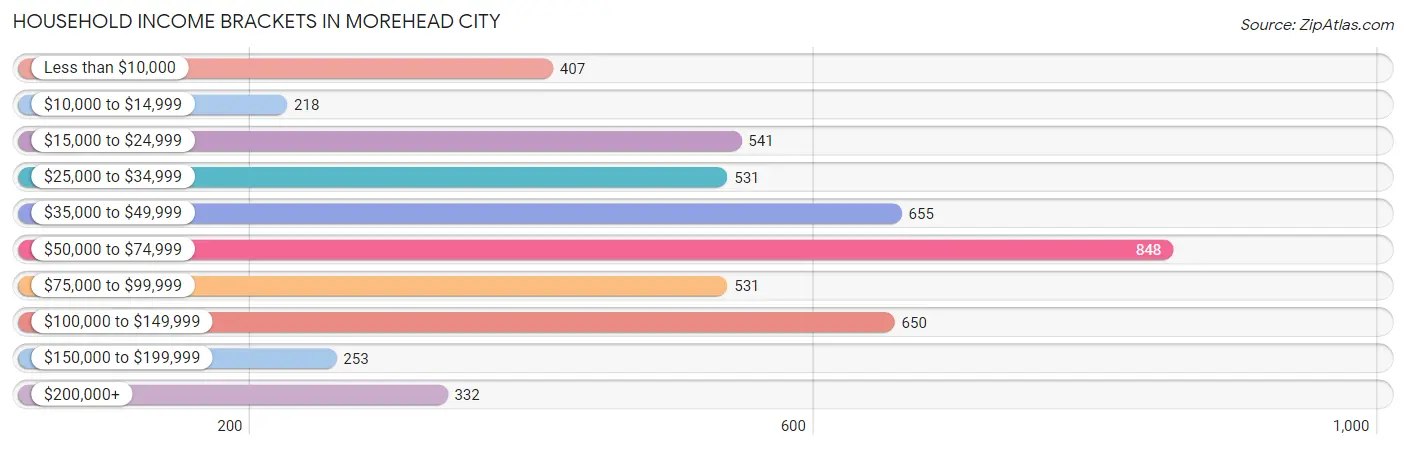
| Income Bracket | # Households | % Households |
| Less than $10,000 | 407 | 8.2% |
| $10,000 to $14,999 | 218 | 4.4% |
| $15,000 to $24,999 | 541 | 10.9% |
| $25,000 to $34,999 | 531 | 10.7% |
| $35,000 to $49,999 | 655 | 13.2% |
| $50,000 to $74,999 | 848 | 17.1% |
| $75,000 to $99,999 | 531 | 10.7% |
| $100,000 to $149,999 | 650 | 13.1% |
| $150,000 to $199,999 | 253 | 5.1% |
| $200,000+ | 332 | 6.7% |
Household Income by Householder Age in Morehead City
The median household income in Morehead City is $51,716, with the highest median household income of $65,504 found in the 45 to 64 years age bracket for the primary householder. A total of 1,837 households (37.0%) fall into this category. Meanwhile, the 15 to 24 years age bracket for the primary householder has the lowest median household income of $31,325, with 359 households (7.2%) in this group.
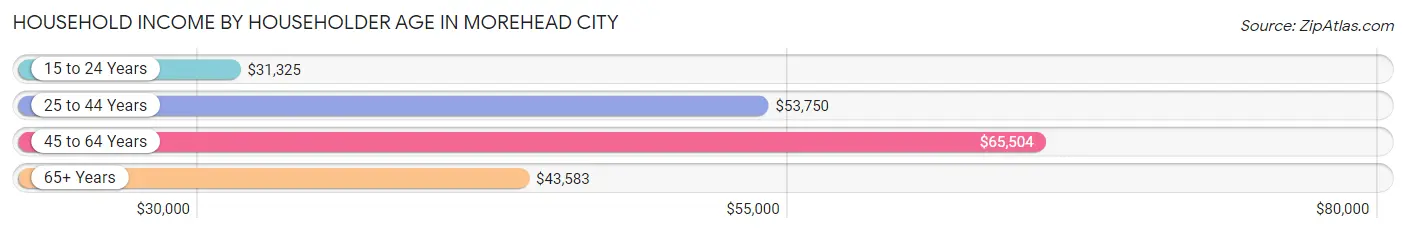
| Income Bracket | # Households | Median Income |
| 15 to 24 Years | 359 (7.2%) | $31,325 |
| 25 to 44 Years | 1,193 (24.0%) | $53,750 |
| 45 to 64 Years | 1,837 (37.0%) | $65,504 |
| 65+ Years | 1,572 (31.7%) | $43,583 |
| Total | 4,961 (100.0%) | $51,716 |
Poverty in Morehead City
Income Below Poverty by Sex and Age in Morehead City
With 9.0% poverty level for males and 20.9% for females among the residents of Morehead City, 5 year old males and 5 year old females are the most vulnerable to poverty, with 37 males (37.4%) and 44 females (86.3%) in their respective age groups living below the poverty level.
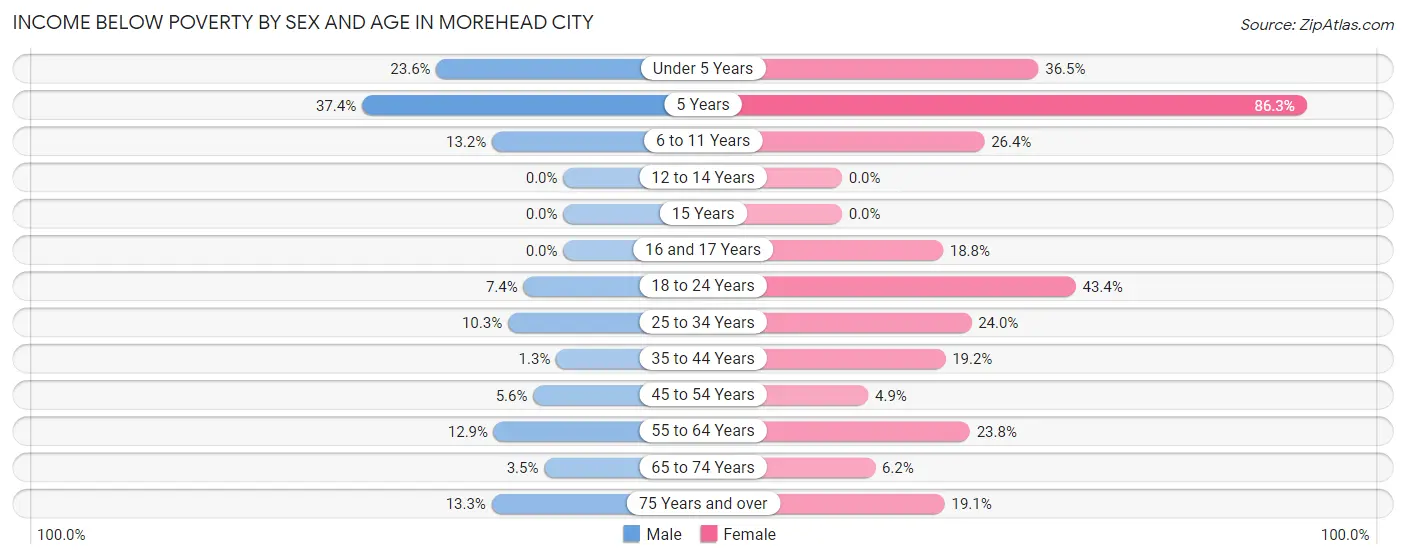
| Age Bracket | Male | Female |
| Under 5 Years | 45 (23.6%) | 93 (36.5%) |
| 5 Years | 37 (37.4%) | 44 (86.3%) |
| 6 to 11 Years | 32 (13.2%) | 88 (26.4%) |
| 12 to 14 Years | 0 (0.0%) | 0 (0.0%) |
| 15 Years | 0 (0.0%) | 0 (0.0%) |
| 16 and 17 Years | 0 (0.0%) | 6 (18.8%) |
| 18 to 24 Years | 17 (7.4%) | 197 (43.4%) |
| 25 to 34 Years | 63 (10.3%) | 159 (24.0%) |
| 35 to 44 Years | 6 (1.3%) | 90 (19.2%) |
| 45 to 54 Years | 34 (5.6%) | 31 (4.9%) |
| 55 to 64 Years | 92 (12.9%) | 190 (23.7%) |
| 65 to 74 Years | 19 (3.5%) | 38 (6.1%) |
| 75 Years and over | 50 (13.3%) | 119 (19.1%) |
| Total | 395 (9.0%) | 1,055 (20.9%) |
Income Above Poverty by Sex and Age in Morehead City
According to the poverty statistics in Morehead City, males aged 12 to 14 years and females aged 12 to 14 years are the age groups that are most secure financially, with 100.0% of males and 100.0% of females in these age groups living above the poverty line.
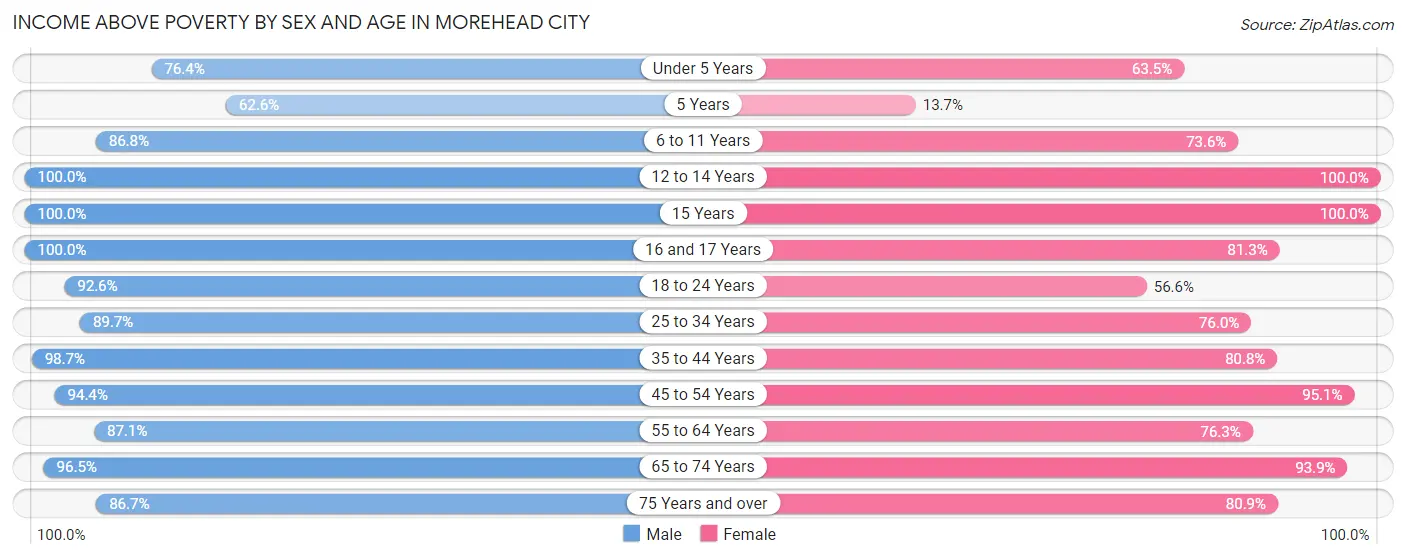
| Age Bracket | Male | Female |
| Under 5 Years | 146 (76.4%) | 162 (63.5%) |
| 5 Years | 62 (62.6%) | 7 (13.7%) |
| 6 to 11 Years | 210 (86.8%) | 245 (73.6%) |
| 12 to 14 Years | 212 (100.0%) | 76 (100.0%) |
| 15 Years | 9 (100.0%) | 27 (100.0%) |
| 16 and 17 Years | 121 (100.0%) | 26 (81.2%) |
| 18 to 24 Years | 213 (92.6%) | 257 (56.6%) |
| 25 to 34 Years | 550 (89.7%) | 503 (76.0%) |
| 35 to 44 Years | 447 (98.7%) | 379 (80.8%) |
| 45 to 54 Years | 575 (94.4%) | 604 (95.1%) |
| 55 to 64 Years | 621 (87.1%) | 610 (76.2%) |
| 65 to 74 Years | 517 (96.5%) | 580 (93.9%) |
| 75 Years and over | 326 (86.7%) | 505 (80.9%) |
| Total | 4,009 (91.0%) | 3,981 (79.0%) |
Income Below Poverty Among Married-Couple Families in Morehead City
The poverty statistics for married-couple families in Morehead City show that 4.4% or 70 of the total 1,588 families live below the poverty line. Families with no children have the highest poverty rate of 6.2%, comprising of 58 families. On the other hand, families with 3 or 4 children have the lowest poverty rate of 0.0%, which includes 0 families.
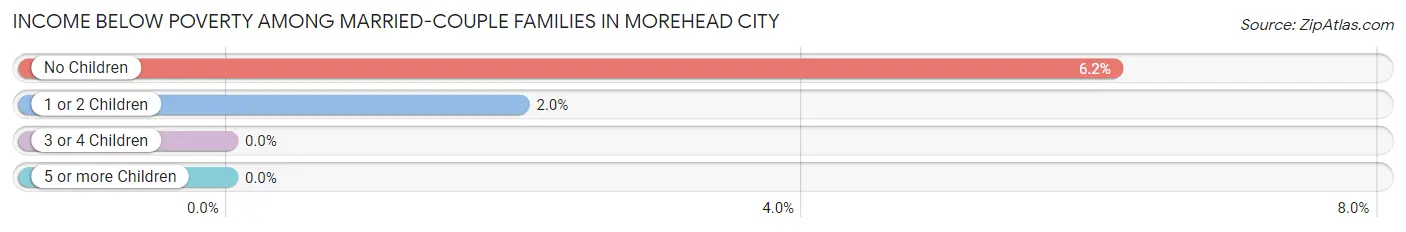
| Children | Above Poverty | Below Poverty |
| No Children | 883 (93.8%) | 58 (6.2%) |
| 1 or 2 Children | 578 (98.0%) | 12 (2.0%) |
| 3 or 4 Children | 57 (100.0%) | 0 (0.0%) |
| 5 or more Children | 0 (0.0%) | 0 (0.0%) |
| Total | 1,518 (95.6%) | 70 (4.4%) |
Income Below Poverty Among Single-Parent Households in Morehead City
According to the poverty data in Morehead City, 4.1% or 6 single-father households and 31.9% or 209 single-mother households are living below the poverty line. Among single-father households, those with 1 or 2 children have the highest poverty rate, with 6 households (20.7%) experiencing poverty. Likewise, among single-mother households, those with 3 or 4 children have the highest poverty rate, with 7 households (100.0%) falling below the poverty line.
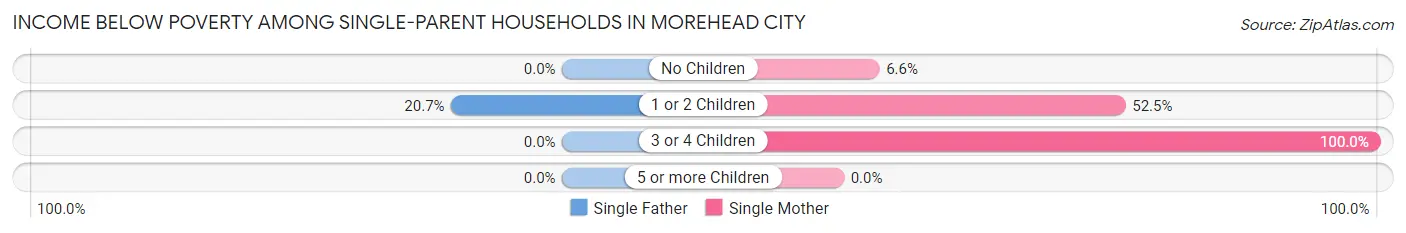
| Children | Single Father | Single Mother |
| No Children | 0 (0.0%) | 20 (6.6%) |
| 1 or 2 Children | 6 (20.7%) | 182 (52.4%) |
| 3 or 4 Children | 0 (0.0%) | 7 (100.0%) |
| 5 or more Children | 0 (0.0%) | 0 (0.0%) |
| Total | 6 (4.1%) | 209 (31.9%) |
Income Below Poverty Among Married-Couple vs Single-Parent Households in Morehead City
The poverty data for Morehead City shows that 70 of the married-couple family households (4.4%) and 215 of the single-parent households (26.8%) are living below the poverty level. Within the married-couple family households, those with no children have the highest poverty rate, with 58 households (6.2%) falling below the poverty line. Among the single-parent households, those with 3 or 4 children have the highest poverty rate, with 7 household (100.0%) living below poverty.
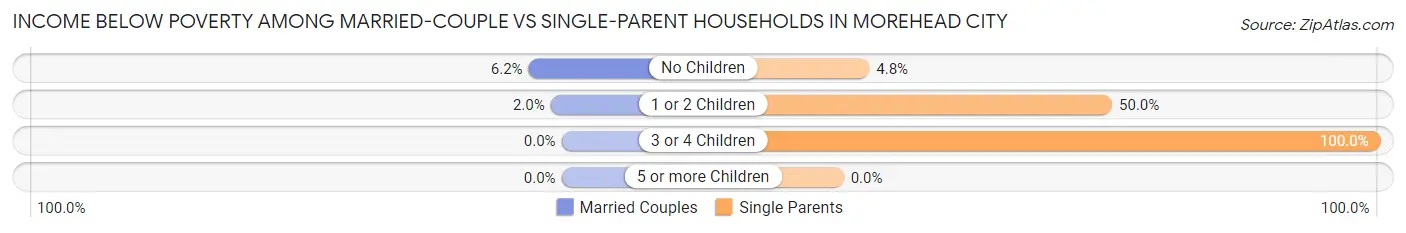
| Children | Married-Couple Families | Single-Parent Households |
| No Children | 58 (6.2%) | 20 (4.8%) |
| 1 or 2 Children | 12 (2.0%) | 188 (50.0%) |
| 3 or 4 Children | 0 (0.0%) | 7 (100.0%) |
| 5 or more Children | 0 (0.0%) | 0 (0.0%) |
| Total | 70 (4.4%) | 215 (26.8%) |
Race in Morehead City
The most populous races in Morehead City are White / Caucasian (7,923 | 82.3%), Two or more Races (731 | 7.6%), and Hispanic or Latino (676 | 7.0%).
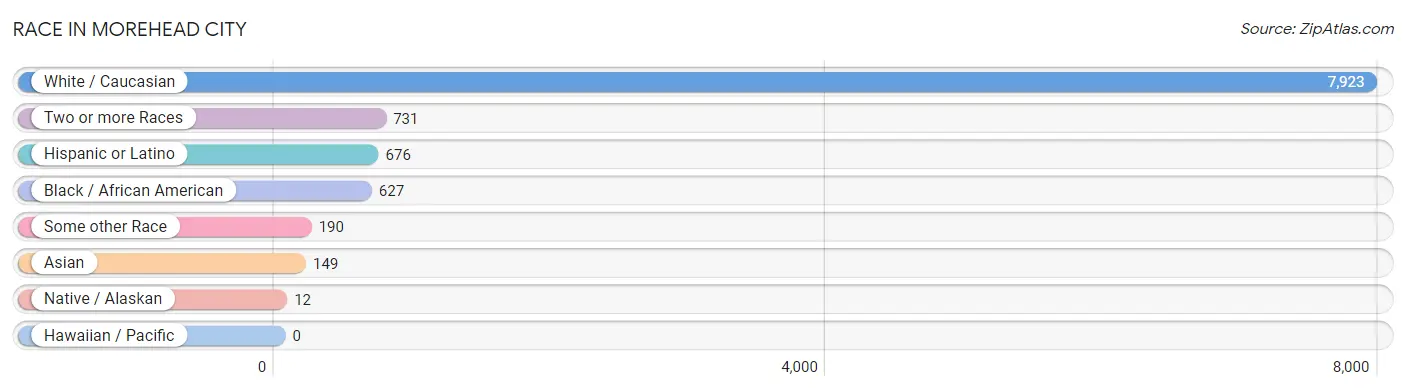
| Race | # Population | % Population |
| Asian | 149 | 1.5% |
| Black / African American | 627 | 6.5% |
| Hawaiian / Pacific | 0 | 0.0% |
| Hispanic or Latino | 676 | 7.0% |
| Native / Alaskan | 12 | 0.1% |
| White / Caucasian | 7,923 | 82.3% |
| Two or more Races | 731 | 7.6% |
| Some other Race | 190 | 2.0% |
| Total | 9,632 | 100.0% |
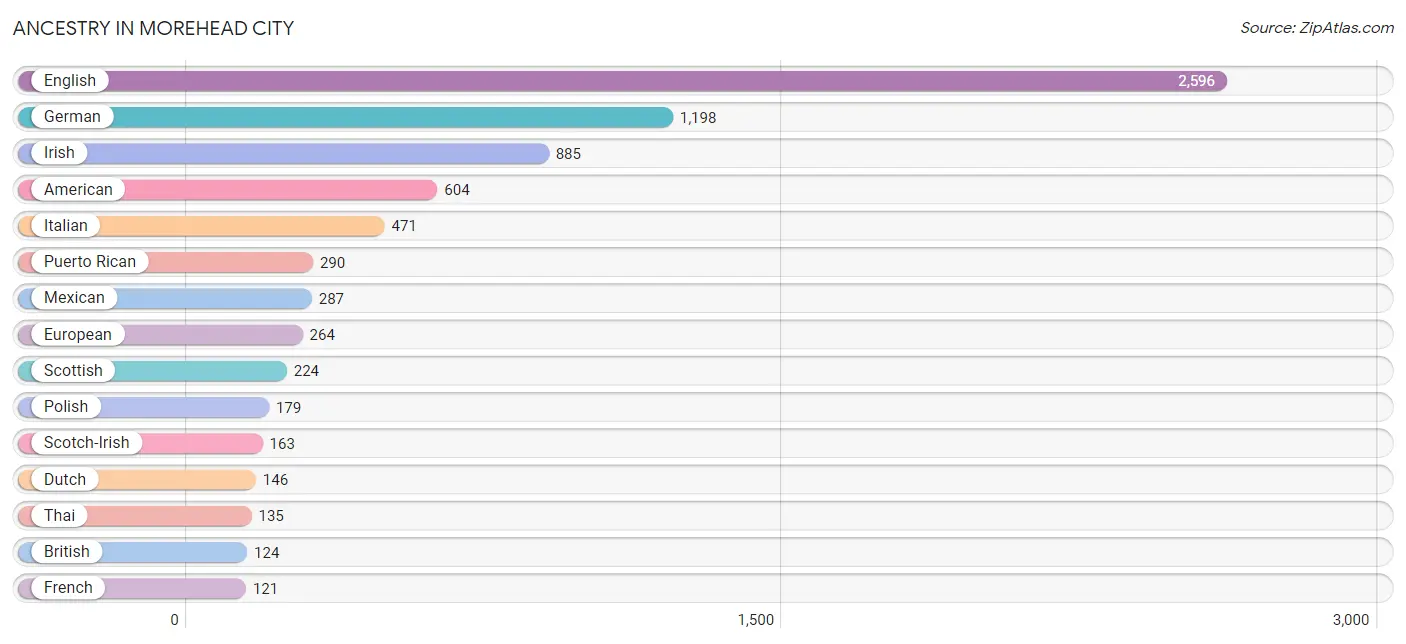
Ancestry in Morehead City
The most populous ancestries reported in Morehead City are English (2,596 | 27.0%), German (1,198 | 12.4%), Irish (885 | 9.2%), American (604 | 6.3%), and Italian (471 | 4.9%), together accounting for 59.7% of all Morehead City residents.
| Ancestry | # Population | % Population |
| African | 48 | 0.5% |
| American | 604 | 6.3% |
| Arab | 30 | 0.3% |
| Australian | 7 | 0.1% |
| Austrian | 46 | 0.5% |
| Basque | 6 | 0.1% |
| Belgian | 5 | 0.1% |
| Bhutanese | 4 | 0.0% |
| British | 124 | 1.3% |
| Canadian | 15 | 0.2% |
| Cherokee | 101 | 1.1% |
| Chilean | 5 | 0.1% |
| Cuban | 47 | 0.5% |
| Czech | 35 | 0.4% |
| Danish | 15 | 0.2% |
| Dutch | 146 | 1.5% |
| Eastern European | 4 | 0.0% |
| English | 2,596 | 27.0% |
| European | 264 | 2.7% |
| French | 121 | 1.3% |
| French Canadian | 15 | 0.2% |
| German | 1,198 | 12.4% |
| Greek | 23 | 0.2% |
| Hungarian | 6 | 0.1% |
| Indian (Asian) | 36 | 0.4% |
| Irish | 885 | 9.2% |
| Italian | 471 | 4.9% |
| Korean | 39 | 0.4% |
| Lebanese | 24 | 0.3% |
| Lithuanian | 7 | 0.1% |
| Lumbee | 90 | 0.9% |
| Luxembourger | 65 | 0.7% |
| Mexican | 287 | 3.0% |
| Mexican American Indian | 12 | 0.1% |
| Navajo | 22 | 0.2% |
| Northern European | 7 | 0.1% |
| Norwegian | 104 | 1.1% |
| Palestinian | 6 | 0.1% |
| Peruvian | 13 | 0.1% |
| Polish | 179 | 1.9% |
| Puerto Rican | 290 | 3.0% |
| Romanian | 8 | 0.1% |
| Russian | 60 | 0.6% |
| Scandinavian | 28 | 0.3% |
| Scotch-Irish | 163 | 1.7% |
| Scottish | 224 | 2.3% |
| Serbian | 4 | 0.0% |
| Slovene | 9 | 0.1% |
| South American | 23 | 0.2% |
| Spanish | 29 | 0.3% |
| Subsaharan African | 62 | 0.6% |
| Swedish | 26 | 0.3% |
| Thai | 135 | 1.4% |
| Trinidadian and Tobagonian | 18 | 0.2% |
| Tsimshian | 22 | 0.2% |
| Ugandan | 14 | 0.2% |
| Ukrainian | 4 | 0.0% |
| Uruguayan | 5 | 0.1% |
| Welsh | 38 | 0.4% |
| West Indian | 8 | 0.1% |
| Yugoslavian | 2 | 0.0% | View All 61 Rows |
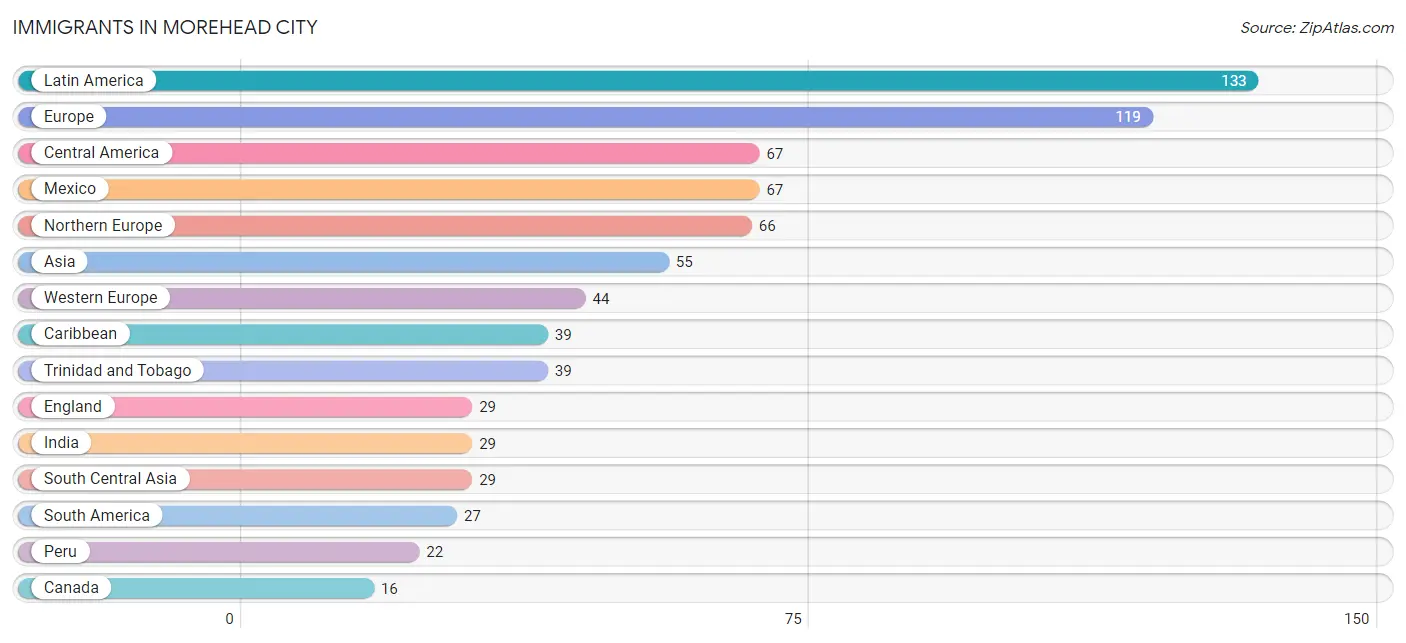
Immigrants in Morehead City
The most numerous immigrant groups reported in Morehead City came from Latin America (133 | 1.4%), Europe (119 | 1.2%), Central America (67 | 0.7%), Mexico (67 | 0.7%), and Northern Europe (66 | 0.7%), together accounting for 4.7% of all Morehead City residents.
| Immigration Origin | # Population | % Population |
| Africa | 14 | 0.2% |
| Asia | 55 | 0.6% |
| Canada | 16 | 0.2% |
| Caribbean | 39 | 0.4% |
| Central America | 67 | 0.7% |
| Eastern Africa | 14 | 0.2% |
| Eastern Asia | 6 | 0.1% |
| England | 29 | 0.3% |
| Europe | 119 | 1.2% |
| Germany | 14 | 0.2% |
| Greece | 9 | 0.1% |
| India | 29 | 0.3% |
| Israel | 5 | 0.1% |
| Japan | 6 | 0.1% |
| Latin America | 133 | 1.4% |
| Mexico | 67 | 0.7% |
| Northern Europe | 66 | 0.7% |
| Peru | 22 | 0.2% |
| Philippines | 15 | 0.2% |
| South America | 27 | 0.3% |
| South Central Asia | 29 | 0.3% |
| South Eastern Asia | 15 | 0.2% |
| Southern Europe | 9 | 0.1% |
| Trinidad and Tobago | 39 | 0.4% |
| Uganda | 14 | 0.2% |
| Uruguay | 5 | 0.1% |
| Western Asia | 5 | 0.1% |
| Western Europe | 44 | 0.5% | View All 28 Rows |
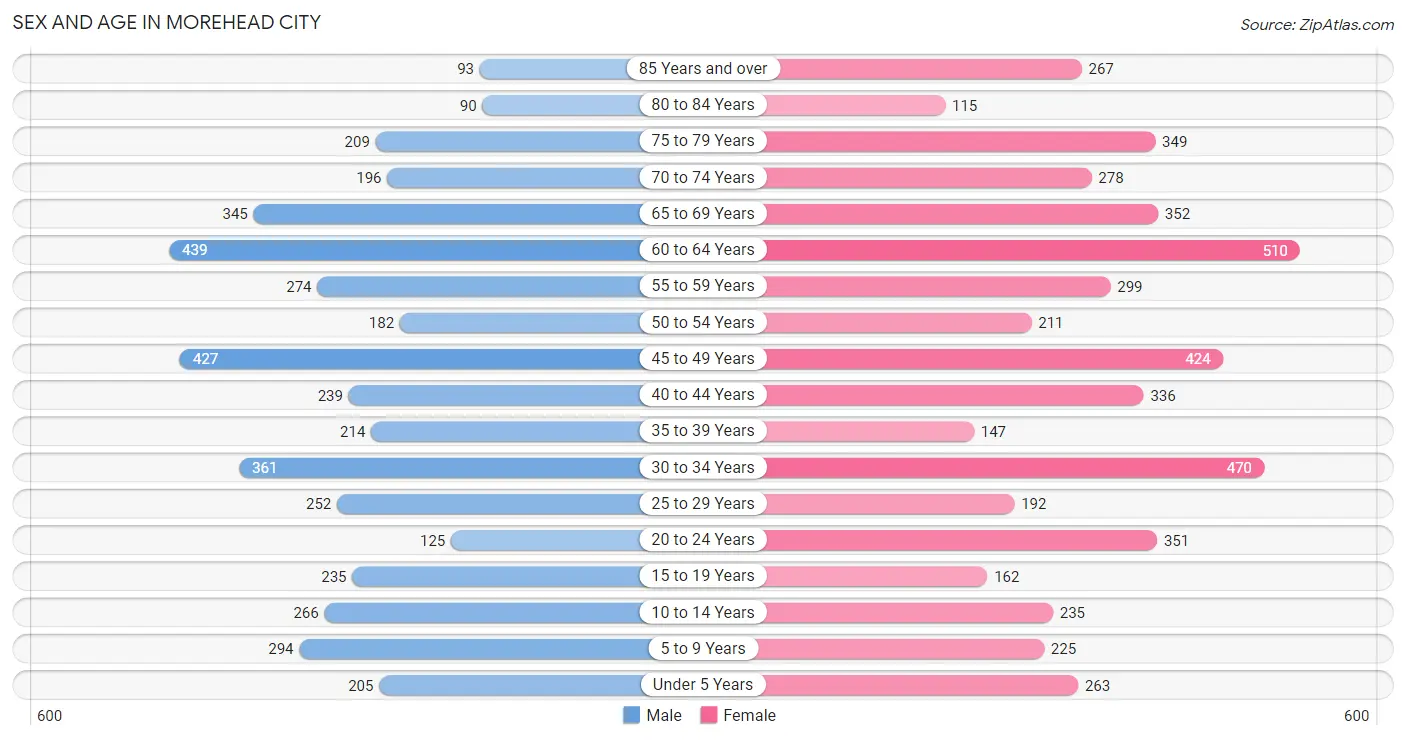
Sex and Age in Morehead City
Sex and Age in Morehead City
The most populous age groups in Morehead City are 60 to 64 Years (439 | 9.9%) for men and 60 to 64 Years (510 | 9.8%) for women.
| Age Bracket | Male | Female |
| Under 5 Years | 205 (4.6%) | 263 (5.1%) |
| 5 to 9 Years | 294 (6.6%) | 225 (4.3%) |
| 10 to 14 Years | 266 (6.0%) | 235 (4.5%) |
| 15 to 19 Years | 235 (5.3%) | 162 (3.1%) |
| 20 to 24 Years | 125 (2.8%) | 351 (6.8%) |
| 25 to 29 Years | 252 (5.7%) | 192 (3.7%) |
| 30 to 34 Years | 361 (8.1%) | 470 (9.1%) |
| 35 to 39 Years | 214 (4.8%) | 147 (2.8%) |
| 40 to 44 Years | 239 (5.4%) | 336 (6.5%) |
| 45 to 49 Years | 427 (9.6%) | 424 (8.2%) |
| 50 to 54 Years | 182 (4.1%) | 211 (4.1%) |
| 55 to 59 Years | 274 (6.2%) | 299 (5.8%) |
| 60 to 64 Years | 439 (9.9%) | 510 (9.8%) |
| 65 to 69 Years | 345 (7.8%) | 352 (6.8%) |
| 70 to 74 Years | 196 (4.4%) | 278 (5.4%) |
| 75 to 79 Years | 209 (4.7%) | 349 (6.7%) |
| 80 to 84 Years | 90 (2.0%) | 115 (2.2%) |
| 85 Years and over | 93 (2.1%) | 267 (5.1%) |
| Total | 4,446 (100.0%) | 5,186 (100.0%) |
Families and Households in Morehead City
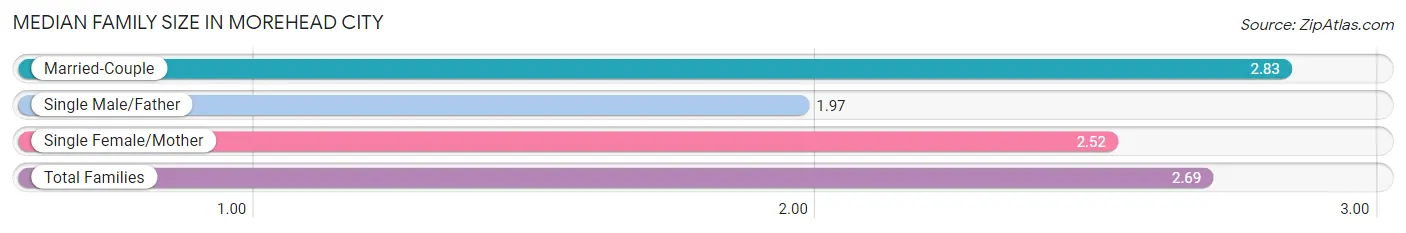
Median Family Size in Morehead City
The median family size in Morehead City is 2.69 persons per family, with married-couple families (1,588 | 66.5%) accounting for the largest median family size of 2.83 persons per family. On the other hand, single male/father families (145 | 6.1%) represent the smallest median family size with 1.97 persons per family.
| Family Type | # Families | Family Size |
| Married-Couple | 1,588 (66.5%) | 2.83 |
| Single Male/Father | 145 (6.1%) | 1.97 |
| Single Female/Mother | 656 (27.5%) | 2.52 |
| Total Families | 2,389 (100.0%) | 2.69 |
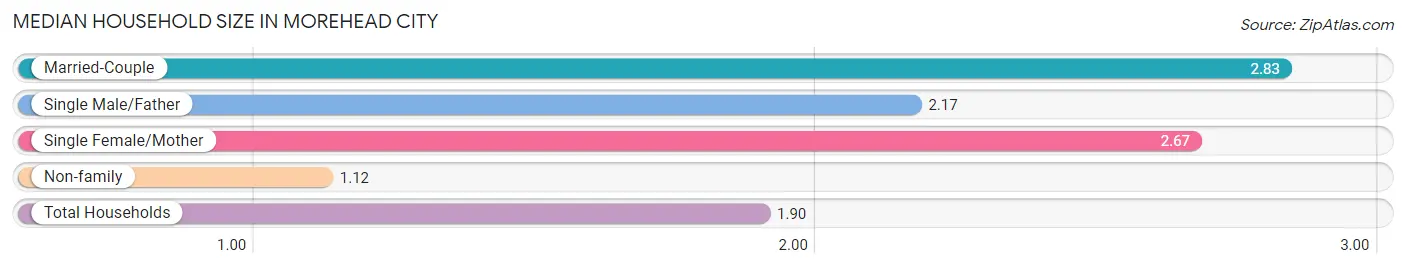
Median Household Size in Morehead City
The median household size in Morehead City is 1.90 persons per household, with married-couple households (1,588 | 32.0%) accounting for the largest median household size of 2.83 persons per household. non-family households (2,572 | 51.8%) represent the smallest median household size with 1.12 persons per household.
| Household Type | # Households | Household Size |
| Married-Couple | 1,588 (32.0%) | 2.83 |
| Single Male/Father | 145 (2.9%) | 2.17 |
| Single Female/Mother | 656 (13.2%) | 2.67 |
| Non-family | 2,572 (51.8%) | 1.12 |
| Total Households | 4,961 (100.0%) | 1.90 |
Household Size by Marriage Status in Morehead City
Out of a total of 4,961 households in Morehead City, 2,389 (48.2%) are family households, while 2,572 (51.8%) are nonfamily households. The most numerous type of family households are 2-person households, comprising 1,213, and the most common type of nonfamily households are 1-person households, comprising 2,199.
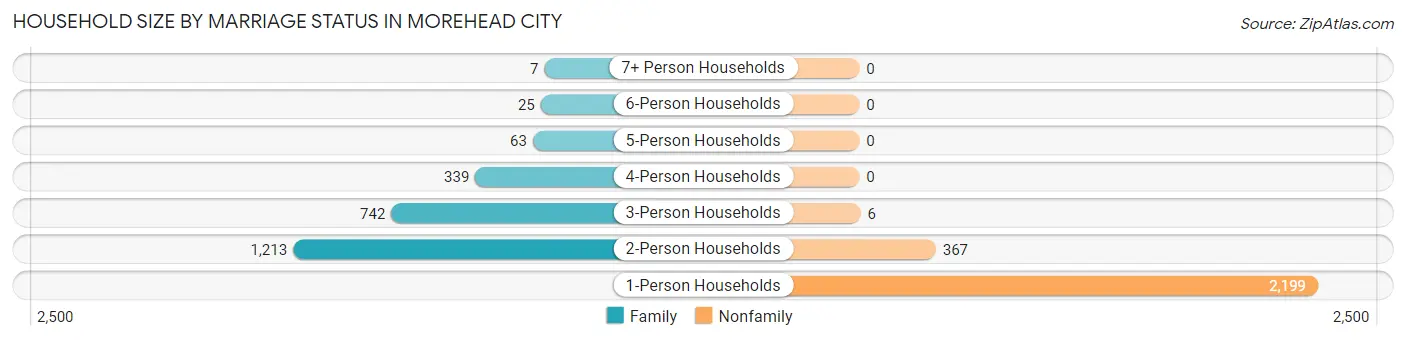
| Household Size | Family Households | Nonfamily Households |
| 1-Person Households | - | 2,199 (44.3%) |
| 2-Person Households | 1,213 (24.4%) | 367 (7.4%) |
| 3-Person Households | 742 (15.0%) | 6 (0.1%) |
| 4-Person Households | 339 (6.8%) | 0 (0.0%) |
| 5-Person Households | 63 (1.3%) | 0 (0.0%) |
| 6-Person Households | 25 (0.5%) | 0 (0.0%) |
| 7+ Person Households | 7 (0.1%) | 0 (0.0%) |
| Total | 2,389 (48.2%) | 2,572 (51.8%) |
Female Fertility in Morehead City
Fertility by Age in Morehead City
Average fertility rate in Morehead City is 68.0 births per 1,000 women. Women in the age bracket of 20 to 34 years have the highest fertility rate with 129.0 births per 1,000 women. Women in the age bracket of 20 to 34 years acount for 90.3% of all women with births.
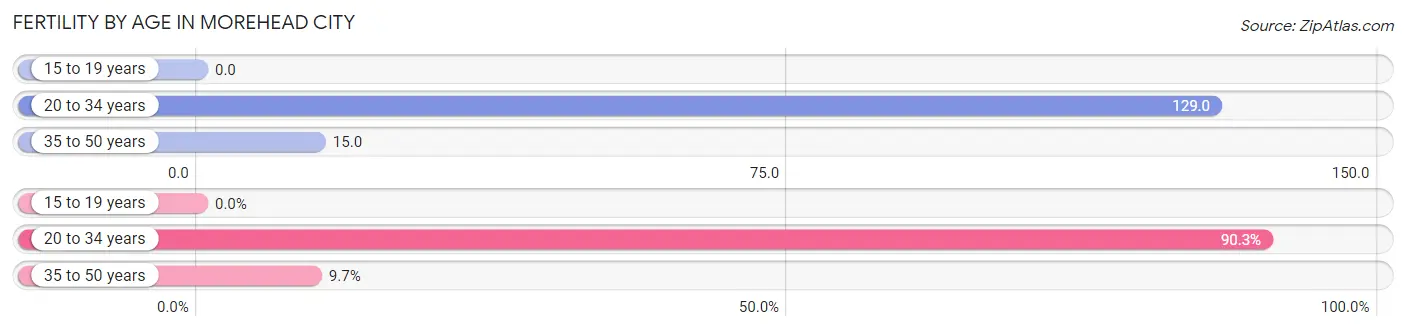
| Age Bracket | Women with Births | Births / 1,000 Women |
| 15 to 19 years | 0 (0.0%) | 0.0 |
| 20 to 34 years | 131 (90.3%) | 129.0 |
| 35 to 50 years | 14 (9.7%) | 15.0 |
| Total | 145 (100.0%) | 68.0 |
Fertility by Age by Marriage Status in Morehead City
69.0% of women with births (145) in Morehead City are married. The highest percentage of unmarried women with births falls into 35 to 50 years age bracket with 78.6% of them unmarried at the time of birth, while the lowest percentage of unmarried women with births belong to 20 to 34 years age bracket with 25.9% of them unmarried.
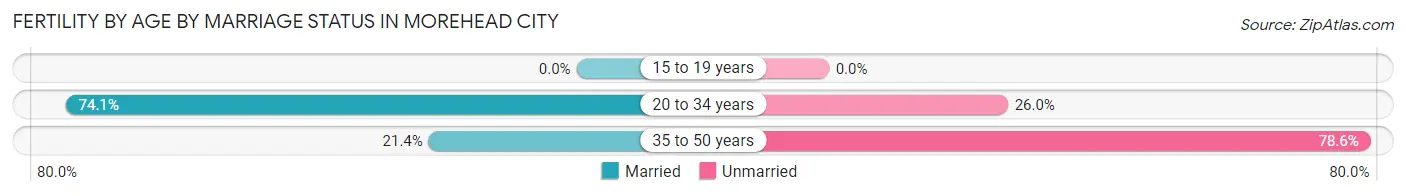
| Age Bracket | Married | Unmarried |
| 15 to 19 years | 0 (0.0%) | 0 (0.0%) |
| 20 to 34 years | 97 (74.1%) | 34 (26.0%) |
| 35 to 50 years | 3 (21.4%) | 11 (78.6%) |
| Total | 100 (69.0%) | 45 (31.0%) |
Fertility by Education in Morehead City
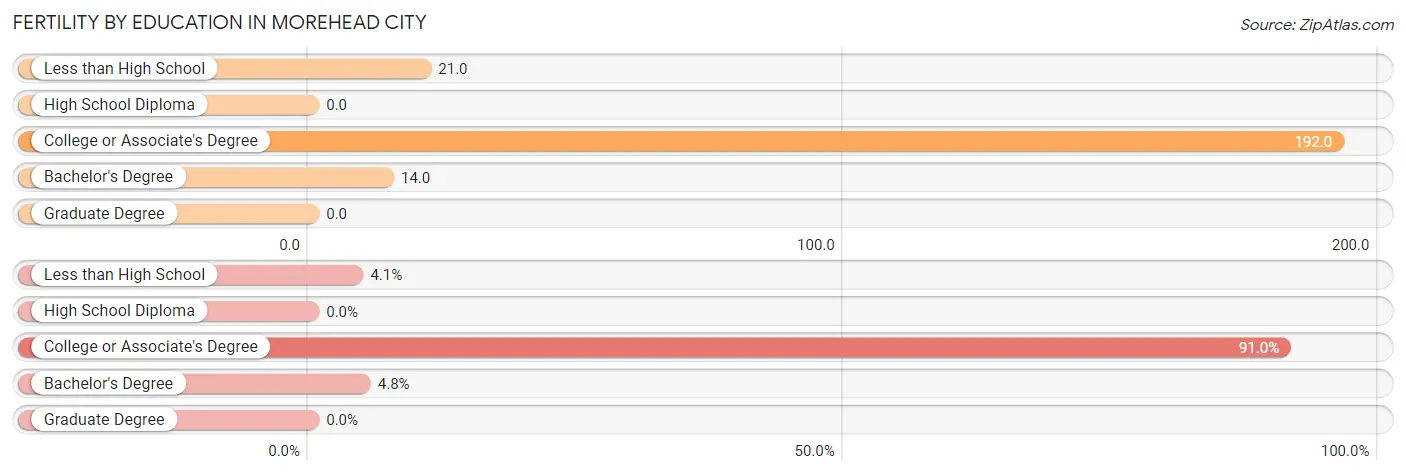
| Educational Attainment | Women with Births | Births / 1,000 Women |
| Less than High School | 6 (4.1%) | 21.0 |
| High School Diploma | 0 (0.0%) | 0.0 |
| College or Associate's Degree | 132 (91.0%) | 192.0 |
| Bachelor's Degree | 7 (4.8%) | 14.0 |
| Graduate Degree | 0 (0.0%) | 0.0 |
| Total | 145 (100.0%) | 68.0 |
Fertility by Education by Marriage Status in Morehead City
31.0% of women with births in Morehead City are unmarried. Women with the educational attainment of bachelor's degree are most likely to be married with 100.0% of them married at childbirth, while women with the educational attainment of less than high school are least likely to be married with 100.0% of them unmarried at childbirth.
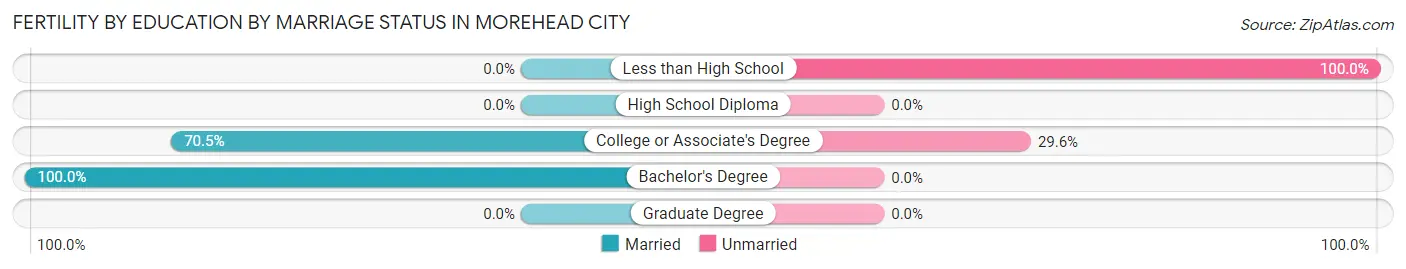
| Educational Attainment | Married | Unmarried |
| Less than High School | 0 (0.0%) | 6 (100.0%) |
| High School Diploma | 0 (0.0%) | 0 (0.0%) |
| College or Associate's Degree | 93 (70.5%) | 39 (29.5%) |
| Bachelor's Degree | 7 (100.0%) | 0 (0.0%) |
| Graduate Degree | 0 (0.0%) | 0 (0.0%) |
| Total | 100 (69.0%) | 45 (31.0%) |
Employment Characteristics in Morehead City
Employment by Class of Employer in Morehead City
Among the 4,443 employed individuals in Morehead City, private company employees (2,599 | 58.5%), federal government employees (359 | 8.1%), and not-for-profit organizations (355 | 8.0%) make up the most common classes of employment.
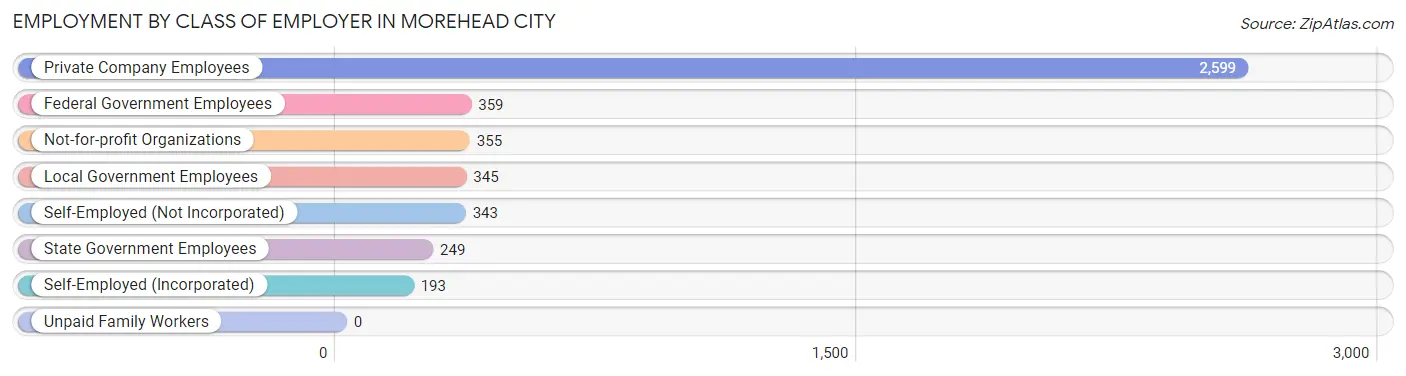
| Employer Class | # Employees | % Employees |
| Private Company Employees | 2,599 | 58.5% |
| Self-Employed (Incorporated) | 193 | 4.3% |
| Self-Employed (Not Incorporated) | 343 | 7.7% |
| Not-for-profit Organizations | 355 | 8.0% |
| Local Government Employees | 345 | 7.8% |
| State Government Employees | 249 | 5.6% |
| Federal Government Employees | 359 | 8.1% |
| Unpaid Family Workers | 0 | 0.0% |
| Total | 4,443 | 100.0% |
Employment Status by Age in Morehead City
According to the labor force statistics for Morehead City, out of the total population over 16 years of age (8,108), 57.4% or 4,654 individuals are in the labor force, with 3.7% or 172 of them unemployed. The age group with the highest labor force participation rate is 20 to 24 years, with 93.5% or 445 individuals in the labor force. Within the labor force, the 30 to 34 years age range has the highest percentage of unemployed individuals, with 8.1% or 58 of them being unemployed.
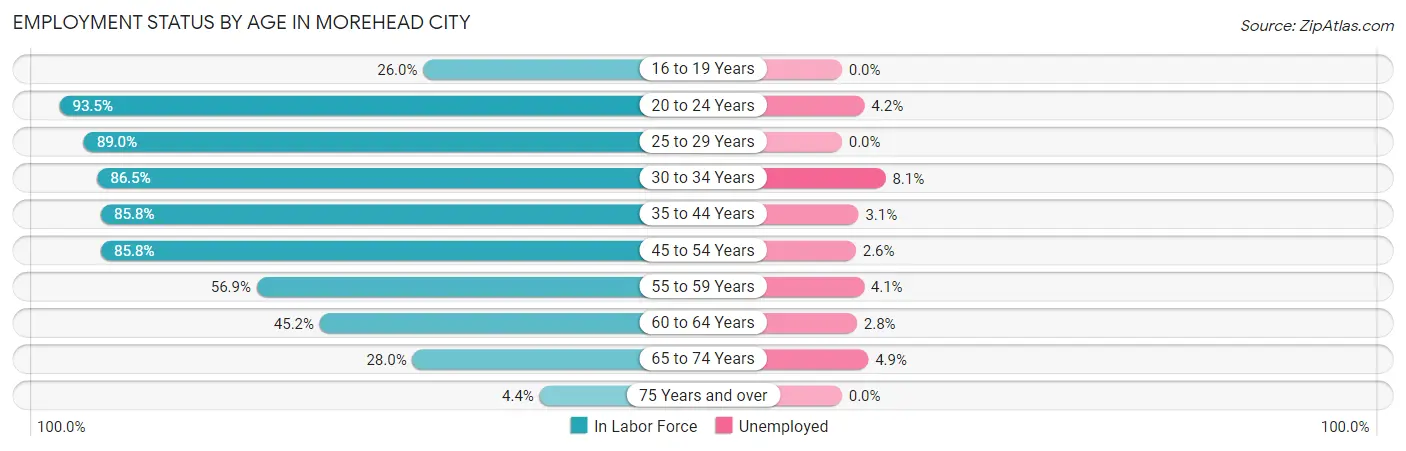
| Age Bracket | In Labor Force | Unemployed |
| 16 to 19 Years | 94 (26.0%) | 0 (0.0%) |
| 20 to 24 Years | 445 (93.5%) | 19 (4.2%) |
| 25 to 29 Years | 395 (89.0%) | 0 (0.0%) |
| 30 to 34 Years | 719 (86.5%) | 58 (8.1%) |
| 35 to 44 Years | 803 (85.8%) | 25 (3.1%) |
| 45 to 54 Years | 1,067 (85.8%) | 28 (2.6%) |
| 55 to 59 Years | 326 (56.9%) | 13 (4.1%) |
| 60 to 64 Years | 429 (45.2%) | 12 (2.8%) |
| 65 to 74 Years | 328 (28.0%) | 16 (4.9%) |
| 75 Years and over | 49 (4.4%) | 0 (0.0%) |
| Total | 4,654 (57.4%) | 172 (3.7%) |
Employment Status by Educational Attainment in Morehead City
According to labor force statistics for Morehead City, 75.1% of individuals (3,738) out of the total population between 25 and 64 years of age (4,977) are in the labor force, with 3.7% or 138 of them being unemployed. The group with the highest labor force participation rate are those with the educational attainment of bachelor's degree or higher, with 82.8% or 1,558 individuals in the labor force. Within the labor force, individuals with high school diploma education have the highest percentage of unemployment, with 6.1% or 33 of them being unemployed.
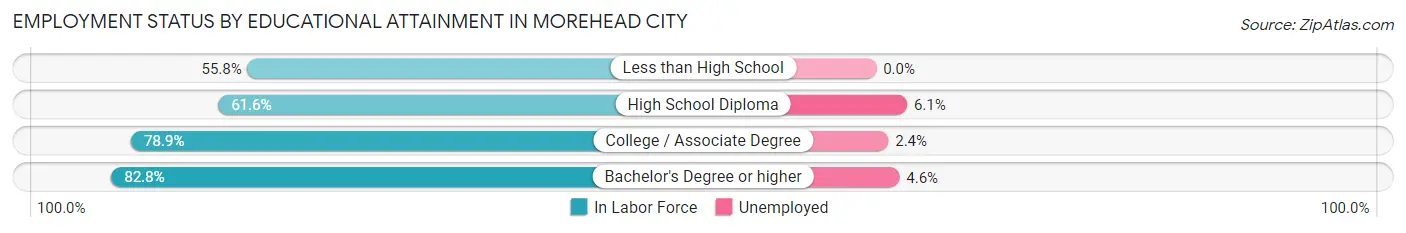
| Educational Attainment | In Labor Force | Unemployed |
| Less than High School | 268 (55.8%) | 0 (0.0%) |
| High School Diploma | 540 (61.6%) | 53 (6.1%) |
| College / Associate Degree | 1,372 (78.9%) | 42 (2.4%) |
| Bachelor's Degree or higher | 1,558 (82.8%) | 87 (4.6%) |
| Total | 3,738 (75.1%) | 184 (3.7%) |
Employment Occupations by Sex in Morehead City
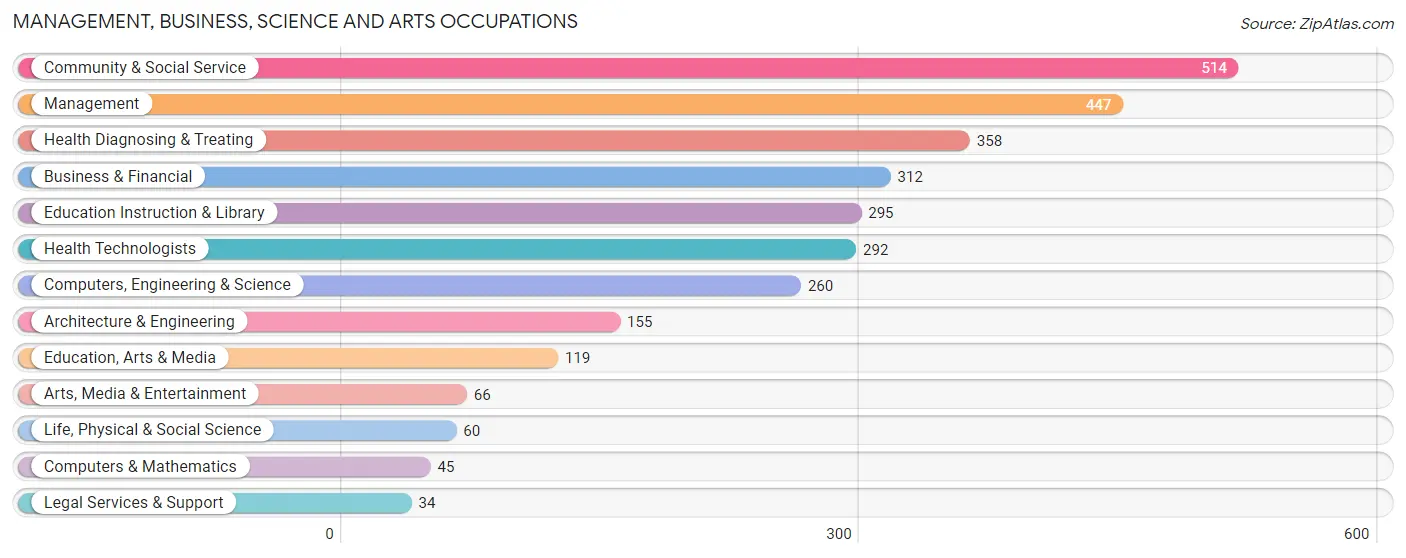
Management, Business, Science and Arts Occupations
The most common Management, Business, Science and Arts occupations in Morehead City are Community & Social Service (514 | 11.8%), Management (447 | 10.2%), Health Diagnosing & Treating (358 | 8.2%), Business & Financial (312 | 7.1%), and Education Instruction & Library (295 | 6.8%).
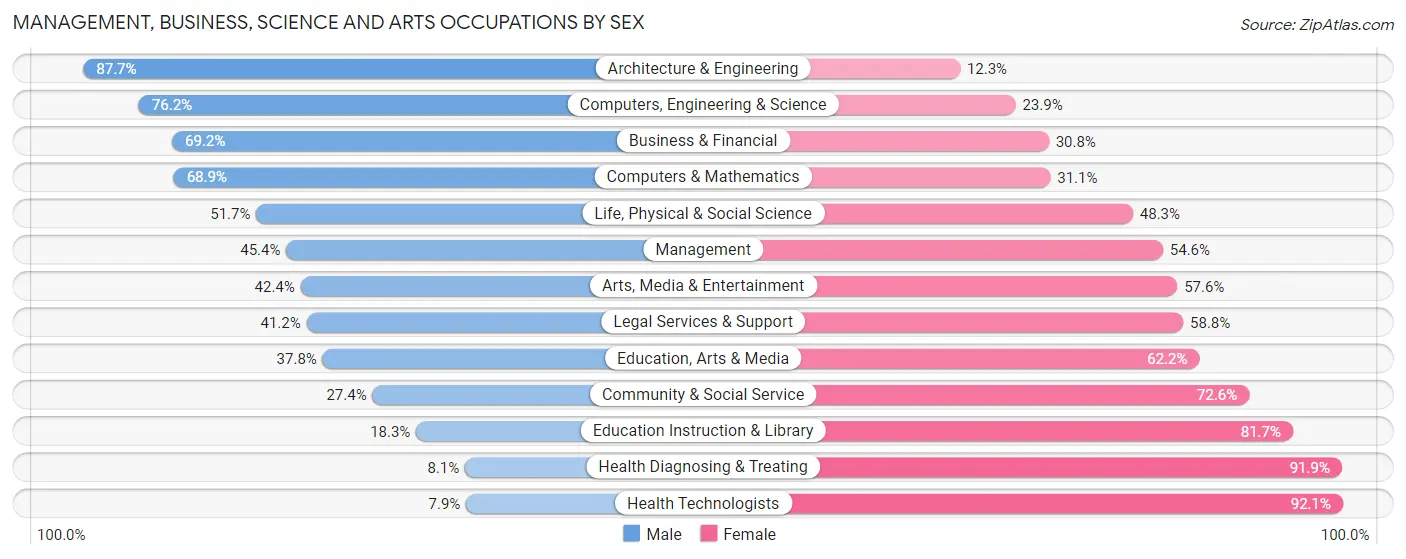
Management, Business, Science and Arts Occupations by Sex
Within the Management, Business, Science and Arts occupations in Morehead City, the most male-oriented occupations are Architecture & Engineering (87.7%), Computers, Engineering & Science (76.1%), and Business & Financial (69.2%), while the most female-oriented occupations are Health Technologists (92.1%), Health Diagnosing & Treating (91.9%), and Education Instruction & Library (81.7%).
| Occupation | Male | Female |
| Management | 203 (45.4%) | 244 (54.6%) |
| Business & Financial | 216 (69.2%) | 96 (30.8%) |
| Computers, Engineering & Science | 198 (76.1%) | 62 (23.8%) |
| Computers & Mathematics | 31 (68.9%) | 14 (31.1%) |
| Architecture & Engineering | 136 (87.7%) | 19 (12.3%) |
| Life, Physical & Social Science | 31 (51.7%) | 29 (48.3%) |
| Community & Social Service | 141 (27.4%) | 373 (72.6%) |
| Education, Arts & Media | 45 (37.8%) | 74 (62.2%) |
| Legal Services & Support | 14 (41.2%) | 20 (58.8%) |
| Education Instruction & Library | 54 (18.3%) | 241 (81.7%) |
| Arts, Media & Entertainment | 28 (42.4%) | 38 (57.6%) |
| Health Diagnosing & Treating | 29 (8.1%) | 329 (91.9%) |
| Health Technologists | 23 (7.9%) | 269 (92.1%) |
| Total (Category) | 787 (41.6%) | 1,104 (58.4%) |
| Total (Overall) | 2,102 (48.1%) | 2,270 (51.9%) |
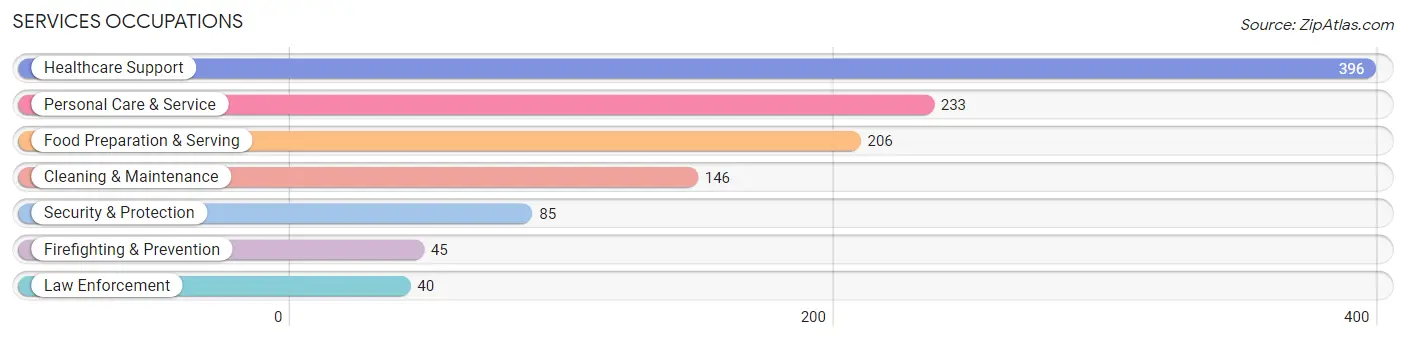
Services Occupations
The most common Services occupations in Morehead City are Healthcare Support (396 | 9.1%), Personal Care & Service (233 | 5.3%), Food Preparation & Serving (206 | 4.7%), Cleaning & Maintenance (146 | 3.3%), and Security & Protection (85 | 1.9%).
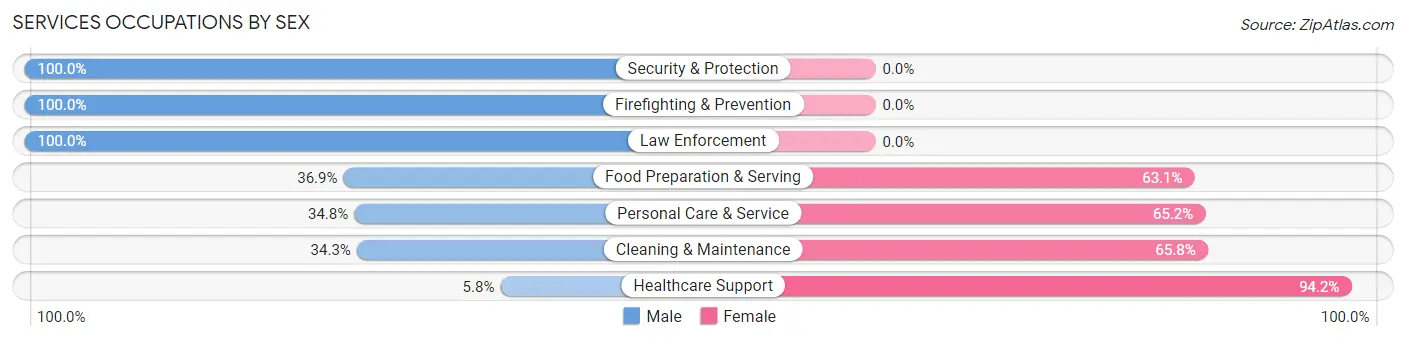
Services Occupations by Sex
Within the Services occupations in Morehead City, the most male-oriented occupations are Security & Protection (100.0%), Firefighting & Prevention (100.0%), and Law Enforcement (100.0%), while the most female-oriented occupations are Healthcare Support (94.2%), Cleaning & Maintenance (65.7%), and Personal Care & Service (65.2%).
| Occupation | Male | Female |
| Healthcare Support | 23 (5.8%) | 373 (94.2%) |
| Security & Protection | 85 (100.0%) | 0 (0.0%) |
| Firefighting & Prevention | 45 (100.0%) | 0 (0.0%) |
| Law Enforcement | 40 (100.0%) | 0 (0.0%) |
| Food Preparation & Serving | 76 (36.9%) | 130 (63.1%) |
| Cleaning & Maintenance | 50 (34.3%) | 96 (65.7%) |
| Personal Care & Service | 81 (34.8%) | 152 (65.2%) |
| Total (Category) | 315 (29.5%) | 751 (70.5%) |
| Total (Overall) | 2,102 (48.1%) | 2,270 (51.9%) |
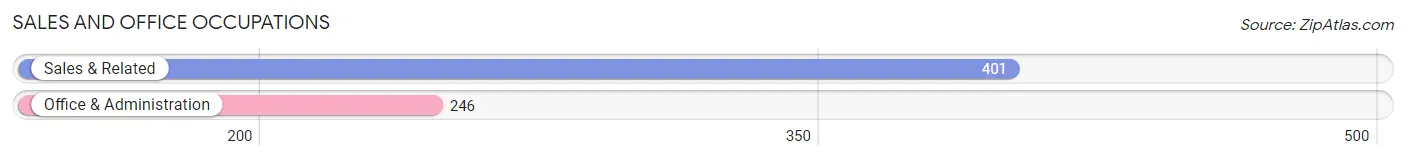
Sales and Office Occupations
The most common Sales and Office occupations in Morehead City are Sales & Related (401 | 9.2%), and Office & Administration (246 | 5.6%).
Sales and Office Occupations by Sex
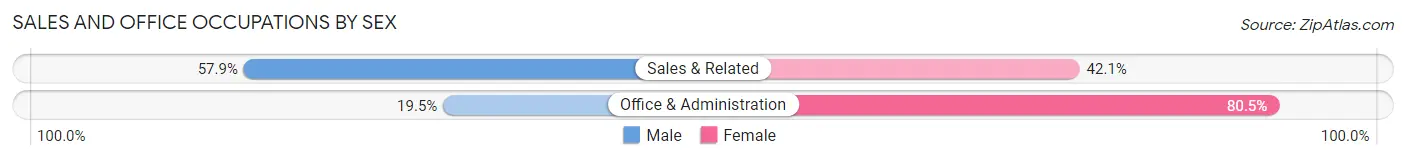
| Occupation | Male | Female |
| Sales & Related | 232 (57.9%) | 169 (42.1%) |
| Office & Administration | 48 (19.5%) | 198 (80.5%) |
| Total (Category) | 280 (43.3%) | 367 (56.7%) |
| Total (Overall) | 2,102 (48.1%) | 2,270 (51.9%) |
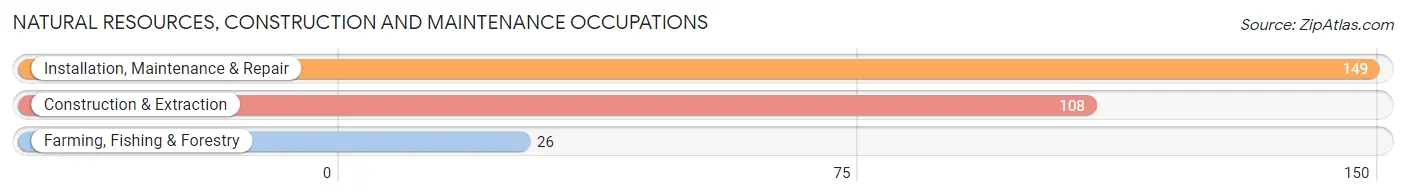
Natural Resources, Construction and Maintenance Occupations
The most common Natural Resources, Construction and Maintenance occupations in Morehead City are Installation, Maintenance & Repair (149 | 3.4%), Construction & Extraction (108 | 2.5%), and Farming, Fishing & Forestry (26 | 0.6%).
Natural Resources, Construction and Maintenance Occupations by Sex
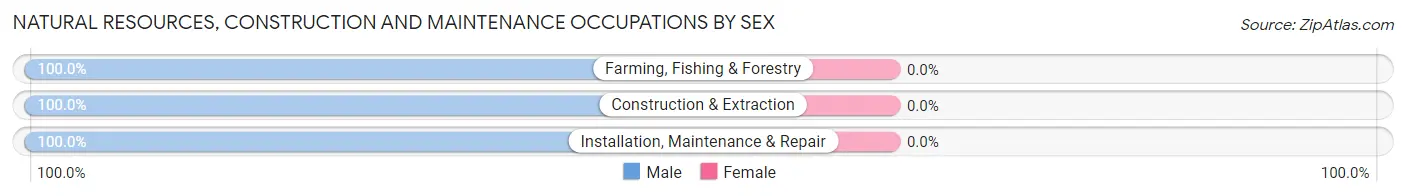
| Occupation | Male | Female |
| Farming, Fishing & Forestry | 26 (100.0%) | 0 (0.0%) |
| Construction & Extraction | 108 (100.0%) | 0 (0.0%) |
| Installation, Maintenance & Repair | 149 (100.0%) | 0 (0.0%) |
| Total (Category) | 283 (100.0%) | 0 (0.0%) |
| Total (Overall) | 2,102 (48.1%) | 2,270 (51.9%) |
Production, Transportation and Moving Occupations
The most common Production, Transportation and Moving occupations in Morehead City are Production (172 | 3.9%), Material Moving (165 | 3.8%), and Transportation (148 | 3.4%).
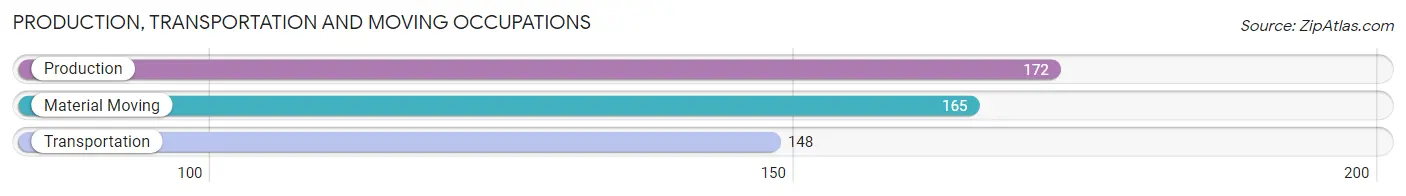
Production, Transportation and Moving Occupations by Sex
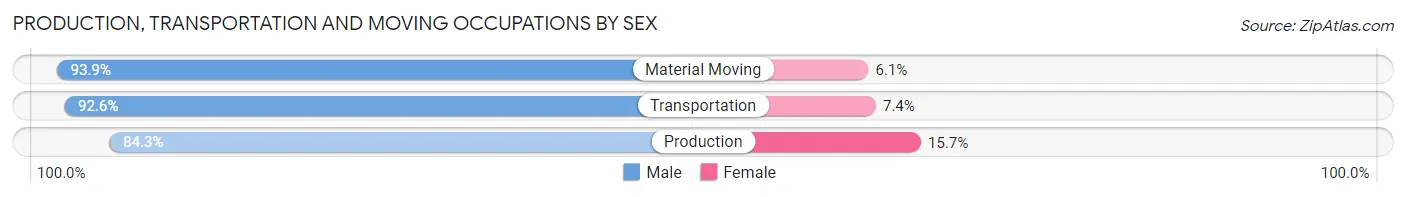
| Occupation | Male | Female |
| Production | 145 (84.3%) | 27 (15.7%) |
| Transportation | 137 (92.6%) | 11 (7.4%) |
| Material Moving | 155 (93.9%) | 10 (6.1%) |
| Total (Category) | 437 (90.1%) | 48 (9.9%) |
| Total (Overall) | 2,102 (48.1%) | 2,270 (51.9%) |
Employment Industries by Sex in Morehead City
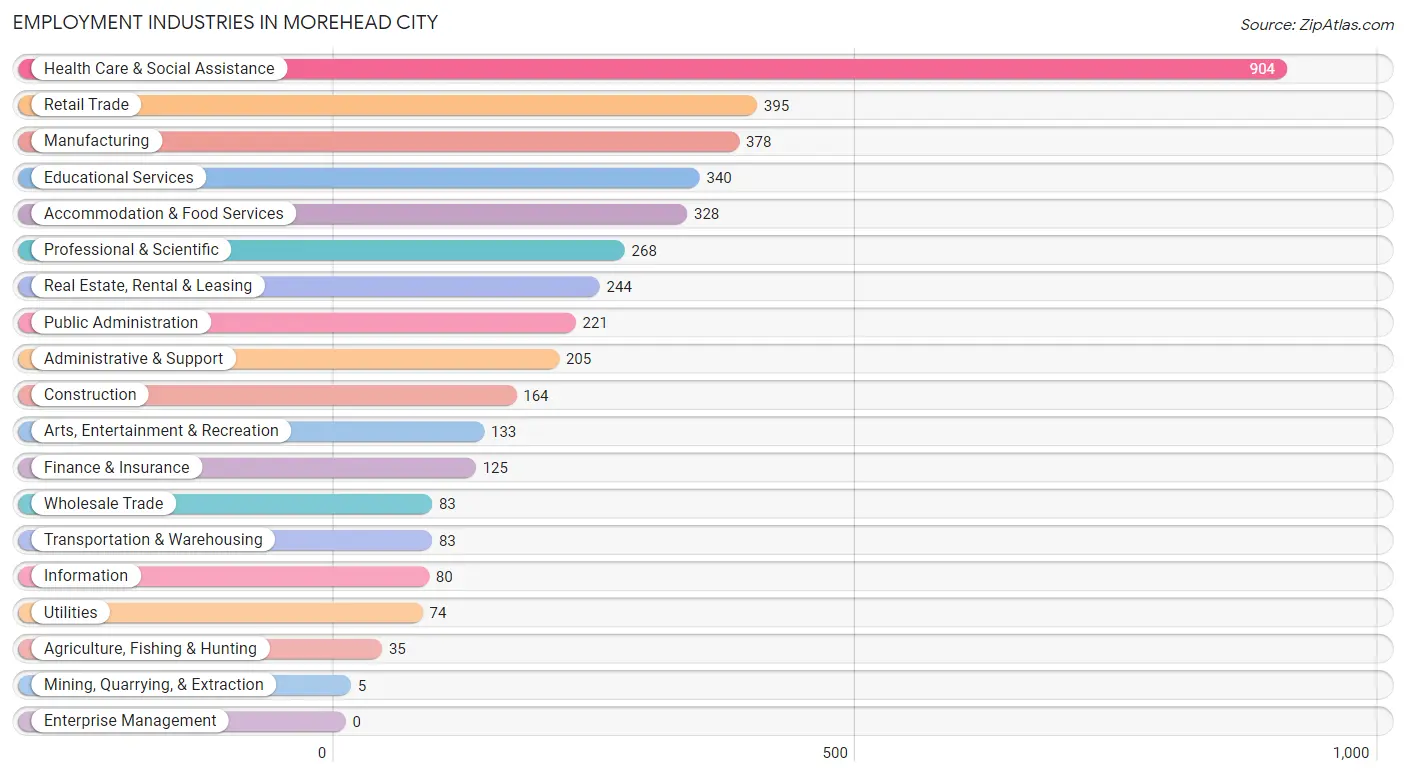
Employment Industries in Morehead City
The major employment industries in Morehead City include Health Care & Social Assistance (904 | 20.7%), Retail Trade (395 | 9.0%), Manufacturing (378 | 8.6%), Educational Services (340 | 7.8%), and Accommodation & Food Services (328 | 7.5%).
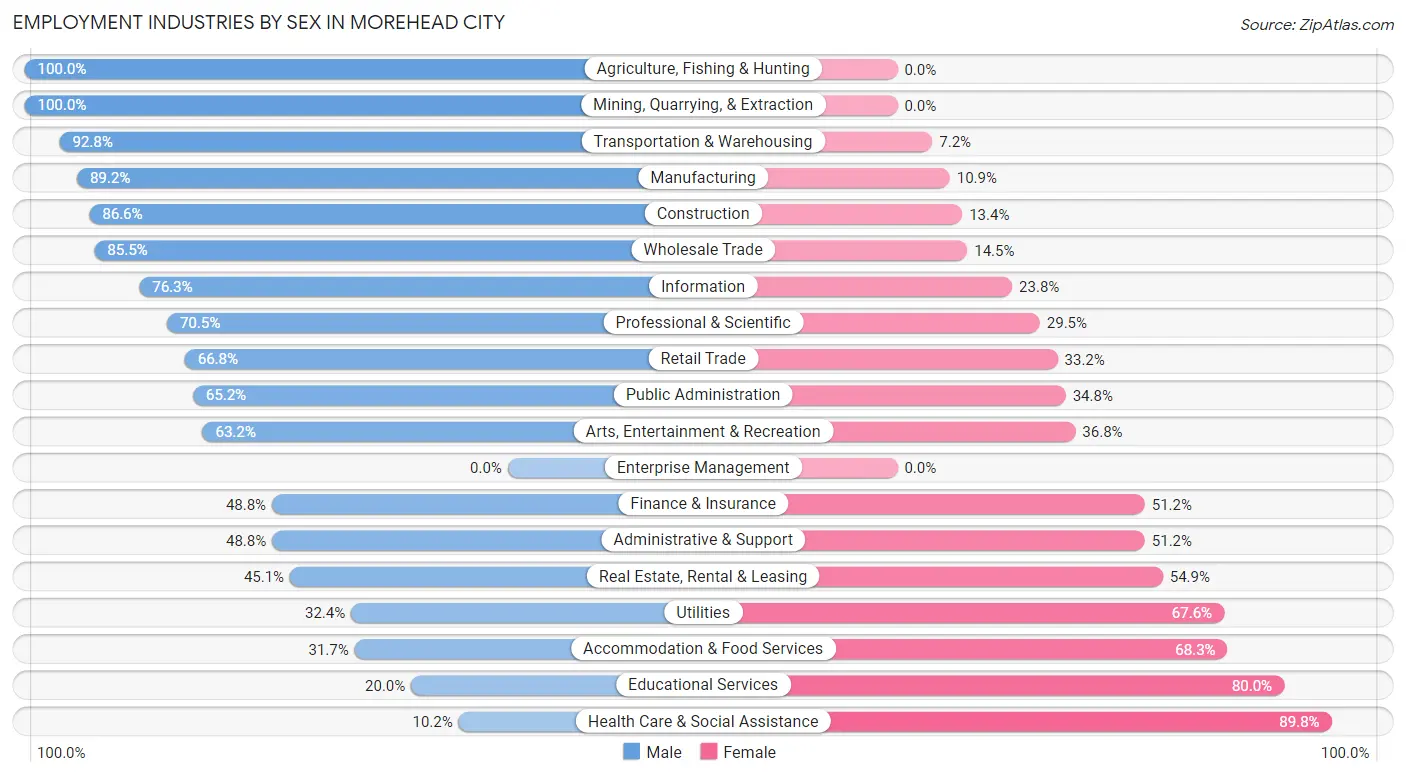
Employment Industries by Sex in Morehead City
The Morehead City industries that see more men than women are Agriculture, Fishing & Hunting (100.0%), Mining, Quarrying, & Extraction (100.0%), and Transportation & Warehousing (92.8%), whereas the industries that tend to have a higher number of women are Health Care & Social Assistance (89.8%), Educational Services (80.0%), and Accommodation & Food Services (68.3%).
| Industry | Male | Female |
| Agriculture, Fishing & Hunting | 35 (100.0%) | 0 (0.0%) |
| Mining, Quarrying, & Extraction | 5 (100.0%) | 0 (0.0%) |
| Construction | 142 (86.6%) | 22 (13.4%) |
| Manufacturing | 337 (89.1%) | 41 (10.8%) |
| Wholesale Trade | 71 (85.5%) | 12 (14.5%) |
| Retail Trade | 264 (66.8%) | 131 (33.2%) |
| Transportation & Warehousing | 77 (92.8%) | 6 (7.2%) |
| Utilities | 24 (32.4%) | 50 (67.6%) |
| Information | 61 (76.2%) | 19 (23.7%) |
| Finance & Insurance | 61 (48.8%) | 64 (51.2%) |
| Real Estate, Rental & Leasing | 110 (45.1%) | 134 (54.9%) |
| Professional & Scientific | 189 (70.5%) | 79 (29.5%) |
| Enterprise Management | 0 (0.0%) | 0 (0.0%) |
| Administrative & Support | 100 (48.8%) | 105 (51.2%) |
| Educational Services | 68 (20.0%) | 272 (80.0%) |
| Health Care & Social Assistance | 92 (10.2%) | 812 (89.8%) |
| Arts, Entertainment & Recreation | 84 (63.2%) | 49 (36.8%) |
| Accommodation & Food Services | 104 (31.7%) | 224 (68.3%) |
| Public Administration | 144 (65.2%) | 77 (34.8%) |
| Total | 2,102 (48.1%) | 2,270 (51.9%) |
Education in Morehead City
School Enrollment in Morehead City
The most common levels of schooling among the 1,760 students in Morehead City are middle school (428 | 24.3%), elementary school (359 | 20.4%), and high school (315 | 17.9%).
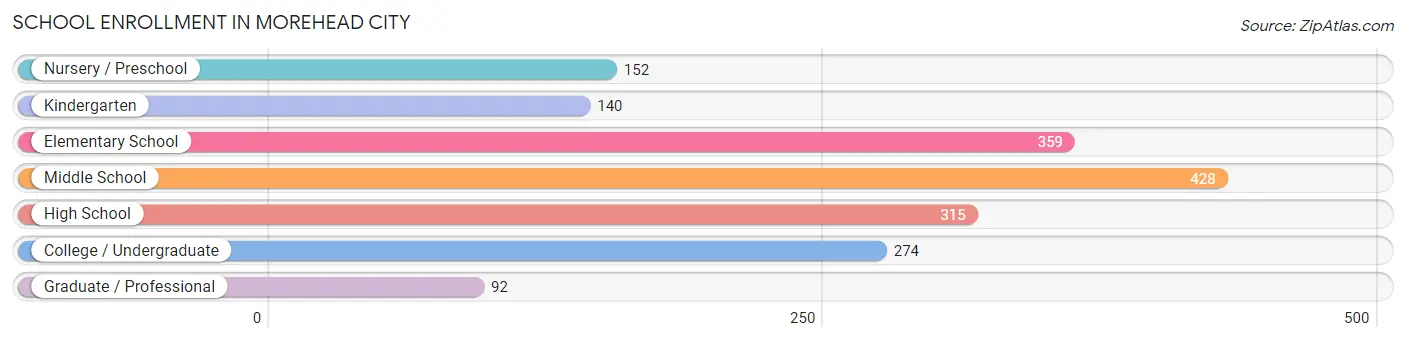
| School Level | # Students | % Students |
| Nursery / Preschool | 152 | 8.6% |
| Kindergarten | 140 | 8.0% |
| Elementary School | 359 | 20.4% |
| Middle School | 428 | 24.3% |
| High School | 315 | 17.9% |
| College / Undergraduate | 274 | 15.6% |
| Graduate / Professional | 92 | 5.2% |
| Total | 1,760 | 100.0% |
School Enrollment by Age by Funding Source in Morehead City
Out of a total of 1,760 students who are enrolled in schools in Morehead City, 368 (20.9%) attend a private institution, while the remaining 1,392 (79.1%) are enrolled in public schools. The age group of 3 to 4 year olds has the highest likelihood of being enrolled in private schools, with 46 (61.3% in the age bracket) enrolled. Conversely, the age group of 20 to 24 year olds has the lowest likelihood of being enrolled in a private school, with 109 (100.0% in the age bracket) attending a public institution.
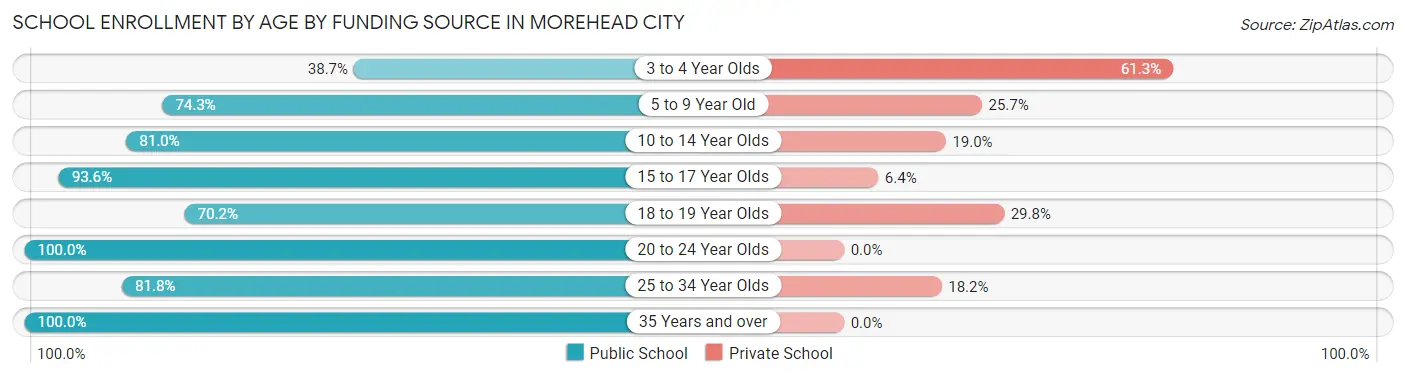
| Age Bracket | Public School | Private School |
| 3 to 4 Year Olds | 29 (38.7%) | 46 (61.3%) |
| 5 to 9 Year Old | 385 (74.3%) | 133 (25.7%) |
| 10 to 14 Year Olds | 406 (81.0%) | 95 (19.0%) |
| 15 to 17 Year Olds | 176 (93.6%) | 12 (6.4%) |
| 18 to 19 Year Olds | 146 (70.2%) | 62 (29.8%) |
| 20 to 24 Year Olds | 109 (100.0%) | 0 (0.0%) |
| 25 to 34 Year Olds | 90 (81.8%) | 20 (18.2%) |
| 35 Years and over | 51 (100.0%) | 0 (0.0%) |
| Total | 1,392 (79.1%) | 368 (20.9%) |
Educational Attainment by Field of Study in Morehead City
Business (392 | 12.9%), education (369 | 12.1%), arts & humanities (360 | 11.8%), bio, nature & agricultural (288 | 9.5%), and science & technology (287 | 9.4%) are the most common fields of study among 3,044 individuals in Morehead City who have obtained a bachelor's degree or higher.
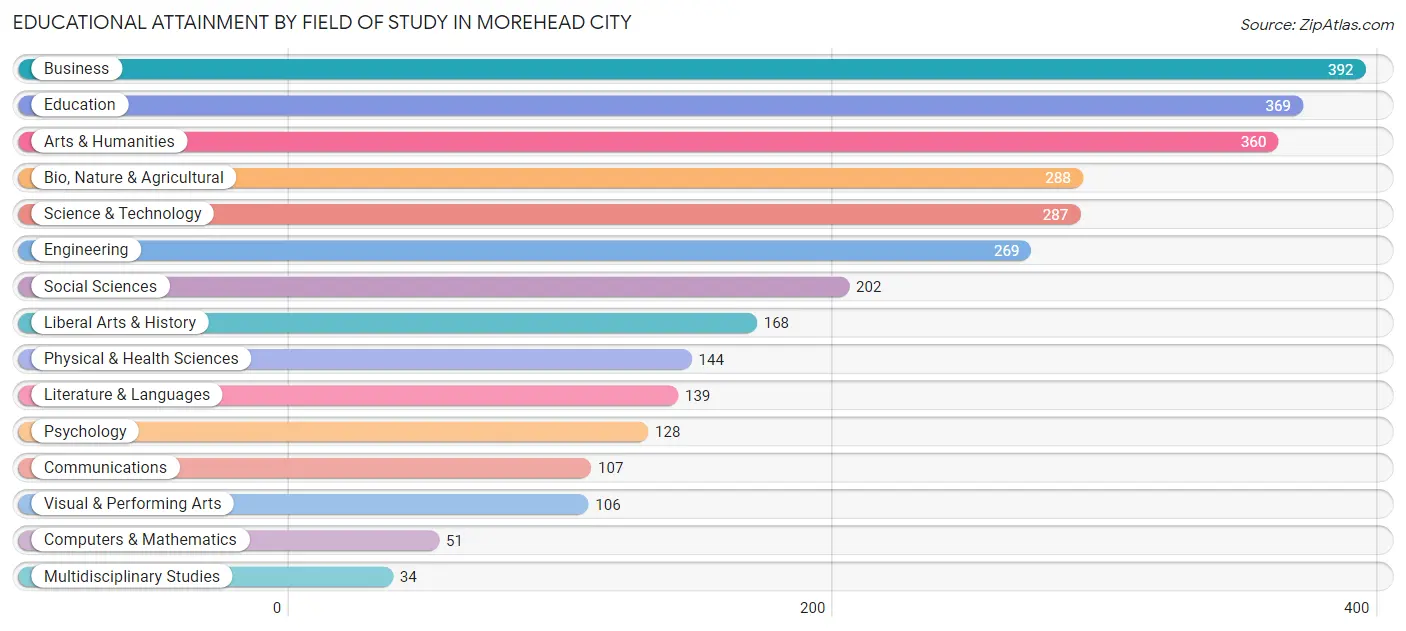
| Field of Study | # Graduates | % Graduates |
| Computers & Mathematics | 51 | 1.7% |
| Bio, Nature & Agricultural | 288 | 9.5% |
| Physical & Health Sciences | 144 | 4.7% |
| Psychology | 128 | 4.2% |
| Social Sciences | 202 | 6.6% |
| Engineering | 269 | 8.8% |
| Multidisciplinary Studies | 34 | 1.1% |
| Science & Technology | 287 | 9.4% |
| Business | 392 | 12.9% |
| Education | 369 | 12.1% |
| Literature & Languages | 139 | 4.6% |
| Liberal Arts & History | 168 | 5.5% |
| Visual & Performing Arts | 106 | 3.5% |
| Communications | 107 | 3.5% |
| Arts & Humanities | 360 | 11.8% |
| Total | 3,044 | 100.0% |
Transportation & Commute in Morehead City
Vehicle Availability by Sex in Morehead City
The most prevalent vehicle ownership categories in Morehead City are males with 2 vehicles (1,203, accounting for 55.4%) and females with 2 vehicles (997, making up 53.1%).
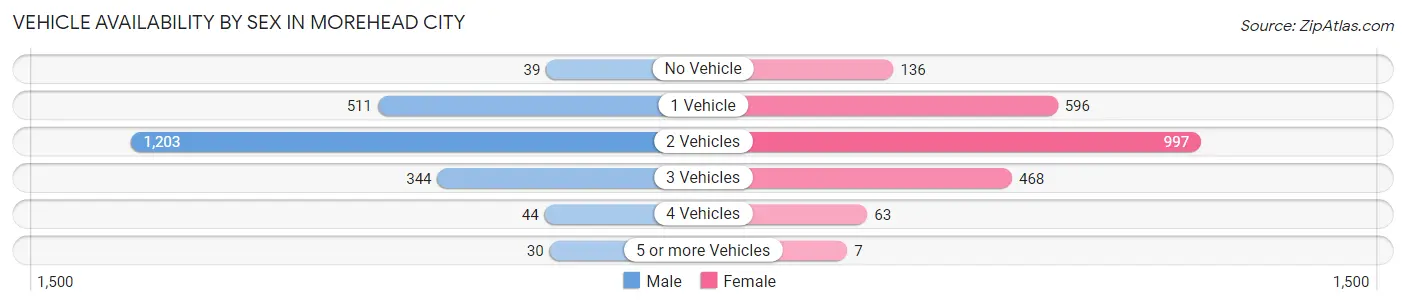
| Vehicles Available | Male | Female |
| No Vehicle | 39 (1.8%) | 136 (6.0%) |
| 1 Vehicle | 511 (23.5%) | 596 (26.3%) |
| 2 Vehicles | 1,203 (55.4%) | 997 (44.0%) |
| 3 Vehicles | 344 (15.9%) | 468 (20.6%) |
| 4 Vehicles | 44 (2.0%) | 63 (2.8%) |
| 5 or more Vehicles | 30 (1.4%) | 7 (0.3%) |
| Total | 2,171 (100.0%) | 2,267 (100.0%) |
Commute Time in Morehead City
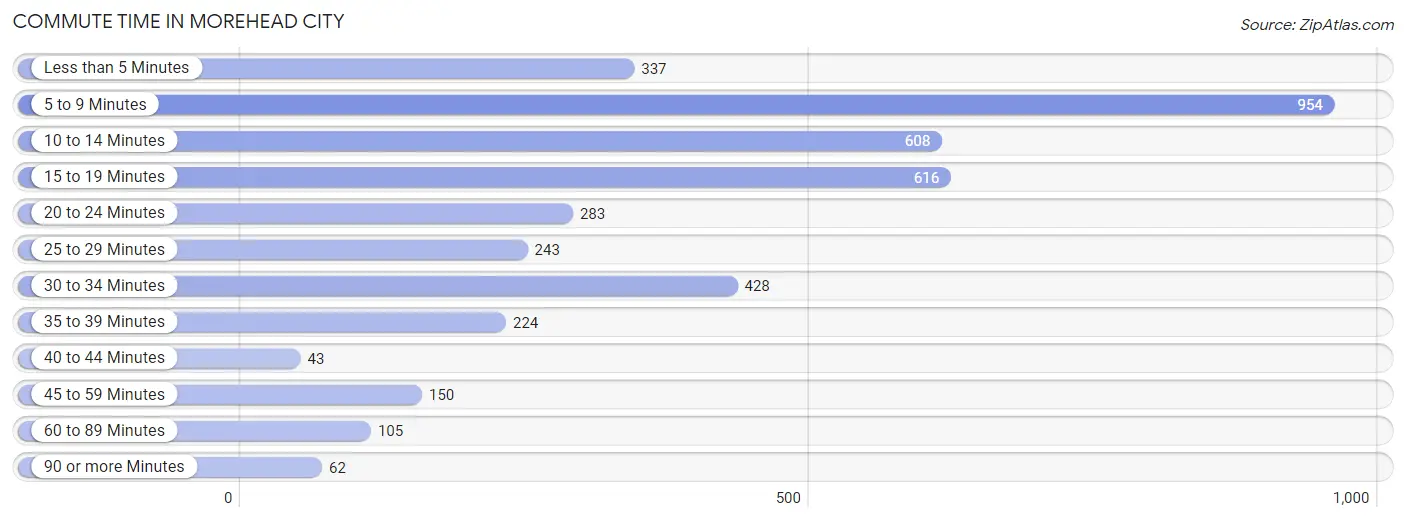
The most frequently occuring commute durations in Morehead City are 5 to 9 minutes (954 commuters, 23.5%), 15 to 19 minutes (616 commuters, 15.2%), and 10 to 14 minutes (608 commuters, 15.0%).
| Commute Time | # Commuters | % Commuters |
| Less than 5 Minutes | 337 | 8.3% |
| 5 to 9 Minutes | 954 | 23.5% |
| 10 to 14 Minutes | 608 | 15.0% |
| 15 to 19 Minutes | 616 | 15.2% |
| 20 to 24 Minutes | 283 | 7.0% |
| 25 to 29 Minutes | 243 | 6.0% |
| 30 to 34 Minutes | 428 | 10.6% |
| 35 to 39 Minutes | 224 | 5.5% |
| 40 to 44 Minutes | 43 | 1.1% |
| 45 to 59 Minutes | 150 | 3.7% |
| 60 to 89 Minutes | 105 | 2.6% |
| 90 or more Minutes | 62 | 1.5% |
Commute Time by Sex in Morehead City
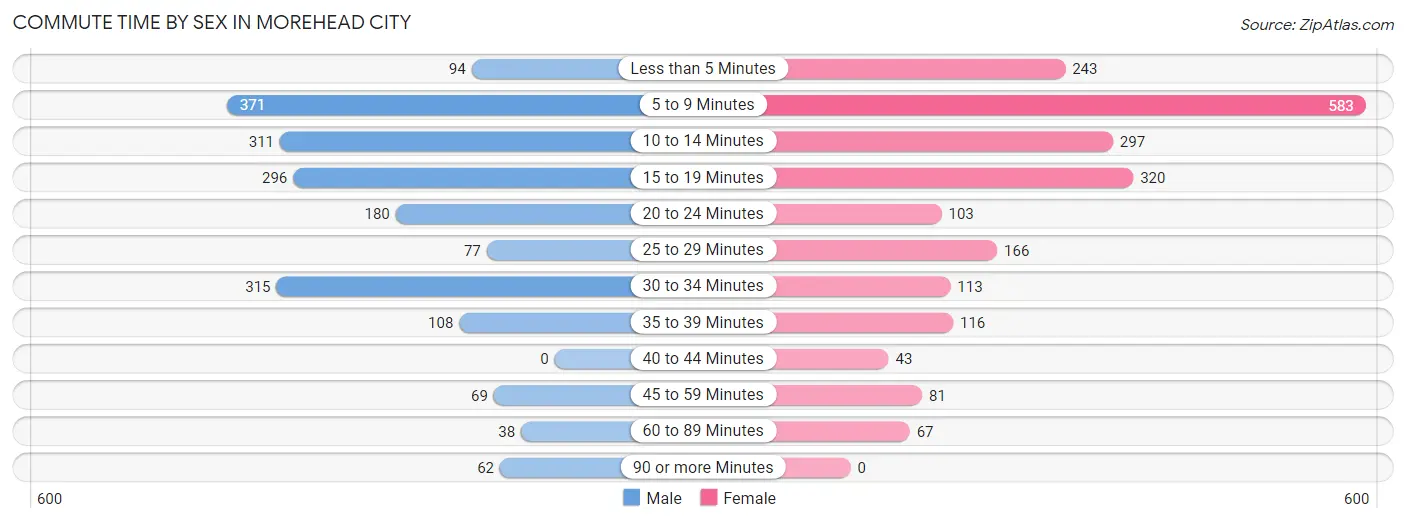
The most common commute times in Morehead City are 5 to 9 minutes (371 commuters, 19.3%) for males and 5 to 9 minutes (583 commuters, 27.4%) for females.
| Commute Time | Male | Female |
| Less than 5 Minutes | 94 (4.9%) | 243 (11.4%) |
| 5 to 9 Minutes | 371 (19.3%) | 583 (27.4%) |
| 10 to 14 Minutes | 311 (16.2%) | 297 (13.9%) |
| 15 to 19 Minutes | 296 (15.4%) | 320 (15.0%) |
| 20 to 24 Minutes | 180 (9.4%) | 103 (4.8%) |
| 25 to 29 Minutes | 77 (4.0%) | 166 (7.8%) |
| 30 to 34 Minutes | 315 (16.4%) | 113 (5.3%) |
| 35 to 39 Minutes | 108 (5.6%) | 116 (5.4%) |
| 40 to 44 Minutes | 0 (0.0%) | 43 (2.0%) |
| 45 to 59 Minutes | 69 (3.6%) | 81 (3.8%) |
| 60 to 89 Minutes | 38 (2.0%) | 67 (3.1%) |
| 90 or more Minutes | 62 (3.2%) | 0 (0.0%) |
Time of Departure to Work by Sex in Morehead City
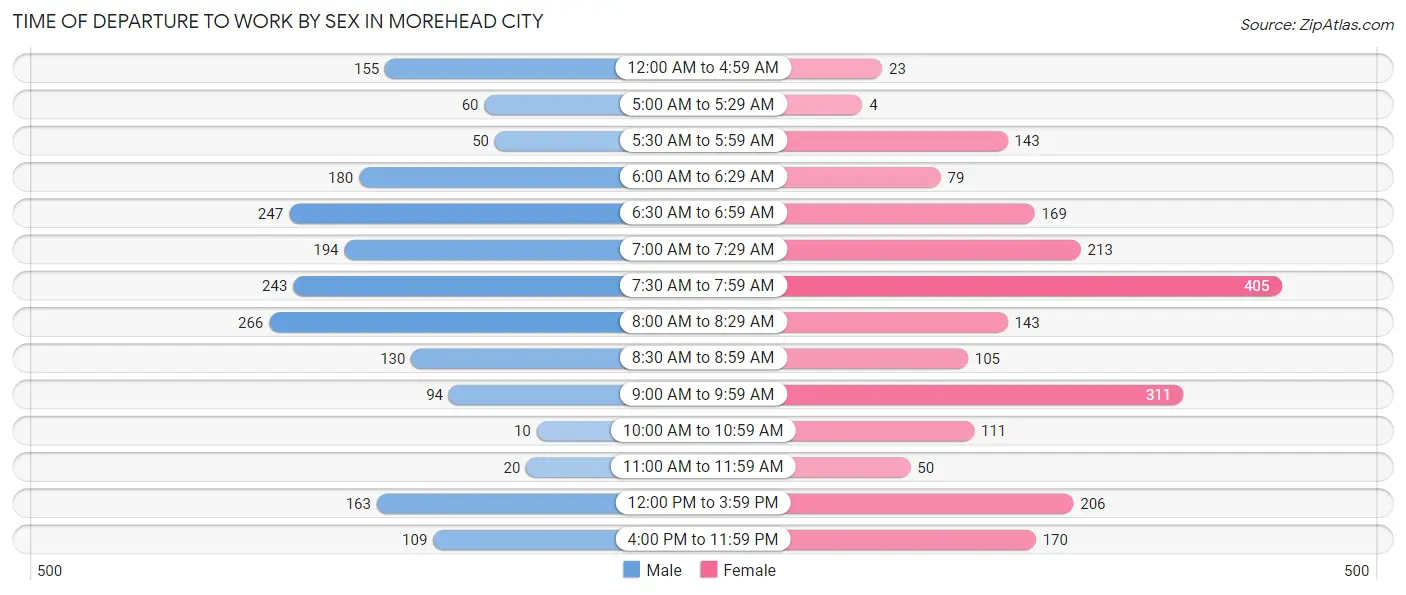
The most frequent times of departure to work in Morehead City are 8:00 AM to 8:29 AM (266, 13.9%) for males and 7:30 AM to 7:59 AM (405, 19.0%) for females.
| Time of Departure | Male | Female |
| 12:00 AM to 4:59 AM | 155 (8.1%) | 23 (1.1%) |
| 5:00 AM to 5:29 AM | 60 (3.1%) | 4 (0.2%) |
| 5:30 AM to 5:59 AM | 50 (2.6%) | 143 (6.7%) |
| 6:00 AM to 6:29 AM | 180 (9.4%) | 79 (3.7%) |
| 6:30 AM to 6:59 AM | 247 (12.9%) | 169 (7.9%) |
| 7:00 AM to 7:29 AM | 194 (10.1%) | 213 (10.0%) |
| 7:30 AM to 7:59 AM | 243 (12.7%) | 405 (19.0%) |
| 8:00 AM to 8:29 AM | 266 (13.9%) | 143 (6.7%) |
| 8:30 AM to 8:59 AM | 130 (6.8%) | 105 (4.9%) |
| 9:00 AM to 9:59 AM | 94 (4.9%) | 311 (14.6%) |
| 10:00 AM to 10:59 AM | 10 (0.5%) | 111 (5.2%) |
| 11:00 AM to 11:59 AM | 20 (1.0%) | 50 (2.4%) |
| 12:00 PM to 3:59 PM | 163 (8.5%) | 206 (9.7%) |
| 4:00 PM to 11:59 PM | 109 (5.7%) | 170 (8.0%) |
| Total | 1,921 (100.0%) | 2,132 (100.0%) |
Housing Occupancy in Morehead City
Occupancy by Ownership in Morehead City
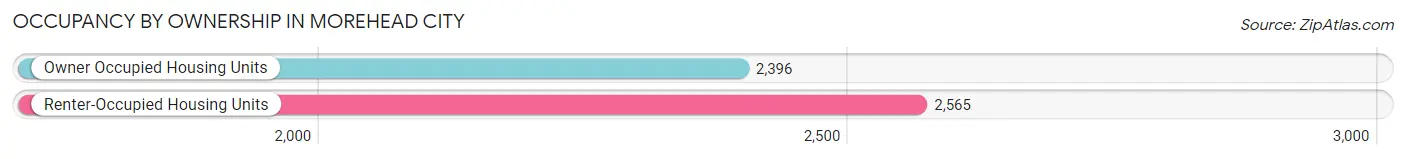
Of the total 4,961 dwellings in Morehead City, owner-occupied units account for 2,396 (48.3%), while renter-occupied units make up 2,565 (51.7%).
| Occupancy | # Housing Units | % Housing Units |
| Owner Occupied Housing Units | 2,396 | 48.3% |
| Renter-Occupied Housing Units | 2,565 | 51.7% |
| Total Occupied Housing Units | 4,961 | 100.0% |
Occupancy by Household Size in Morehead City
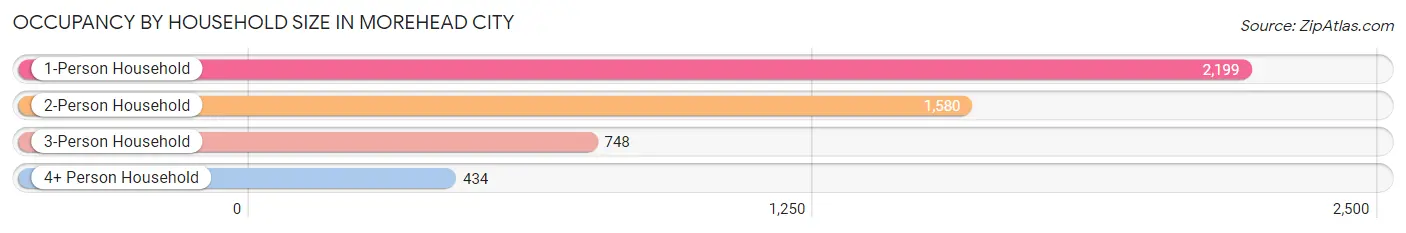
| Household Size | # Housing Units | % Housing Units |
| 1-Person Household | 2,199 | 44.3% |
| 2-Person Household | 1,580 | 31.9% |
| 3-Person Household | 748 | 15.1% |
| 4+ Person Household | 434 | 8.7% |
| Total Housing Units | 4,961 | 100.0% |
Occupancy by Ownership by Household Size in Morehead City
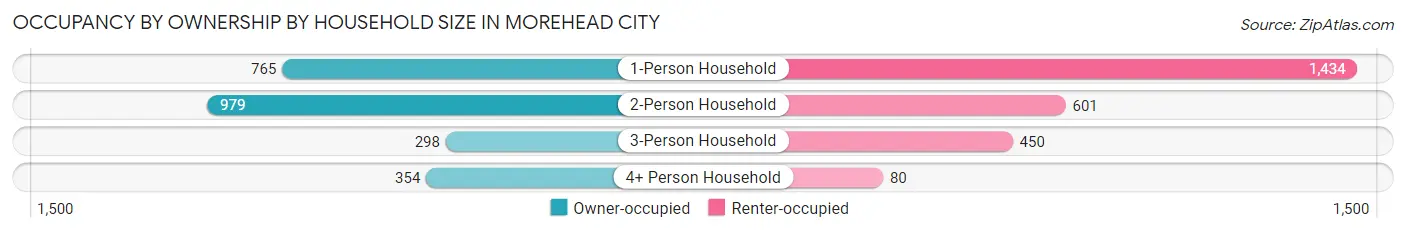
| Household Size | Owner-occupied | Renter-occupied |
| 1-Person Household | 765 (34.8%) | 1,434 (65.2%) |
| 2-Person Household | 979 (62.0%) | 601 (38.0%) |
| 3-Person Household | 298 (39.8%) | 450 (60.2%) |
| 4+ Person Household | 354 (81.6%) | 80 (18.4%) |
| Total Housing Units | 2,396 (48.3%) | 2,565 (51.7%) |
Occupancy by Educational Attainment in Morehead City
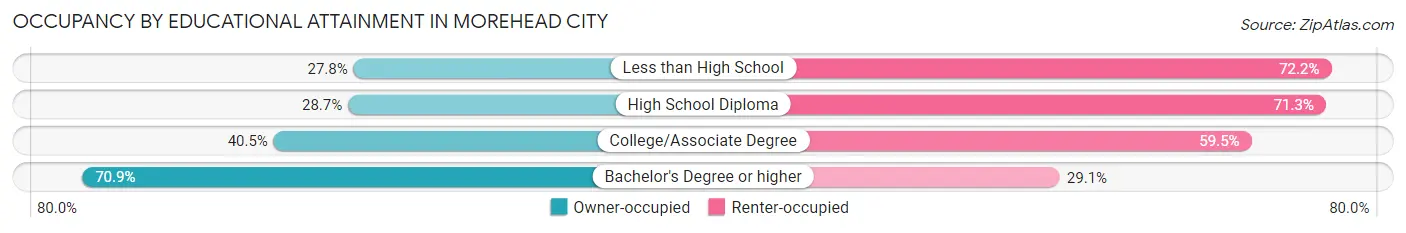
| Household Size | Owner-occupied | Renter-occupied |
| Less than High School | 118 (27.8%) | 306 (72.2%) |
| High School Diploma | 289 (28.7%) | 718 (71.3%) |
| College/Associate Degree | 683 (40.5%) | 1,004 (59.5%) |
| Bachelor's Degree or higher | 1,306 (70.9%) | 537 (29.1%) |
Occupancy by Age of Householder in Morehead City
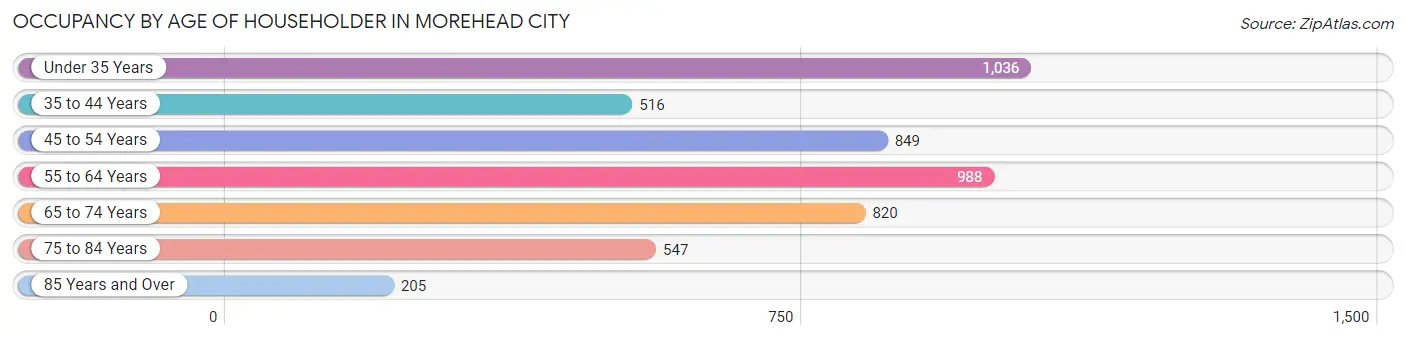
| Age Bracket | # Households | % Households |
| Under 35 Years | 1,036 | 20.9% |
| 35 to 44 Years | 516 | 10.4% |
| 45 to 54 Years | 849 | 17.1% |
| 55 to 64 Years | 988 | 19.9% |
| 65 to 74 Years | 820 | 16.5% |
| 75 to 84 Years | 547 | 11.0% |
| 85 Years and Over | 205 | 4.1% |
| Total | 4,961 | 100.0% |
Housing Finances in Morehead City
Median Income by Occupancy in Morehead City
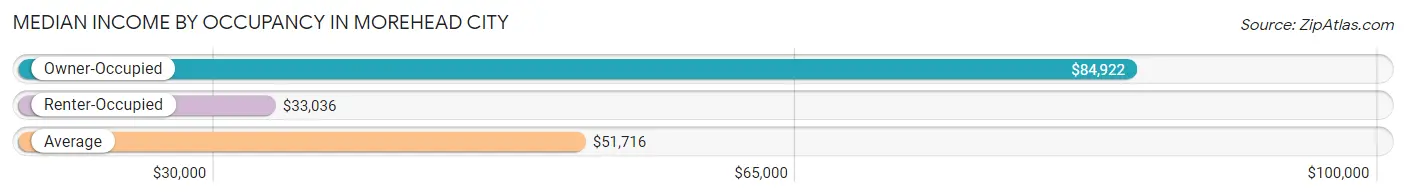
| Occupancy Type | # Households | Median Income |
| Owner-Occupied | 2,396 (48.3%) | $84,922 |
| Renter-Occupied | 2,565 (51.7%) | $33,036 |
| Average | 4,961 (100.0%) | $51,716 |
Occupancy by Householder Income Bracket in Morehead City
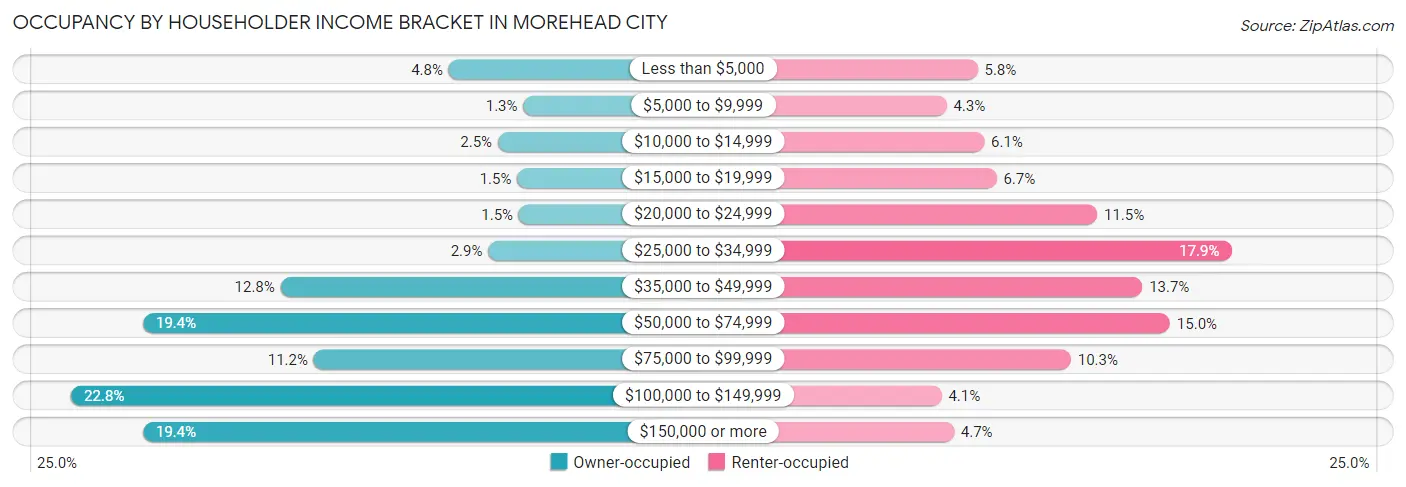
| Income Bracket | Owner-occupied | Renter-occupied |
| Less than $5,000 | 115 (4.8%) | 149 (5.8%) |
| $5,000 to $9,999 | 30 (1.3%) | 111 (4.3%) |
| $10,000 to $14,999 | 59 (2.5%) | 157 (6.1%) |
| $15,000 to $19,999 | 37 (1.5%) | 172 (6.7%) |
| $20,000 to $24,999 | 35 (1.5%) | 295 (11.5%) |
| $25,000 to $34,999 | 70 (2.9%) | 459 (17.9%) |
| $35,000 to $49,999 | 307 (12.8%) | 350 (13.7%) |
| $50,000 to $74,999 | 464 (19.4%) | 384 (15.0%) |
| $75,000 to $99,999 | 269 (11.2%) | 263 (10.2%) |
| $100,000 to $149,999 | 546 (22.8%) | 105 (4.1%) |
| $150,000 or more | 464 (19.4%) | 120 (4.7%) |
| Total | 2,396 (100.0%) | 2,565 (100.0%) |
Monthly Housing Cost Tiers in Morehead City
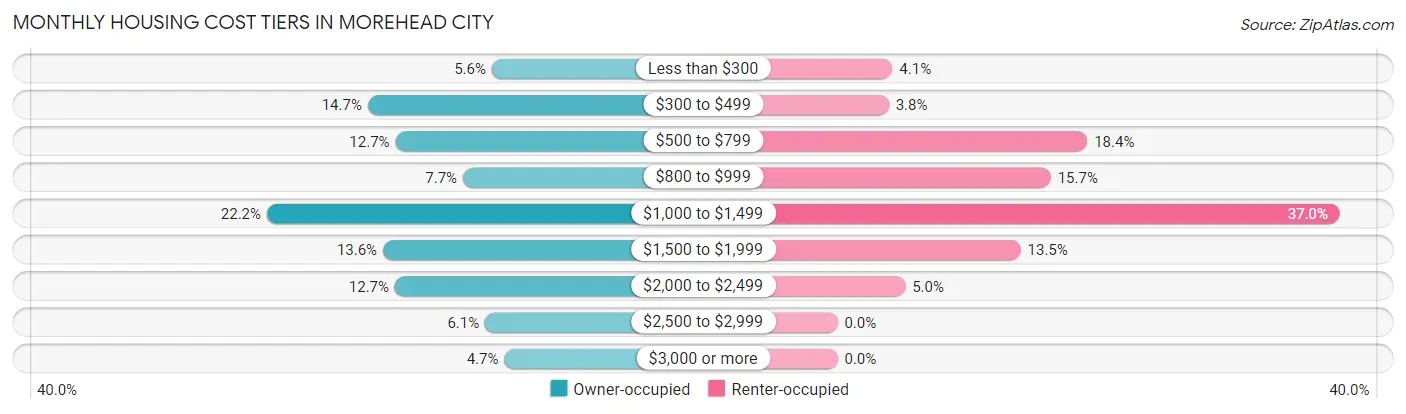
| Monthly Cost | Owner-occupied | Renter-occupied |
| Less than $300 | 134 (5.6%) | 104 (4.1%) |
| $300 to $499 | 353 (14.7%) | 97 (3.8%) |
| $500 to $799 | 304 (12.7%) | 472 (18.4%) |
| $800 to $999 | 185 (7.7%) | 403 (15.7%) |
| $1,000 to $1,499 | 531 (22.2%) | 949 (37.0%) |
| $1,500 to $1,999 | 326 (13.6%) | 346 (13.5%) |
| $2,000 to $2,499 | 305 (12.7%) | 128 (5.0%) |
| $2,500 to $2,999 | 146 (6.1%) | 0 (0.0%) |
| $3,000 or more | 112 (4.7%) | 0 (0.0%) |
| Total | 2,396 (100.0%) | 2,565 (100.0%) |
Physical Housing Characteristics in Morehead City
Housing Structures in Morehead City
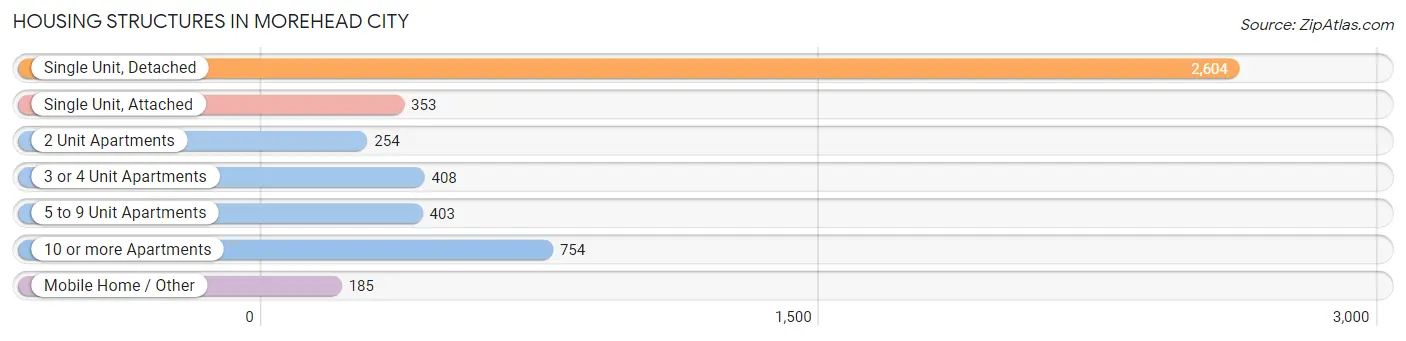
| Structure Type | # Housing Units | % Housing Units |
| Single Unit, Detached | 2,604 | 52.5% |
| Single Unit, Attached | 353 | 7.1% |
| 2 Unit Apartments | 254 | 5.1% |
| 3 or 4 Unit Apartments | 408 | 8.2% |
| 5 to 9 Unit Apartments | 403 | 8.1% |
| 10 or more Apartments | 754 | 15.2% |
| Mobile Home / Other | 185 | 3.7% |
| Total | 4,961 | 100.0% |
Housing Structures by Occupancy in Morehead City
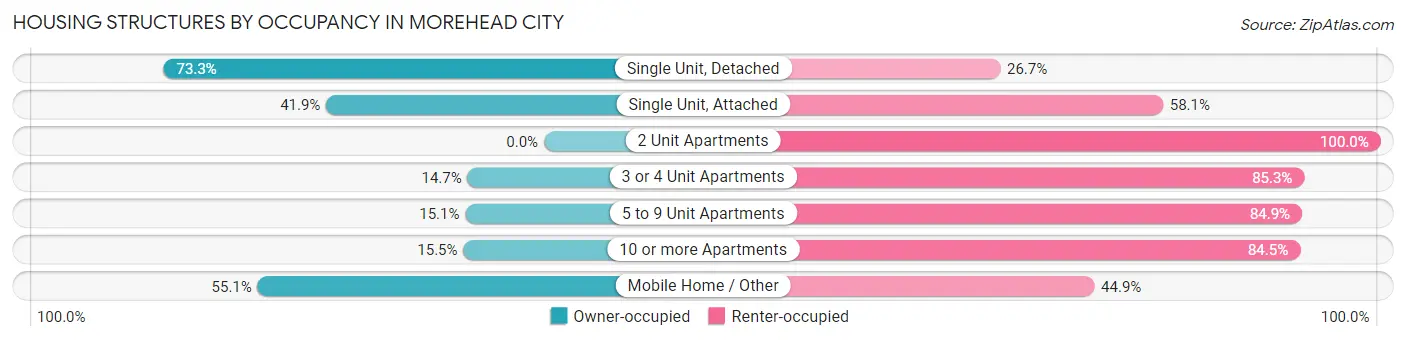
| Structure Type | Owner-occupied | Renter-occupied |
| Single Unit, Detached | 1,908 (73.3%) | 696 (26.7%) |
| Single Unit, Attached | 148 (41.9%) | 205 (58.1%) |
| 2 Unit Apartments | 0 (0.0%) | 254 (100.0%) |
| 3 or 4 Unit Apartments | 60 (14.7%) | 348 (85.3%) |
| 5 to 9 Unit Apartments | 61 (15.1%) | 342 (84.9%) |
| 10 or more Apartments | 117 (15.5%) | 637 (84.5%) |
| Mobile Home / Other | 102 (55.1%) | 83 (44.9%) |
| Total | 2,396 (48.3%) | 2,565 (51.7%) |
Housing Structures by Number of Rooms in Morehead City
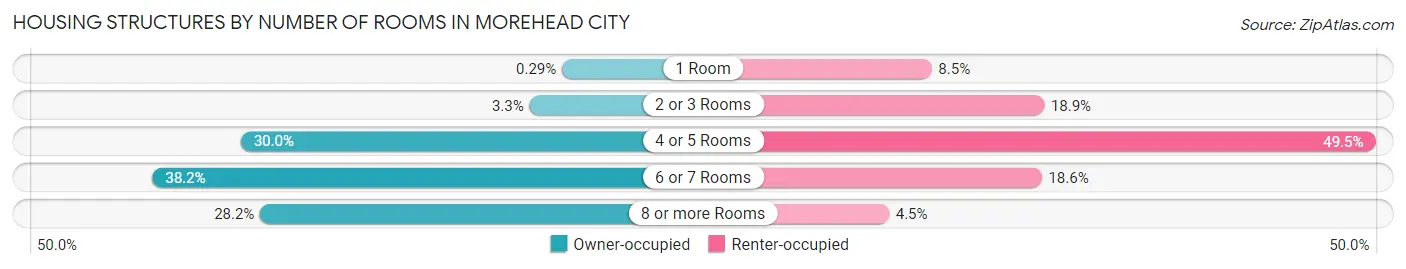
| Number of Rooms | Owner-occupied | Renter-occupied |
| 1 Room | 7 (0.3%) | 217 (8.5%) |
| 2 or 3 Rooms | 79 (3.3%) | 484 (18.9%) |
| 4 or 5 Rooms | 719 (30.0%) | 1,270 (49.5%) |
| 6 or 7 Rooms | 915 (38.2%) | 478 (18.6%) |
| 8 or more Rooms | 676 (28.2%) | 116 (4.5%) |
| Total | 2,396 (100.0%) | 2,565 (100.0%) |
Housing Structure by Heating Type in Morehead City
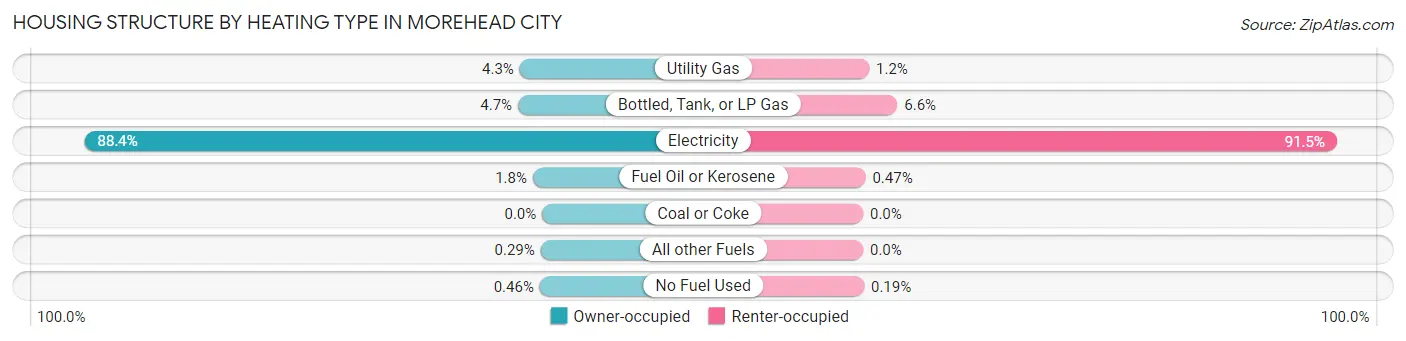
| Heating Type | Owner-occupied | Renter-occupied |
| Utility Gas | 104 (4.3%) | 30 (1.2%) |
| Bottled, Tank, or LP Gas | 112 (4.7%) | 170 (6.6%) |
| Electricity | 2,119 (88.4%) | 2,348 (91.5%) |
| Fuel Oil or Kerosene | 43 (1.8%) | 12 (0.5%) |
| Coal or Coke | 0 (0.0%) | 0 (0.0%) |
| All other Fuels | 7 (0.3%) | 0 (0.0%) |
| No Fuel Used | 11 (0.5%) | 5 (0.2%) |
| Total | 2,396 (100.0%) | 2,565 (100.0%) |
Household Vehicle Usage in Morehead City
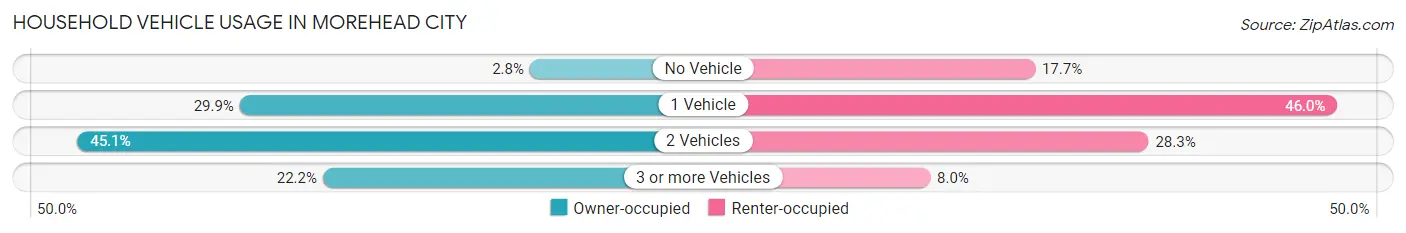
| Vehicles per Household | Owner-occupied | Renter-occupied |
| No Vehicle | 68 (2.8%) | 455 (17.7%) |
| 1 Vehicle | 717 (29.9%) | 1,179 (46.0%) |
| 2 Vehicles | 1,080 (45.1%) | 727 (28.3%) |
| 3 or more Vehicles | 531 (22.2%) | 204 (8.0%) |
| Total | 2,396 (100.0%) | 2,565 (100.0%) |
Real Estate & Mortgages in Morehead City
Real Estate and Mortgage Overview in Morehead City
| Characteristic | Without Mortgage | With Mortgage |
| Housing Units | 989 | 1,407 |
| Median Property Value | $308,400 | $320,000 |
| Median Household Income | $60,274 | $305 |
| Monthly Housing Costs | $520 | $90 |
| Real Estate Taxes | $1,426 | $24 |
Property Value by Mortgage Status in Morehead City
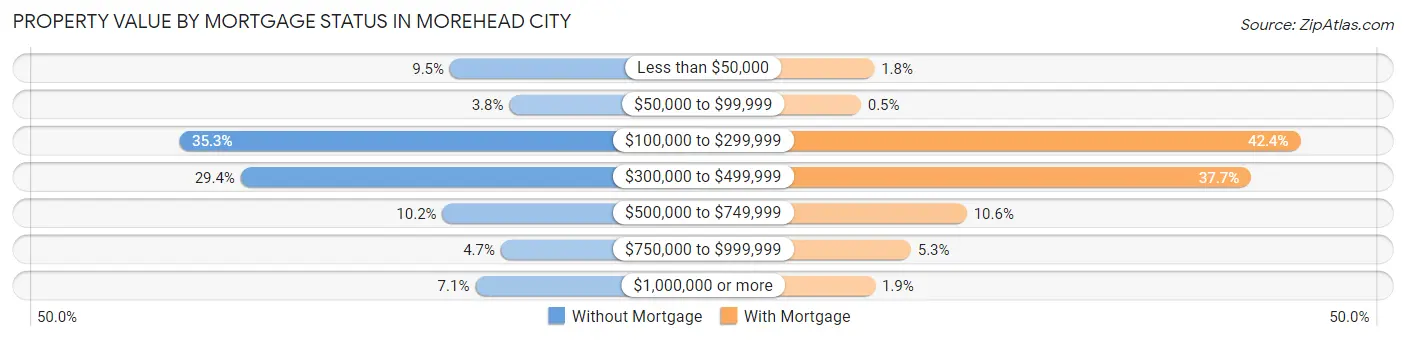
| Property Value | Without Mortgage | With Mortgage |
| Less than $50,000 | 94 (9.5%) | 25 (1.8%) |
| $50,000 to $99,999 | 38 (3.8%) | 7 (0.5%) |
| $100,000 to $299,999 | 349 (35.3%) | 596 (42.4%) |
| $300,000 to $499,999 | 291 (29.4%) | 530 (37.7%) |
| $500,000 to $749,999 | 101 (10.2%) | 149 (10.6%) |
| $750,000 to $999,999 | 46 (4.6%) | 74 (5.3%) |
| $1,000,000 or more | 70 (7.1%) | 26 (1.8%) |
| Total | 989 (100.0%) | 1,407 (100.0%) |
Household Income by Mortgage Status in Morehead City
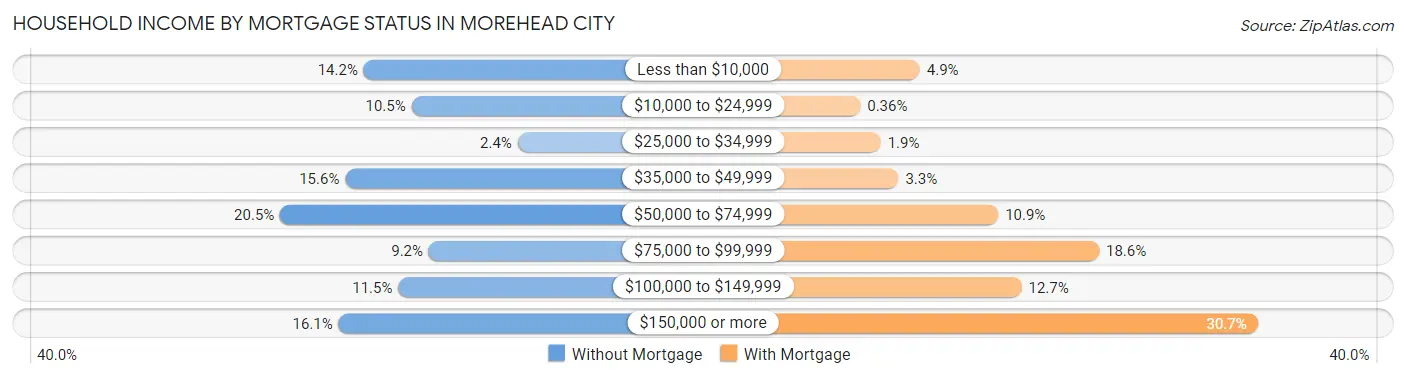
| Household Income | Without Mortgage | With Mortgage |
| Less than $10,000 | 140 (14.2%) | 69 (4.9%) |
| $10,000 to $24,999 | 104 (10.5%) | 5 (0.4%) |
| $25,000 to $34,999 | 24 (2.4%) | 27 (1.9%) |
| $35,000 to $49,999 | 154 (15.6%) | 46 (3.3%) |
| $50,000 to $74,999 | 203 (20.5%) | 153 (10.9%) |
| $75,000 to $99,999 | 91 (9.2%) | 261 (18.5%) |
| $100,000 to $149,999 | 114 (11.5%) | 178 (12.7%) |
| $150,000 or more | 159 (16.1%) | 432 (30.7%) |
| Total | 989 (100.0%) | 1,407 (100.0%) |
Property Value to Household Income Ratio in Morehead City
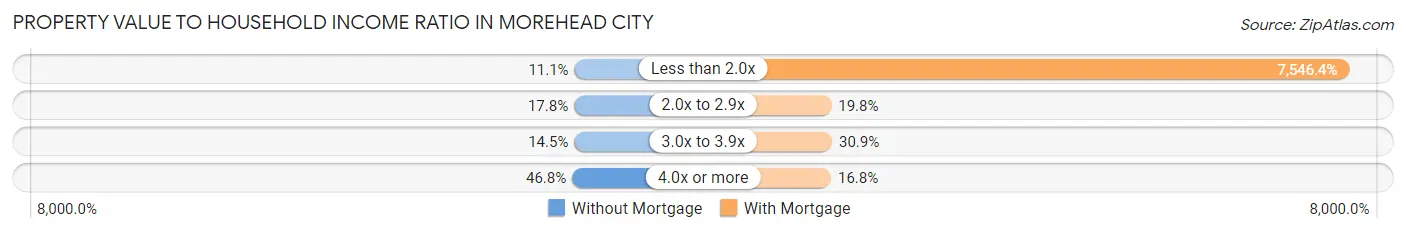
| Value-to-Income Ratio | Without Mortgage | With Mortgage |
| Less than 2.0x | 110 (11.1%) | 106,178 (7,546.4%) |
| 2.0x to 2.9x | 176 (17.8%) | 279 (19.8%) |
| 3.0x to 3.9x | 143 (14.5%) | 434 (30.8%) |
| 4.0x or more | 463 (46.8%) | 236 (16.8%) |
| Total | 989 (100.0%) | 1,407 (100.0%) |
Real Estate Taxes by Mortgage Status in Morehead City
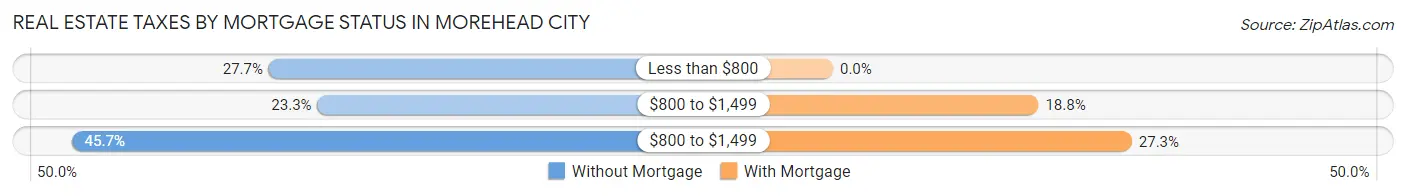
| Property Taxes | Without Mortgage | With Mortgage |
| Less than $800 | 274 (27.7%) | 0 (0.0%) |
| $800 to $1,499 | 230 (23.3%) | 264 (18.8%) |
| $800 to $1,499 | 452 (45.7%) | 384 (27.3%) |
| Total | 989 (100.0%) | 1,407 (100.0%) |
Health & Disability in Morehead City
Health Insurance Coverage by Age in Morehead City
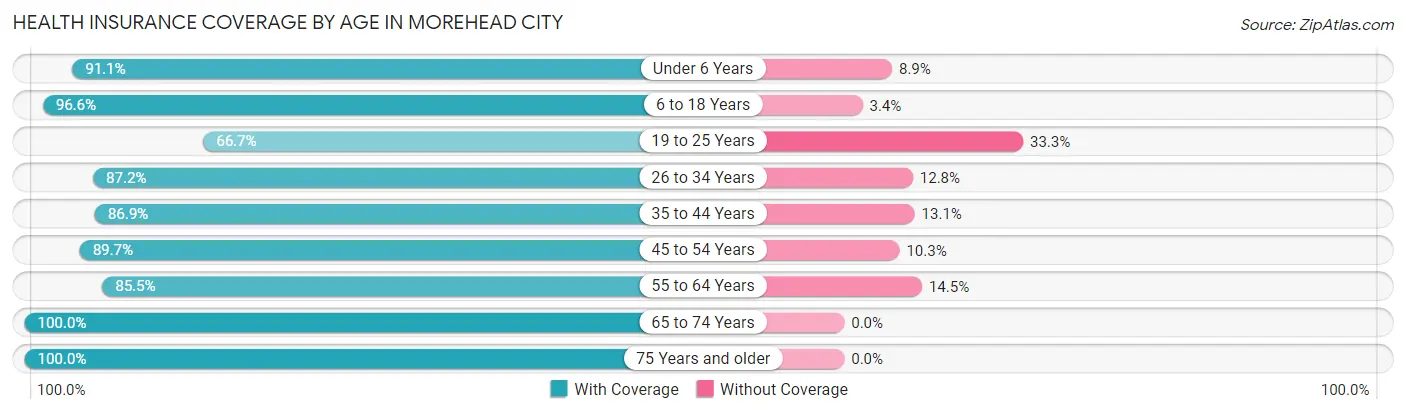
| Age Bracket | With Coverage | Without Coverage |
| Under 6 Years | 563 (91.1%) | 55 (8.9%) |
| 6 to 18 Years | 1,138 (96.6%) | 40 (3.4%) |
| 19 to 25 Years | 420 (66.7%) | 210 (33.3%) |
| 26 to 34 Years | 961 (87.2%) | 141 (12.8%) |
| 35 to 44 Years | 801 (86.9%) | 121 (13.1%) |
| 45 to 54 Years | 1,116 (89.7%) | 128 (10.3%) |
| 55 to 64 Years | 1,287 (85.5%) | 218 (14.5%) |
| 65 to 74 Years | 1,154 (100.0%) | 0 (0.0%) |
| 75 Years and older | 1,000 (100.0%) | 0 (0.0%) |
| Total | 8,440 (90.2%) | 913 (9.8%) |
Health Insurance Coverage by Citizenship Status in Morehead City
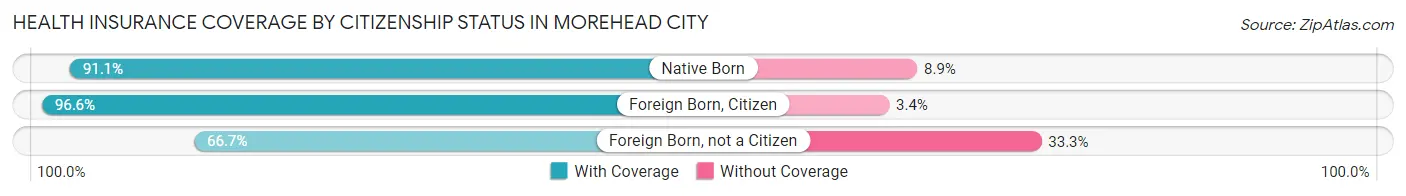
| Citizenship Status | With Coverage | Without Coverage |
| Native Born | 563 (91.1%) | 55 (8.9%) |
| Foreign Born, Citizen | 1,138 (96.6%) | 40 (3.4%) |
| Foreign Born, not a Citizen | 420 (66.7%) | 210 (33.3%) |
Health Insurance Coverage by Household Income in Morehead City
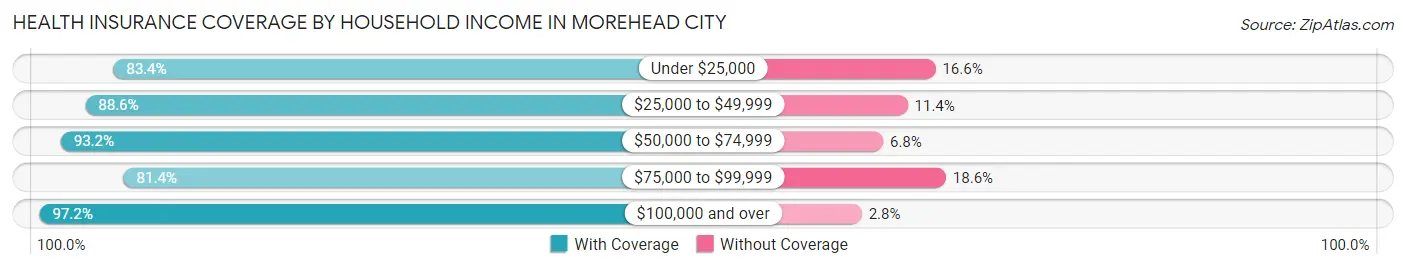
| Household Income | With Coverage | Without Coverage |
| Under $25,000 | 1,390 (83.4%) | 277 (16.6%) |
| $25,000 to $49,999 | 1,634 (88.6%) | 210 (11.4%) |
| $50,000 to $74,999 | 1,400 (93.2%) | 102 (6.8%) |
| $75,000 to $99,999 | 943 (81.4%) | 215 (18.6%) |
| $100,000 and over | 3,059 (97.2%) | 88 (2.8%) |
Public vs Private Health Insurance Coverage by Age in Morehead City
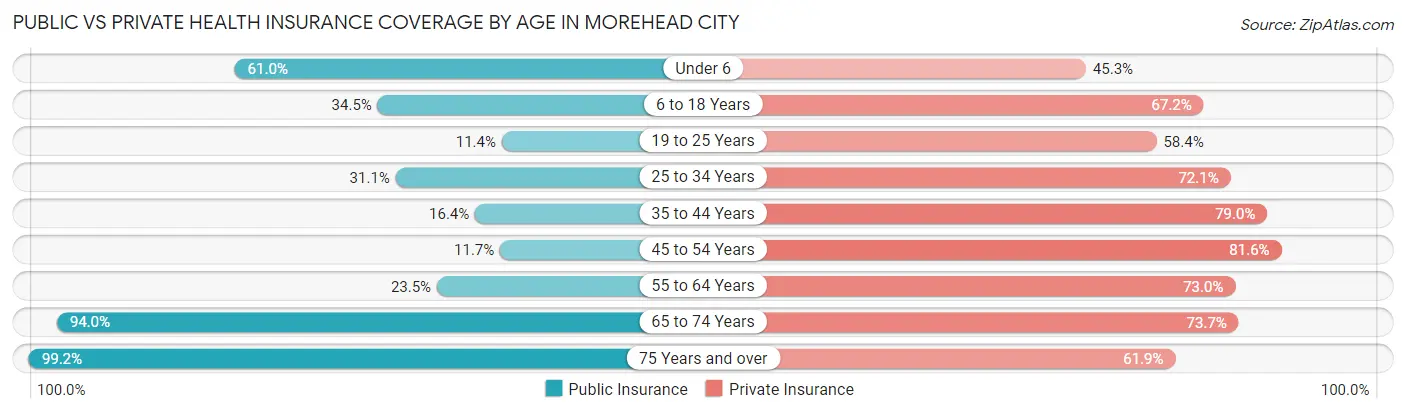
| Age Bracket | Public Insurance | Private Insurance |
| Under 6 | 377 (61.0%) | 280 (45.3%) |
| 6 to 18 Years | 406 (34.5%) | 791 (67.1%) |
| 19 to 25 Years | 72 (11.4%) | 368 (58.4%) |
| 25 to 34 Years | 343 (31.1%) | 795 (72.1%) |
| 35 to 44 Years | 151 (16.4%) | 728 (79.0%) |
| 45 to 54 Years | 146 (11.7%) | 1,015 (81.6%) |
| 55 to 64 Years | 353 (23.5%) | 1,099 (73.0%) |
| 65 to 74 Years | 1,085 (94.0%) | 850 (73.7%) |
| 75 Years and over | 992 (99.2%) | 619 (61.9%) |
| Total | 3,925 (42.0%) | 6,545 (70.0%) |
Disability Status by Sex by Age in Morehead City
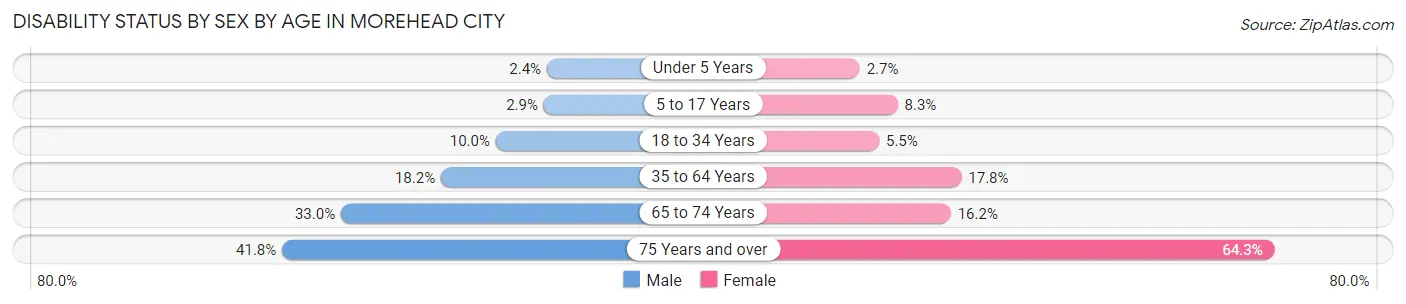
| Age Bracket | Male | Female |
| Under 5 Years | 5 (2.4%) | 7 (2.7%) |
| 5 to 17 Years | 20 (2.9%) | 43 (8.3%) |
| 18 to 34 Years | 75 (10.0%) | 61 (5.5%) |
| 35 to 64 Years | 321 (18.2%) | 338 (17.7%) |
| 65 to 74 Years | 177 (33.0%) | 100 (16.2%) |
| 75 Years and over | 157 (41.8%) | 401 (64.3%) |
Disability Class by Sex by Age in Morehead City
Disability Class: Hearing Difficulty
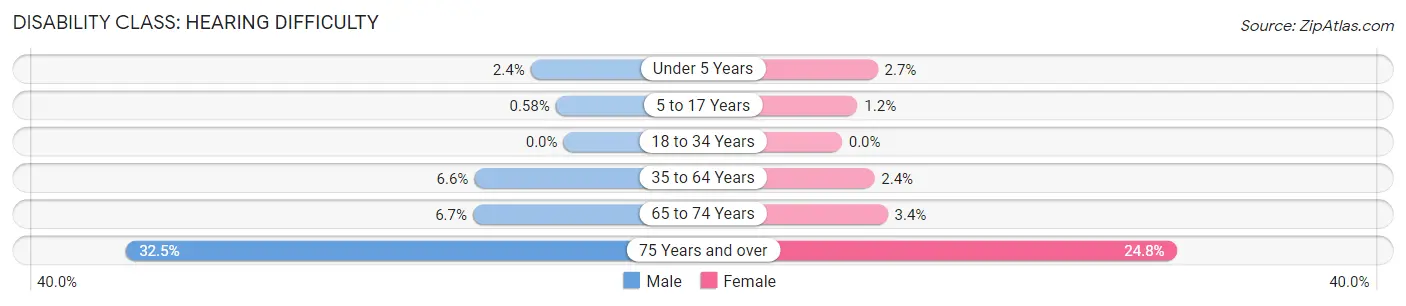
| Age Bracket | Male | Female |
| Under 5 Years | 5 (2.4%) | 7 (2.7%) |
| 5 to 17 Years | 4 (0.6%) | 6 (1.2%) |
| 18 to 34 Years | 0 (0.0%) | 0 (0.0%) |
| 35 to 64 Years | 117 (6.6%) | 46 (2.4%) |
| 65 to 74 Years | 36 (6.7%) | 21 (3.4%) |
| 75 Years and over | 122 (32.5%) | 155 (24.8%) |
Disability Class: Vision Difficulty
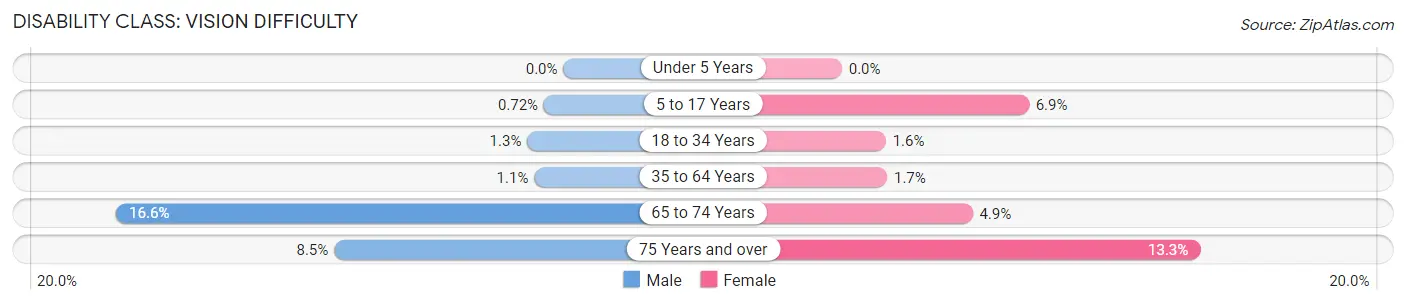
| Age Bracket | Male | Female |
| Under 5 Years | 0 (0.0%) | 0 (0.0%) |
| 5 to 17 Years | 5 (0.7%) | 36 (6.9%) |
| 18 to 34 Years | 10 (1.3%) | 18 (1.6%) |
| 35 to 64 Years | 19 (1.1%) | 32 (1.7%) |
| 65 to 74 Years | 89 (16.6%) | 30 (4.9%) |
| 75 Years and over | 32 (8.5%) | 83 (13.3%) |
Disability Class: Cognitive Difficulty
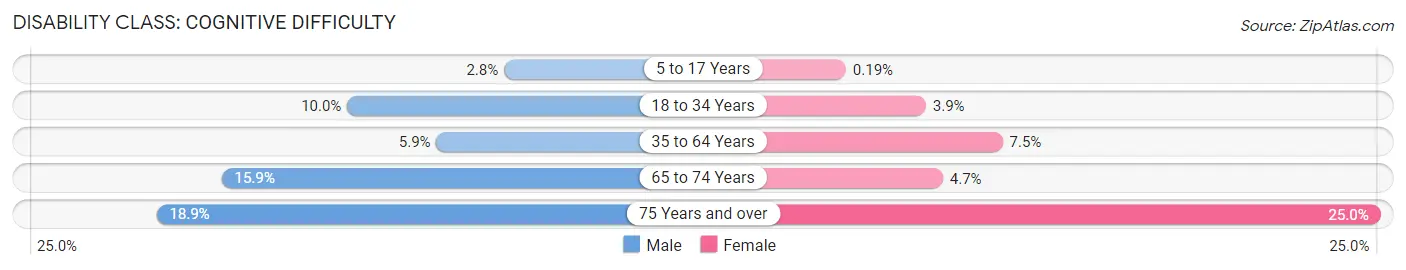
| Age Bracket | Male | Female |
| 5 to 17 Years | 19 (2.8%) | 1 (0.2%) |
| 18 to 34 Years | 75 (10.0%) | 43 (3.9%) |
| 35 to 64 Years | 104 (5.9%) | 142 (7.5%) |
| 65 to 74 Years | 85 (15.9%) | 29 (4.7%) |
| 75 Years and over | 71 (18.9%) | 156 (25.0%) |
Disability Class: Ambulatory Difficulty
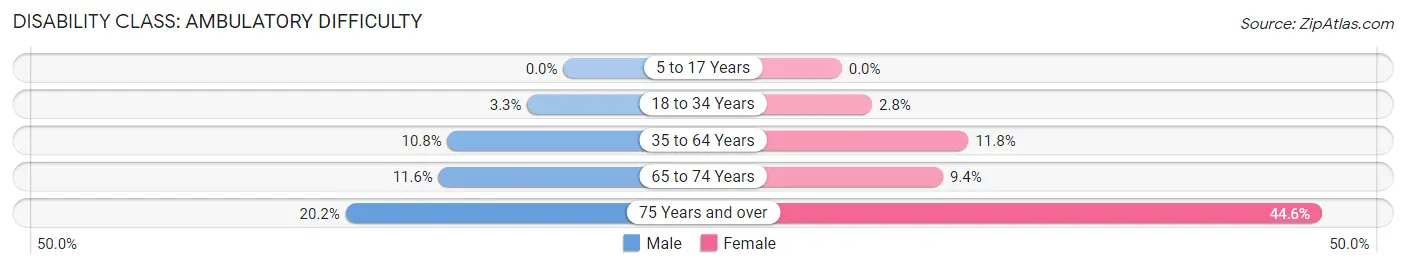
| Age Bracket | Male | Female |
| 5 to 17 Years | 0 (0.0%) | 0 (0.0%) |
| 18 to 34 Years | 25 (3.3%) | 31 (2.8%) |
| 35 to 64 Years | 190 (10.7%) | 224 (11.8%) |
| 65 to 74 Years | 62 (11.6%) | 58 (9.4%) |
| 75 Years and over | 76 (20.2%) | 278 (44.6%) |
Disability Class: Self-Care Difficulty
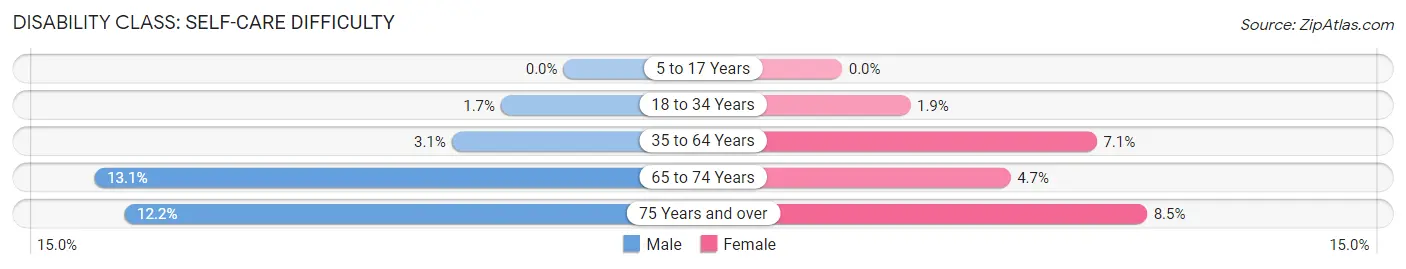
| Age Bracket | Male | Female |
| 5 to 17 Years | 0 (0.0%) | 0 (0.0%) |
| 18 to 34 Years | 13 (1.7%) | 21 (1.9%) |
| 35 to 64 Years | 55 (3.1%) | 135 (7.1%) |
| 65 to 74 Years | 70 (13.1%) | 29 (4.7%) |
| 75 Years and over | 46 (12.2%) | 53 (8.5%) |
Technology Access in Morehead City
Computing Device Access in Morehead City
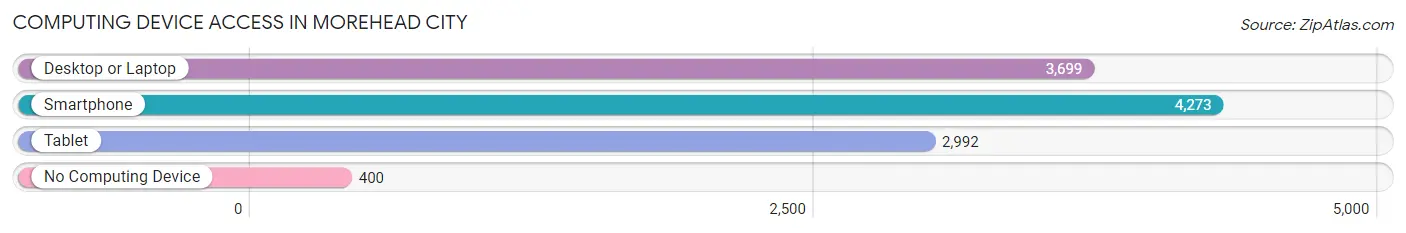
| Device Type | # Households | % Households |
| Desktop or Laptop | 3,699 | 74.6% |
| Smartphone | 4,273 | 86.1% |
| Tablet | 2,992 | 60.3% |
| No Computing Device | 400 | 8.1% |
| Total | 4,961 | 100.0% |
Internet Access in Morehead City
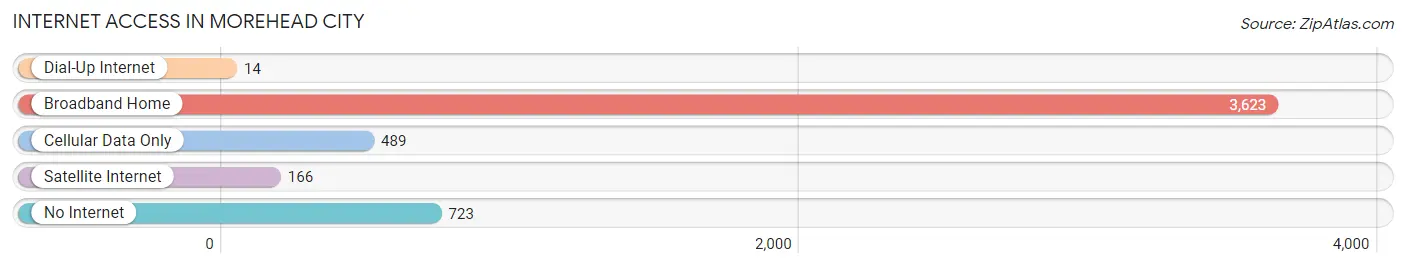
| Internet Type | # Households | % Households |
| Dial-Up Internet | 14 | 0.3% |
| Broadband Home | 3,623 | 73.0% |
| Cellular Data Only | 489 | 9.9% |
| Satellite Internet | 166 | 3.4% |
| No Internet | 723 | 14.6% |
| Total | 4,961 | 100.0% |
Morehead City Summary
Morehead City is a small city located in Carteret County, North Carolina. It is situated on the eastern coast of the state, along the shores of the Bogue Sound and the Atlantic Ocean. The city is part of the Crystal Coast region, which is known for its beautiful beaches and coastal scenery. Morehead City is a popular tourist destination, with a variety of attractions, activities, and events.
History
Morehead City was founded in 1857 by John Motley Morehead, a former governor of North Carolina. The city was named after him and was originally a small fishing village. In the late 19th century, the city began to grow and develop as a port town. It became a major shipping center for the region, with a large number of ships coming in and out of the harbor.
In the early 20th century, Morehead City was a popular destination for tourists. The city was home to a number of resorts and hotels, as well as a variety of attractions, such as the Morehead City Yacht Club and the Morehead City Country Club.
In the 1950s, the city began to experience a decline in its economy. The decline was due to the closure of the local military base and the decline of the fishing industry. However, in the late 1970s, the city began to experience a resurgence in its economy. This was due to the development of the local tourism industry, which has continued to grow and thrive in the city.
Geography
Morehead City is located in the eastern part of North Carolina, along the shores of the Bogue Sound and the Atlantic Ocean. The city is situated on a peninsula, which is surrounded by the Newport River, the White Oak River, and the Newport River Estuary. The city is located approximately 30 miles south of New Bern and approximately 50 miles north of Wilmington.
The city has a total area of 8.3 square miles, of which 7.9 square miles is land and 0.4 square miles is water. The city is located at an elevation of 10 feet above sea level.
Economy
Morehead City has a diverse economy, with a variety of industries and businesses. The city is home to a number of manufacturing companies, such as the Morehead City Shipyard and the Morehead City Container Terminal. The city is also home to a number of retail stores, restaurants, and other businesses.
The city is also home to a number of tourist attractions, such as the Morehead City Yacht Club, the Morehead City Country Club, and the North Carolina Aquarium at Pine Knoll Shores. The city is also home to a number of festivals and events, such as the Big Rock Blue Marlin Tournament and the Morehead City Music Festival.
Demographics
As of the 2010 census, Morehead City had a population of 8,661. The racial makeup of the city was 79.2% White, 14.3% African American, 0.4% Native American, 1.7% Asian, 0.1% Pacific Islander, 2.2% from other races, and 2.3% from two or more races. Hispanic or Latino of any race were 4.7% of the population.
The median income for a household in the city was $41,945, and the median income for a family was $50,945. The per capita income for the city was $25,945. About 11.2% of families and 14.3% of the population were below the poverty line, including 19.2% of those under age 18 and 8.2% of those age 65 or over.
Common Questions
What is Per Capita Income in Morehead City?
Per Capita income in Morehead City is $39,557.
What is the Median Family Income in Morehead City?
Median Family Income in Morehead City is $84,237.
What is the Median Household income in Morehead City?
Median Household Income in Morehead City is $51,716.
What is Income or Wage Gap in Morehead City?
Income or Wage Gap in Morehead City is 22.2%.
Women in Morehead City earn 77.8 cents for every dollar earned by a man.
What is Inequality or Gini Index in Morehead City?
Inequality or Gini Index in Morehead City is 0.48.
What is the Total Population of Morehead City?
Total Population of Morehead City is 9,632.
What is the Total Male Population of Morehead City?
Total Male Population of Morehead City is 4,446.
What is the Total Female Population of Morehead City?
Total Female Population of Morehead City is 5,186.
What is the Ratio of Males per 100 Females in Morehead City?
There are 85.73 Males per 100 Females in Morehead City.
What is the Ratio of Females per 100 Males in Morehead City?
There are 116.64 Females per 100 Males in Morehead City.
What is the Median Population Age in Morehead City?
Median Population Age in Morehead City is 46.3 Years.
What is the Average Family Size in Morehead City
Average Family Size in Morehead City is 2.7 People.
What is the Average Household Size in Morehead City
Average Household Size in Morehead City is 1.9 People.
How Large is the Labor Force in Morehead City?
There are 4,654 People in the Labor Forcein in Morehead City.
What is the Percentage of People in the Labor Force in Morehead City?
57.4% of People are in the Labor Force in Morehead City.
What is the Unemployment Rate in Morehead City?
Unemployment Rate in Morehead City is 3.7%.