Moravian Falls, NC Map & Demographics
Moravian Falls Map
Moravian Falls Overview
$33,471
PER CAPITA INCOME
$54,467
AVG FAMILY INCOME
$52,217
AVG HOUSEHOLD INCOME
0.35
INEQUALITY / GINI INDEX
1,023
TOTAL POPULATION
443
MALE POPULATION
580
FEMALE POPULATION
76.38
MALES / 100 FEMALES
130.93
FEMALES / 100 MALES
57.9
MEDIAN AGE
2.5
AVG FAMILY SIZE
1.6
AVG HOUSEHOLD SIZE
361
LABOR FORCE [ PEOPLE ]
40.6%
PERCENT IN LABOR FORCE
Moravian Falls Zip Codes
Moravian Falls Area Codes
Income in Moravian Falls
Income Overview in Moravian Falls
Per Capita Income in Moravian Falls is $33,471, while median incomes of families and households are $54,467 and $52,217 respectively.
| Characteristic | Number | Measure |
| Per Capita Income | 1,023 | $33,471 |
| Median Family Income | 251 | $54,467 |
| Mean Family Income | 251 | $79,962 |
| Median Household Income | 620 | $52,217 |
| Mean Household Income | 620 | $55,309 |
| Income Deficit | 251 | $0 |
| Wage / Income Gap (%) | 1,023 | 0.00% |
| Wage / Income Gap ($) | 1,023 | 100.00¢ per $1 |
| Gini / Inequality Index | 1,023 | 0.35 |
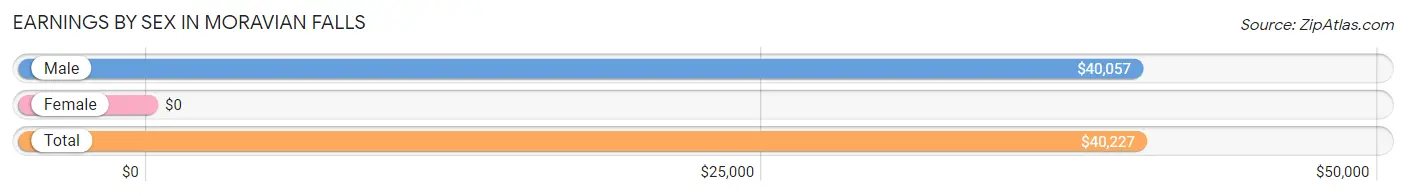
Earnings by Sex in Moravian Falls
| Sex | Number | Average Earnings |
| Male | 157 (42.7%) | $40,057 |
| Female | 211 (57.3%) | $0 |
| Total | 368 (100.0%) | $40,227 |
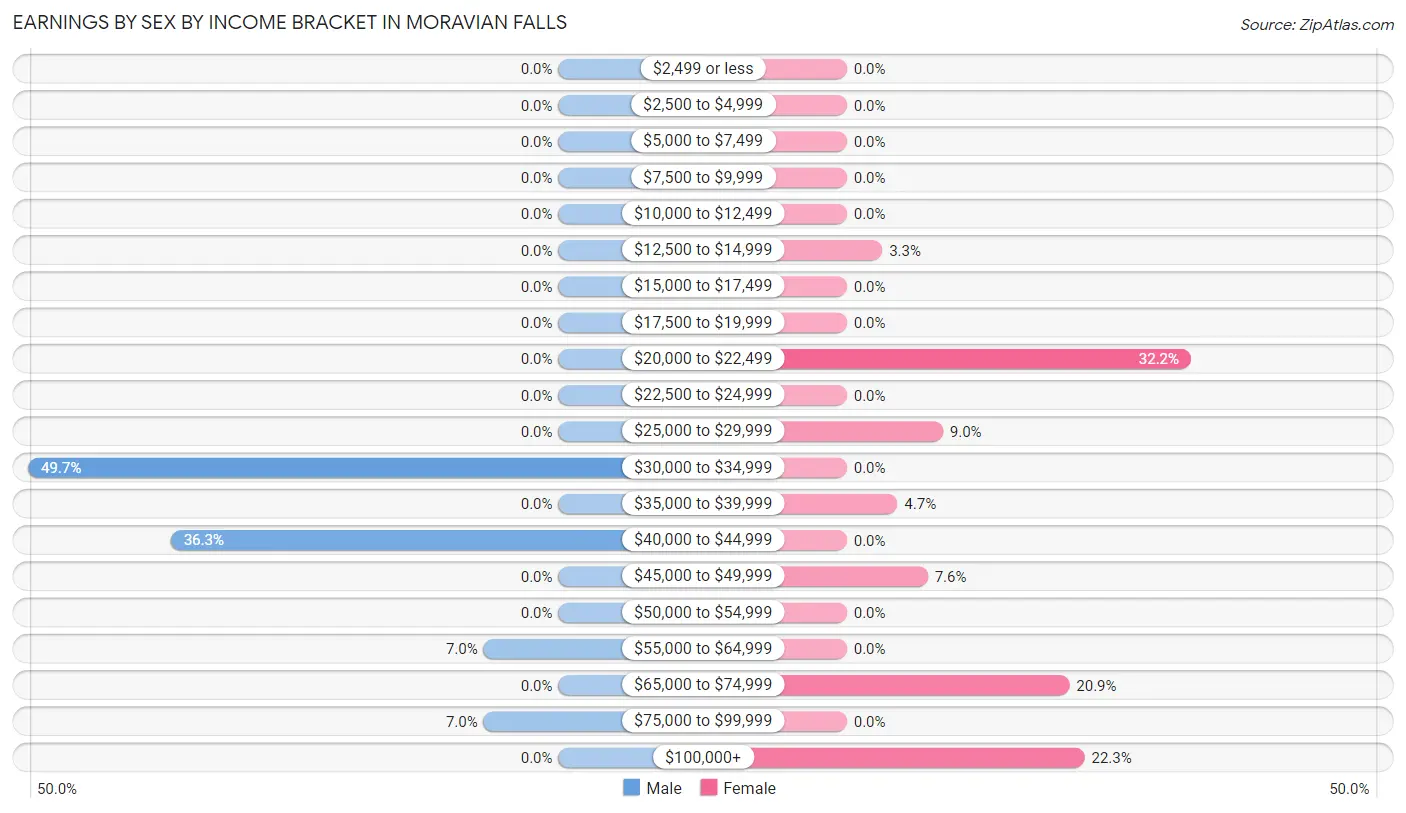
Earnings by Sex by Income Bracket in Moravian Falls
The most common earnings brackets in Moravian Falls are $30,000 to $34,999 for men (78 | 49.7%) and $20,000 to $22,499 for women (68 | 32.2%).
| Income | Male | Female |
| $2,499 or less | 0 (0.0%) | 0 (0.0%) |
| $2,500 to $4,999 | 0 (0.0%) | 0 (0.0%) |
| $5,000 to $7,499 | 0 (0.0%) | 0 (0.0%) |
| $7,500 to $9,999 | 0 (0.0%) | 0 (0.0%) |
| $10,000 to $12,499 | 0 (0.0%) | 0 (0.0%) |
| $12,500 to $14,999 | 0 (0.0%) | 7 (3.3%) |
| $15,000 to $17,499 | 0 (0.0%) | 0 (0.0%) |
| $17,500 to $19,999 | 0 (0.0%) | 0 (0.0%) |
| $20,000 to $22,499 | 0 (0.0%) | 68 (32.2%) |
| $22,500 to $24,999 | 0 (0.0%) | 0 (0.0%) |
| $25,000 to $29,999 | 0 (0.0%) | 19 (9.0%) |
| $30,000 to $34,999 | 78 (49.7%) | 0 (0.0%) |
| $35,000 to $39,999 | 0 (0.0%) | 10 (4.7%) |
| $40,000 to $44,999 | 57 (36.3%) | 0 (0.0%) |
| $45,000 to $49,999 | 0 (0.0%) | 16 (7.6%) |
| $50,000 to $54,999 | 0 (0.0%) | 0 (0.0%) |
| $55,000 to $64,999 | 11 (7.0%) | 0 (0.0%) |
| $65,000 to $74,999 | 0 (0.0%) | 44 (20.8%) |
| $75,000 to $99,999 | 11 (7.0%) | 0 (0.0%) |
| $100,000+ | 0 (0.0%) | 47 (22.3%) |
| Total | 157 (100.0%) | 211 (100.0%) |
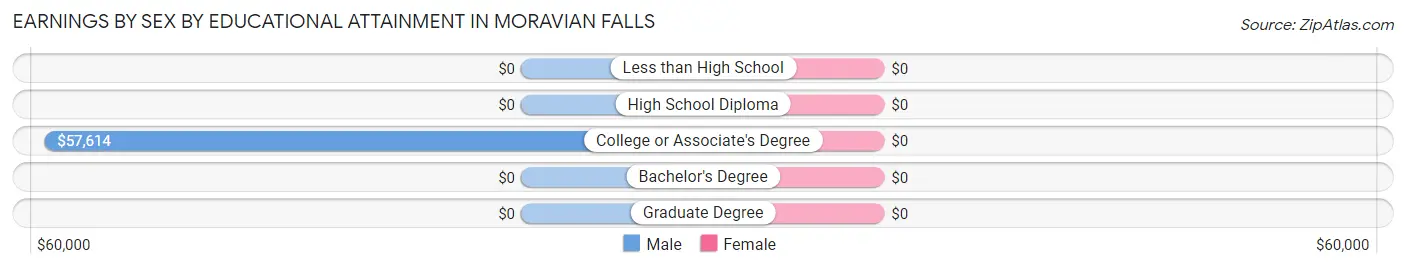
Earnings by Sex by Educational Attainment in Moravian Falls
| Educational Attainment | Male Income | Female Income |
| Less than High School | - | - |
| High School Diploma | - | - |
| College or Associate's Degree | $57,614 | $0 |
| Bachelor's Degree | - | - |
| Graduate Degree | - | - |
| Total | $41,477 | $0 |
Family Income in Moravian Falls
Family Income Brackets in Moravian Falls
According to the Moravian Falls family income data, there are 134 families falling into the $50,000 to $74,999 income range, which is the most common income bracket and makes up 53.4% of all families.
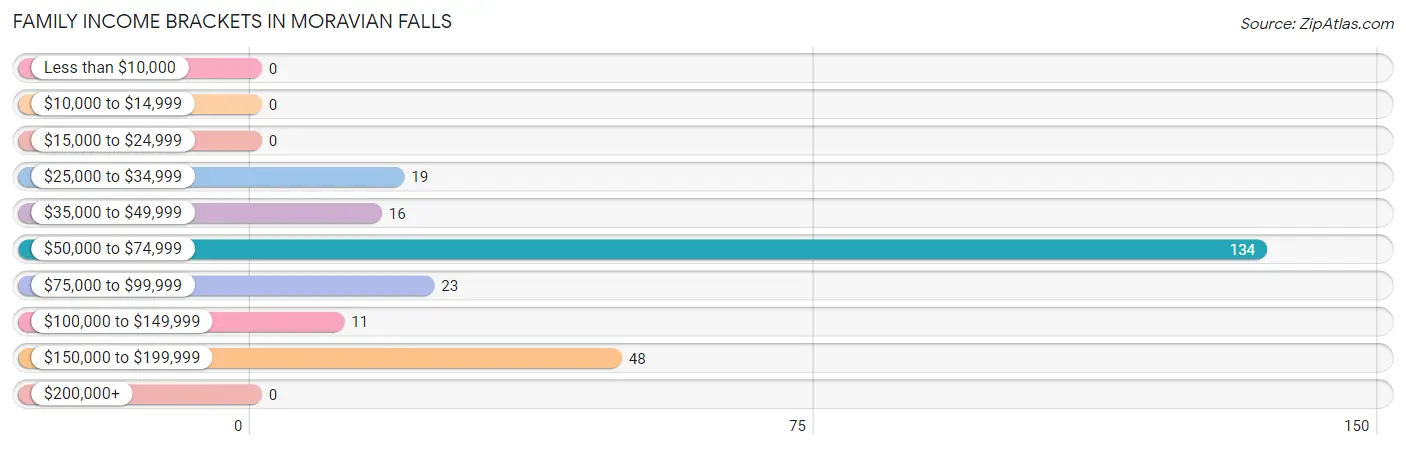
| Income Bracket | # Families | % Families |
| Less than $10,000 | 0 | 0.0% |
| $10,000 to $14,999 | 0 | 0.0% |
| $15,000 to $24,999 | 0 | 0.0% |
| $25,000 to $34,999 | 19 | 7.6% |
| $35,000 to $49,999 | 16 | 6.4% |
| $50,000 to $74,999 | 134 | 53.4% |
| $75,000 to $99,999 | 23 | 9.2% |
| $100,000 to $149,999 | 11 | 4.4% |
| $150,000 to $199,999 | 48 | 19.1% |
| $200,000+ | 0 | 0.0% |
Family Income by Famaliy Size in Moravian Falls
2-person families (91 | 36.2%) account for the highest median family income in Moravian Falls with $71,382 per family, while 2-person families (91 | 36.2%) have the highest median income of $35,691 per family member.
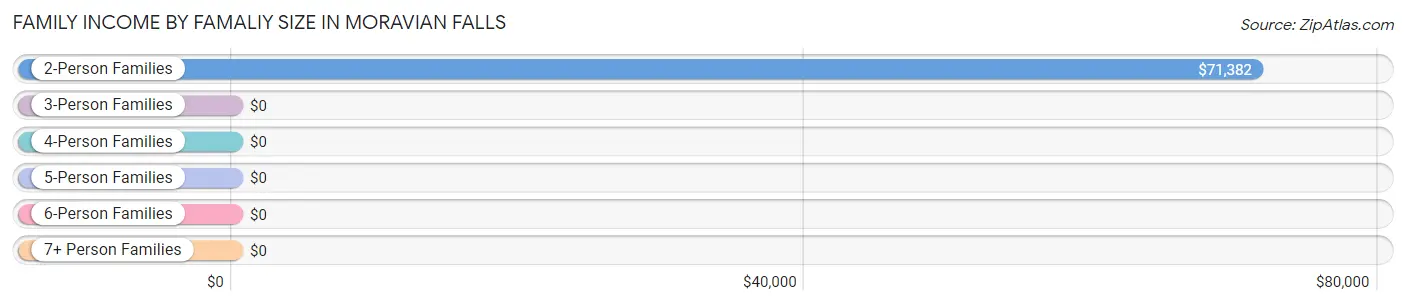
| Income Bracket | # Families | Median Income |
| 2-Person Families | 91 (36.2%) | $71,382 |
| 3-Person Families | 160 (63.7%) | $0 |
| 4-Person Families | 0 (0.0%) | $0 |
| 5-Person Families | 0 (0.0%) | $0 |
| 6-Person Families | 0 (0.0%) | $0 |
| 7+ Person Families | 0 (0.0%) | $0 |
| Total | 251 (100.0%) | $54,467 |
Family Income by Number of Earners in Moravian Falls
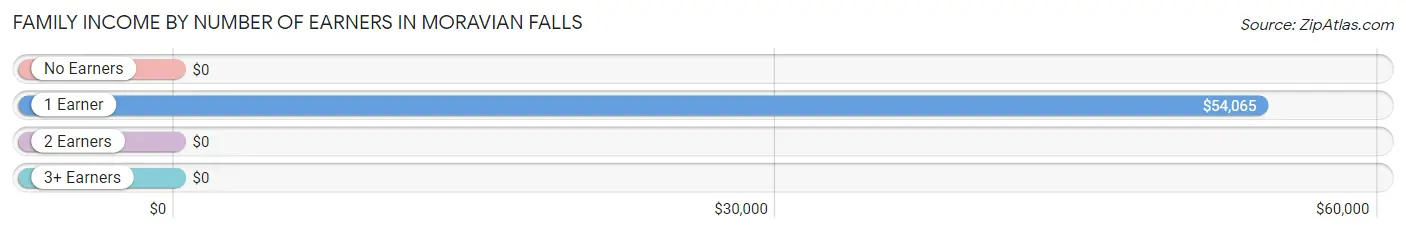
| Number of Earners | # Families | Median Income |
| No Earners | 12 (4.8%) | $0 |
| 1 Earner | 214 (85.3%) | $54,065 |
| 2 Earners | 25 (10.0%) | $0 |
| 3+ Earners | 0 (0.0%) | $0 |
| Total | 251 (100.0%) | $54,467 |
Household Income in Moravian Falls
Household Income Brackets in Moravian Falls
With 275 households falling in the category, the $50,000 to $74,999 income range is the most frequent in Moravian Falls, accounting for 44.4% of all households.
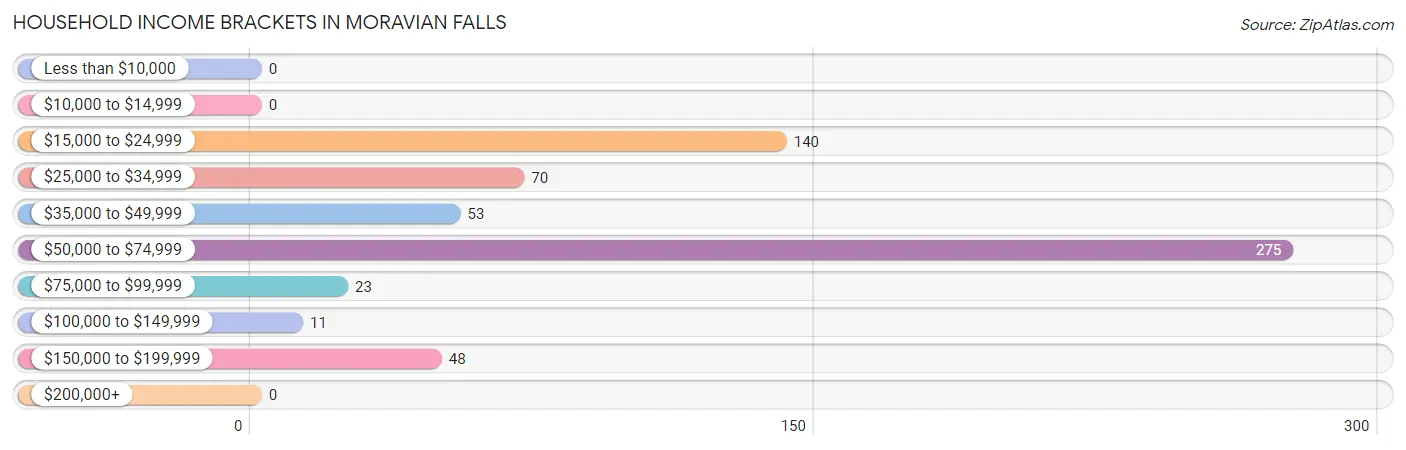
| Income Bracket | # Households | % Households |
| Less than $10,000 | 0 | 0.0% |
| $10,000 to $14,999 | 0 | 0.0% |
| $15,000 to $24,999 | 140 | 22.6% |
| $25,000 to $34,999 | 70 | 11.3% |
| $35,000 to $49,999 | 53 | 8.5% |
| $50,000 to $74,999 | 275 | 44.4% |
| $75,000 to $99,999 | 23 | 3.7% |
| $100,000 to $149,999 | 11 | 1.8% |
| $150,000 to $199,999 | 48 | 7.7% |
| $200,000+ | 0 | 0.0% |
Household Income by Householder Age in Moravian Falls
The median household income in Moravian Falls is $52,217, with the highest median household income of $50,755 found in the 65+ years age bracket for the primary householder. A total of 180 households (29.0%) fall into this category.
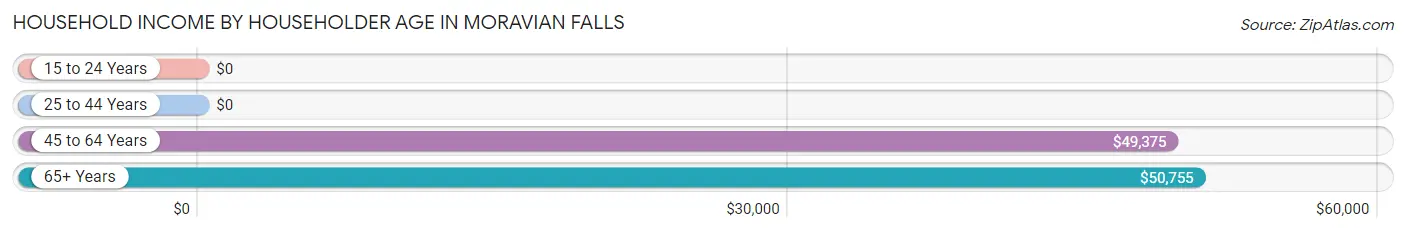
| Income Bracket | # Households | Median Income |
| 15 to 24 Years | 0 (0.0%) | $0 |
| 25 to 44 Years | 108 (17.4%) | $0 |
| 45 to 64 Years | 332 (53.5%) | $49,375 |
| 65+ Years | 180 (29.0%) | $50,755 |
| Total | 620 (100.0%) | $52,217 |
Poverty in Moravian Falls
Income Below Poverty by Sex and Age in Moravian Falls
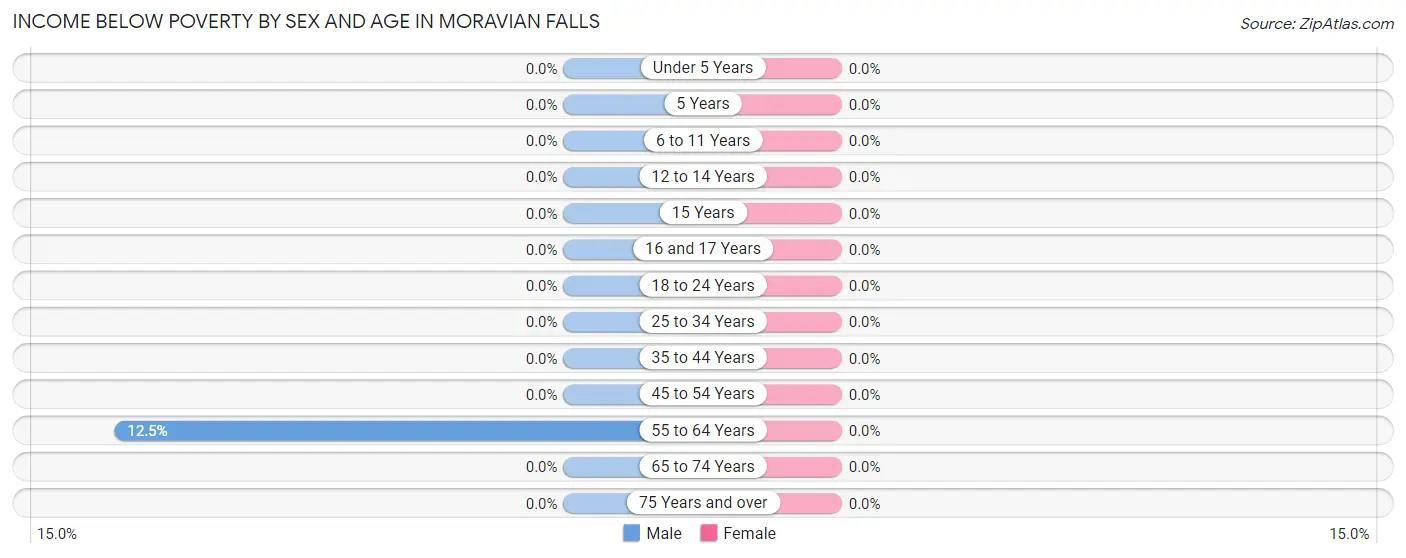
| Age Bracket | Male | Female |
| Under 5 Years | 0 (0.0%) | 0 (0.0%) |
| 5 Years | 0 (0.0%) | 0 (0.0%) |
| 6 to 11 Years | 0 (0.0%) | 0 (0.0%) |
| 12 to 14 Years | 0 (0.0%) | 0 (0.0%) |
| 15 Years | 0 (0.0%) | 0 (0.0%) |
| 16 and 17 Years | 0 (0.0%) | 0 (0.0%) |
| 18 to 24 Years | 0 (0.0%) | 0 (0.0%) |
| 25 to 34 Years | 0 (0.0%) | 0 (0.0%) |
| 35 to 44 Years | 0 (0.0%) | 0 (0.0%) |
| 45 to 54 Years | 0 (0.0%) | 0 (0.0%) |
| 55 to 64 Years | 20 (12.5%) | 0 (0.0%) |
| 65 to 74 Years | 0 (0.0%) | 0 (0.0%) |
| 75 Years and over | 0 (0.0%) | 0 (0.0%) |
| Total | 20 (4.5%) | 0 (0.0%) |
Income Above Poverty by Sex and Age in Moravian Falls
According to the poverty statistics in Moravian Falls, males aged 18 to 24 years and females aged 6 to 11 years are the age groups that are most secure financially, with 100.0% of males and 100.0% of females in these age groups living above the poverty line.
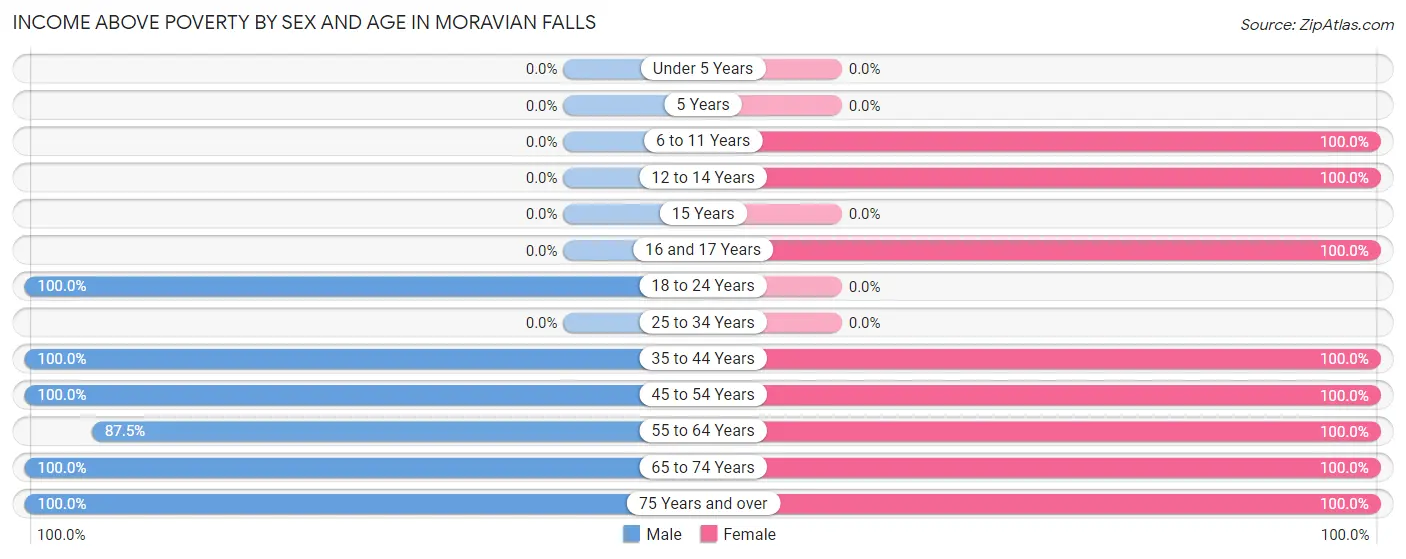
| Age Bracket | Male | Female |
| Under 5 Years | 0 (0.0%) | 0 (0.0%) |
| 5 Years | 0 (0.0%) | 0 (0.0%) |
| 6 to 11 Years | 0 (0.0%) | 107 (100.0%) |
| 12 to 14 Years | 0 (0.0%) | 27 (100.0%) |
| 15 Years | 0 (0.0%) | 0 (0.0%) |
| 16 and 17 Years | 0 (0.0%) | 12 (100.0%) |
| 18 to 24 Years | 25 (100.0%) | 0 (0.0%) |
| 25 to 34 Years | 0 (0.0%) | 0 (0.0%) |
| 35 to 44 Years | 64 (100.0%) | 107 (100.0%) |
| 45 to 54 Years | 43 (100.0%) | 97 (100.0%) |
| 55 to 64 Years | 140 (87.5%) | 144 (100.0%) |
| 65 to 74 Years | 104 (100.0%) | 48 (100.0%) |
| 75 Years and over | 47 (100.0%) | 38 (100.0%) |
| Total | 423 (95.5%) | 580 (100.0%) |
Income Below Poverty Among Married-Couple Families in Moravian Falls
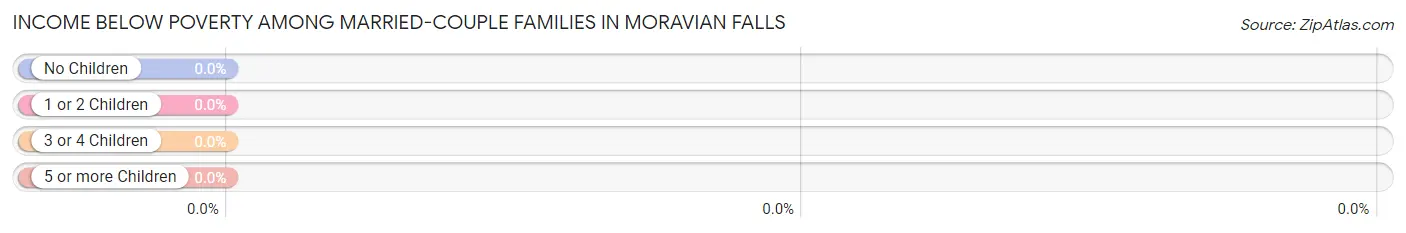
| Children | Above Poverty | Below Poverty |
| No Children | 37 (100.0%) | 0 (0.0%) |
| 1 or 2 Children | 126 (100.0%) | 0 (0.0%) |
| 3 or 4 Children | 0 (0.0%) | 0 (0.0%) |
| 5 or more Children | 0 (0.0%) | 0 (0.0%) |
| Total | 163 (100.0%) | 0 (0.0%) |
Income Below Poverty Among Single-Parent Households in Moravian Falls
| Children | Single Father | Single Mother |
| No Children | 0 (0.0%) | 0 (0.0%) |
| 1 or 2 Children | 0 (0.0%) | 0 (0.0%) |
| 3 or 4 Children | 0 (0.0%) | 0 (0.0%) |
| 5 or more Children | 0 (0.0%) | 0 (0.0%) |
| Total | 0 (0.0%) | 0 (0.0%) |
Income Below Poverty Among Married-Couple vs Single-Parent Households in Moravian Falls
| Children | Married-Couple Families | Single-Parent Households |
| No Children | 0 (0.0%) | 0 (0.0%) |
| 1 or 2 Children | 0 (0.0%) | 0 (0.0%) |
| 3 or 4 Children | 0 (0.0%) | 0 (0.0%) |
| 5 or more Children | 0 (0.0%) | 0 (0.0%) |
| Total | 0 (0.0%) | 0 (0.0%) |
Race in Moravian Falls
The most populous races in Moravian Falls are White / Caucasian (650 | 63.5%), Hispanic or Latino (284 | 27.8%), and Two or more Races (190 | 18.6%).
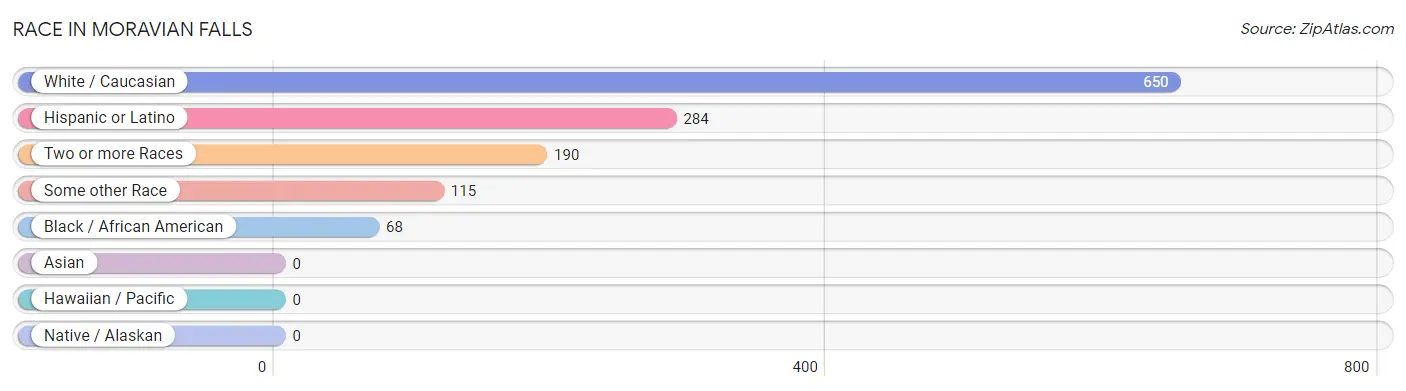
| Race | # Population | % Population |
| Asian | 0 | 0.0% |
| Black / African American | 68 | 6.7% |
| Hawaiian / Pacific | 0 | 0.0% |
| Hispanic or Latino | 284 | 27.8% |
| Native / Alaskan | 0 | 0.0% |
| White / Caucasian | 650 | 63.5% |
| Two or more Races | 190 | 18.6% |
| Some other Race | 115 | 11.2% |
| Total | 1,023 | 100.0% |
Ancestry in Moravian Falls
The most populous ancestries reported in Moravian Falls are English (239 | 23.4%), American (151 | 14.8%), German (145 | 14.2%), Puerto Rican (131 | 12.8%), and Mexican (107 | 10.5%), together accounting for 75.6% of all Moravian Falls residents.
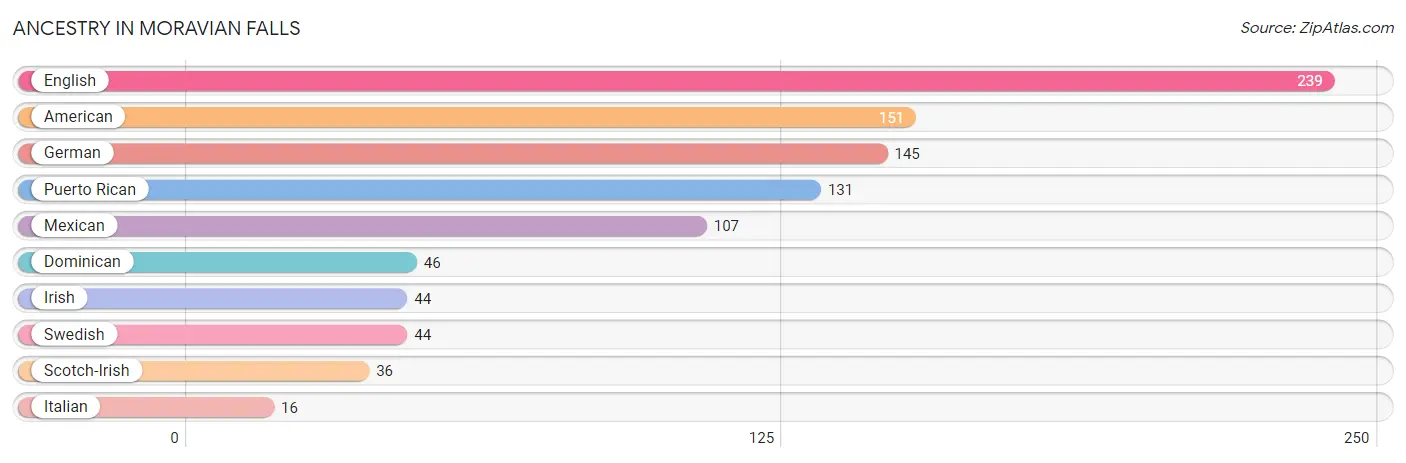
| Ancestry | # Population | % Population |
| American | 151 | 14.8% |
| Dominican | 46 | 4.5% |
| English | 239 | 23.4% |
| German | 145 | 14.2% |
| Irish | 44 | 4.3% |
| Italian | 16 | 1.6% |
| Mexican | 107 | 10.5% |
| Puerto Rican | 131 | 12.8% |
| Scotch-Irish | 36 | 3.5% |
| Swedish | 44 | 4.3% | View All 10 Rows |
Immigrants in Moravian Falls

| Immigration Origin | # Population | % Population | View All 0 Rows |
Sex and Age in Moravian Falls
Sex and Age in Moravian Falls
The most populous age groups in Moravian Falls are 55 to 59 Years (146 | 33.0%) for men and 55 to 59 Years (144 | 24.8%) for women.
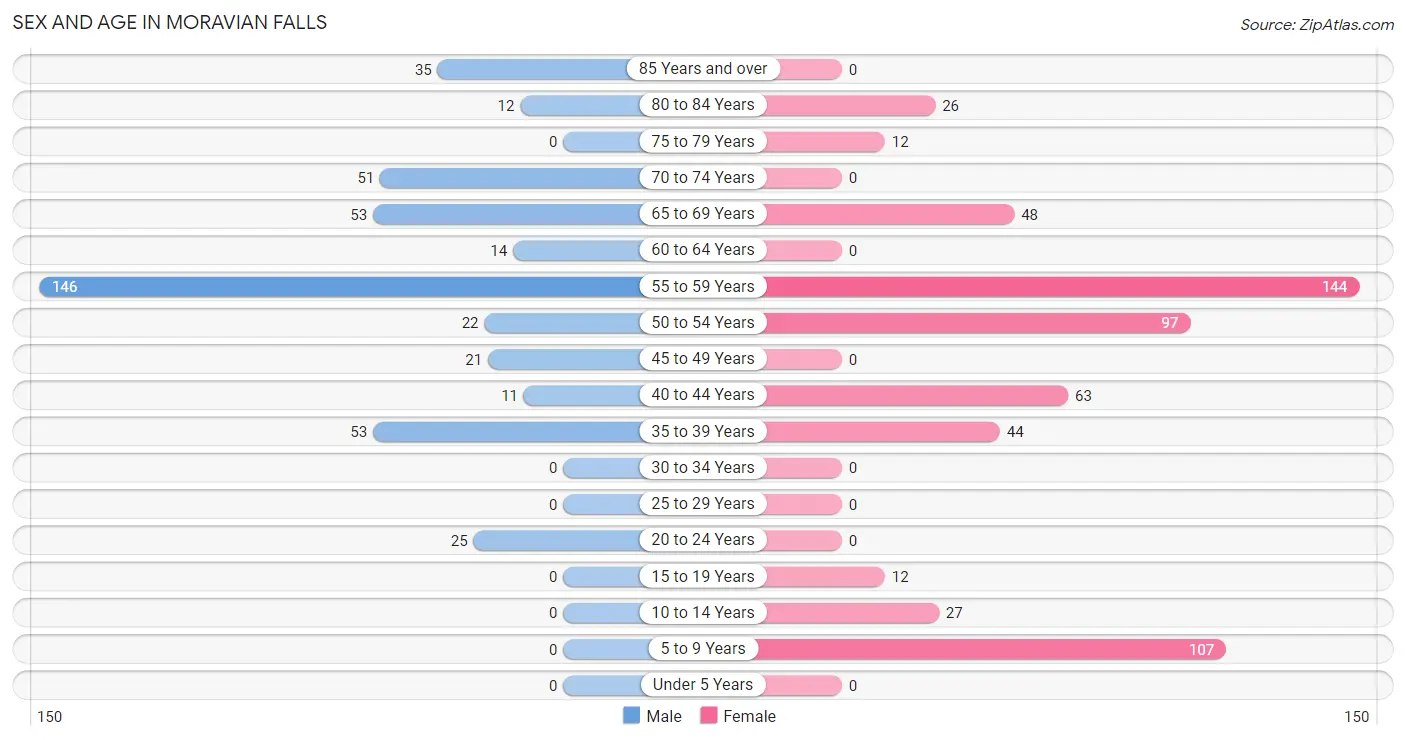
| Age Bracket | Male | Female |
| Under 5 Years | 0 (0.0%) | 0 (0.0%) |
| 5 to 9 Years | 0 (0.0%) | 107 (18.4%) |
| 10 to 14 Years | 0 (0.0%) | 27 (4.7%) |
| 15 to 19 Years | 0 (0.0%) | 12 (2.1%) |
| 20 to 24 Years | 25 (5.6%) | 0 (0.0%) |
| 25 to 29 Years | 0 (0.0%) | 0 (0.0%) |
| 30 to 34 Years | 0 (0.0%) | 0 (0.0%) |
| 35 to 39 Years | 53 (12.0%) | 44 (7.6%) |
| 40 to 44 Years | 11 (2.5%) | 63 (10.9%) |
| 45 to 49 Years | 21 (4.7%) | 0 (0.0%) |
| 50 to 54 Years | 22 (5.0%) | 97 (16.7%) |
| 55 to 59 Years | 146 (33.0%) | 144 (24.8%) |
| 60 to 64 Years | 14 (3.2%) | 0 (0.0%) |
| 65 to 69 Years | 53 (12.0%) | 48 (8.3%) |
| 70 to 74 Years | 51 (11.5%) | 0 (0.0%) |
| 75 to 79 Years | 0 (0.0%) | 12 (2.1%) |
| 80 to 84 Years | 12 (2.7%) | 26 (4.5%) |
| 85 Years and over | 35 (7.9%) | 0 (0.0%) |
| Total | 443 (100.0%) | 580 (100.0%) |
Families and Households in Moravian Falls
Median Family Size in Moravian Falls
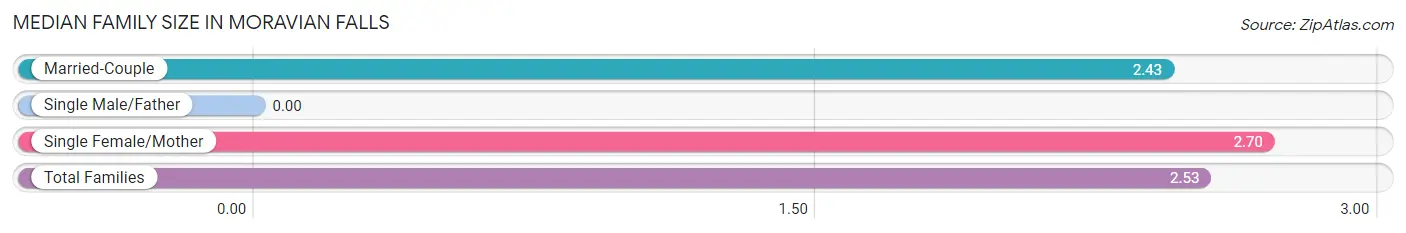
| Family Type | # Families | Family Size |
| Married-Couple | 163 (64.9%) | 2.43 |
| Single Male/Father | 0 (0.0%) | - |
| Single Female/Mother | 88 (35.1%) | 2.70 |
| Total Families | 251 (100.0%) | 2.53 |
Median Household Size in Moravian Falls
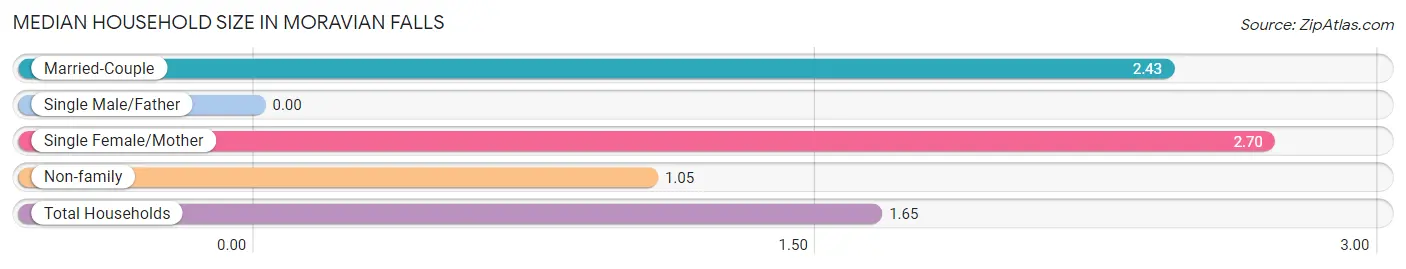
| Household Type | # Households | Household Size |
| Married-Couple | 163 (26.3%) | 2.43 |
| Single Male/Father | 0 (0.0%) | - |
| Single Female/Mother | 88 (14.2%) | 2.70 |
| Non-family | 369 (59.5%) | 1.05 |
| Total Households | 620 (100.0%) | 1.65 |
Household Size by Marriage Status in Moravian Falls
Out of a total of 620 households in Moravian Falls, 251 (40.5%) are family households, while 369 (59.5%) are nonfamily households. The most numerous type of family households are 3-person households, comprising 160, and the most common type of nonfamily households are 1-person households, comprising 353.
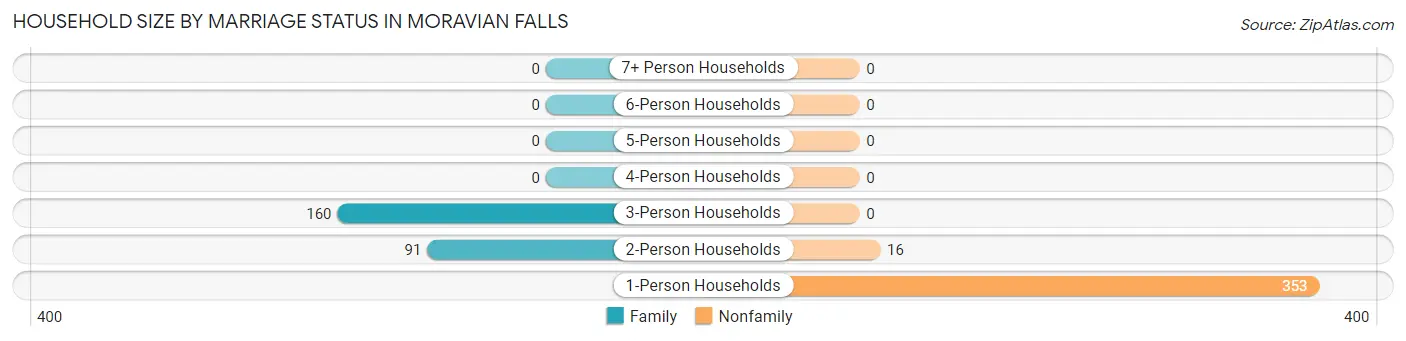
| Household Size | Family Households | Nonfamily Households |
| 1-Person Households | - | 353 (56.9%) |
| 2-Person Households | 91 (14.7%) | 16 (2.6%) |
| 3-Person Households | 160 (25.8%) | 0 (0.0%) |
| 4-Person Households | 0 (0.0%) | 0 (0.0%) |
| 5-Person Households | 0 (0.0%) | 0 (0.0%) |
| 6-Person Households | 0 (0.0%) | 0 (0.0%) |
| 7+ Person Households | 0 (0.0%) | 0 (0.0%) |
| Total | 251 (40.5%) | 369 (59.5%) |
Female Fertility in Moravian Falls
Fertility by Age in Moravian Falls
| Age Bracket | Women with Births | Births / 1,000 Women |
| 15 to 19 years | 0 (0.0%) | 0.0 |
| 20 to 34 years | 0 (0.0%) | 0.0 |
| 35 to 50 years | 0 (0.0%) | 0.0 |
| Total | 0 (0.0%) | 0.0 |
Fertility by Age by Marriage Status in Moravian Falls
| Age Bracket | Married | Unmarried |
| 15 to 19 years | 0 (0.0%) | 0 (0.0%) |
| 20 to 34 years | 0 (0.0%) | 0 (0.0%) |
| 35 to 50 years | 0 (0.0%) | 0 (0.0%) |
| Total | 0 (0.0%) | 0 (0.0%) |
Fertility by Education in Moravian Falls
| Educational Attainment | Women with Births | Births / 1,000 Women |
| Less than High School | 0 (0.0%) | 0.0 |
| High School Diploma | 0 (0.0%) | 0.0 |
| College or Associate's Degree | 0 (0.0%) | 0.0 |
| Bachelor's Degree | 0 (0.0%) | 0.0 |
| Graduate Degree | 0 (0.0%) | 0.0 |
| Total | 0 (0.0%) | 0.0 |
Fertility by Education by Marriage Status in Moravian Falls
| Educational Attainment | Married | Unmarried |
| Less than High School | 0 (0.0%) | 0 (0.0%) |
| High School Diploma | 0 (0.0%) | 0 (0.0%) |
| College or Associate's Degree | 0 (0.0%) | 0 (0.0%) |
| Bachelor's Degree | 0 (0.0%) | 0 (0.0%) |
| Graduate Degree | 0 (0.0%) | 0 (0.0%) |
| Total | 0 (0.0%) | 0 (0.0%) |
Employment Characteristics in Moravian Falls
Employment by Class of Employer in Moravian Falls
Among the 361 employed individuals in Moravian Falls, private company employees (336 | 93.1%), and state government employees (25 | 6.9%) make up the most common classes of employment.
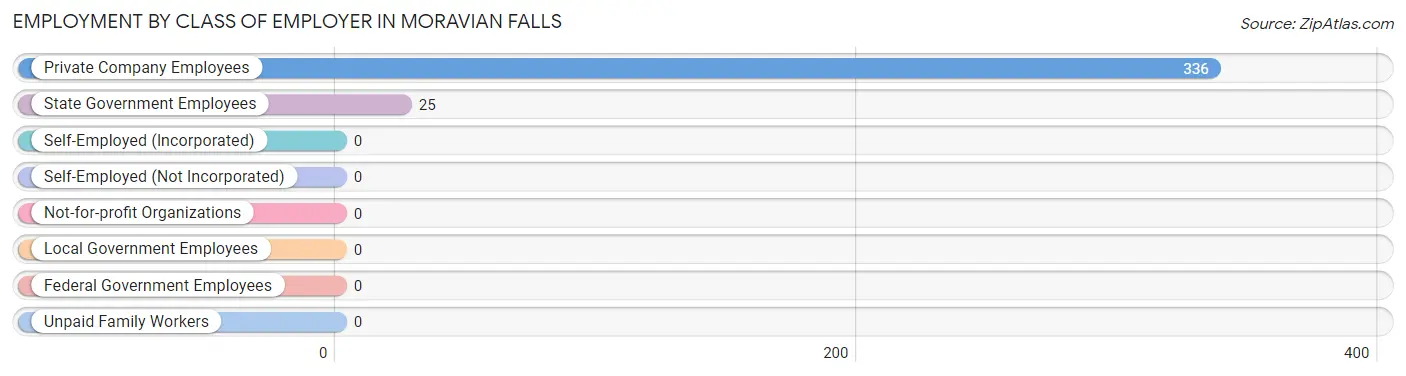
| Employer Class | # Employees | % Employees |
| Private Company Employees | 336 | 93.1% |
| Self-Employed (Incorporated) | 0 | 0.0% |
| Self-Employed (Not Incorporated) | 0 | 0.0% |
| Not-for-profit Organizations | 0 | 0.0% |
| Local Government Employees | 0 | 0.0% |
| State Government Employees | 25 | 6.9% |
| Federal Government Employees | 0 | 0.0% |
| Unpaid Family Workers | 0 | 0.0% |
| Total | 361 | 100.0% |
Employment Status by Age in Moravian Falls
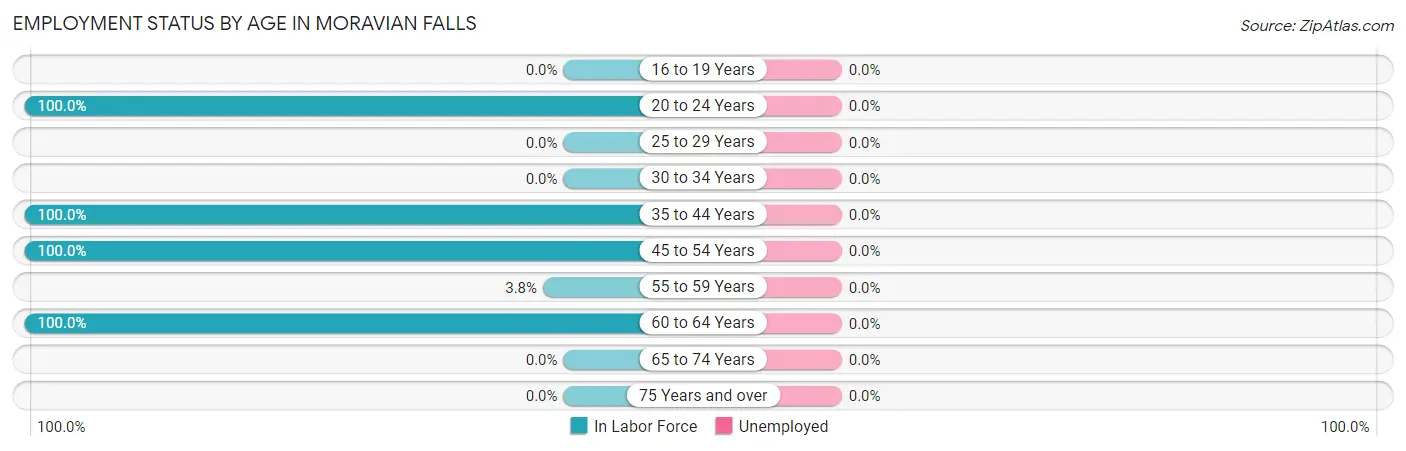
| Age Bracket | In Labor Force | Unemployed |
| 16 to 19 Years | 0 (0.0%) | 0 (0.0%) |
| 20 to 24 Years | 25 (100.0%) | 0 (0.0%) |
| 25 to 29 Years | 0 (0.0%) | 0 (0.0%) |
| 30 to 34 Years | 0 (0.0%) | 0 (0.0%) |
| 35 to 44 Years | 171 (100.0%) | 0 (0.0%) |
| 45 to 54 Years | 140 (100.0%) | 0 (0.0%) |
| 55 to 59 Years | 11 (3.8%) | 0 (0.0%) |
| 60 to 64 Years | 14 (100.0%) | 0 (0.0%) |
| 65 to 74 Years | 0 (0.0%) | 0 (0.0%) |
| 75 Years and over | 0 (0.0%) | 0 (0.0%) |
| Total | 361 (40.6%) | 0 (0.0%) |
Employment Status by Educational Attainment in Moravian Falls
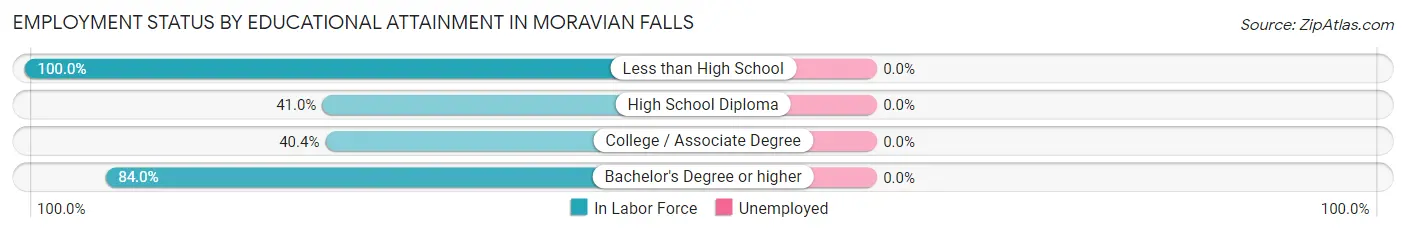
| Educational Attainment | In Labor Force | Unemployed |
| Less than High School | 53 (100.0%) | 0 (0.0%) |
| High School Diploma | 100 (41.0%) | 0 (0.0%) |
| College / Associate Degree | 78 (40.4%) | 0 (0.0%) |
| Bachelor's Degree or higher | 105 (84.0%) | 0 (0.0%) |
| Total | 336 (54.6%) | 0 (0.0%) |
Employment Occupations by Sex in Moravian Falls
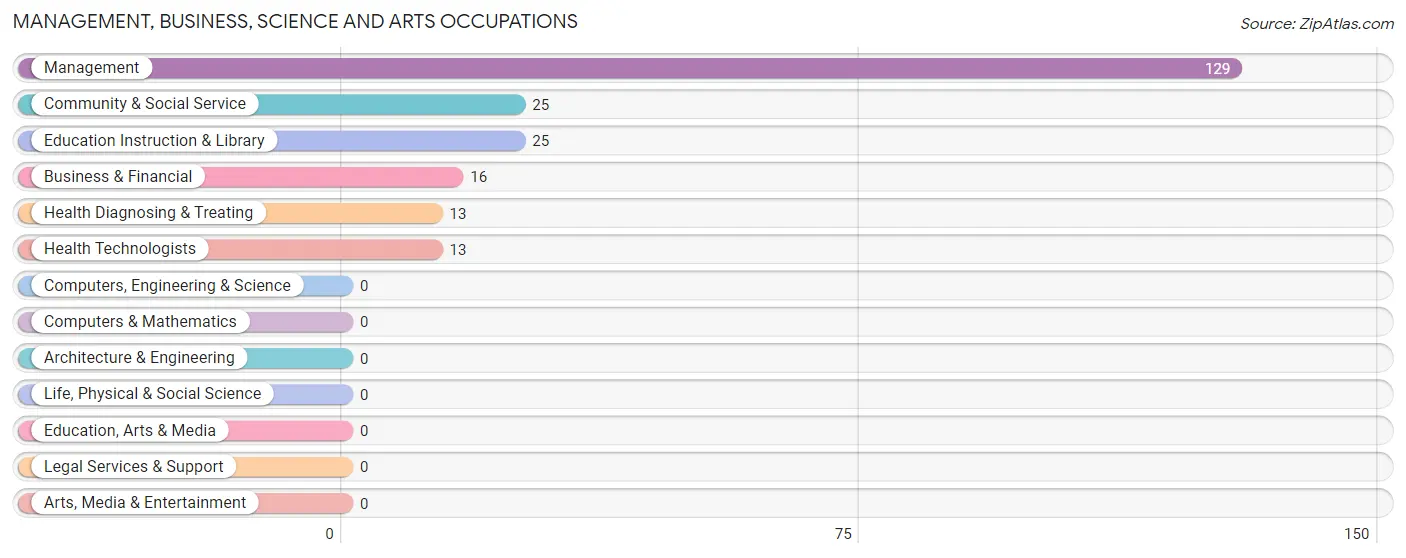
Management, Business, Science and Arts Occupations
The most common Management, Business, Science and Arts occupations in Moravian Falls are Management (129 | 35.7%), Community & Social Service (25 | 6.9%), Education Instruction & Library (25 | 6.9%), Business & Financial (16 | 4.4%), and Health Diagnosing & Treating (13 | 3.6%).
Management, Business, Science and Arts Occupations by Sex
Within the Management, Business, Science and Arts occupations in Moravian Falls, the most male-oriented occupations are Community & Social Service (100.0%), Education Instruction & Library (100.0%), and Management (24.8%), while the most female-oriented occupations are Business & Financial (100.0%), Health Diagnosing & Treating (100.0%), and Health Technologists (100.0%).
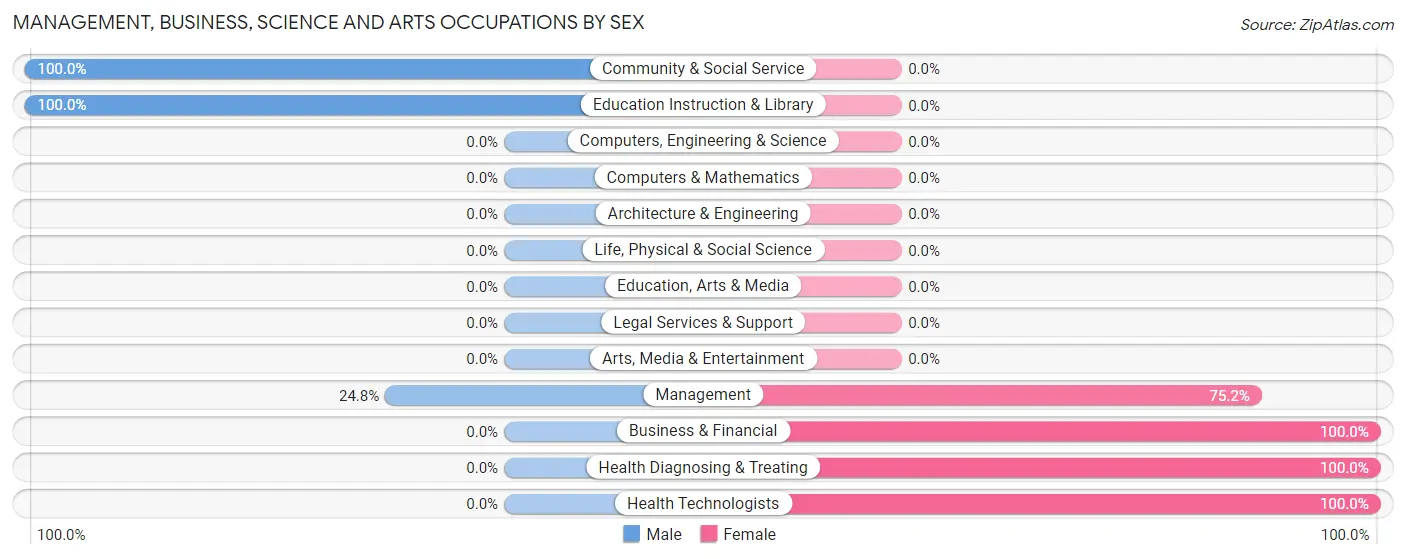
| Occupation | Male | Female |
| Management | 32 (24.8%) | 97 (75.2%) |
| Business & Financial | 0 (0.0%) | 16 (100.0%) |
| Computers, Engineering & Science | 0 (0.0%) | 0 (0.0%) |
| Computers & Mathematics | 0 (0.0%) | 0 (0.0%) |
| Architecture & Engineering | 0 (0.0%) | 0 (0.0%) |
| Life, Physical & Social Science | 0 (0.0%) | 0 (0.0%) |
| Community & Social Service | 25 (100.0%) | 0 (0.0%) |
| Education, Arts & Media | 0 (0.0%) | 0 (0.0%) |
| Legal Services & Support | 0 (0.0%) | 0 (0.0%) |
| Education Instruction & Library | 25 (100.0%) | 0 (0.0%) |
| Arts, Media & Entertainment | 0 (0.0%) | 0 (0.0%) |
| Health Diagnosing & Treating | 0 (0.0%) | 13 (100.0%) |
| Health Technologists | 0 (0.0%) | 13 (100.0%) |
| Total (Category) | 57 (31.1%) | 126 (68.9%) |
| Total (Overall) | 157 (43.5%) | 204 (56.5%) |
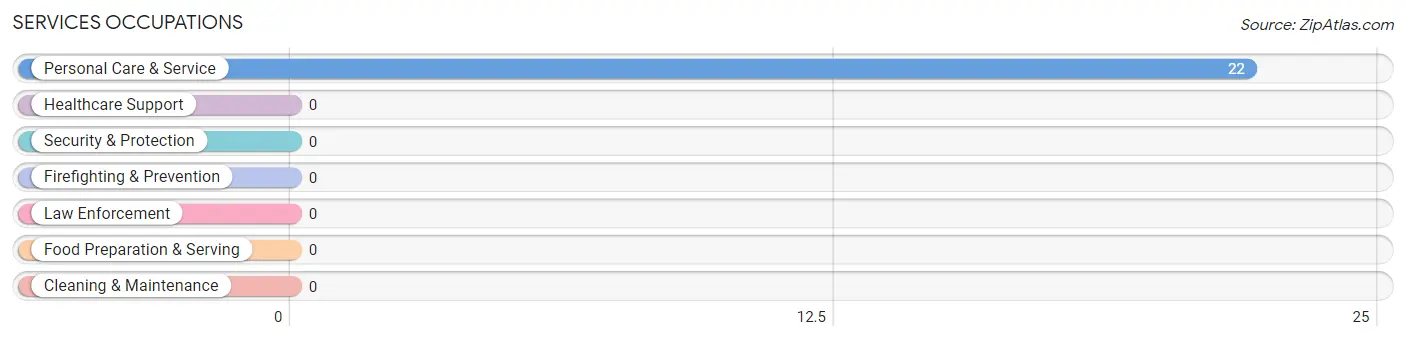
Services Occupations
The most common Services occupations in Moravian Falls are , and Personal Care & Service (22 | 6.1%).
Services Occupations by Sex
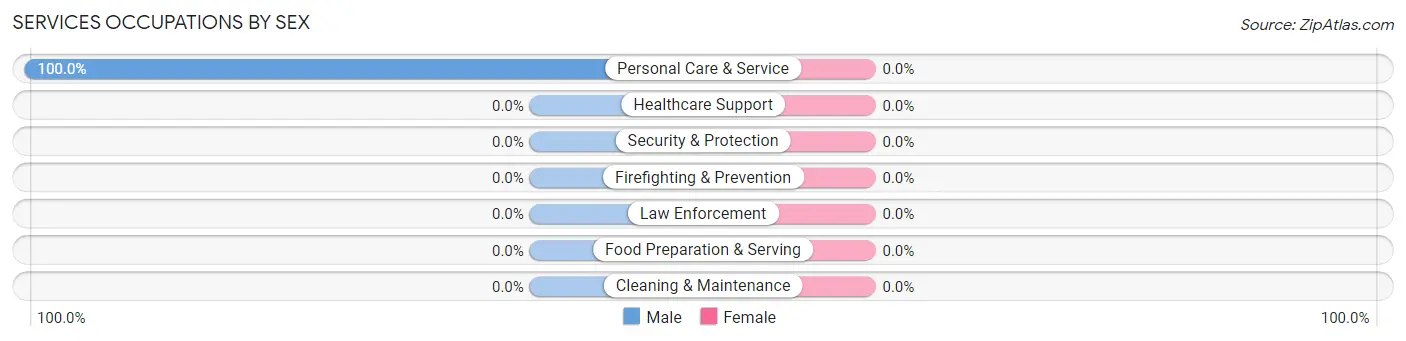
| Occupation | Male | Female |
| Healthcare Support | 0 (0.0%) | 0 (0.0%) |
| Security & Protection | 0 (0.0%) | 0 (0.0%) |
| Firefighting & Prevention | 0 (0.0%) | 0 (0.0%) |
| Law Enforcement | 0 (0.0%) | 0 (0.0%) |
| Food Preparation & Serving | 0 (0.0%) | 0 (0.0%) |
| Cleaning & Maintenance | 0 (0.0%) | 0 (0.0%) |
| Personal Care & Service | 22 (100.0%) | 0 (0.0%) |
| Total (Category) | 22 (100.0%) | 0 (0.0%) |
| Total (Overall) | 157 (43.5%) | 204 (56.5%) |
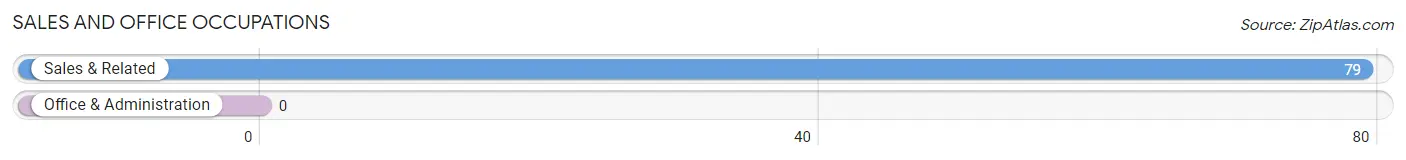
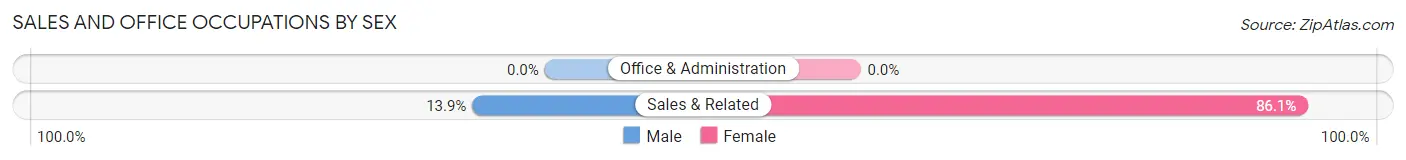
Sales and Office Occupations
The most common Sales and Office occupations in Moravian Falls are , and Sales & Related (79 | 21.9%).
Sales and Office Occupations by Sex
| Occupation | Male | Female |
| Sales & Related | 11 (13.9%) | 68 (86.1%) |
| Office & Administration | 0 (0.0%) | 0 (0.0%) |
| Total (Category) | 11 (13.9%) | 68 (86.1%) |
| Total (Overall) | 157 (43.5%) | 204 (56.5%) |
Natural Resources, Construction and Maintenance Occupations
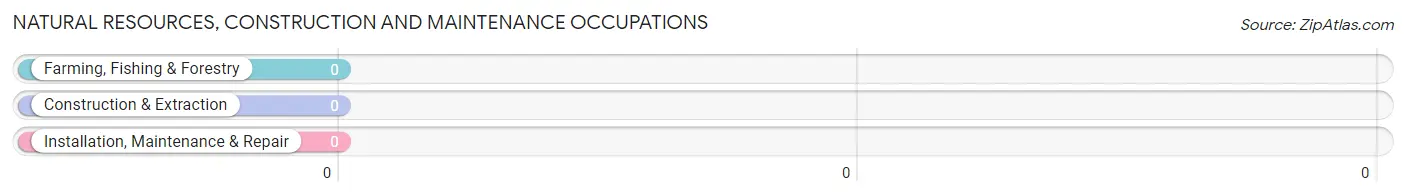
Natural Resources, Construction and Maintenance Occupations by Sex
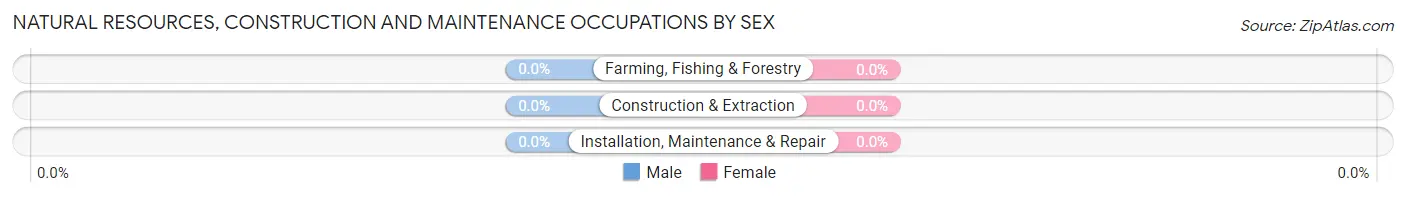
| Occupation | Male | Female |
| Farming, Fishing & Forestry | 0 (0.0%) | 0 (0.0%) |
| Construction & Extraction | 0 (0.0%) | 0 (0.0%) |
| Installation, Maintenance & Repair | 0 (0.0%) | 0 (0.0%) |
| Total (Category) | 0 (0.0%) | 0 (0.0%) |
| Total (Overall) | 157 (43.5%) | 204 (56.5%) |
Production, Transportation and Moving Occupations
The most common Production, Transportation and Moving occupations in Moravian Falls are Material Moving (63 | 17.4%), and Transportation (14 | 3.9%).
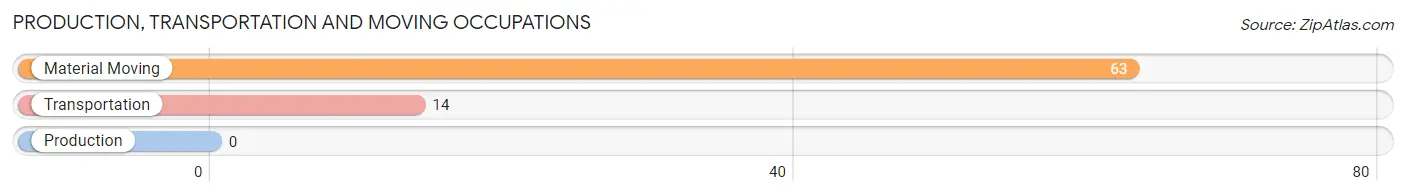
Production, Transportation and Moving Occupations by Sex
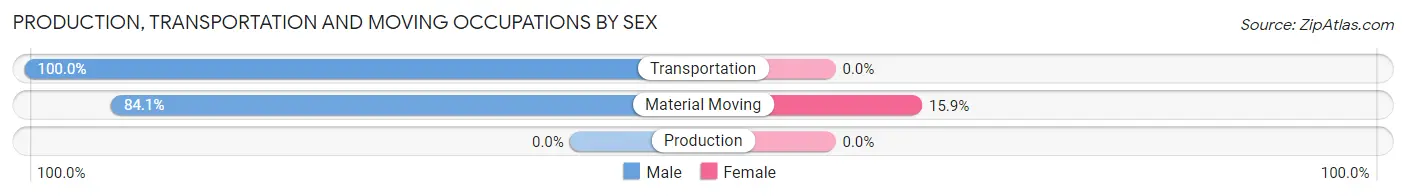
| Occupation | Male | Female |
| Production | 0 (0.0%) | 0 (0.0%) |
| Transportation | 14 (100.0%) | 0 (0.0%) |
| Material Moving | 53 (84.1%) | 10 (15.9%) |
| Total (Category) | 67 (87.0%) | 10 (13.0%) |
| Total (Overall) | 157 (43.5%) | 204 (56.5%) |
Employment Industries by Sex in Moravian Falls
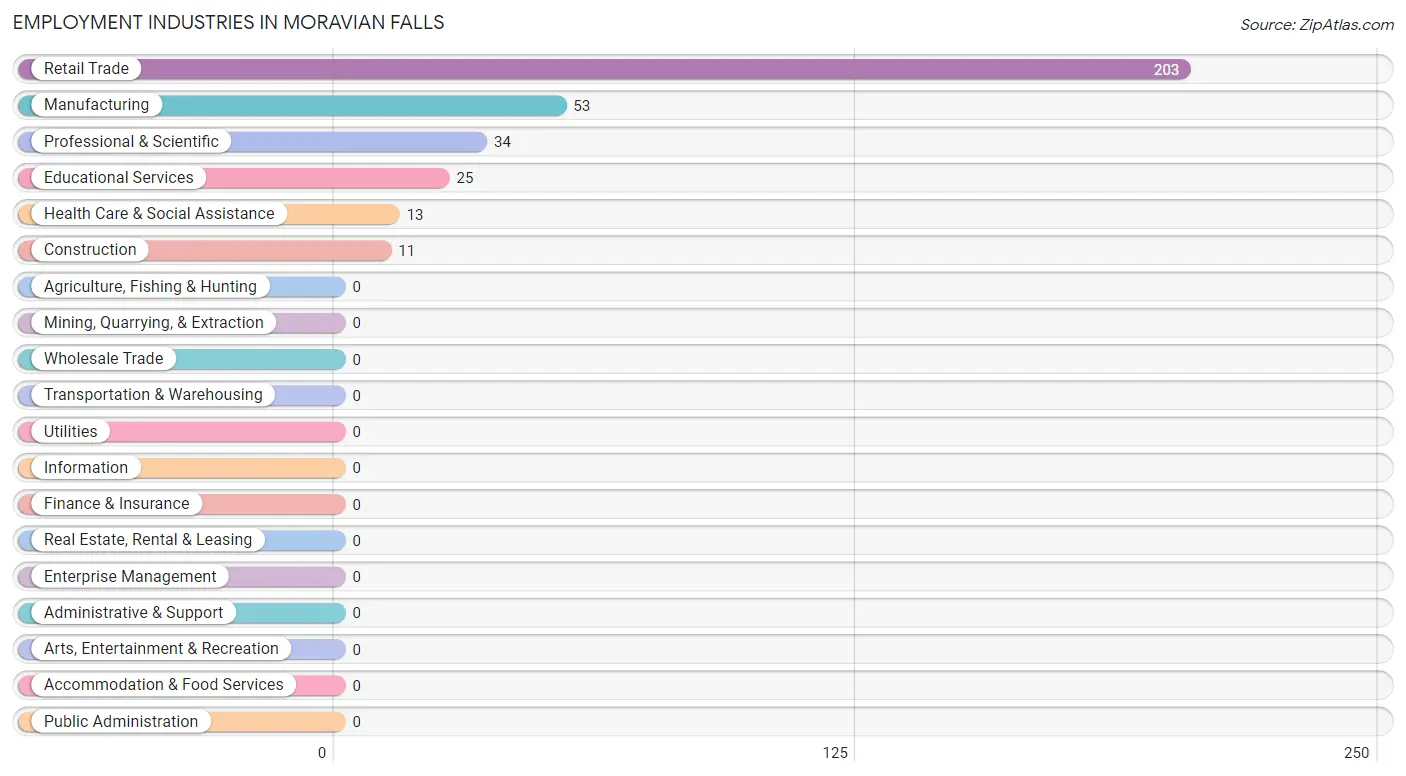
Employment Industries in Moravian Falls
The major employment industries in Moravian Falls include Retail Trade (203 | 56.2%), Manufacturing (53 | 14.7%), Professional & Scientific (34 | 9.4%), Educational Services (25 | 6.9%), and Health Care & Social Assistance (13 | 3.6%).
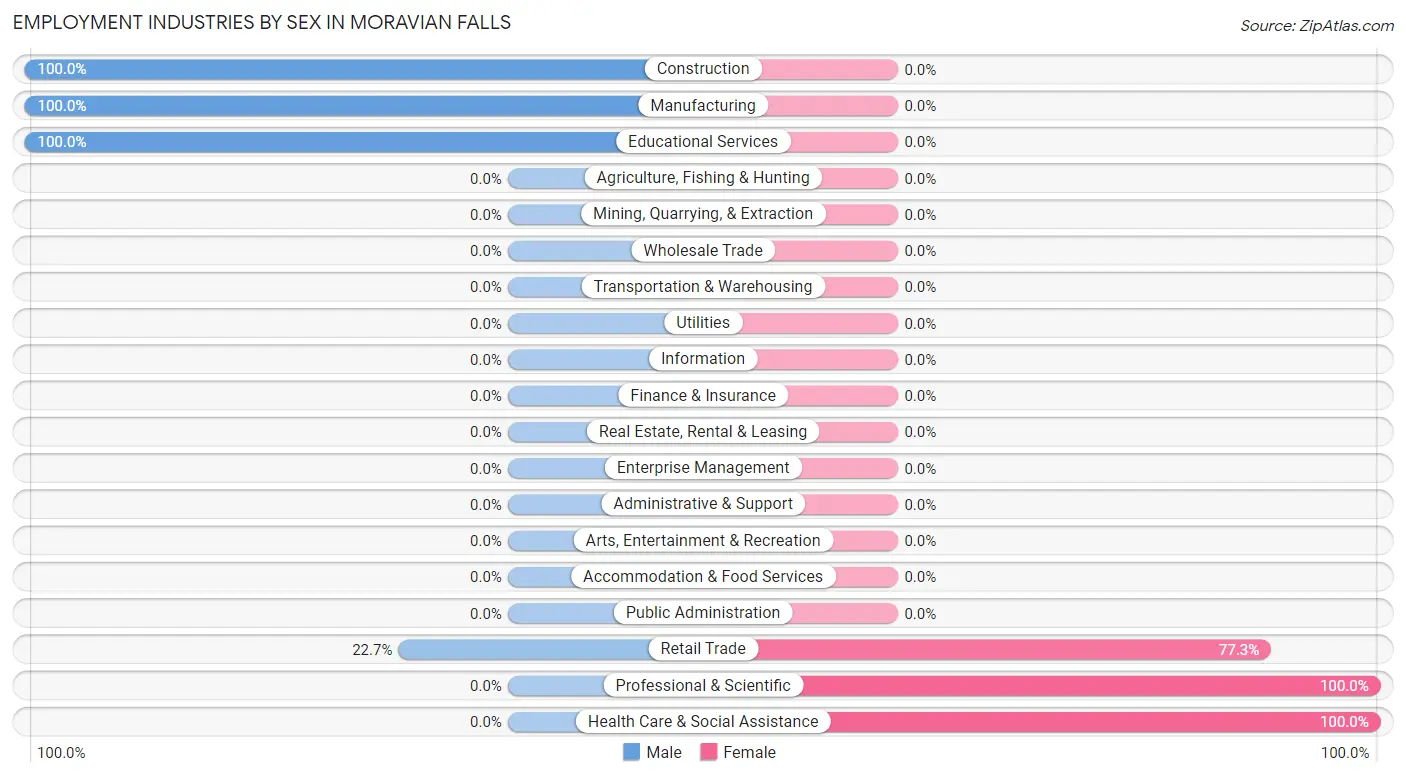
Employment Industries by Sex in Moravian Falls
The Moravian Falls industries that see more men than women are Construction (100.0%), Manufacturing (100.0%), and Educational Services (100.0%), whereas the industries that tend to have a higher number of women are Professional & Scientific (100.0%), Health Care & Social Assistance (100.0%), and Retail Trade (77.3%).
| Industry | Male | Female |
| Agriculture, Fishing & Hunting | 0 (0.0%) | 0 (0.0%) |
| Mining, Quarrying, & Extraction | 0 (0.0%) | 0 (0.0%) |
| Construction | 11 (100.0%) | 0 (0.0%) |
| Manufacturing | 53 (100.0%) | 0 (0.0%) |
| Wholesale Trade | 0 (0.0%) | 0 (0.0%) |
| Retail Trade | 46 (22.7%) | 157 (77.3%) |
| Transportation & Warehousing | 0 (0.0%) | 0 (0.0%) |
| Utilities | 0 (0.0%) | 0 (0.0%) |
| Information | 0 (0.0%) | 0 (0.0%) |
| Finance & Insurance | 0 (0.0%) | 0 (0.0%) |
| Real Estate, Rental & Leasing | 0 (0.0%) | 0 (0.0%) |
| Professional & Scientific | 0 (0.0%) | 34 (100.0%) |
| Enterprise Management | 0 (0.0%) | 0 (0.0%) |
| Administrative & Support | 0 (0.0%) | 0 (0.0%) |
| Educational Services | 25 (100.0%) | 0 (0.0%) |
| Health Care & Social Assistance | 0 (0.0%) | 13 (100.0%) |
| Arts, Entertainment & Recreation | 0 (0.0%) | 0 (0.0%) |
| Accommodation & Food Services | 0 (0.0%) | 0 (0.0%) |
| Public Administration | 0 (0.0%) | 0 (0.0%) |
| Total | 157 (43.5%) | 204 (56.5%) |
Education in Moravian Falls
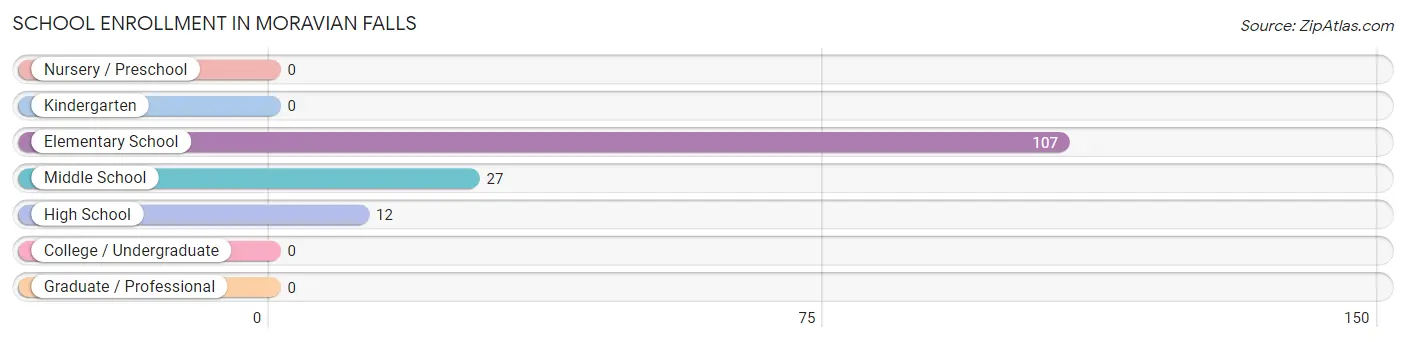
School Enrollment in Moravian Falls
The most common levels of schooling among the 146 students in Moravian Falls are elementary school (107 | 73.3%), middle school (27 | 18.5%), and high school (12 | 8.2%).
| School Level | # Students | % Students |
| Nursery / Preschool | 0 | 0.0% |
| Kindergarten | 0 | 0.0% |
| Elementary School | 107 | 73.3% |
| Middle School | 27 | 18.5% |
| High School | 12 | 8.2% |
| College / Undergraduate | 0 | 0.0% |
| Graduate / Professional | 0 | 0.0% |
| Total | 146 | 100.0% |
School Enrollment by Age by Funding Source in Moravian Falls
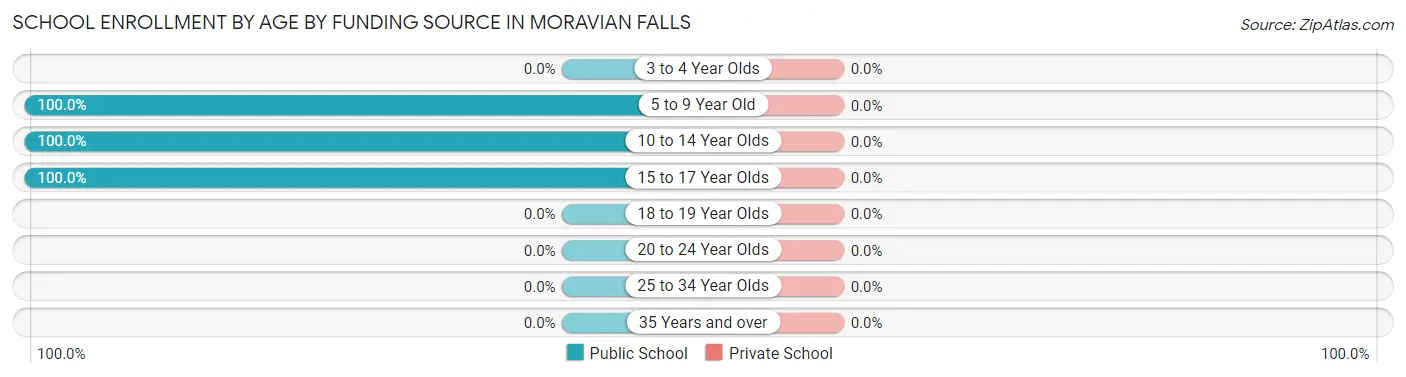
| Age Bracket | Public School | Private School |
| 3 to 4 Year Olds | 0 (0.0%) | 0 (0.0%) |
| 5 to 9 Year Old | 107 (100.0%) | 0 (0.0%) |
| 10 to 14 Year Olds | 27 (100.0%) | 0 (0.0%) |
| 15 to 17 Year Olds | 12 (100.0%) | 0 (0.0%) |
| 18 to 19 Year Olds | 0 (0.0%) | 0 (0.0%) |
| 20 to 24 Year Olds | 0 (0.0%) | 0 (0.0%) |
| 25 to 34 Year Olds | 0 (0.0%) | 0 (0.0%) |
| 35 Years and over | 0 (0.0%) | 0 (0.0%) |
| Total | 146 (100.0%) | 0 (0.0%) |
Educational Attainment by Field of Study in Moravian Falls
Business (129 | 70.5%), science & technology (20 | 10.9%), arts & humanities (20 | 10.9%), and bio, nature & agricultural (14 | 7.6%) are the most common fields of study among 183 individuals in Moravian Falls who have obtained a bachelor's degree or higher.
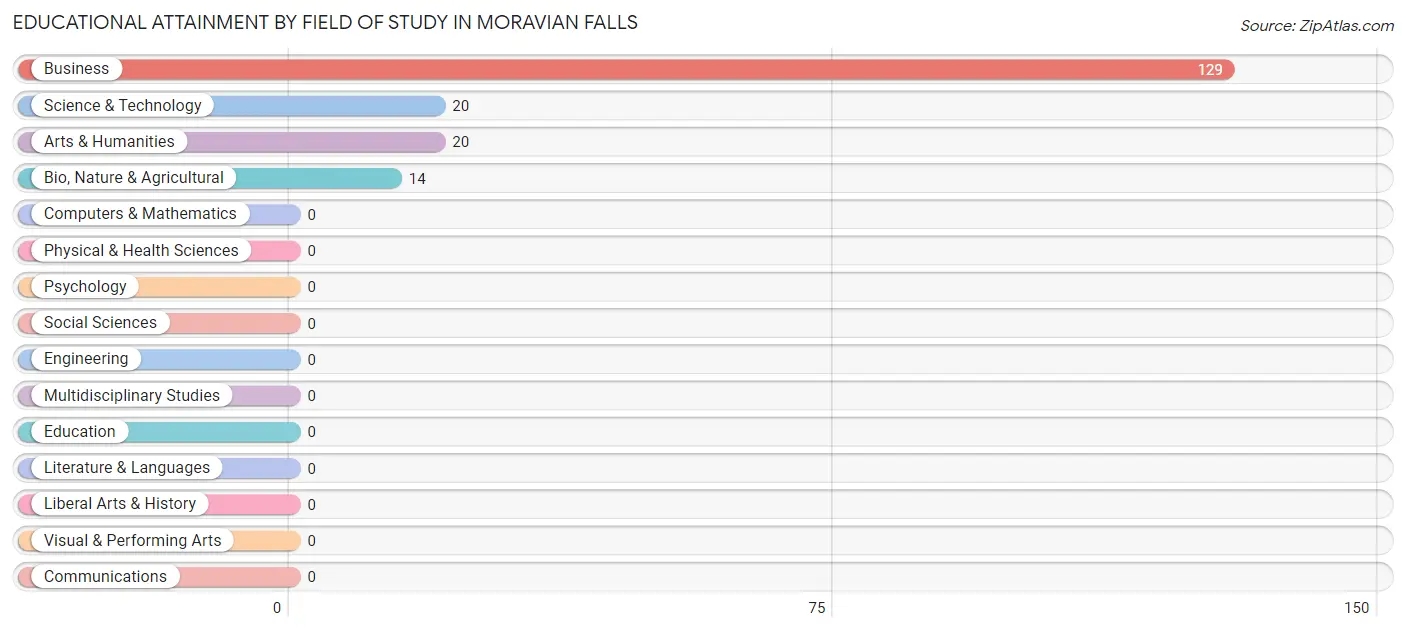
| Field of Study | # Graduates | % Graduates |
| Computers & Mathematics | 0 | 0.0% |
| Bio, Nature & Agricultural | 14 | 7.6% |
| Physical & Health Sciences | 0 | 0.0% |
| Psychology | 0 | 0.0% |
| Social Sciences | 0 | 0.0% |
| Engineering | 0 | 0.0% |
| Multidisciplinary Studies | 0 | 0.0% |
| Science & Technology | 20 | 10.9% |
| Business | 129 | 70.5% |
| Education | 0 | 0.0% |
| Literature & Languages | 0 | 0.0% |
| Liberal Arts & History | 0 | 0.0% |
| Visual & Performing Arts | 0 | 0.0% |
| Communications | 0 | 0.0% |
| Arts & Humanities | 20 | 10.9% |
| Total | 183 | 100.0% |
Transportation & Commute in Moravian Falls
Vehicle Availability by Sex in Moravian Falls
The most prevalent vehicle ownership categories in Moravian Falls are males with 3 vehicles (58, accounting for 36.9%) and females with 3 vehicles (16, making up 28.4%).
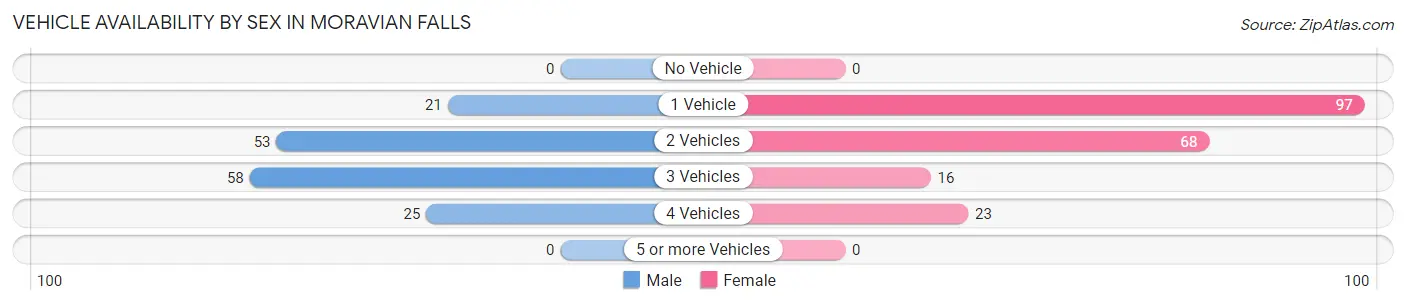
| Vehicles Available | Male | Female |
| No Vehicle | 0 (0.0%) | 0 (0.0%) |
| 1 Vehicle | 21 (13.4%) | 97 (47.5%) |
| 2 Vehicles | 53 (33.8%) | 68 (33.3%) |
| 3 Vehicles | 58 (36.9%) | 16 (7.8%) |
| 4 Vehicles | 25 (15.9%) | 23 (11.3%) |
| 5 or more Vehicles | 0 (0.0%) | 0 (0.0%) |
| Total | 157 (100.0%) | 204 (100.0%) |
Commute Time in Moravian Falls
The most frequently occuring commute durations in Moravian Falls are 10 to 14 minutes (89 commuters, 27.2%), 20 to 24 minutes (78 commuters, 23.8%), and 60 to 89 minutes (68 commuters, 20.8%).
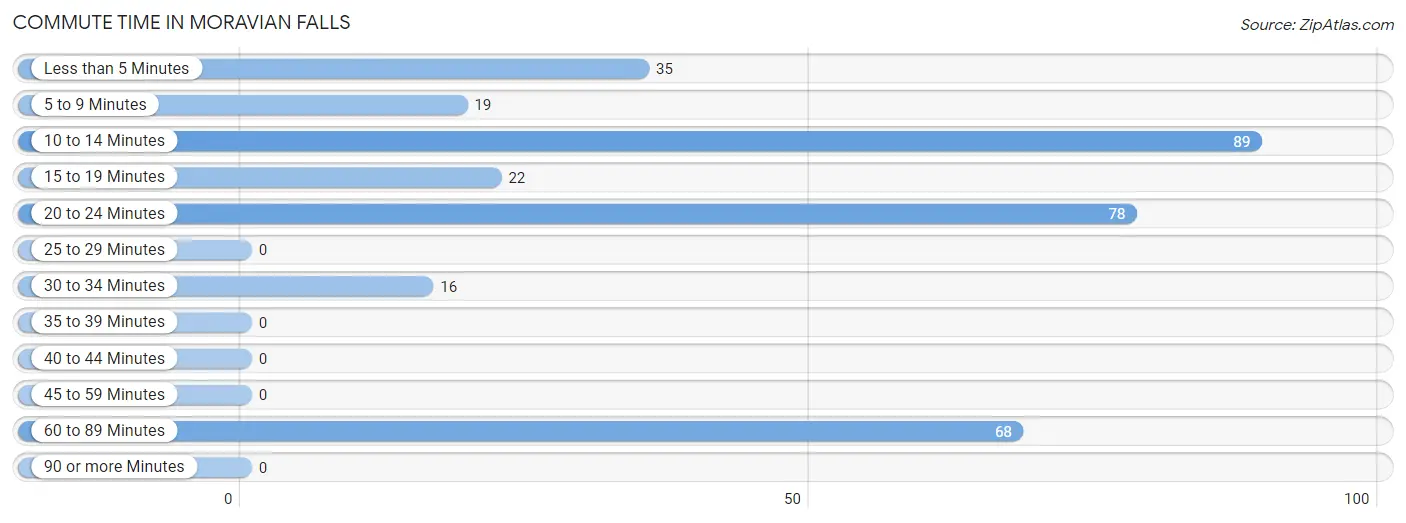
| Commute Time | # Commuters | % Commuters |
| Less than 5 Minutes | 35 | 10.7% |
| 5 to 9 Minutes | 19 | 5.8% |
| 10 to 14 Minutes | 89 | 27.2% |
| 15 to 19 Minutes | 22 | 6.7% |
| 20 to 24 Minutes | 78 | 23.8% |
| 25 to 29 Minutes | 0 | 0.0% |
| 30 to 34 Minutes | 16 | 4.9% |
| 35 to 39 Minutes | 0 | 0.0% |
| 40 to 44 Minutes | 0 | 0.0% |
| 45 to 59 Minutes | 0 | 0.0% |
| 60 to 89 Minutes | 68 | 20.8% |
| 90 or more Minutes | 0 | 0.0% |
Commute Time by Sex in Moravian Falls
The most common commute times in Moravian Falls are 20 to 24 minutes (78 commuters, 49.7%) for males and 60 to 89 minutes (68 commuters, 40.0%) for females.
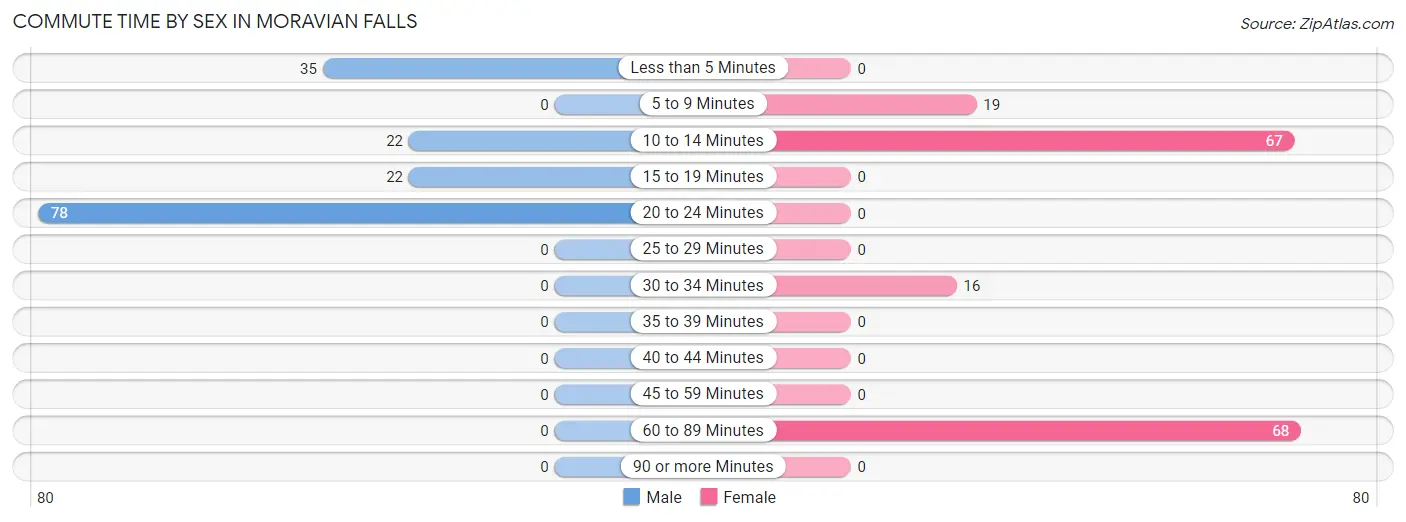
| Commute Time | Male | Female |
| Less than 5 Minutes | 35 (22.3%) | 0 (0.0%) |
| 5 to 9 Minutes | 0 (0.0%) | 19 (11.2%) |
| 10 to 14 Minutes | 22 (14.0%) | 67 (39.4%) |
| 15 to 19 Minutes | 22 (14.0%) | 0 (0.0%) |
| 20 to 24 Minutes | 78 (49.7%) | 0 (0.0%) |
| 25 to 29 Minutes | 0 (0.0%) | 0 (0.0%) |
| 30 to 34 Minutes | 0 (0.0%) | 16 (9.4%) |
| 35 to 39 Minutes | 0 (0.0%) | 0 (0.0%) |
| 40 to 44 Minutes | 0 (0.0%) | 0 (0.0%) |
| 45 to 59 Minutes | 0 (0.0%) | 0 (0.0%) |
| 60 to 89 Minutes | 0 (0.0%) | 68 (40.0%) |
| 90 or more Minutes | 0 (0.0%) | 0 (0.0%) |
Time of Departure to Work by Sex in Moravian Falls
The most frequent times of departure to work in Moravian Falls are 5:30 AM to 5:59 AM (74, 47.1%) for males and 8:00 AM to 8:29 AM (68, 40.0%) for females.
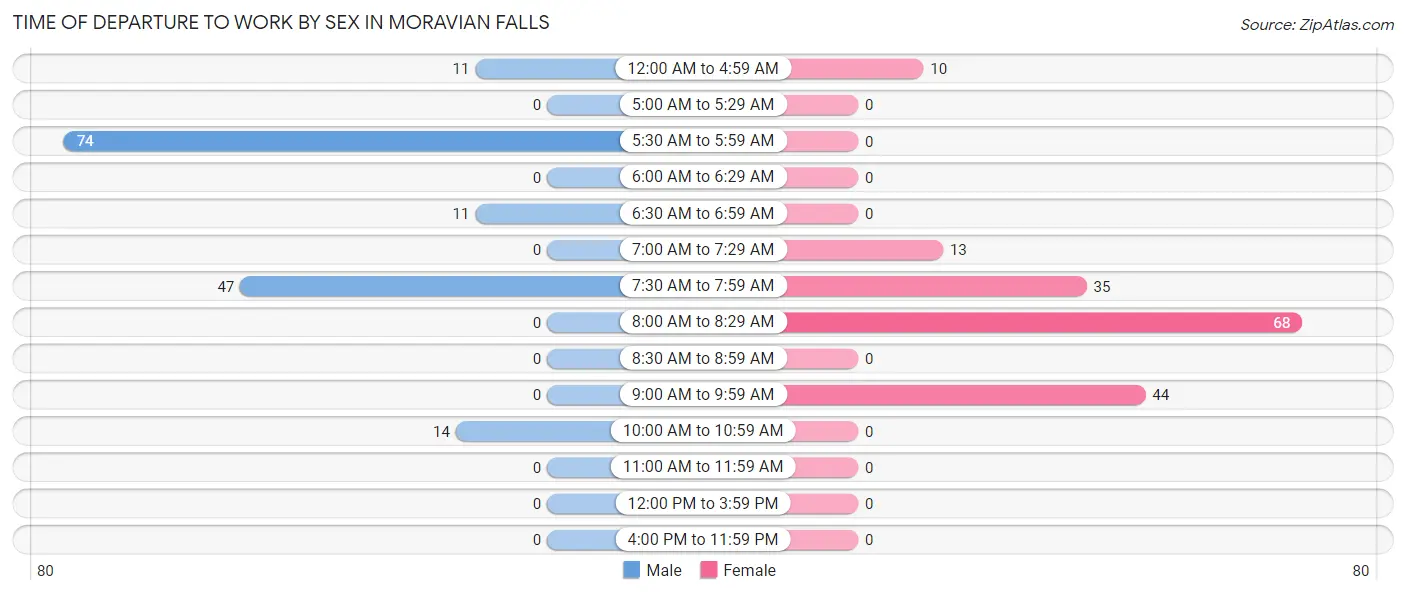
| Time of Departure | Male | Female |
| 12:00 AM to 4:59 AM | 11 (7.0%) | 10 (5.9%) |
| 5:00 AM to 5:29 AM | 0 (0.0%) | 0 (0.0%) |
| 5:30 AM to 5:59 AM | 74 (47.1%) | 0 (0.0%) |
| 6:00 AM to 6:29 AM | 0 (0.0%) | 0 (0.0%) |
| 6:30 AM to 6:59 AM | 11 (7.0%) | 0 (0.0%) |
| 7:00 AM to 7:29 AM | 0 (0.0%) | 13 (7.6%) |
| 7:30 AM to 7:59 AM | 47 (29.9%) | 35 (20.6%) |
| 8:00 AM to 8:29 AM | 0 (0.0%) | 68 (40.0%) |
| 8:30 AM to 8:59 AM | 0 (0.0%) | 0 (0.0%) |
| 9:00 AM to 9:59 AM | 0 (0.0%) | 44 (25.9%) |
| 10:00 AM to 10:59 AM | 14 (8.9%) | 0 (0.0%) |
| 11:00 AM to 11:59 AM | 0 (0.0%) | 0 (0.0%) |
| 12:00 PM to 3:59 PM | 0 (0.0%) | 0 (0.0%) |
| 4:00 PM to 11:59 PM | 0 (0.0%) | 0 (0.0%) |
| Total | 157 (100.0%) | 170 (100.0%) |
Housing Occupancy in Moravian Falls
Occupancy by Ownership in Moravian Falls
Of the total 620 dwellings in Moravian Falls, owner-occupied units account for 374 (60.3%), while renter-occupied units make up 246 (39.7%).
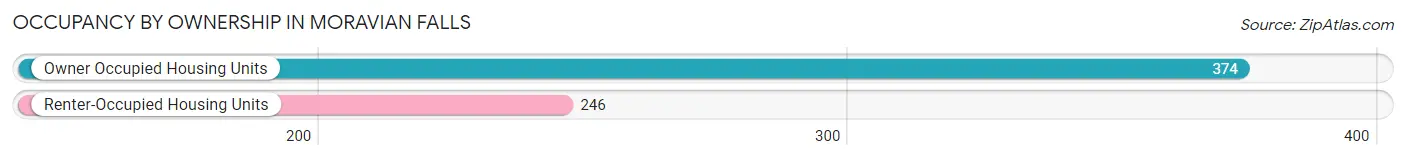
| Occupancy | # Housing Units | % Housing Units |
| Owner Occupied Housing Units | 374 | 60.3% |
| Renter-Occupied Housing Units | 246 | 39.7% |
| Total Occupied Housing Units | 620 | 100.0% |
Occupancy by Household Size in Moravian Falls
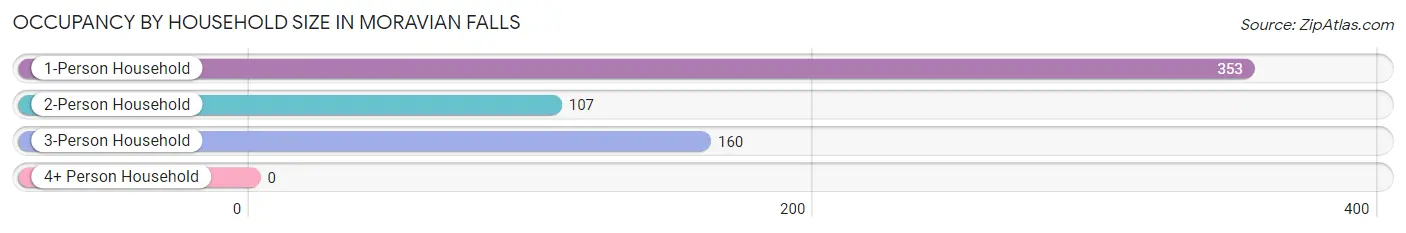
| Household Size | # Housing Units | % Housing Units |
| 1-Person Household | 353 | 56.9% |
| 2-Person Household | 107 | 17.3% |
| 3-Person Household | 160 | 25.8% |
| 4+ Person Household | 0 | 0.0% |
| Total Housing Units | 620 | 100.0% |
Occupancy by Ownership by Household Size in Moravian Falls
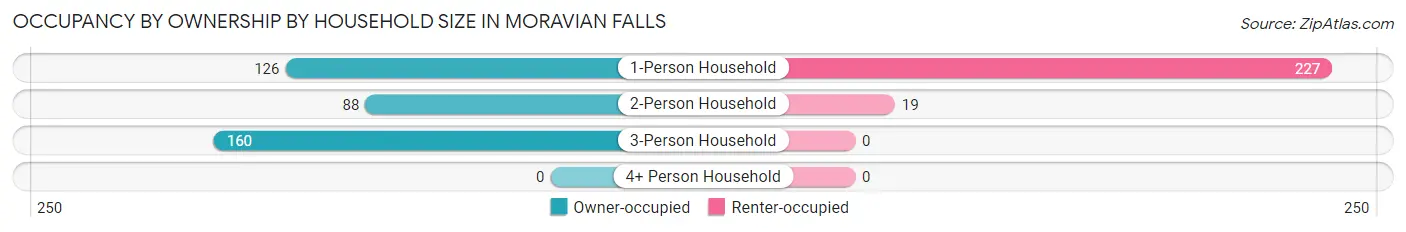
| Household Size | Owner-occupied | Renter-occupied |
| 1-Person Household | 126 (35.7%) | 227 (64.3%) |
| 2-Person Household | 88 (82.2%) | 19 (17.8%) |
| 3-Person Household | 160 (100.0%) | 0 (0.0%) |
| 4+ Person Household | 0 (0.0%) | 0 (0.0%) |
| Total Housing Units | 374 (60.3%) | 246 (39.7%) |
Occupancy by Educational Attainment in Moravian Falls
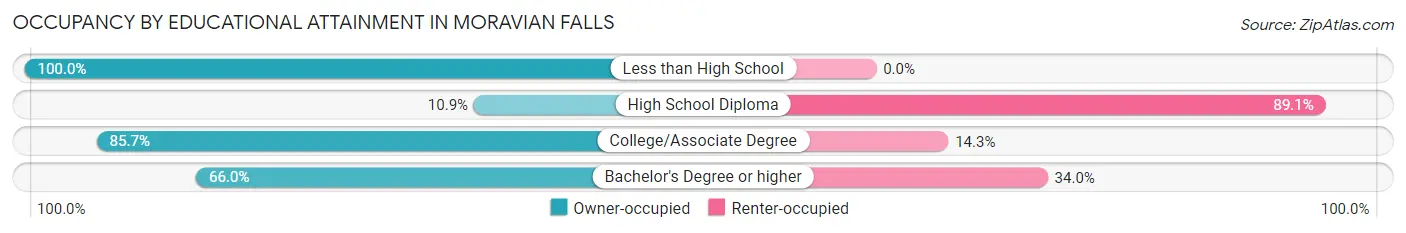
| Household Size | Owner-occupied | Renter-occupied |
| Less than High School | 16 (100.0%) | 0 (0.0%) |
| High School Diploma | 19 (10.9%) | 155 (89.1%) |
| College/Associate Degree | 240 (85.7%) | 40 (14.3%) |
| Bachelor's Degree or higher | 99 (66.0%) | 51 (34.0%) |
Occupancy by Age of Householder in Moravian Falls
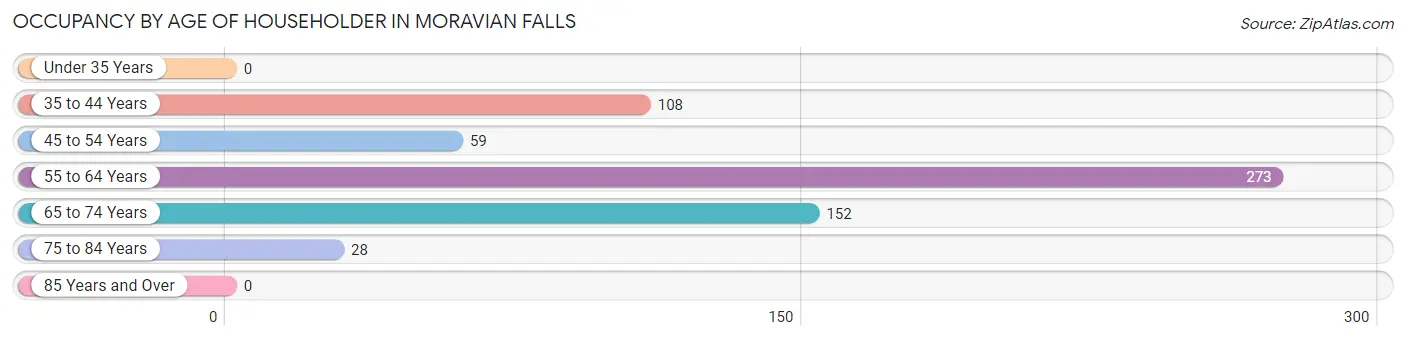
| Age Bracket | # Households | % Households |
| Under 35 Years | 0 | 0.0% |
| 35 to 44 Years | 108 | 17.4% |
| 45 to 54 Years | 59 | 9.5% |
| 55 to 64 Years | 273 | 44.0% |
| 65 to 74 Years | 152 | 24.5% |
| 75 to 84 Years | 28 | 4.5% |
| 85 Years and Over | 0 | 0.0% |
| Total | 620 | 100.0% |
Housing Finances in Moravian Falls
Median Income by Occupancy in Moravian Falls
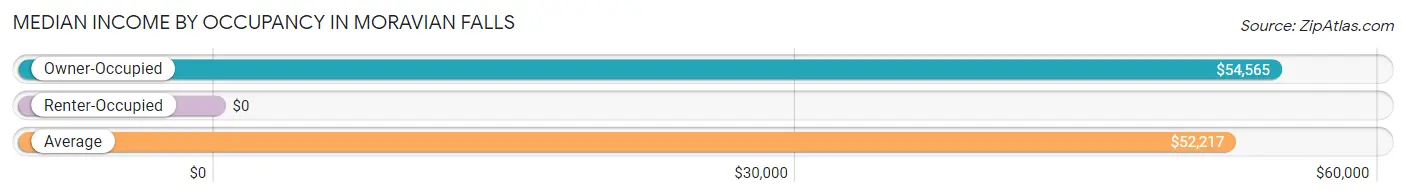
| Occupancy Type | # Households | Median Income |
| Owner-Occupied | 374 (60.3%) | $54,565 |
| Renter-Occupied | 246 (39.7%) | $0 |
| Average | 620 (100.0%) | $52,217 |
Occupancy by Householder Income Bracket in Moravian Falls
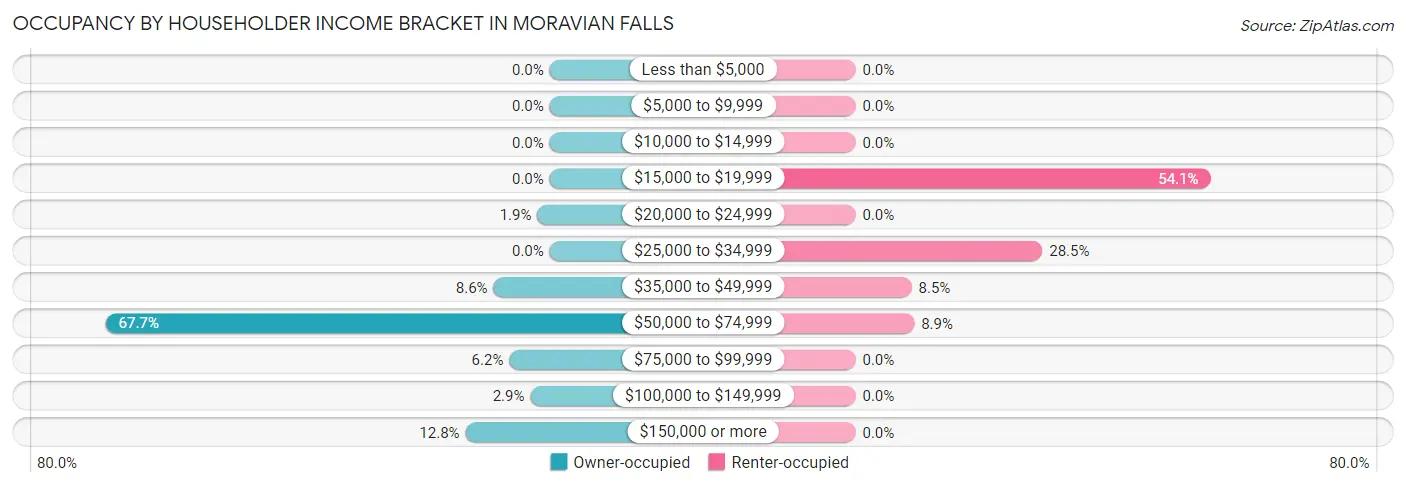
| Income Bracket | Owner-occupied | Renter-occupied |
| Less than $5,000 | 0 (0.0%) | 0 (0.0%) |
| $5,000 to $9,999 | 0 (0.0%) | 0 (0.0%) |
| $10,000 to $14,999 | 0 (0.0%) | 0 (0.0%) |
| $15,000 to $19,999 | 0 (0.0%) | 133 (54.1%) |
| $20,000 to $24,999 | 7 (1.9%) | 0 (0.0%) |
| $25,000 to $34,999 | 0 (0.0%) | 70 (28.5%) |
| $35,000 to $49,999 | 32 (8.6%) | 21 (8.5%) |
| $50,000 to $74,999 | 253 (67.6%) | 22 (8.9%) |
| $75,000 to $99,999 | 23 (6.1%) | 0 (0.0%) |
| $100,000 to $149,999 | 11 (2.9%) | 0 (0.0%) |
| $150,000 or more | 48 (12.8%) | 0 (0.0%) |
| Total | 374 (100.0%) | 246 (100.0%) |
Monthly Housing Cost Tiers in Moravian Falls
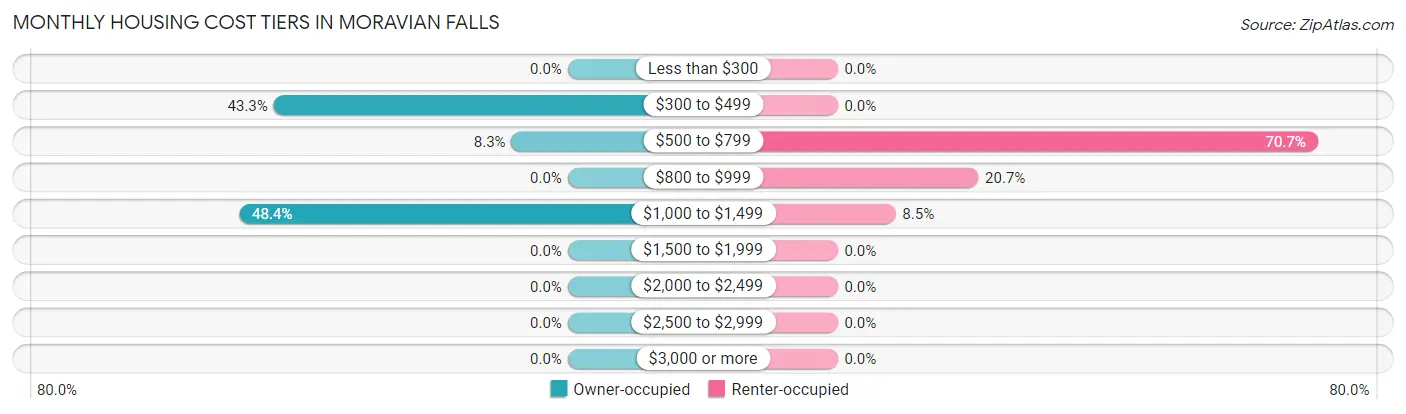
| Monthly Cost | Owner-occupied | Renter-occupied |
| Less than $300 | 0 (0.0%) | 0 (0.0%) |
| $300 to $499 | 162 (43.3%) | 0 (0.0%) |
| $500 to $799 | 31 (8.3%) | 174 (70.7%) |
| $800 to $999 | 0 (0.0%) | 51 (20.7%) |
| $1,000 to $1,499 | 181 (48.4%) | 21 (8.5%) |
| $1,500 to $1,999 | 0 (0.0%) | 0 (0.0%) |
| $2,000 to $2,499 | 0 (0.0%) | 0 (0.0%) |
| $2,500 to $2,999 | 0 (0.0%) | 0 (0.0%) |
| $3,000 or more | 0 (0.0%) | 0 (0.0%) |
| Total | 374 (100.0%) | 246 (100.0%) |
Physical Housing Characteristics in Moravian Falls
Housing Structures in Moravian Falls
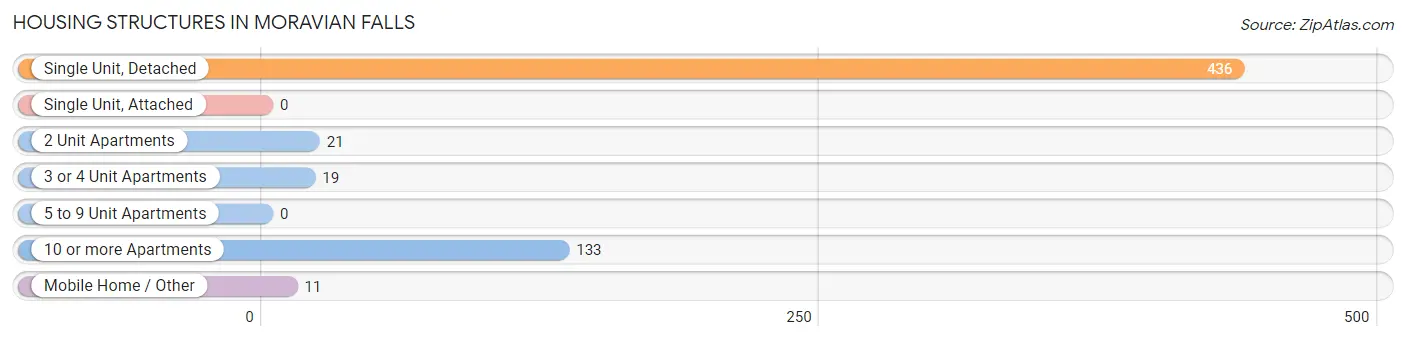
| Structure Type | # Housing Units | % Housing Units |
| Single Unit, Detached | 436 | 70.3% |
| Single Unit, Attached | 0 | 0.0% |
| 2 Unit Apartments | 21 | 3.4% |
| 3 or 4 Unit Apartments | 19 | 3.1% |
| 5 to 9 Unit Apartments | 0 | 0.0% |
| 10 or more Apartments | 133 | 21.4% |
| Mobile Home / Other | 11 | 1.8% |
| Total | 620 | 100.0% |
Housing Structures by Occupancy in Moravian Falls
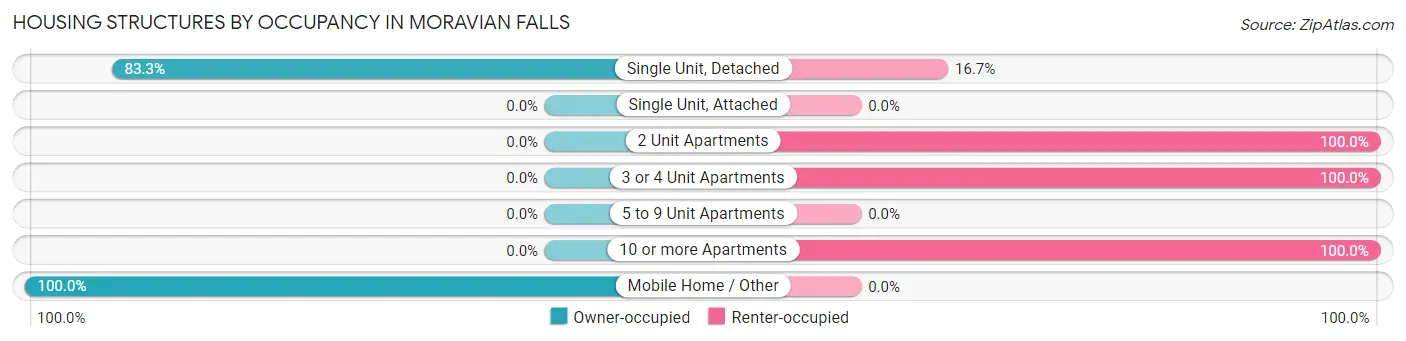
| Structure Type | Owner-occupied | Renter-occupied |
| Single Unit, Detached | 363 (83.3%) | 73 (16.7%) |
| Single Unit, Attached | 0 (0.0%) | 0 (0.0%) |
| 2 Unit Apartments | 0 (0.0%) | 21 (100.0%) |
| 3 or 4 Unit Apartments | 0 (0.0%) | 19 (100.0%) |
| 5 to 9 Unit Apartments | 0 (0.0%) | 0 (0.0%) |
| 10 or more Apartments | 0 (0.0%) | 133 (100.0%) |
| Mobile Home / Other | 11 (100.0%) | 0 (0.0%) |
| Total | 374 (60.3%) | 246 (39.7%) |
Housing Structures by Number of Rooms in Moravian Falls
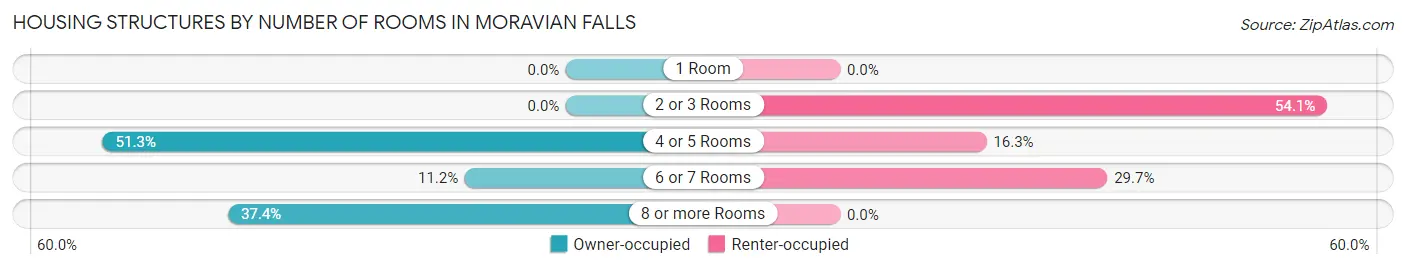
| Number of Rooms | Owner-occupied | Renter-occupied |
| 1 Room | 0 (0.0%) | 0 (0.0%) |
| 2 or 3 Rooms | 0 (0.0%) | 133 (54.1%) |
| 4 or 5 Rooms | 192 (51.3%) | 40 (16.3%) |
| 6 or 7 Rooms | 42 (11.2%) | 73 (29.7%) |
| 8 or more Rooms | 140 (37.4%) | 0 (0.0%) |
| Total | 374 (100.0%) | 246 (100.0%) |
Housing Structure by Heating Type in Moravian Falls
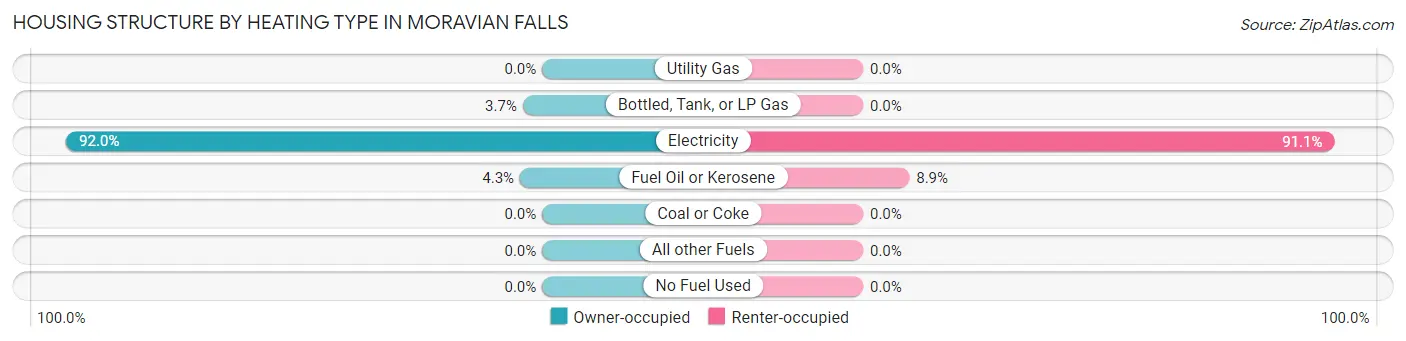
| Heating Type | Owner-occupied | Renter-occupied |
| Utility Gas | 0 (0.0%) | 0 (0.0%) |
| Bottled, Tank, or LP Gas | 14 (3.7%) | 0 (0.0%) |
| Electricity | 344 (92.0%) | 224 (91.1%) |
| Fuel Oil or Kerosene | 16 (4.3%) | 22 (8.9%) |
| Coal or Coke | 0 (0.0%) | 0 (0.0%) |
| All other Fuels | 0 (0.0%) | 0 (0.0%) |
| No Fuel Used | 0 (0.0%) | 0 (0.0%) |
| Total | 374 (100.0%) | 246 (100.0%) |
Household Vehicle Usage in Moravian Falls
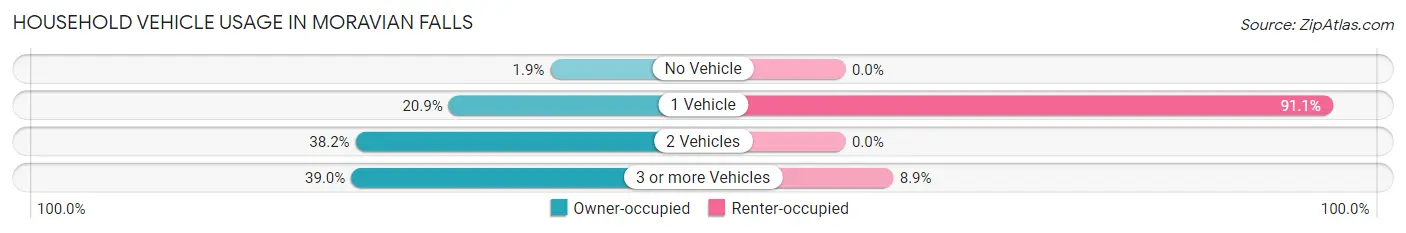
| Vehicles per Household | Owner-occupied | Renter-occupied |
| No Vehicle | 7 (1.9%) | 0 (0.0%) |
| 1 Vehicle | 78 (20.9%) | 224 (91.1%) |
| 2 Vehicles | 143 (38.2%) | 0 (0.0%) |
| 3 or more Vehicles | 146 (39.0%) | 22 (8.9%) |
| Total | 374 (100.0%) | 246 (100.0%) |
Real Estate & Mortgages in Moravian Falls
Real Estate and Mortgage Overview in Moravian Falls
| Characteristic | Without Mortgage | With Mortgage |
| Housing Units | 140 | 234 |
| Median Property Value | $254,200 | $178,700 |
| Median Household Income | $51,462 | $34 |
| Monthly Housing Costs | $422 | $0 |
| Real Estate Taxes | $1,232 | $0 |
Property Value by Mortgage Status in Moravian Falls
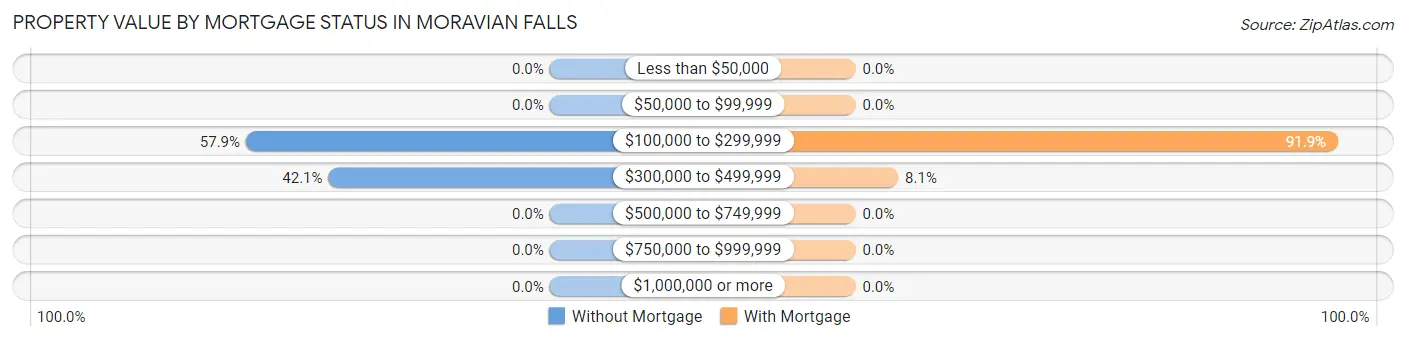
| Property Value | Without Mortgage | With Mortgage |
| Less than $50,000 | 0 (0.0%) | 0 (0.0%) |
| $50,000 to $99,999 | 0 (0.0%) | 0 (0.0%) |
| $100,000 to $299,999 | 81 (57.9%) | 215 (91.9%) |
| $300,000 to $499,999 | 59 (42.1%) | 19 (8.1%) |
| $500,000 to $749,999 | 0 (0.0%) | 0 (0.0%) |
| $750,000 to $999,999 | 0 (0.0%) | 0 (0.0%) |
| $1,000,000 or more | 0 (0.0%) | 0 (0.0%) |
| Total | 140 (100.0%) | 234 (100.0%) |
Household Income by Mortgage Status in Moravian Falls
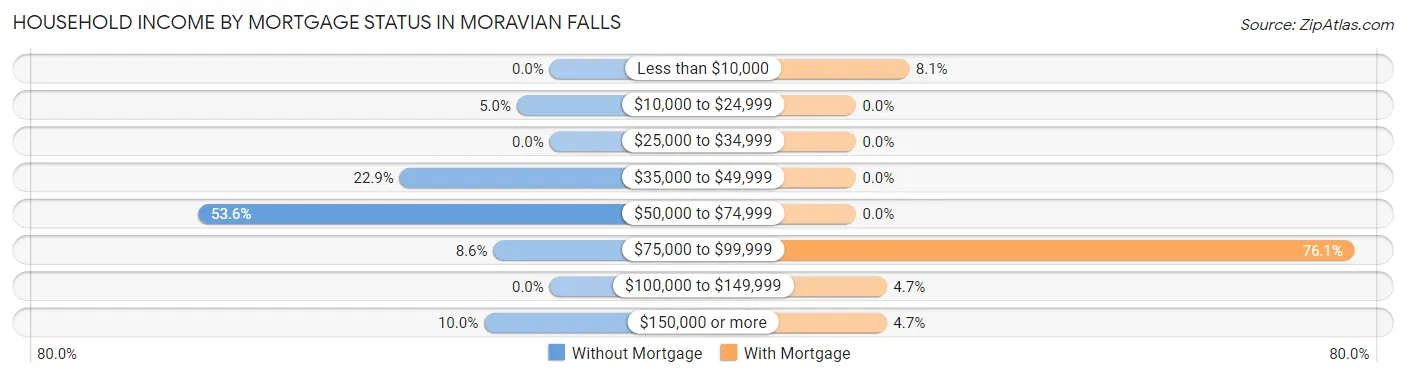
| Household Income | Without Mortgage | With Mortgage |
| Less than $10,000 | 0 (0.0%) | 19 (8.1%) |
| $10,000 to $24,999 | 7 (5.0%) | 0 (0.0%) |
| $25,000 to $34,999 | 0 (0.0%) | 0 (0.0%) |
| $35,000 to $49,999 | 32 (22.9%) | 0 (0.0%) |
| $50,000 to $74,999 | 75 (53.6%) | 0 (0.0%) |
| $75,000 to $99,999 | 12 (8.6%) | 178 (76.1%) |
| $100,000 to $149,999 | 0 (0.0%) | 11 (4.7%) |
| $150,000 or more | 14 (10.0%) | 11 (4.7%) |
| Total | 140 (100.0%) | 234 (100.0%) |
Property Value to Household Income Ratio in Moravian Falls
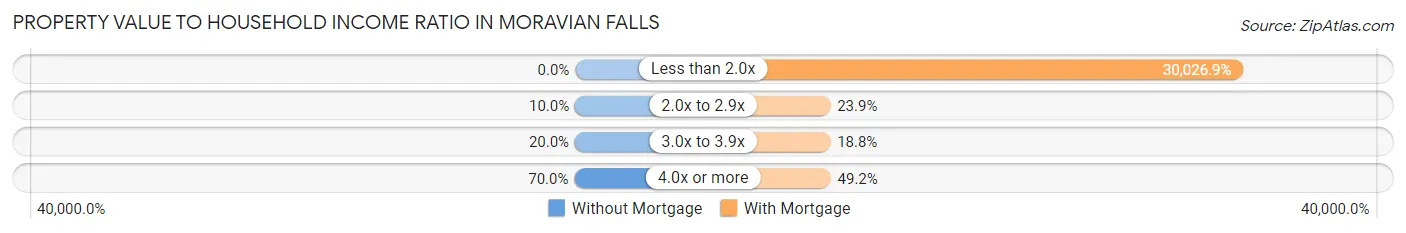
| Value-to-Income Ratio | Without Mortgage | With Mortgage |
| Less than 2.0x | 0 (0.0%) | 70,263 (30,026.9%) |
| 2.0x to 2.9x | 14 (10.0%) | 56 (23.9%) |
| 3.0x to 3.9x | 28 (20.0%) | 44 (18.8%) |
| 4.0x or more | 98 (70.0%) | 115 (49.1%) |
| Total | 140 (100.0%) | 234 (100.0%) |
Real Estate Taxes by Mortgage Status in Moravian Falls
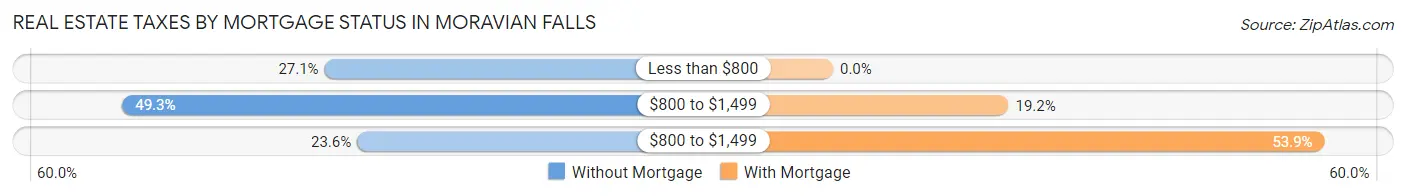
| Property Taxes | Without Mortgage | With Mortgage |
| Less than $800 | 38 (27.1%) | 0 (0.0%) |
| $800 to $1,499 | 69 (49.3%) | 45 (19.2%) |
| $800 to $1,499 | 33 (23.6%) | 126 (53.8%) |
| Total | 140 (100.0%) | 234 (100.0%) |
Health & Disability in Moravian Falls
Health Insurance Coverage by Age in Moravian Falls
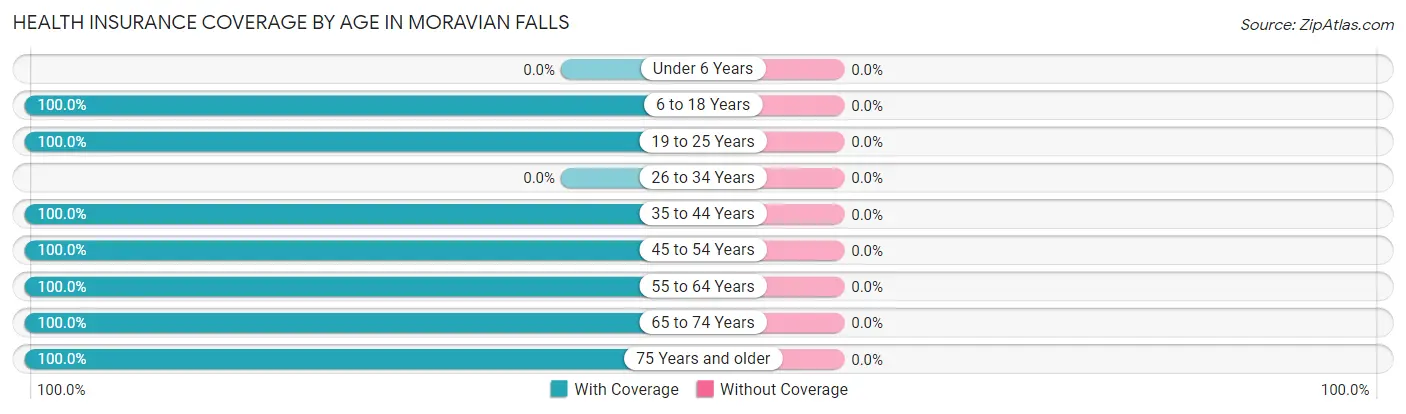
| Age Bracket | With Coverage | Without Coverage |
| Under 6 Years | 0 (0.0%) | 0 (0.0%) |
| 6 to 18 Years | 146 (100.0%) | 0 (0.0%) |
| 19 to 25 Years | 25 (100.0%) | 0 (0.0%) |
| 26 to 34 Years | 0 (0.0%) | 0 (0.0%) |
| 35 to 44 Years | 171 (100.0%) | 0 (0.0%) |
| 45 to 54 Years | 140 (100.0%) | 0 (0.0%) |
| 55 to 64 Years | 304 (100.0%) | 0 (0.0%) |
| 65 to 74 Years | 152 (100.0%) | 0 (0.0%) |
| 75 Years and older | 85 (100.0%) | 0 (0.0%) |
| Total | 1,023 (100.0%) | 0 (0.0%) |
Health Insurance Coverage by Citizenship Status in Moravian Falls
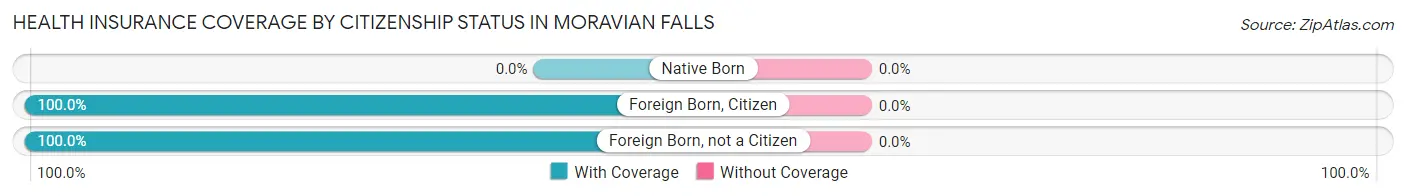
| Citizenship Status | With Coverage | Without Coverage |
| Native Born | 0 (0.0%) | 0 (0.0%) |
| Foreign Born, Citizen | 146 (100.0%) | 0 (0.0%) |
| Foreign Born, not a Citizen | 25 (100.0%) | 0 (0.0%) |
Health Insurance Coverage by Household Income in Moravian Falls
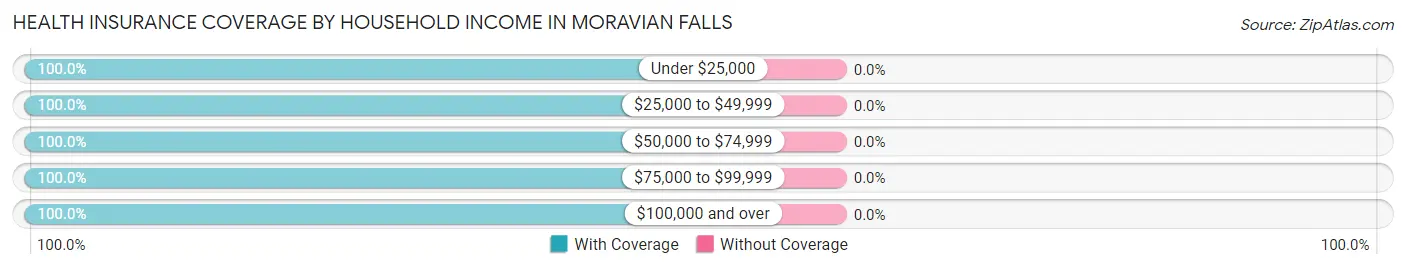
| Household Income | With Coverage | Without Coverage |
| Under $25,000 | 140 (100.0%) | 0 (0.0%) |
| $25,000 to $49,999 | 223 (100.0%) | 0 (0.0%) |
| $50,000 to $74,999 | 475 (100.0%) | 0 (0.0%) |
| $75,000 to $99,999 | 57 (100.0%) | 0 (0.0%) |
| $100,000 and over | 128 (100.0%) | 0 (0.0%) |
Public vs Private Health Insurance Coverage by Age in Moravian Falls
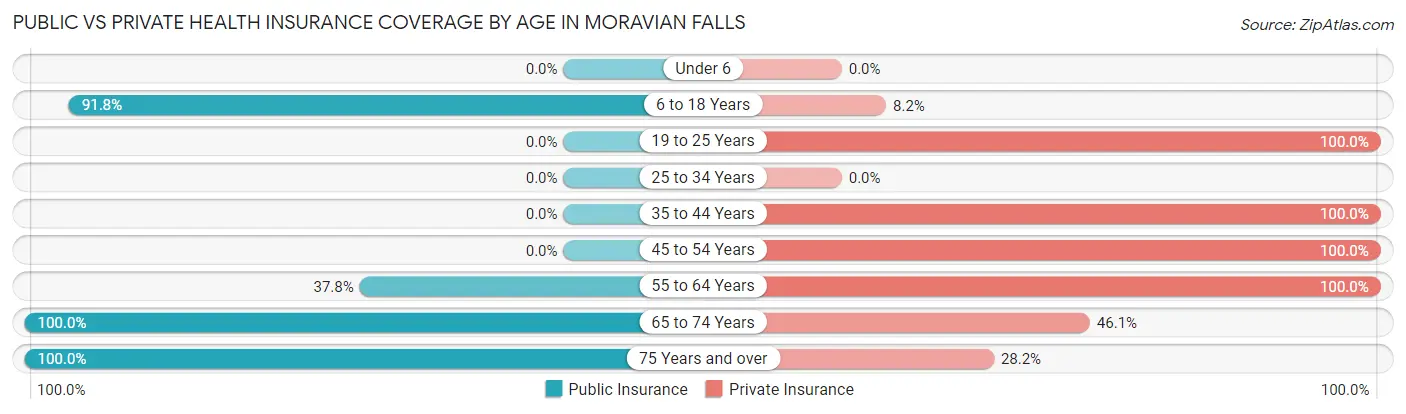
| Age Bracket | Public Insurance | Private Insurance |
| Under 6 | 0 (0.0%) | 0 (0.0%) |
| 6 to 18 Years | 134 (91.8%) | 12 (8.2%) |
| 19 to 25 Years | 0 (0.0%) | 25 (100.0%) |
| 25 to 34 Years | 0 (0.0%) | 0 (0.0%) |
| 35 to 44 Years | 0 (0.0%) | 171 (100.0%) |
| 45 to 54 Years | 0 (0.0%) | 140 (100.0%) |
| 55 to 64 Years | 115 (37.8%) | 304 (100.0%) |
| 65 to 74 Years | 152 (100.0%) | 70 (46.1%) |
| 75 Years and over | 85 (100.0%) | 24 (28.2%) |
| Total | 486 (47.5%) | 746 (72.9%) |
Disability Status by Sex by Age in Moravian Falls
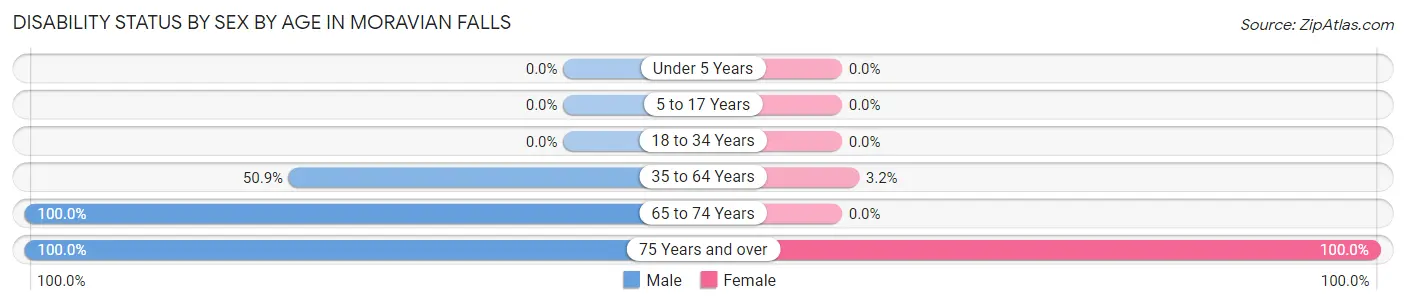
| Age Bracket | Male | Female |
| Under 5 Years | 0 (0.0%) | 0 (0.0%) |
| 5 to 17 Years | 0 (0.0%) | 0 (0.0%) |
| 18 to 34 Years | 0 (0.0%) | 0 (0.0%) |
| 35 to 64 Years | 136 (50.9%) | 11 (3.2%) |
| 65 to 74 Years | 104 (100.0%) | 0 (0.0%) |
| 75 Years and over | 47 (100.0%) | 38 (100.0%) |
Disability Class by Sex by Age in Moravian Falls
Disability Class: Hearing Difficulty
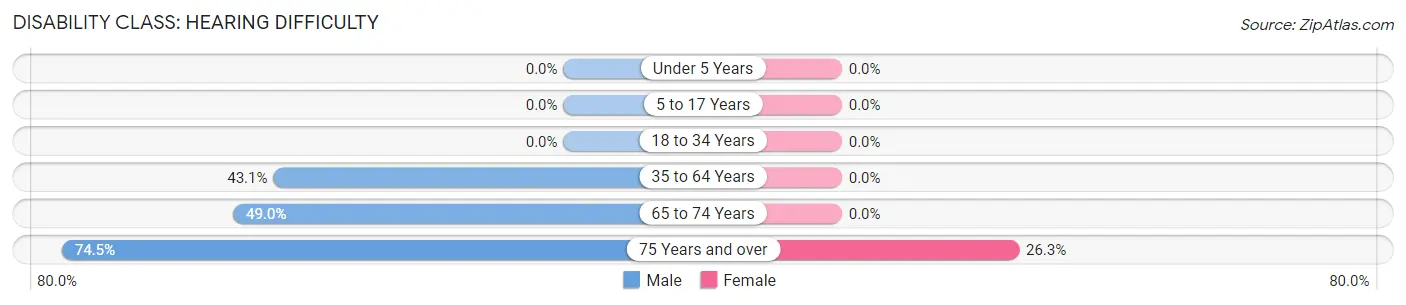
| Age Bracket | Male | Female |
| Under 5 Years | 0 (0.0%) | 0 (0.0%) |
| 5 to 17 Years | 0 (0.0%) | 0 (0.0%) |
| 18 to 34 Years | 0 (0.0%) | 0 (0.0%) |
| 35 to 64 Years | 115 (43.1%) | 0 (0.0%) |
| 65 to 74 Years | 51 (49.0%) | 0 (0.0%) |
| 75 Years and over | 35 (74.5%) | 10 (26.3%) |
Disability Class: Vision Difficulty
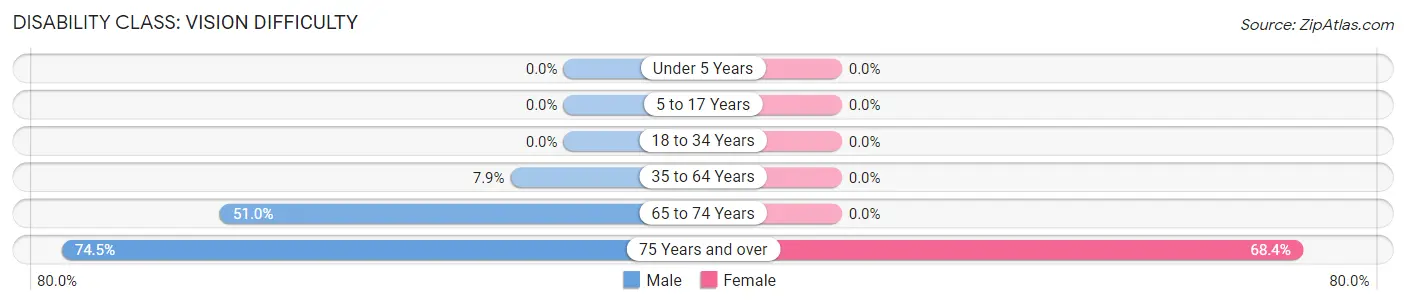
| Age Bracket | Male | Female |
| Under 5 Years | 0 (0.0%) | 0 (0.0%) |
| 5 to 17 Years | 0 (0.0%) | 0 (0.0%) |
| 18 to 34 Years | 0 (0.0%) | 0 (0.0%) |
| 35 to 64 Years | 21 (7.9%) | 0 (0.0%) |
| 65 to 74 Years | 53 (51.0%) | 0 (0.0%) |
| 75 Years and over | 35 (74.5%) | 26 (68.4%) |
Disability Class: Cognitive Difficulty
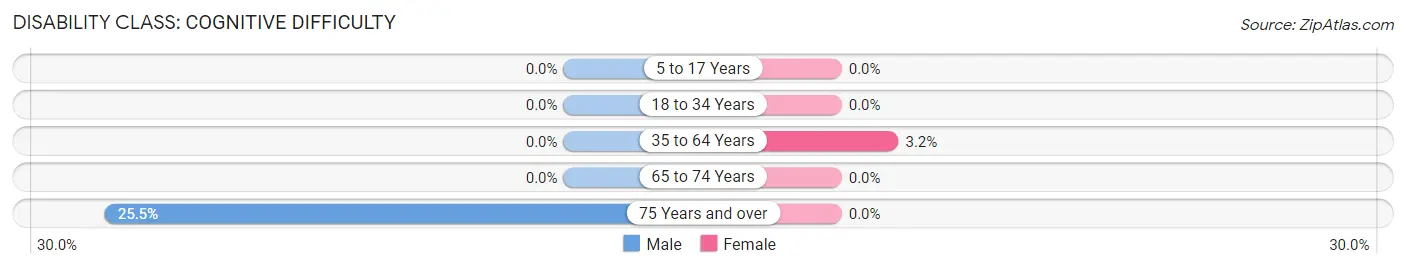
| Age Bracket | Male | Female |
| 5 to 17 Years | 0 (0.0%) | 0 (0.0%) |
| 18 to 34 Years | 0 (0.0%) | 0 (0.0%) |
| 35 to 64 Years | 0 (0.0%) | 11 (3.2%) |
| 65 to 74 Years | 0 (0.0%) | 0 (0.0%) |
| 75 Years and over | 12 (25.5%) | 0 (0.0%) |
Disability Class: Ambulatory Difficulty
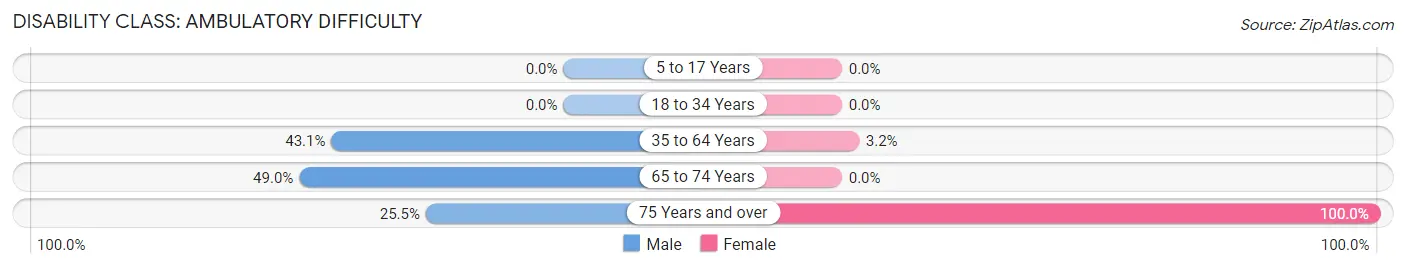
| Age Bracket | Male | Female |
| 5 to 17 Years | 0 (0.0%) | 0 (0.0%) |
| 18 to 34 Years | 0 (0.0%) | 0 (0.0%) |
| 35 to 64 Years | 115 (43.1%) | 11 (3.2%) |
| 65 to 74 Years | 51 (49.0%) | 0 (0.0%) |
| 75 Years and over | 12 (25.5%) | 38 (100.0%) |
Disability Class: Self-Care Difficulty
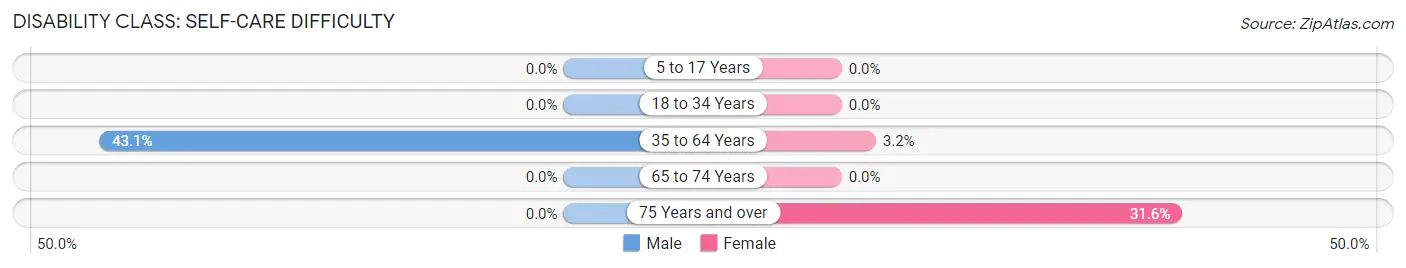
| Age Bracket | Male | Female |
| 5 to 17 Years | 0 (0.0%) | 0 (0.0%) |
| 18 to 34 Years | 0 (0.0%) | 0 (0.0%) |
| 35 to 64 Years | 115 (43.1%) | 11 (3.2%) |
| 65 to 74 Years | 0 (0.0%) | 0 (0.0%) |
| 75 Years and over | 0 (0.0%) | 12 (31.6%) |
Technology Access in Moravian Falls
Computing Device Access in Moravian Falls
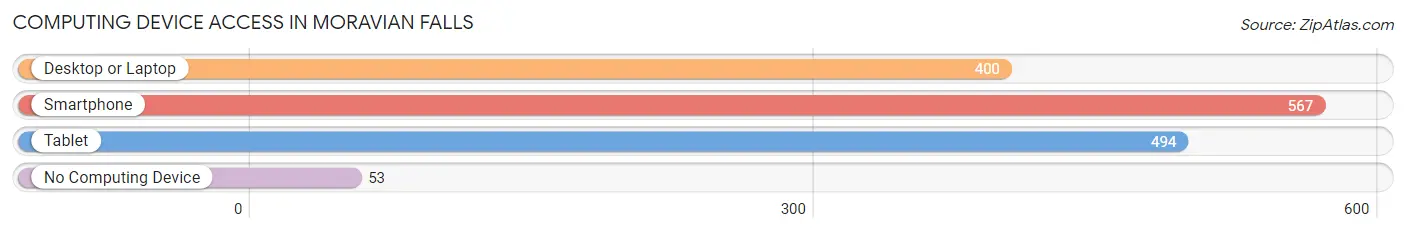
| Device Type | # Households | % Households |
| Desktop or Laptop | 400 | 64.5% |
| Smartphone | 567 | 91.4% |
| Tablet | 494 | 79.7% |
| No Computing Device | 53 | 8.6% |
| Total | 620 | 100.0% |
Internet Access in Moravian Falls
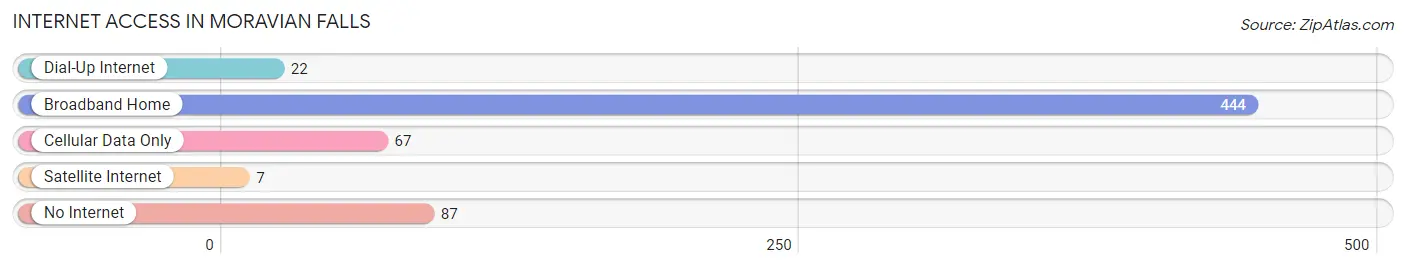
| Internet Type | # Households | % Households |
| Dial-Up Internet | 22 | 3.5% |
| Broadband Home | 444 | 71.6% |
| Cellular Data Only | 67 | 10.8% |
| Satellite Internet | 7 | 1.1% |
| No Internet | 87 | 14.0% |
| Total | 620 | 100.0% |
Moravian Falls Summary
Moravian Falls is a small unincorporated community located in Wilkes County, North Carolina. It is situated in the foothills of the Blue Ridge Mountains, approximately 20 miles east of the city of Wilkesboro. The town is named after the Moravian Church, which was founded in the area in 1753.
History
The area around Moravian Falls was first settled by German-speaking Moravians in 1753. The Moravians were a religious group that had been expelled from their homeland in what is now the Czech Republic. They were seeking a place to practice their faith without persecution, and they found it in the foothills of the Blue Ridge Mountains. The Moravians established a settlement in the area, which they named Wachovia.
The settlement grew and prospered, and in 1771, the Moravians built a church in the area. The church was named after the nearby waterfall, which was known as the Moravian Falls. The church served as the center of the community, and the settlement was eventually renamed Moravian Falls.
In the early 19th century, the area around Moravian Falls began to attract settlers from other parts of the United States. The population of the town grew, and by the mid-1800s, it had become a thriving community. The town was home to several businesses, including a gristmill, a sawmill, and a tannery.
In the late 19th century, the town began to decline. The population decreased, and many of the businesses closed. The town was eventually bypassed by the railroad, and it became a quiet, rural community.
Geography
Moravian Falls is located in the foothills of the Blue Ridge Mountains in Wilkes County, North Carolina. The town is situated at an elevation of 1,400 feet above sea level. The town is surrounded by rolling hills and forests, and the nearby Moravian Falls provide a picturesque backdrop.
The town is located approximately 20 miles east of the city of Wilkesboro, and it is about an hour’s drive from the cities of Winston-Salem and Charlotte. The nearest major airport is the Charlotte-Douglas International Airport, which is about an hour and a half away.
Economy
Moravian Falls is a small, rural community with a population of just over 500 people. The town is primarily a bedroom community, with most of its residents commuting to nearby cities for work. The town does not have any major industries, but there are several small businesses in the area, including a few restaurants, a grocery store, and a hardware store.
Demographics
As of the 2010 census, the population of Moravian Falls was 517. The racial makeup of the town was 97.3% White, 0.6% African American, 0.2% Native American, 0.4% Asian, and 1.5% from other races. The median household income was $37,500, and the median age was 44.5 years. The town is served by the Wilkes County School District.
Common Questions
What is Per Capita Income in Moravian Falls?
Per Capita income in Moravian Falls is $33,471.
What is the Median Family Income in Moravian Falls?
Median Family Income in Moravian Falls is $54,467.
What is the Median Household income in Moravian Falls?
Median Household Income in Moravian Falls is $52,217.
What is Inequality or Gini Index in Moravian Falls?
Inequality or Gini Index in Moravian Falls is 0.35.
What is the Total Population of Moravian Falls?
Total Population of Moravian Falls is 1,023.
What is the Total Male Population of Moravian Falls?
Total Male Population of Moravian Falls is 443.
What is the Total Female Population of Moravian Falls?
Total Female Population of Moravian Falls is 580.
What is the Ratio of Males per 100 Females in Moravian Falls?
There are 76.38 Males per 100 Females in Moravian Falls.
What is the Ratio of Females per 100 Males in Moravian Falls?
There are 130.93 Females per 100 Males in Moravian Falls.
What is the Median Population Age in Moravian Falls?
Median Population Age in Moravian Falls is 57.9 Years.
What is the Average Family Size in Moravian Falls
Average Family Size in Moravian Falls is 2.5 People.
What is the Average Household Size in Moravian Falls
Average Household Size in Moravian Falls is 1.6 People.
How Large is the Labor Force in Moravian Falls?
There are 361 People in the Labor Forcein in Moravian Falls.
What is the Percentage of People in the Labor Force in Moravian Falls?
40.6% of People are in the Labor Force in Moravian Falls.