Millers Creek, NC Map & Demographics
Millers Creek Map
Millers Creek Overview
$29,210
PER CAPITA INCOME
$59,764
AVG FAMILY INCOME
$41,434
AVG HOUSEHOLD INCOME
5.9%
WAGE / INCOME GAP [ % ]
94.1¢/ $1
WAGE / INCOME GAP [ $ ]
0.39
INEQUALITY / GINI INDEX
1,475
TOTAL POPULATION
737
MALE POPULATION
738
FEMALE POPULATION
99.86
MALES / 100 FEMALES
100.14
FEMALES / 100 MALES
59.3
MEDIAN AGE
2.5
AVG FAMILY SIZE
1.9
AVG HOUSEHOLD SIZE
747
LABOR FORCE [ PEOPLE ]
54.0%
PERCENT IN LABOR FORCE
7.1%
UNEMPLOYMENT RATE
Millers Creek Zip Codes
Millers Creek Area Codes
Income in Millers Creek
Income Overview in Millers Creek
Per Capita Income in Millers Creek is $29,210, while median incomes of families and households are $59,764 and $41,434 respectively.
| Characteristic | Number | Measure |
| Per Capita Income | 1,475 | $29,210 |
| Median Family Income | 405 | $59,764 |
| Mean Family Income | 405 | $71,762 |
| Median Household Income | 759 | $41,434 |
| Mean Household Income | 759 | $53,294 |
| Income Deficit | 405 | $0 |
| Wage / Income Gap (%) | 1,475 | 5.88% |
| Wage / Income Gap ($) | 1,475 | 94.12¢ per $1 |
| Gini / Inequality Index | 1,475 | 0.39 |
Earnings by Sex in Millers Creek
Average Earnings in Millers Creek are $31,102, $31,059 for men and $33,000 for women, a difference of 5.9%.
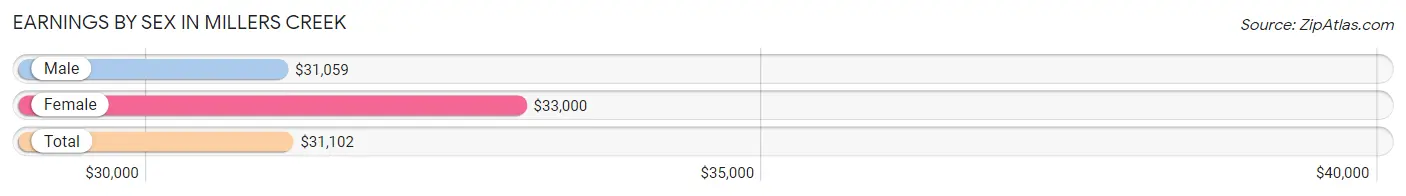
| Sex | Number | Average Earnings |
| Male | 462 (61.0%) | $31,059 |
| Female | 296 (39.1%) | $33,000 |
| Total | 758 (100.0%) | $31,102 |
Earnings by Sex by Income Bracket in Millers Creek
The most common earnings brackets in Millers Creek are $30,000 to $34,999 for men (94 | 20.3%) and $40,000 to $44,999 for women (54 | 18.2%).
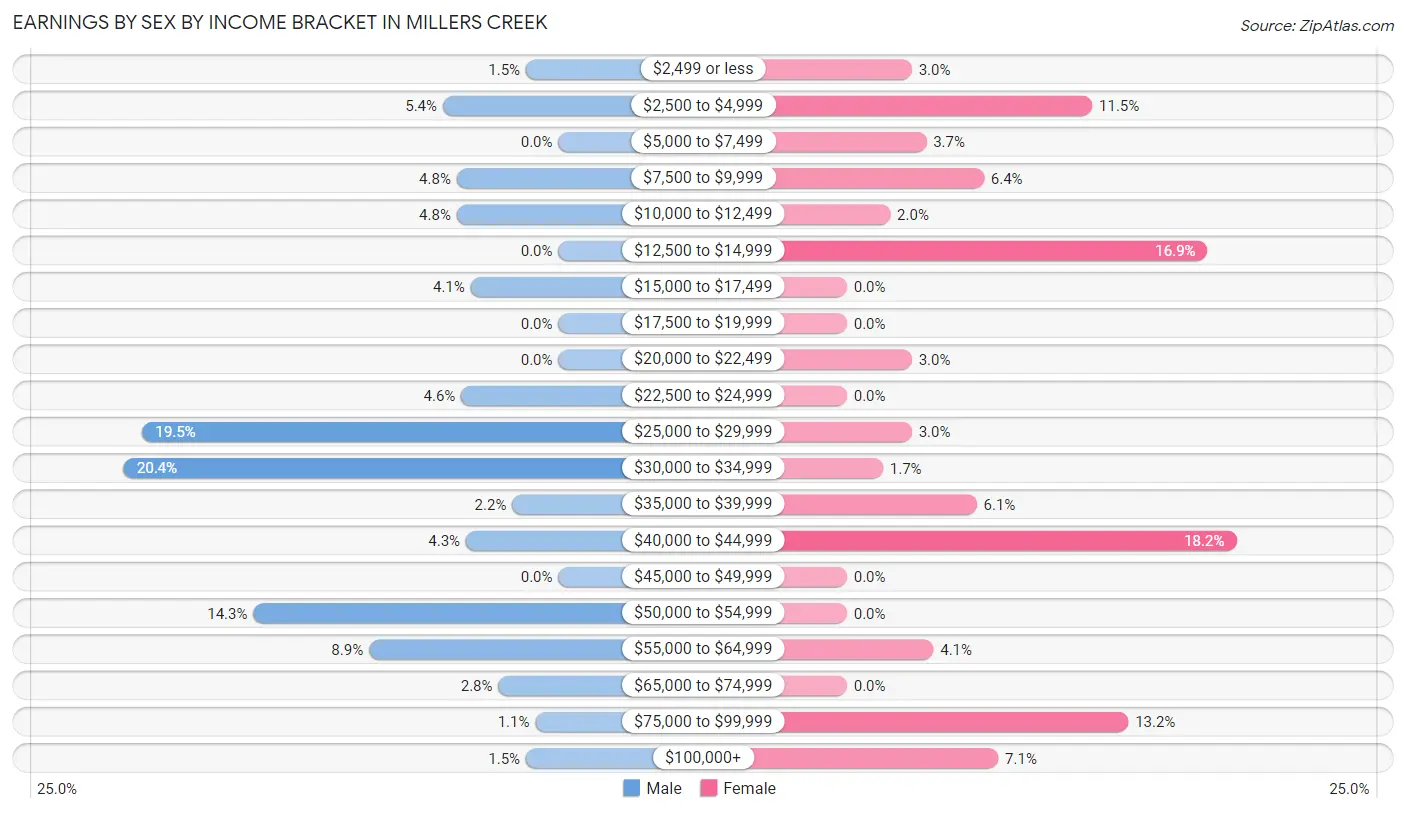
| Income | Male | Female |
| $2,499 or less | 7 (1.5%) | 9 (3.0%) |
| $2,500 to $4,999 | 25 (5.4%) | 34 (11.5%) |
| $5,000 to $7,499 | 0 (0.0%) | 11 (3.7%) |
| $7,500 to $9,999 | 22 (4.8%) | 19 (6.4%) |
| $10,000 to $12,499 | 22 (4.8%) | 6 (2.0%) |
| $12,500 to $14,999 | 0 (0.0%) | 50 (16.9%) |
| $15,000 to $17,499 | 19 (4.1%) | 0 (0.0%) |
| $17,500 to $19,999 | 0 (0.0%) | 0 (0.0%) |
| $20,000 to $22,499 | 0 (0.0%) | 9 (3.0%) |
| $22,500 to $24,999 | 21 (4.5%) | 0 (0.0%) |
| $25,000 to $29,999 | 90 (19.5%) | 9 (3.0%) |
| $30,000 to $34,999 | 94 (20.3%) | 5 (1.7%) |
| $35,000 to $39,999 | 10 (2.2%) | 18 (6.1%) |
| $40,000 to $44,999 | 20 (4.3%) | 54 (18.2%) |
| $45,000 to $49,999 | 0 (0.0%) | 0 (0.0%) |
| $50,000 to $54,999 | 66 (14.3%) | 0 (0.0%) |
| $55,000 to $64,999 | 41 (8.9%) | 12 (4.1%) |
| $65,000 to $74,999 | 13 (2.8%) | 0 (0.0%) |
| $75,000 to $99,999 | 5 (1.1%) | 39 (13.2%) |
| $100,000+ | 7 (1.5%) | 21 (7.1%) |
| Total | 462 (100.0%) | 296 (100.0%) |
Earnings by Sex by Educational Attainment in Millers Creek
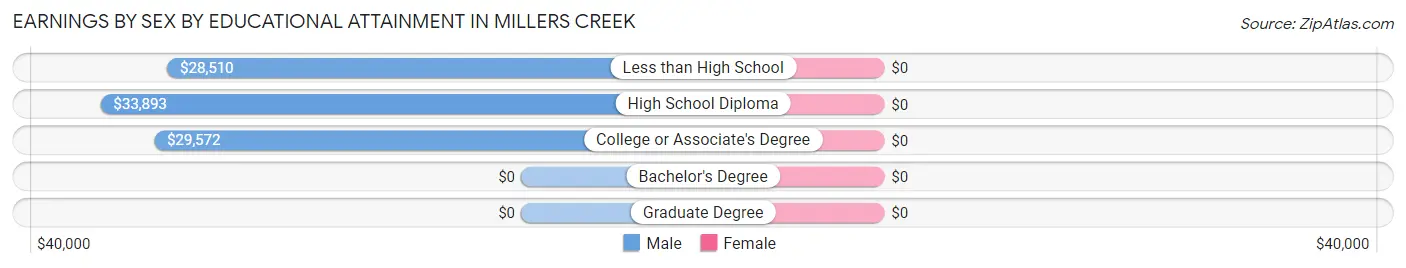
| Educational Attainment | Male Income | Female Income |
| Less than High School | $28,510 | $0 |
| High School Diploma | $33,893 | $0 |
| College or Associate's Degree | $29,572 | $0 |
| Bachelor's Degree | - | - |
| Graduate Degree | - | - |
| Total | $31,292 | $37,569 |
Family Income in Millers Creek
Family Income Brackets in Millers Creek
According to the Millers Creek family income data, there are 120 families falling into the $50,000 to $74,999 income range, which is the most common income bracket and makes up 29.6% of all families.
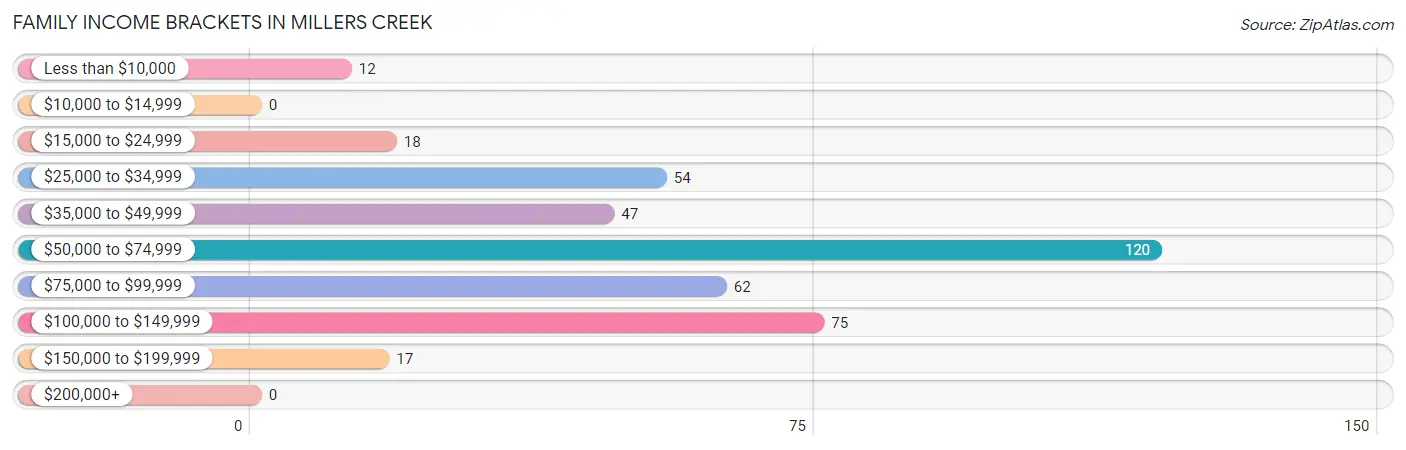
| Income Bracket | # Families | % Families |
| Less than $10,000 | 12 | 3.0% |
| $10,000 to $14,999 | 0 | 0.0% |
| $15,000 to $24,999 | 18 | 4.4% |
| $25,000 to $34,999 | 54 | 13.3% |
| $35,000 to $49,999 | 47 | 11.6% |
| $50,000 to $74,999 | 120 | 29.6% |
| $75,000 to $99,999 | 62 | 15.3% |
| $100,000 to $149,999 | 75 | 18.5% |
| $150,000 to $199,999 | 17 | 4.2% |
| $200,000+ | 0 | 0.0% |
Family Income by Famaliy Size in Millers Creek
4-person families (43 | 10.6%) account for the highest median family income in Millers Creek with $89,145 per family, while 2-person families (276 | 68.1%) have the highest median income of $29,493 per family member.
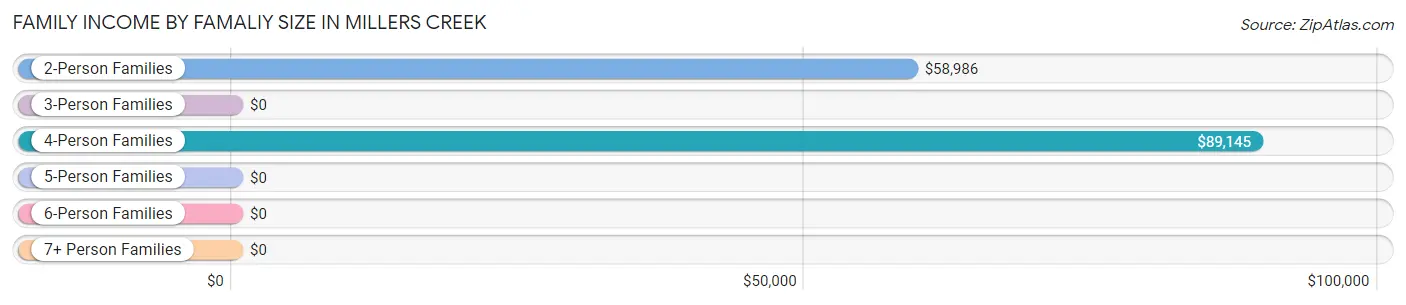
| Income Bracket | # Families | Median Income |
| 2-Person Families | 276 (68.1%) | $58,986 |
| 3-Person Families | 86 (21.2%) | $0 |
| 4-Person Families | 43 (10.6%) | $89,145 |
| 5-Person Families | 0 (0.0%) | $0 |
| 6-Person Families | 0 (0.0%) | $0 |
| 7+ Person Families | 0 (0.0%) | $0 |
| Total | 405 (100.0%) | $59,764 |
Family Income by Number of Earners in Millers Creek
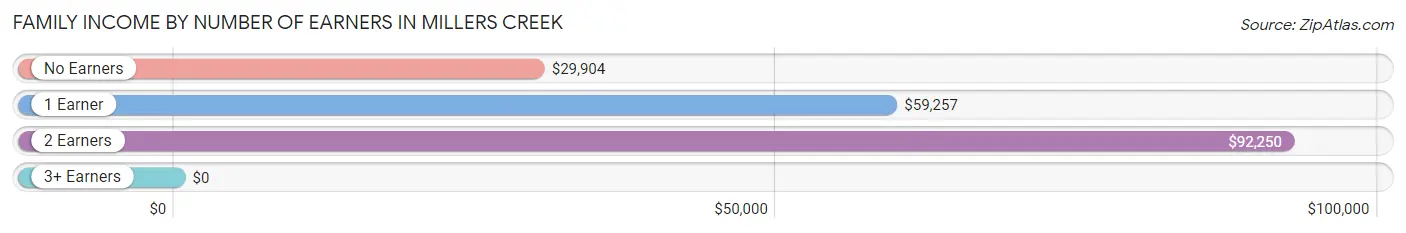
| Number of Earners | # Families | Median Income |
| No Earners | 97 (23.9%) | $29,904 |
| 1 Earner | 172 (42.5%) | $59,257 |
| 2 Earners | 108 (26.7%) | $92,250 |
| 3+ Earners | 28 (6.9%) | $0 |
| Total | 405 (100.0%) | $59,764 |
Household Income in Millers Creek
Household Income Brackets in Millers Creek
With 150 households falling in the category, the $25,000 to $34,999 income range is the most frequent in Millers Creek, accounting for 19.8% of all households.
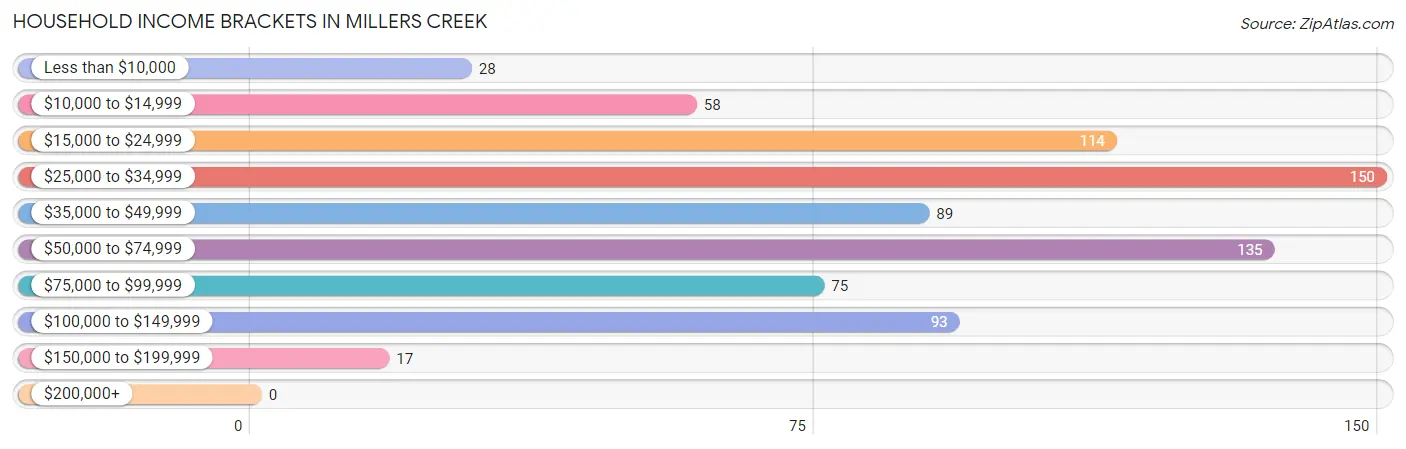
| Income Bracket | # Households | % Households |
| Less than $10,000 | 28 | 3.7% |
| $10,000 to $14,999 | 58 | 7.6% |
| $15,000 to $24,999 | 114 | 15.0% |
| $25,000 to $34,999 | 150 | 19.8% |
| $35,000 to $49,999 | 89 | 11.7% |
| $50,000 to $74,999 | 135 | 17.8% |
| $75,000 to $99,999 | 75 | 9.9% |
| $100,000 to $149,999 | 93 | 12.3% |
| $150,000 to $199,999 | 17 | 2.2% |
| $200,000+ | 0 | 0.0% |
Household Income by Householder Age in Millers Creek
The median household income in Millers Creek is $41,434, with the highest median household income of $55,586 found in the 45 to 64 years age bracket for the primary householder. A total of 219 households (28.8%) fall into this category. Meanwhile, the 15 to 24 years age bracket for the primary householder has the lowest median household income of $0, with 9 households (1.2%) in this group.
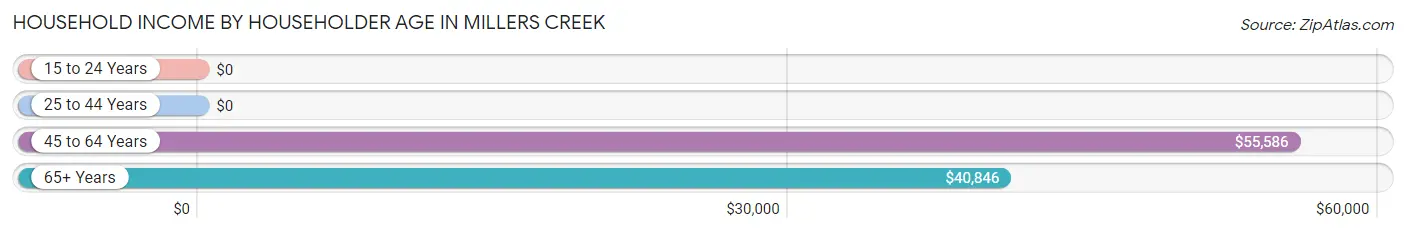
| Income Bracket | # Households | Median Income |
| 15 to 24 Years | 9 (1.2%) | $0 |
| 25 to 44 Years | 130 (17.1%) | $0 |
| 45 to 64 Years | 219 (28.8%) | $55,586 |
| 65+ Years | 401 (52.8%) | $40,846 |
| Total | 759 (100.0%) | $41,434 |
Poverty in Millers Creek
Income Below Poverty by Sex and Age in Millers Creek
With 9.9% poverty level for males and 15.7% for females among the residents of Millers Creek, 35 to 44 year old males and 12 to 14 year old females are the most vulnerable to poverty, with 16 males (28.1%) and 9 females (100.0%) in their respective age groups living below the poverty level.
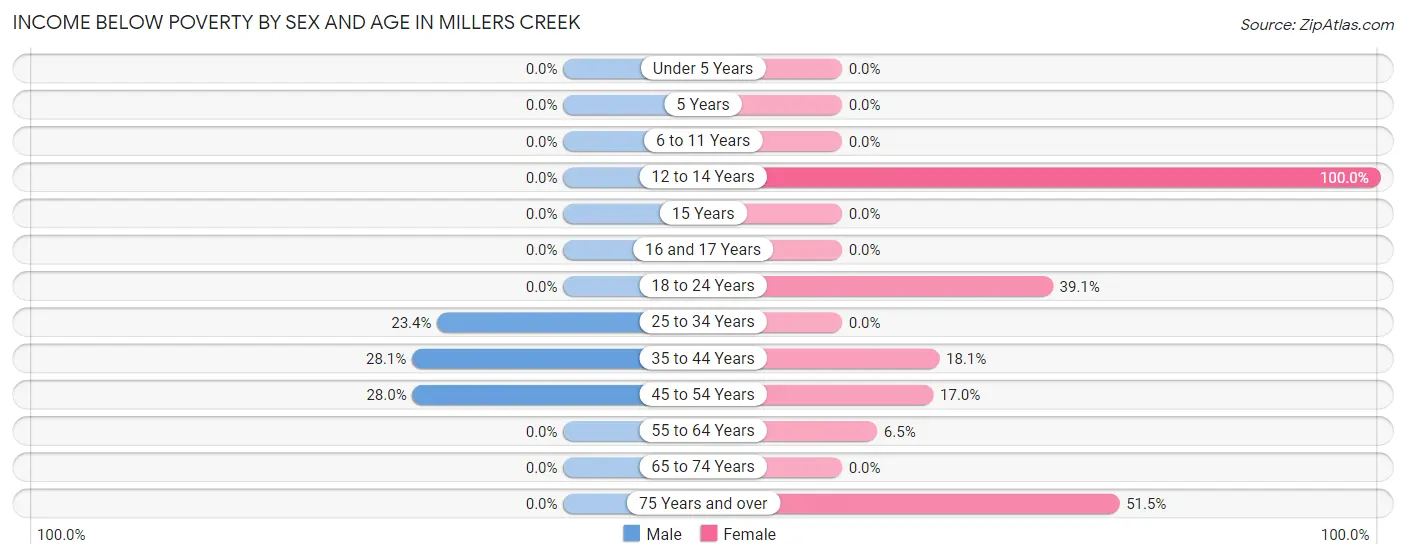
| Age Bracket | Male | Female |
| Under 5 Years | 0 (0.0%) | 0 (0.0%) |
| 5 Years | 0 (0.0%) | 0 (0.0%) |
| 6 to 11 Years | 0 (0.0%) | 0 (0.0%) |
| 12 to 14 Years | 0 (0.0%) | 9 (100.0%) |
| 15 Years | 0 (0.0%) | 0 (0.0%) |
| 16 and 17 Years | 0 (0.0%) | 0 (0.0%) |
| 18 to 24 Years | 0 (0.0%) | 9 (39.1%) |
| 25 to 34 Years | 22 (23.4%) | 0 (0.0%) |
| 35 to 44 Years | 16 (28.1%) | 13 (18.1%) |
| 45 to 54 Years | 35 (28.0%) | 10 (17.0%) |
| 55 to 64 Years | 0 (0.0%) | 6 (6.5%) |
| 65 to 74 Years | 0 (0.0%) | 0 (0.0%) |
| 75 Years and over | 0 (0.0%) | 69 (51.5%) |
| Total | 73 (9.9%) | 116 (15.7%) |
Income Above Poverty by Sex and Age in Millers Creek
According to the poverty statistics in Millers Creek, males aged under 5 years and females aged under 5 years are the age groups that are most secure financially, with 100.0% of males and 100.0% of females in these age groups living above the poverty line.
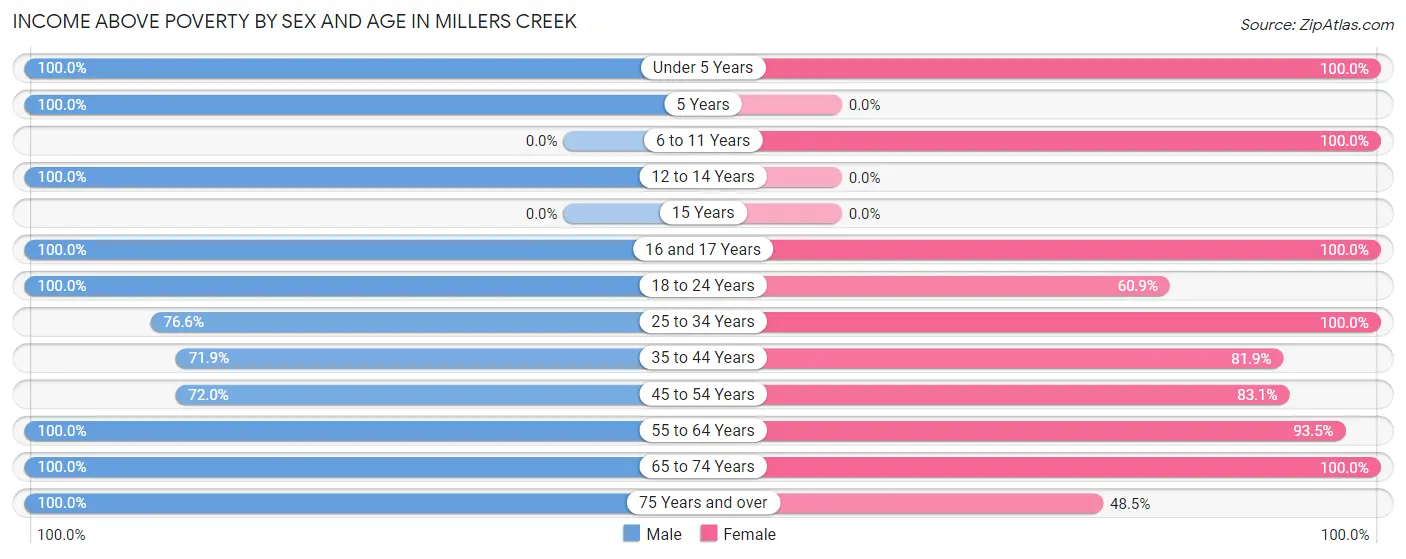
| Age Bracket | Male | Female |
| Under 5 Years | 24 (100.0%) | 11 (100.0%) |
| 5 Years | 5 (100.0%) | 0 (0.0%) |
| 6 to 11 Years | 0 (0.0%) | 27 (100.0%) |
| 12 to 14 Years | 15 (100.0%) | 0 (0.0%) |
| 15 Years | 0 (0.0%) | 0 (0.0%) |
| 16 and 17 Years | 8 (100.0%) | 16 (100.0%) |
| 18 to 24 Years | 11 (100.0%) | 14 (60.9%) |
| 25 to 34 Years | 72 (76.6%) | 127 (100.0%) |
| 35 to 44 Years | 41 (71.9%) | 59 (81.9%) |
| 45 to 54 Years | 90 (72.0%) | 49 (83.1%) |
| 55 to 64 Years | 101 (100.0%) | 86 (93.5%) |
| 65 to 74 Years | 151 (100.0%) | 168 (100.0%) |
| 75 Years and over | 146 (100.0%) | 65 (48.5%) |
| Total | 664 (90.1%) | 622 (84.3%) |
Income Below Poverty Among Married-Couple Families in Millers Creek
The poverty statistics for married-couple families in Millers Creek show that 0.6% or 2 of the total 333 families live below the poverty line. Families with no children have the highest poverty rate of 0.8%, comprising of 2 families. On the other hand, families with 1 or 2 children have the lowest poverty rate of 0.0%, which includes 0 families.
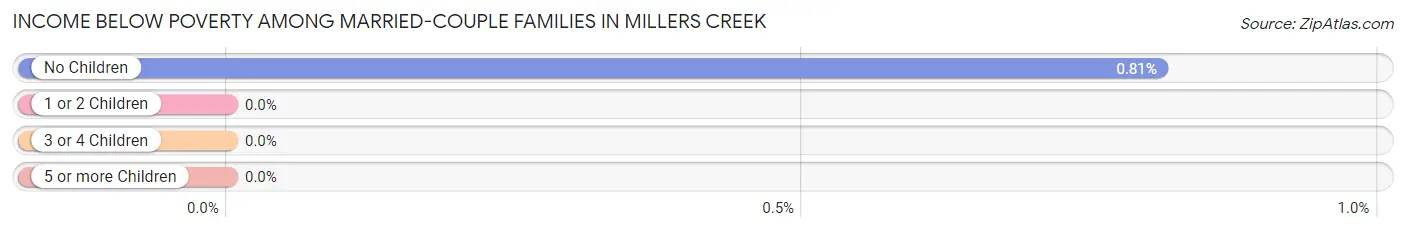
| Children | Above Poverty | Below Poverty |
| No Children | 245 (99.2%) | 2 (0.8%) |
| 1 or 2 Children | 86 (100.0%) | 0 (0.0%) |
| 3 or 4 Children | 0 (0.0%) | 0 (0.0%) |
| 5 or more Children | 0 (0.0%) | 0 (0.0%) |
| Total | 331 (99.4%) | 2 (0.6%) |
Income Below Poverty Among Single-Parent Households in Millers Creek
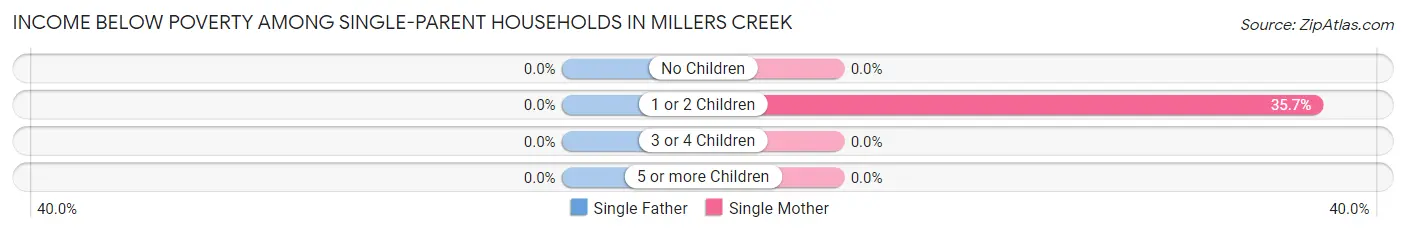
| Children | Single Father | Single Mother |
| No Children | 0 (0.0%) | 0 (0.0%) |
| 1 or 2 Children | 0 (0.0%) | 10 (35.7%) |
| 3 or 4 Children | 0 (0.0%) | 0 (0.0%) |
| 5 or more Children | 0 (0.0%) | 0 (0.0%) |
| Total | 0 (0.0%) | 10 (22.7%) |
Income Below Poverty Among Married-Couple vs Single-Parent Households in Millers Creek
The poverty data for Millers Creek shows that 2 of the married-couple family households (0.6%) and 10 of the single-parent households (13.9%) are living below the poverty level. Within the married-couple family households, those with no children have the highest poverty rate, with 2 households (0.8%) falling below the poverty line. Among the single-parent households, those with 1 or 2 children have the highest poverty rate, with 10 household (22.2%) living below poverty.
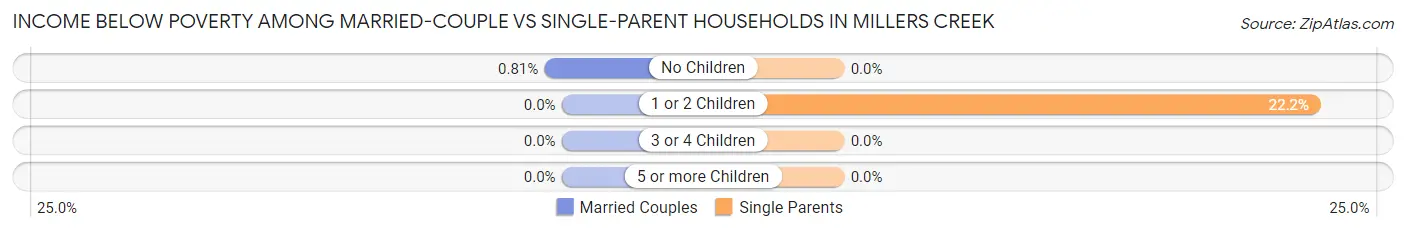
| Children | Married-Couple Families | Single-Parent Households |
| No Children | 2 (0.8%) | 0 (0.0%) |
| 1 or 2 Children | 0 (0.0%) | 10 (22.2%) |
| 3 or 4 Children | 0 (0.0%) | 0 (0.0%) |
| 5 or more Children | 0 (0.0%) | 0 (0.0%) |
| Total | 2 (0.6%) | 10 (13.9%) |
Race in Millers Creek
The most populous races in Millers Creek are White / Caucasian (1,424 | 96.5%), Hawaiian / Pacific (42 | 2.9%), and Hispanic or Latino (33 | 2.2%).
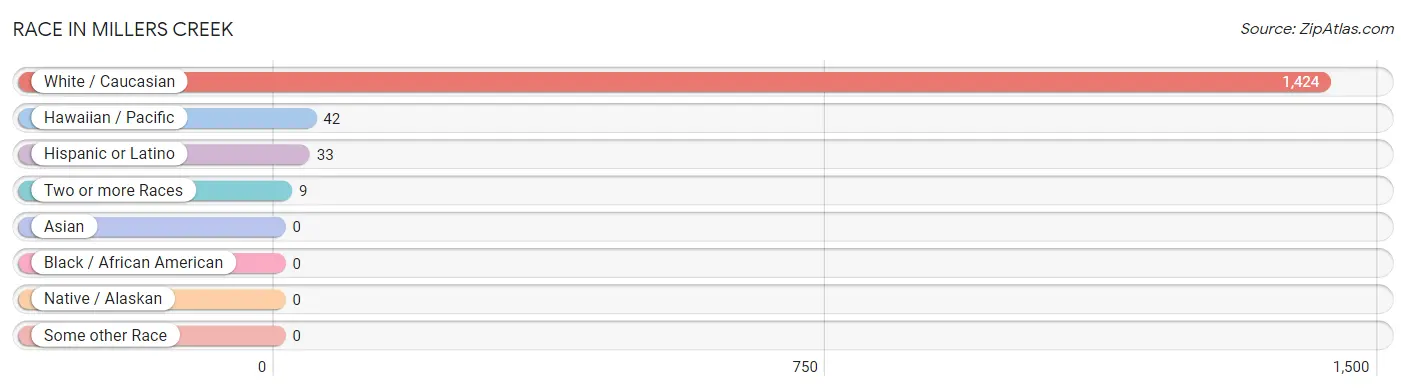
| Race | # Population | % Population |
| Asian | 0 | 0.0% |
| Black / African American | 0 | 0.0% |
| Hawaiian / Pacific | 42 | 2.9% |
| Hispanic or Latino | 33 | 2.2% |
| Native / Alaskan | 0 | 0.0% |
| White / Caucasian | 1,424 | 96.5% |
| Two or more Races | 9 | 0.6% |
| Some other Race | 0 | 0.0% |
| Total | 1,475 | 100.0% |
Ancestry in Millers Creek
The most populous ancestries reported in Millers Creek are American (479 | 32.5%), English (142 | 9.6%), German (99 | 6.7%), Irish (65 | 4.4%), and Scotch-Irish (52 | 3.5%), together accounting for 56.8% of all Millers Creek residents.
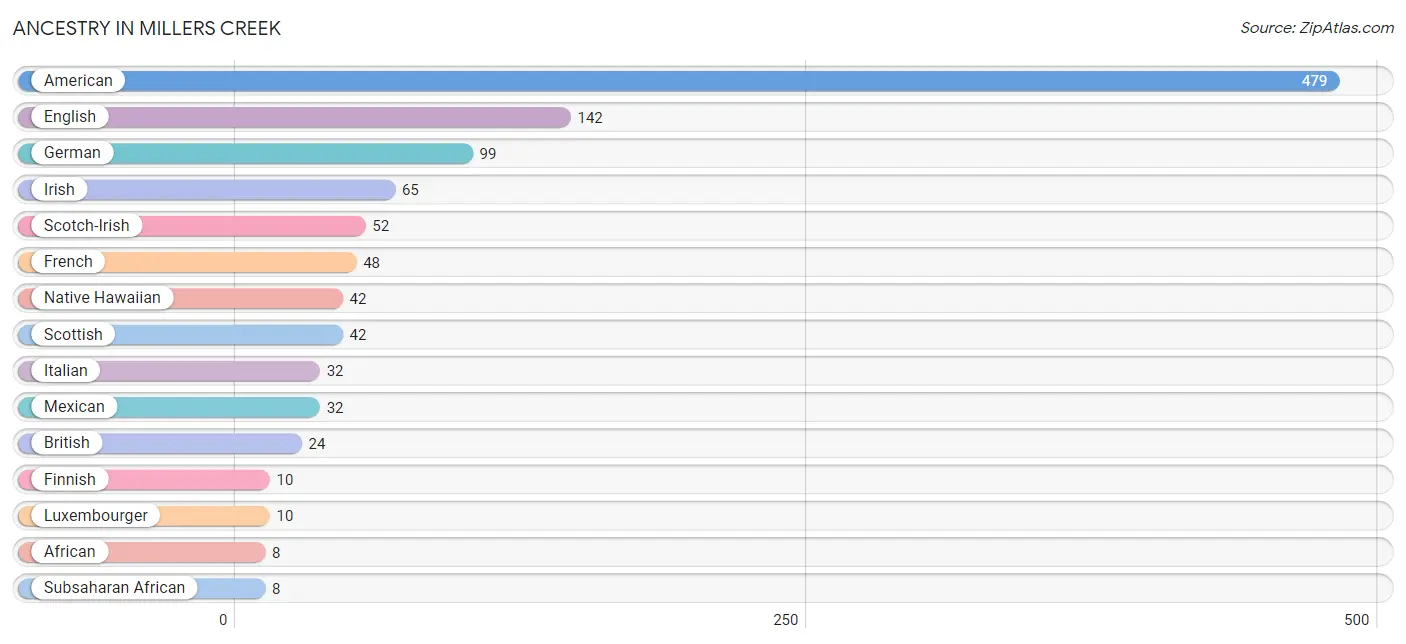
| Ancestry | # Population | % Population |
| African | 8 | 0.5% |
| American | 479 | 32.5% |
| British | 24 | 1.6% |
| English | 142 | 9.6% |
| Finnish | 10 | 0.7% |
| French | 48 | 3.3% |
| German | 99 | 6.7% |
| Irish | 65 | 4.4% |
| Italian | 32 | 2.2% |
| Luxembourger | 10 | 0.7% |
| Mexican | 32 | 2.2% |
| Native Hawaiian | 42 | 2.9% |
| Scotch-Irish | 52 | 3.5% |
| Scottish | 42 | 2.9% |
| Spanish | 1 | 0.1% |
| Subsaharan African | 8 | 0.5% | View All 16 Rows |
Immigrants in Millers Creek
The most numerous immigrant groups reported in Millers Creek came from Asia (42 | 2.9%), Philippines (42 | 2.9%), South Eastern Asia (42 | 2.9%), Central America (32 | 2.2%), and Latin America (32 | 2.2%), together accounting for 12.9% of all Millers Creek residents.
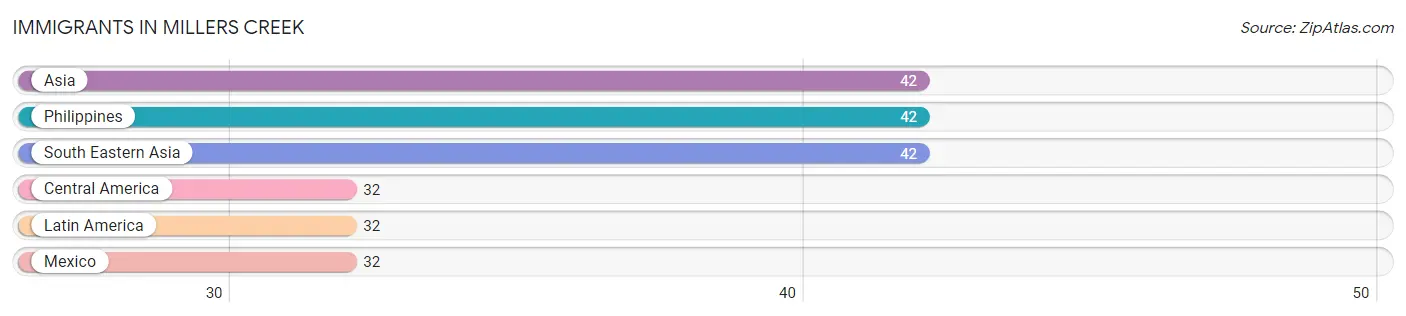
| Immigration Origin | # Population | % Population |
| Asia | 42 | 2.9% |
| Central America | 32 | 2.2% |
| Latin America | 32 | 2.2% |
| Mexico | 32 | 2.2% |
| Philippines | 42 | 2.9% |
| South Eastern Asia | 42 | 2.9% | View All 6 Rows |
Sex and Age in Millers Creek
Sex and Age in Millers Creek
The most populous age groups in Millers Creek are 65 to 69 Years (117 | 15.9%) for men and 70 to 74 Years (90 | 12.2%) for women.
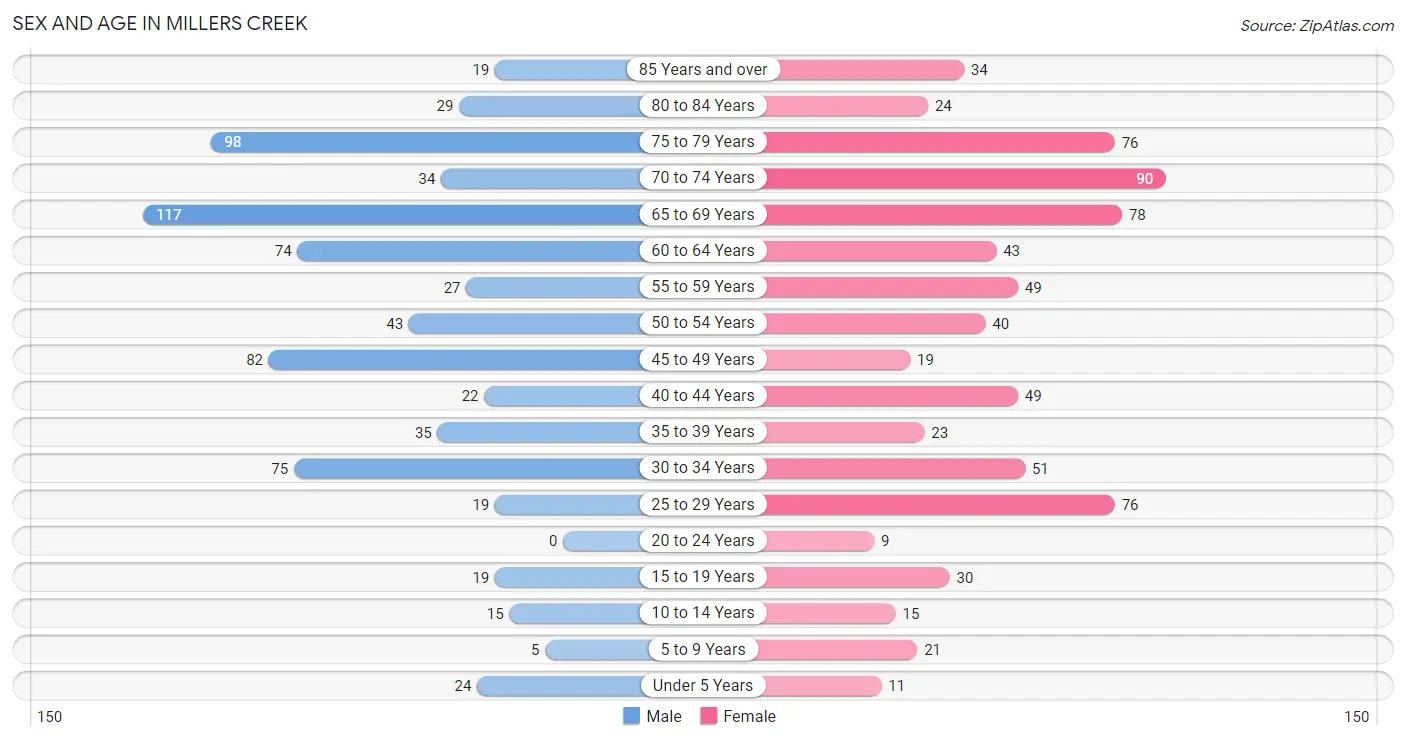
| Age Bracket | Male | Female |
| Under 5 Years | 24 (3.3%) | 11 (1.5%) |
| 5 to 9 Years | 5 (0.7%) | 21 (2.9%) |
| 10 to 14 Years | 15 (2.0%) | 15 (2.0%) |
| 15 to 19 Years | 19 (2.6%) | 30 (4.1%) |
| 20 to 24 Years | 0 (0.0%) | 9 (1.2%) |
| 25 to 29 Years | 19 (2.6%) | 76 (10.3%) |
| 30 to 34 Years | 75 (10.2%) | 51 (6.9%) |
| 35 to 39 Years | 35 (4.8%) | 23 (3.1%) |
| 40 to 44 Years | 22 (3.0%) | 49 (6.6%) |
| 45 to 49 Years | 82 (11.1%) | 19 (2.6%) |
| 50 to 54 Years | 43 (5.8%) | 40 (5.4%) |
| 55 to 59 Years | 27 (3.7%) | 49 (6.6%) |
| 60 to 64 Years | 74 (10.0%) | 43 (5.8%) |
| 65 to 69 Years | 117 (15.9%) | 78 (10.6%) |
| 70 to 74 Years | 34 (4.6%) | 90 (12.2%) |
| 75 to 79 Years | 98 (13.3%) | 76 (10.3%) |
| 80 to 84 Years | 29 (3.9%) | 24 (3.3%) |
| 85 Years and over | 19 (2.6%) | 34 (4.6%) |
| Total | 737 (100.0%) | 738 (100.0%) |
Families and Households in Millers Creek
Median Family Size in Millers Creek
The median family size in Millers Creek is 2.54 persons per family, with single male/father families (28 | 6.9%) accounting for the largest median family size of 2.64 persons per family. On the other hand, single female/mother families (44 | 10.9%) represent the smallest median family size with 1.95 persons per family.
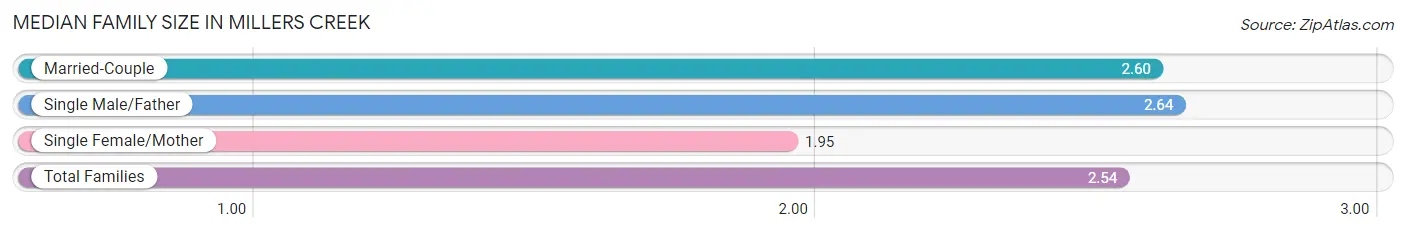
| Family Type | # Families | Family Size |
| Married-Couple | 333 (82.2%) | 2.60 |
| Single Male/Father | 28 (6.9%) | 2.64 |
| Single Female/Mother | 44 (10.9%) | 1.95 |
| Total Families | 405 (100.0%) | 2.54 |
Median Household Size in Millers Creek
The median household size in Millers Creek is 1.94 persons per household, with single male/father households (28 | 3.7%) accounting for the largest median household size of 2.64 persons per household. non-family households (354 | 46.6%) represent the smallest median household size with 1.23 persons per household.
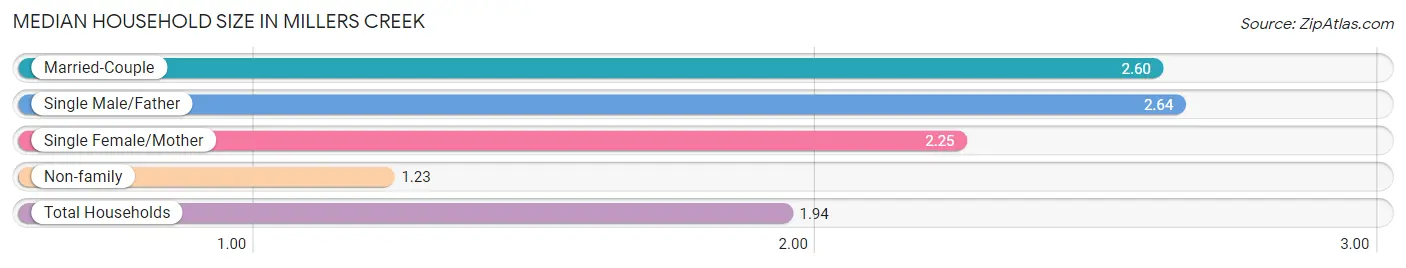
| Household Type | # Households | Household Size |
| Married-Couple | 333 (43.9%) | 2.60 |
| Single Male/Father | 28 (3.7%) | 2.64 |
| Single Female/Mother | 44 (5.8%) | 2.25 |
| Non-family | 354 (46.6%) | 1.23 |
| Total Households | 759 (100.0%) | 1.94 |
Household Size by Marriage Status in Millers Creek
Out of a total of 759 households in Millers Creek, 405 (53.4%) are family households, while 354 (46.6%) are nonfamily households. The most numerous type of family households are 2-person households, comprising 258, and the most common type of nonfamily households are 1-person households, comprising 279.
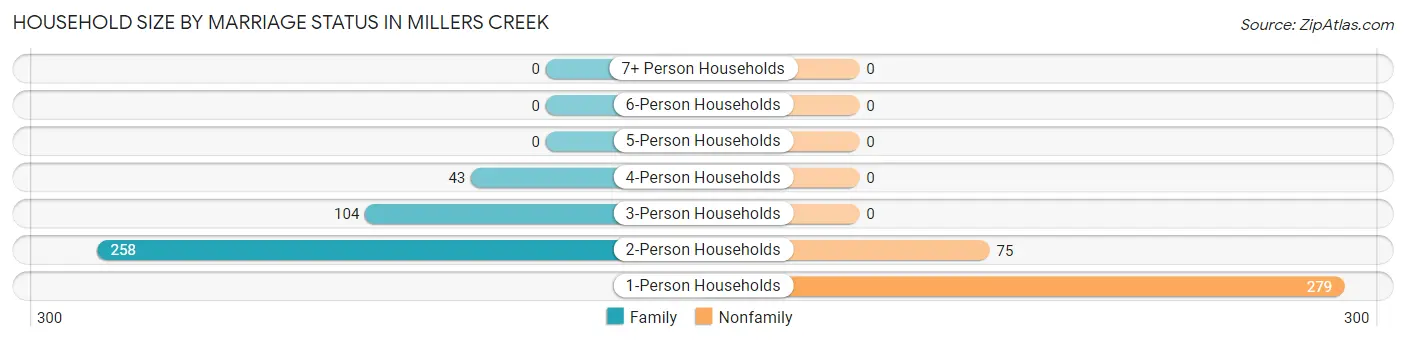
| Household Size | Family Households | Nonfamily Households |
| 1-Person Households | - | 279 (36.8%) |
| 2-Person Households | 258 (34.0%) | 75 (9.9%) |
| 3-Person Households | 104 (13.7%) | 0 (0.0%) |
| 4-Person Households | 43 (5.7%) | 0 (0.0%) |
| 5-Person Households | 0 (0.0%) | 0 (0.0%) |
| 6-Person Households | 0 (0.0%) | 0 (0.0%) |
| 7+ Person Households | 0 (0.0%) | 0 (0.0%) |
| Total | 405 (53.4%) | 354 (46.6%) |
Female Fertility in Millers Creek
Fertility by Age in Millers Creek
| Age Bracket | Women with Births | Births / 1,000 Women |
| 15 to 19 years | 0 (0.0%) | 0.0 |
| 20 to 34 years | 0 (0.0%) | 0.0 |
| 35 to 50 years | 0 (0.0%) | 0.0 |
| Total | 0 (0.0%) | 0.0 |
Fertility by Age by Marriage Status in Millers Creek
| Age Bracket | Married | Unmarried |
| 15 to 19 years | 0 (0.0%) | 0 (0.0%) |
| 20 to 34 years | 0 (0.0%) | 0 (0.0%) |
| 35 to 50 years | 0 (0.0%) | 0 (0.0%) |
| Total | 0 (0.0%) | 0 (0.0%) |
Fertility by Education in Millers Creek
| Educational Attainment | Women with Births | Births / 1,000 Women |
| Less than High School | 0 (0.0%) | 0.0 |
| High School Diploma | 0 (0.0%) | 0.0 |
| College or Associate's Degree | 0 (0.0%) | 0.0 |
| Bachelor's Degree | 0 (0.0%) | 0.0 |
| Graduate Degree | 0 (0.0%) | 0.0 |
| Total | 0 (0.0%) | 0.0 |
Fertility by Education by Marriage Status in Millers Creek
| Educational Attainment | Married | Unmarried |
| Less than High School | 0 (0.0%) | 0 (0.0%) |
| High School Diploma | 0 (0.0%) | 0 (0.0%) |
| College or Associate's Degree | 0 (0.0%) | 0 (0.0%) |
| Bachelor's Degree | 0 (0.0%) | 0 (0.0%) |
| Graduate Degree | 0 (0.0%) | 0 (0.0%) |
| Total | 0 (0.0%) | 0 (0.0%) |
Employment Characteristics in Millers Creek
Employment by Class of Employer in Millers Creek
Among the 668 employed individuals in Millers Creek, private company employees (509 | 76.2%), self-employed (not incorporated) (63 | 9.4%), and not-for-profit organizations (56 | 8.4%) make up the most common classes of employment.
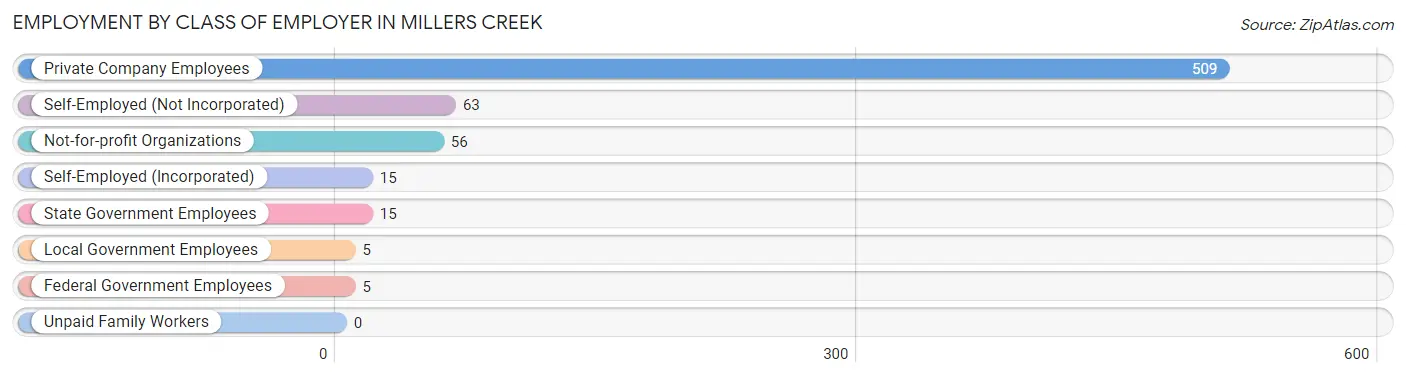
| Employer Class | # Employees | % Employees |
| Private Company Employees | 509 | 76.2% |
| Self-Employed (Incorporated) | 15 | 2.2% |
| Self-Employed (Not Incorporated) | 63 | 9.4% |
| Not-for-profit Organizations | 56 | 8.4% |
| Local Government Employees | 5 | 0.7% |
| State Government Employees | 15 | 2.2% |
| Federal Government Employees | 5 | 0.7% |
| Unpaid Family Workers | 0 | 0.0% |
| Total | 668 | 100.0% |
Employment Status by Age in Millers Creek
According to the labor force statistics for Millers Creek, out of the total population over 16 years of age (1,384), 54.0% or 747 individuals are in the labor force, with 7.1% or 53 of them unemployed. The age group with the highest labor force participation rate is 20 to 24 years, with 100.0% or 9 individuals in the labor force. Within the labor force, the 16 to 19 years age range has the highest percentage of unemployed individuals, with 100.0% or 11 of them being unemployed.
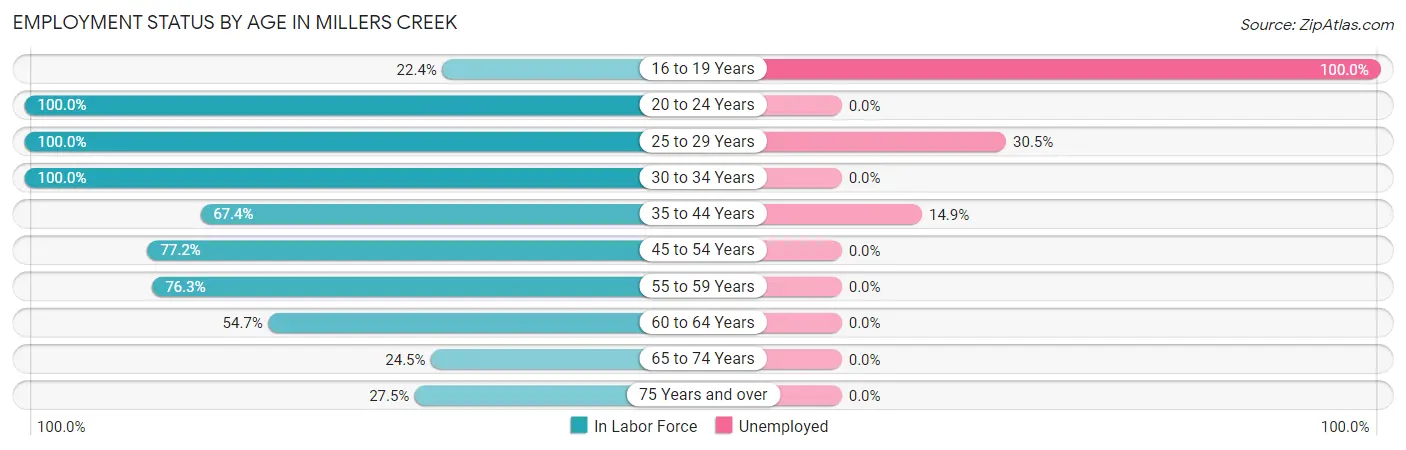
| Age Bracket | In Labor Force | Unemployed |
| 16 to 19 Years | 11 (22.4%) | 11 (100.0%) |
| 20 to 24 Years | 9 (100.0%) | 0 (0.0%) |
| 25 to 29 Years | 95 (100.0%) | 29 (30.5%) |
| 30 to 34 Years | 126 (100.0%) | 0 (0.0%) |
| 35 to 44 Years | 87 (67.4%) | 13 (14.9%) |
| 45 to 54 Years | 142 (77.2%) | 0 (0.0%) |
| 55 to 59 Years | 58 (76.3%) | 0 (0.0%) |
| 60 to 64 Years | 64 (54.7%) | 0 (0.0%) |
| 65 to 74 Years | 78 (24.5%) | 0 (0.0%) |
| 75 Years and over | 77 (27.5%) | 0 (0.0%) |
| Total | 747 (54.0%) | 53 (7.1%) |
Employment Status by Educational Attainment in Millers Creek
According to labor force statistics for Millers Creek, 78.7% of individuals (572) out of the total population between 25 and 64 years of age (727) are in the labor force, with 7.3% or 42 of them being unemployed. The group with the highest labor force participation rate are those with the educational attainment of bachelor's degree or higher, with 100.0% or 65 individuals in the labor force. Within the labor force, individuals with college / associate degree education have the highest percentage of unemployment, with 14.9% or 29 of them being unemployed.
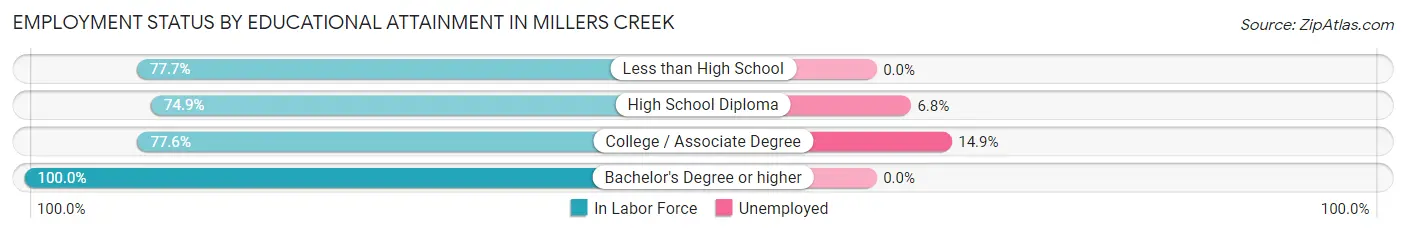
| Educational Attainment | In Labor Force | Unemployed |
| Less than High School | 122 (77.7%) | 0 (0.0%) |
| High School Diploma | 191 (74.9%) | 17 (6.8%) |
| College / Associate Degree | 194 (77.6%) | 37 (14.9%) |
| Bachelor's Degree or higher | 65 (100.0%) | 0 (0.0%) |
| Total | 572 (78.7%) | 53 (7.3%) |
Employment Occupations by Sex in Millers Creek
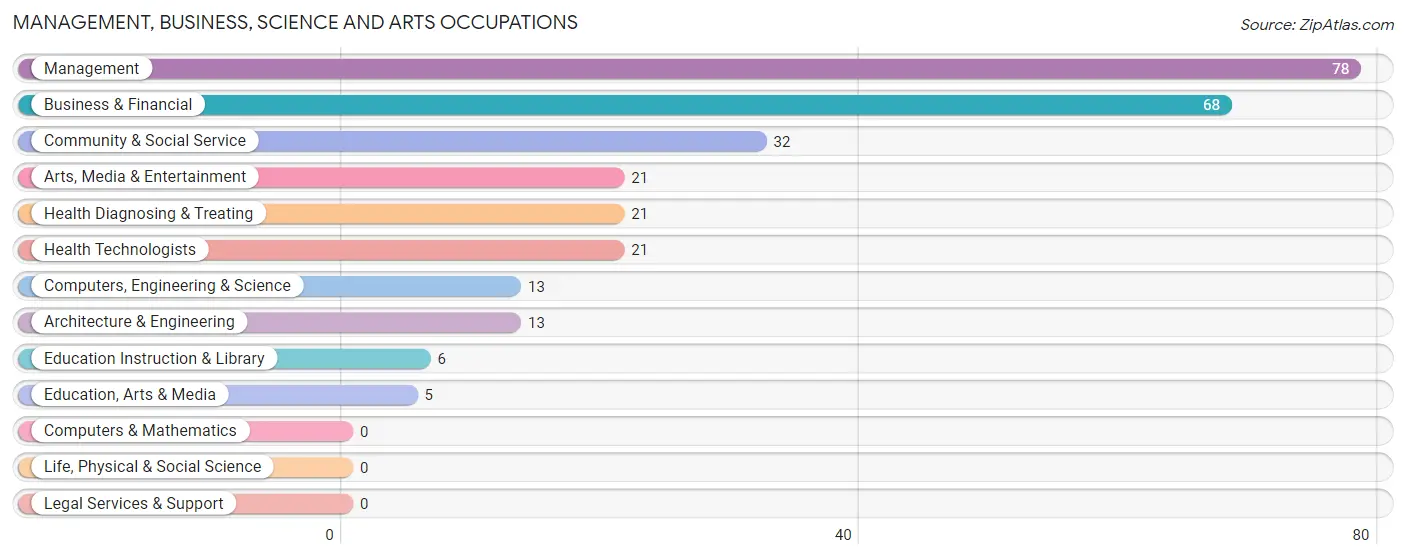
Management, Business, Science and Arts Occupations
The most common Management, Business, Science and Arts occupations in Millers Creek are Management (78 | 11.2%), Business & Financial (68 | 9.8%), Community & Social Service (32 | 4.6%), Arts, Media & Entertainment (21 | 3.0%), and Health Diagnosing & Treating (21 | 3.0%).
Management, Business, Science and Arts Occupations by Sex
Within the Management, Business, Science and Arts occupations in Millers Creek, the most male-oriented occupations are Computers, Engineering & Science (100.0%), Architecture & Engineering (100.0%), and Education Instruction & Library (100.0%), while the most female-oriented occupations are Education, Arts & Media (100.0%), Arts, Media & Entertainment (100.0%), and Health Diagnosing & Treating (100.0%).
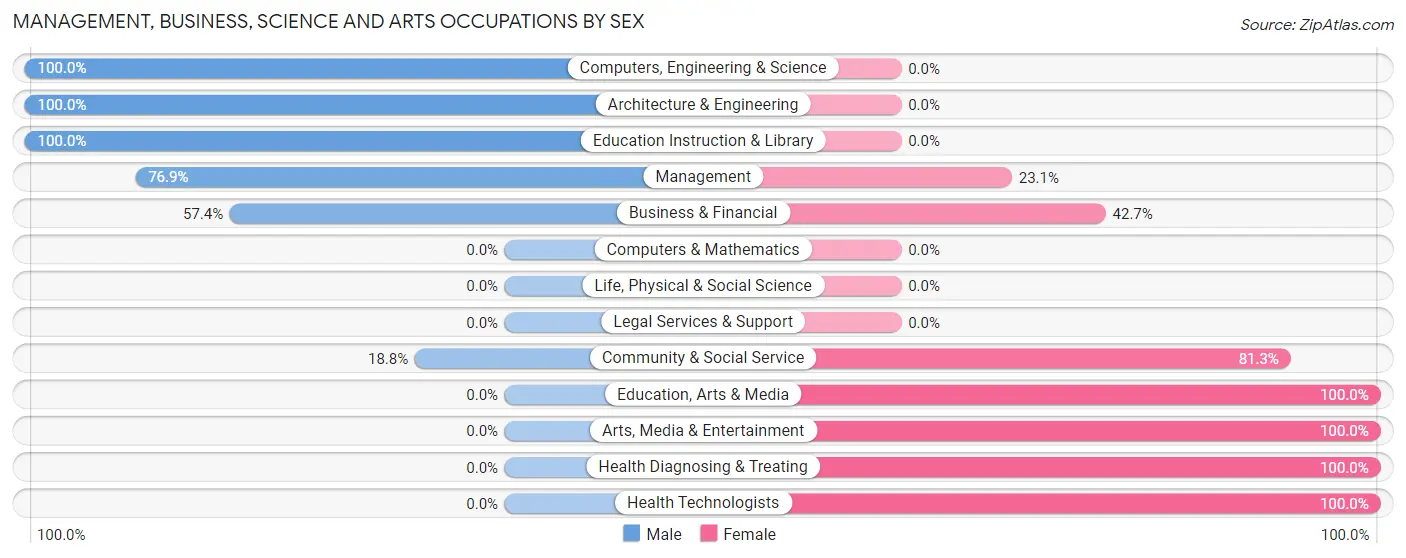
| Occupation | Male | Female |
| Management | 60 (76.9%) | 18 (23.1%) |
| Business & Financial | 39 (57.4%) | 29 (42.6%) |
| Computers, Engineering & Science | 13 (100.0%) | 0 (0.0%) |
| Computers & Mathematics | 0 (0.0%) | 0 (0.0%) |
| Architecture & Engineering | 13 (100.0%) | 0 (0.0%) |
| Life, Physical & Social Science | 0 (0.0%) | 0 (0.0%) |
| Community & Social Service | 6 (18.8%) | 26 (81.2%) |
| Education, Arts & Media | 0 (0.0%) | 5 (100.0%) |
| Legal Services & Support | 0 (0.0%) | 0 (0.0%) |
| Education Instruction & Library | 6 (100.0%) | 0 (0.0%) |
| Arts, Media & Entertainment | 0 (0.0%) | 21 (100.0%) |
| Health Diagnosing & Treating | 0 (0.0%) | 21 (100.0%) |
| Health Technologists | 0 (0.0%) | 21 (100.0%) |
| Total (Category) | 118 (55.7%) | 94 (44.3%) |
| Total (Overall) | 438 (63.1%) | 256 (36.9%) |
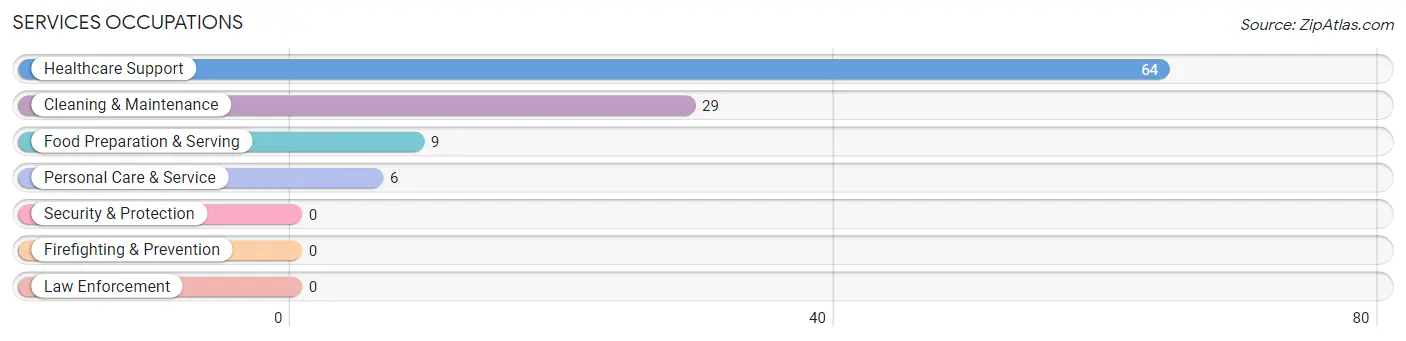
Services Occupations
The most common Services occupations in Millers Creek are Healthcare Support (64 | 9.2%), Cleaning & Maintenance (29 | 4.2%), Food Preparation & Serving (9 | 1.3%), and Personal Care & Service (6 | 0.9%).
Services Occupations by Sex
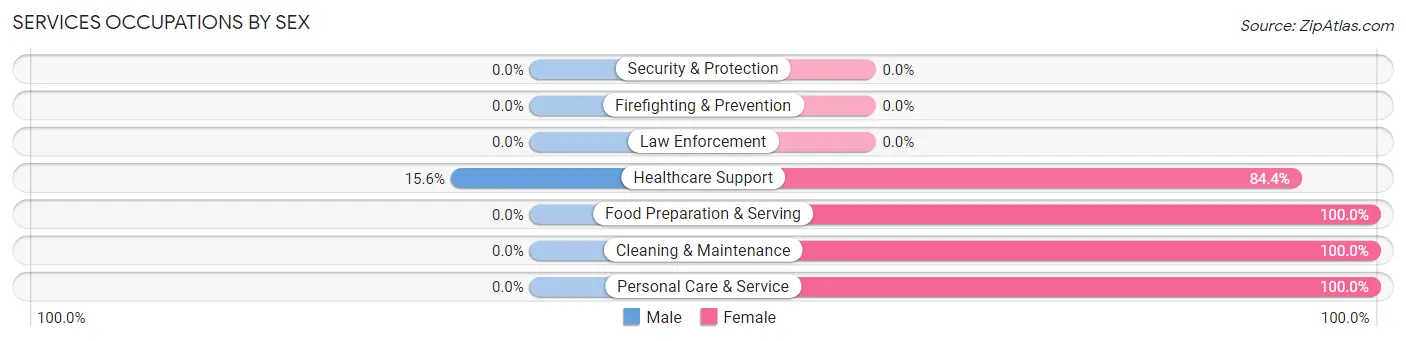
| Occupation | Male | Female |
| Healthcare Support | 10 (15.6%) | 54 (84.4%) |
| Security & Protection | 0 (0.0%) | 0 (0.0%) |
| Firefighting & Prevention | 0 (0.0%) | 0 (0.0%) |
| Law Enforcement | 0 (0.0%) | 0 (0.0%) |
| Food Preparation & Serving | 0 (0.0%) | 9 (100.0%) |
| Cleaning & Maintenance | 0 (0.0%) | 29 (100.0%) |
| Personal Care & Service | 0 (0.0%) | 6 (100.0%) |
| Total (Category) | 10 (9.3%) | 98 (90.7%) |
| Total (Overall) | 438 (63.1%) | 256 (36.9%) |
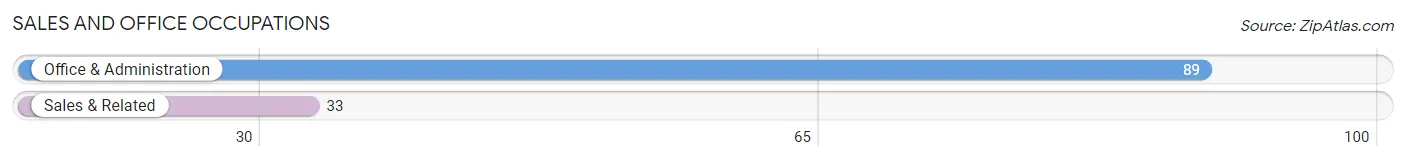
Sales and Office Occupations
The most common Sales and Office occupations in Millers Creek are Office & Administration (89 | 12.8%), and Sales & Related (33 | 4.8%).
Sales and Office Occupations by Sex
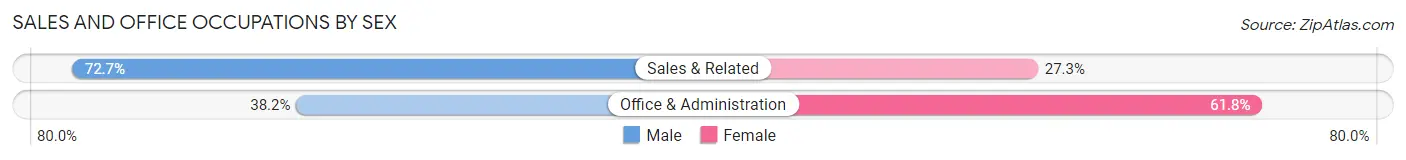
| Occupation | Male | Female |
| Sales & Related | 24 (72.7%) | 9 (27.3%) |
| Office & Administration | 34 (38.2%) | 55 (61.8%) |
| Total (Category) | 58 (47.5%) | 64 (52.5%) |
| Total (Overall) | 438 (63.1%) | 256 (36.9%) |
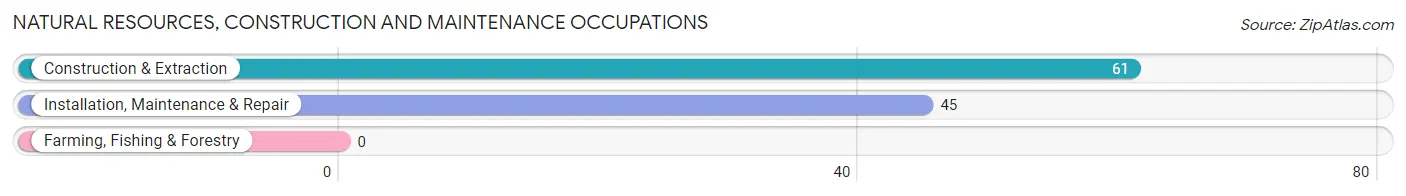
Natural Resources, Construction and Maintenance Occupations
The most common Natural Resources, Construction and Maintenance occupations in Millers Creek are Construction & Extraction (61 | 8.8%), and Installation, Maintenance & Repair (45 | 6.5%).
Natural Resources, Construction and Maintenance Occupations by Sex
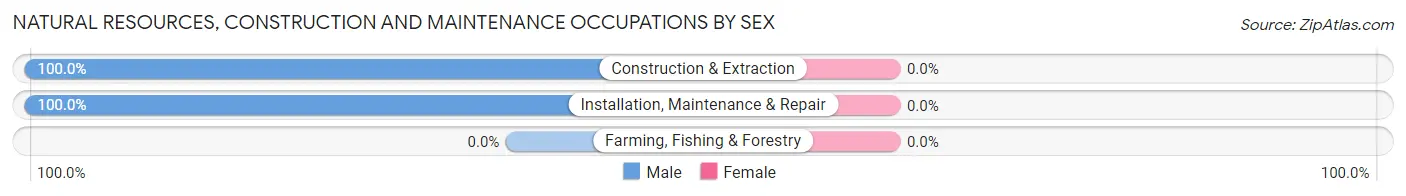
| Occupation | Male | Female |
| Farming, Fishing & Forestry | 0 (0.0%) | 0 (0.0%) |
| Construction & Extraction | 61 (100.0%) | 0 (0.0%) |
| Installation, Maintenance & Repair | 45 (100.0%) | 0 (0.0%) |
| Total (Category) | 106 (100.0%) | 0 (0.0%) |
| Total (Overall) | 438 (63.1%) | 256 (36.9%) |
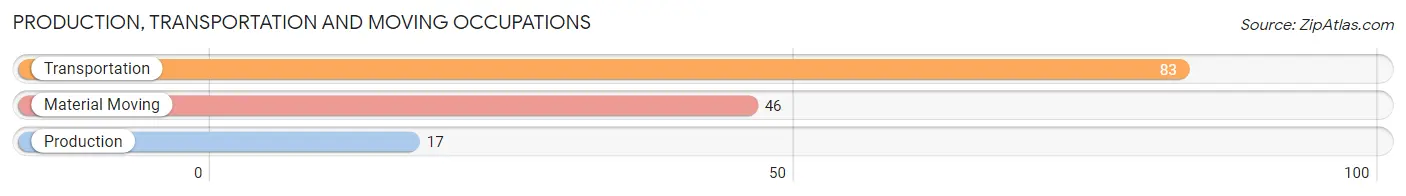
Production, Transportation and Moving Occupations
The most common Production, Transportation and Moving occupations in Millers Creek are Transportation (83 | 12.0%), Material Moving (46 | 6.6%), and Production (17 | 2.5%).
Production, Transportation and Moving Occupations by Sex
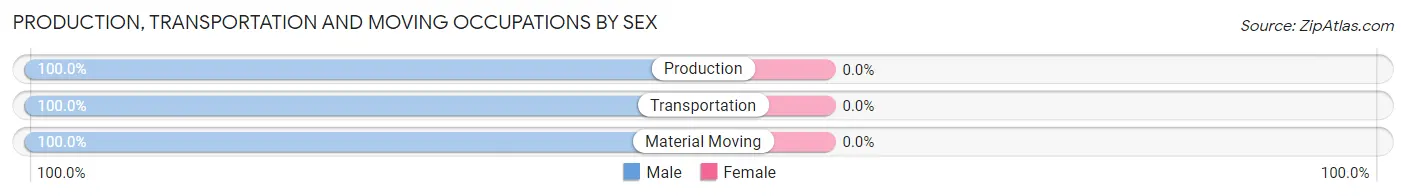
| Occupation | Male | Female |
| Production | 17 (100.0%) | 0 (0.0%) |
| Transportation | 83 (100.0%) | 0 (0.0%) |
| Material Moving | 46 (100.0%) | 0 (0.0%) |
| Total (Category) | 146 (100.0%) | 0 (0.0%) |
| Total (Overall) | 438 (63.1%) | 256 (36.9%) |
Employment Industries by Sex in Millers Creek
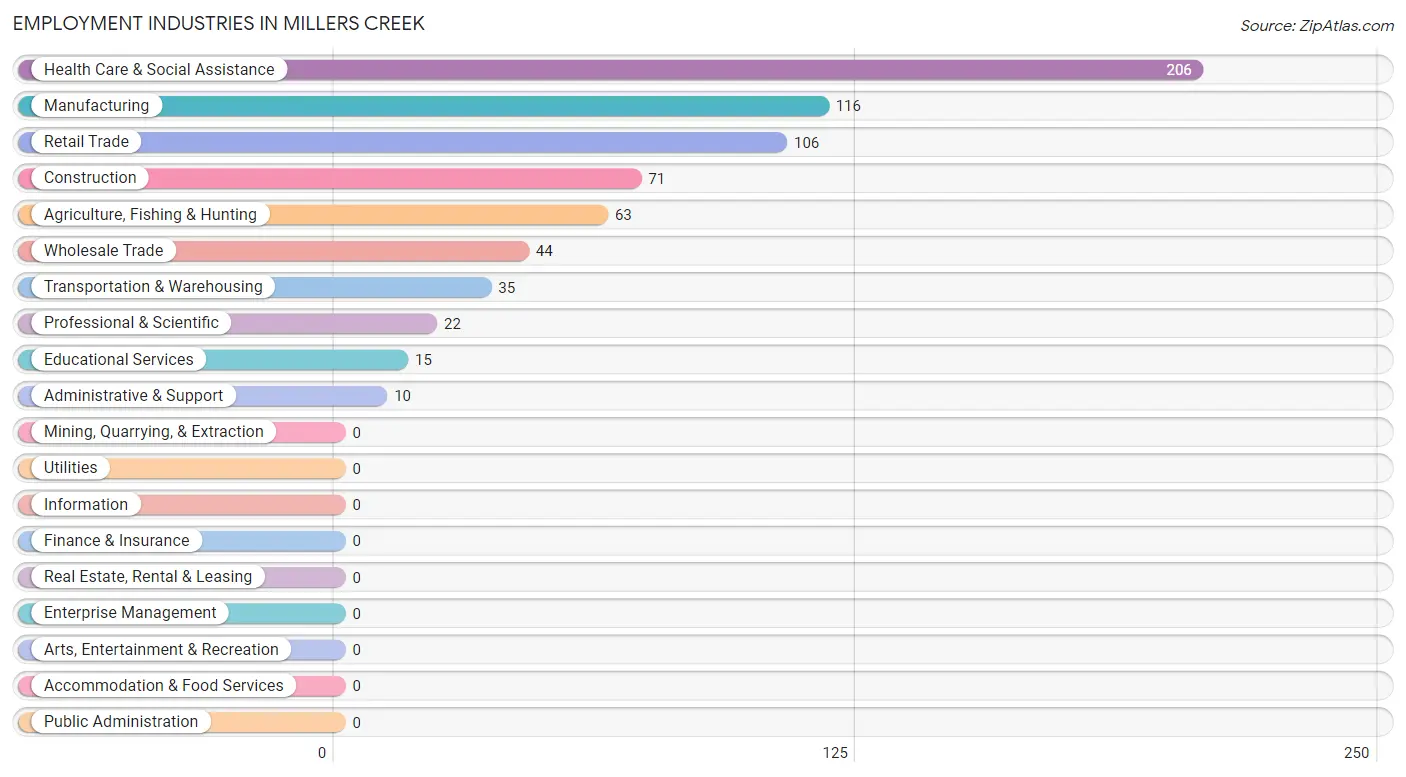
Employment Industries in Millers Creek
The major employment industries in Millers Creek include Health Care & Social Assistance (206 | 29.7%), Manufacturing (116 | 16.7%), Retail Trade (106 | 15.3%), Construction (71 | 10.2%), and Agriculture, Fishing & Hunting (63 | 9.1%).
Employment Industries by Sex in Millers Creek
The Millers Creek industries that see more men than women are Agriculture, Fishing & Hunting (100.0%), Construction (100.0%), and Wholesale Trade (100.0%), whereas the industries that tend to have a higher number of women are Administrative & Support (100.0%), Health Care & Social Assistance (78.6%), and Educational Services (60.0%).
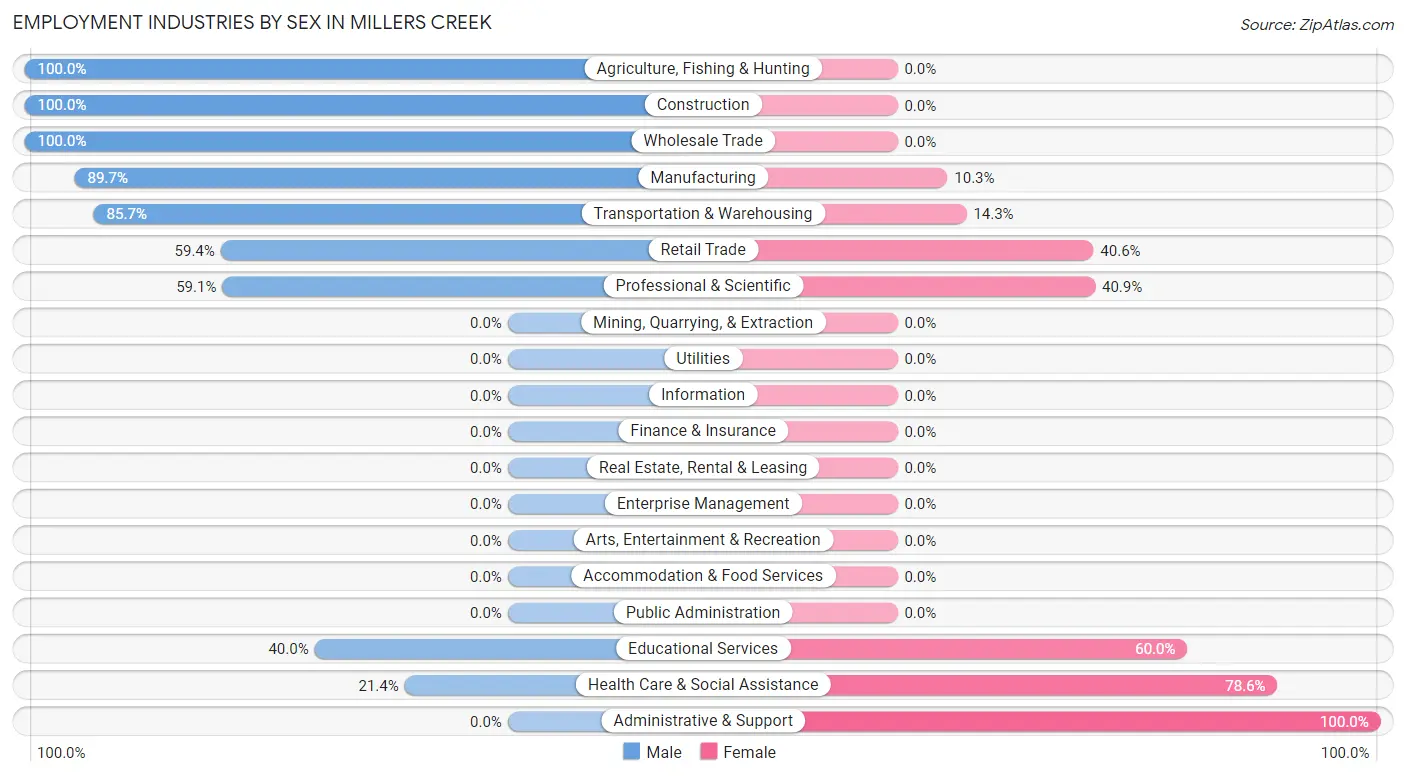
| Industry | Male | Female |
| Agriculture, Fishing & Hunting | 63 (100.0%) | 0 (0.0%) |
| Mining, Quarrying, & Extraction | 0 (0.0%) | 0 (0.0%) |
| Construction | 71 (100.0%) | 0 (0.0%) |
| Manufacturing | 104 (89.7%) | 12 (10.3%) |
| Wholesale Trade | 44 (100.0%) | 0 (0.0%) |
| Retail Trade | 63 (59.4%) | 43 (40.6%) |
| Transportation & Warehousing | 30 (85.7%) | 5 (14.3%) |
| Utilities | 0 (0.0%) | 0 (0.0%) |
| Information | 0 (0.0%) | 0 (0.0%) |
| Finance & Insurance | 0 (0.0%) | 0 (0.0%) |
| Real Estate, Rental & Leasing | 0 (0.0%) | 0 (0.0%) |
| Professional & Scientific | 13 (59.1%) | 9 (40.9%) |
| Enterprise Management | 0 (0.0%) | 0 (0.0%) |
| Administrative & Support | 0 (0.0%) | 10 (100.0%) |
| Educational Services | 6 (40.0%) | 9 (60.0%) |
| Health Care & Social Assistance | 44 (21.4%) | 162 (78.6%) |
| Arts, Entertainment & Recreation | 0 (0.0%) | 0 (0.0%) |
| Accommodation & Food Services | 0 (0.0%) | 0 (0.0%) |
| Public Administration | 0 (0.0%) | 0 (0.0%) |
| Total | 438 (63.1%) | 256 (36.9%) |
Education in Millers Creek
School Enrollment in Millers Creek
The most common levels of schooling among the 121 students in Millers Creek are high school (47 | 38.8%), elementary school (21 | 17.4%), and middle school (21 | 17.4%).
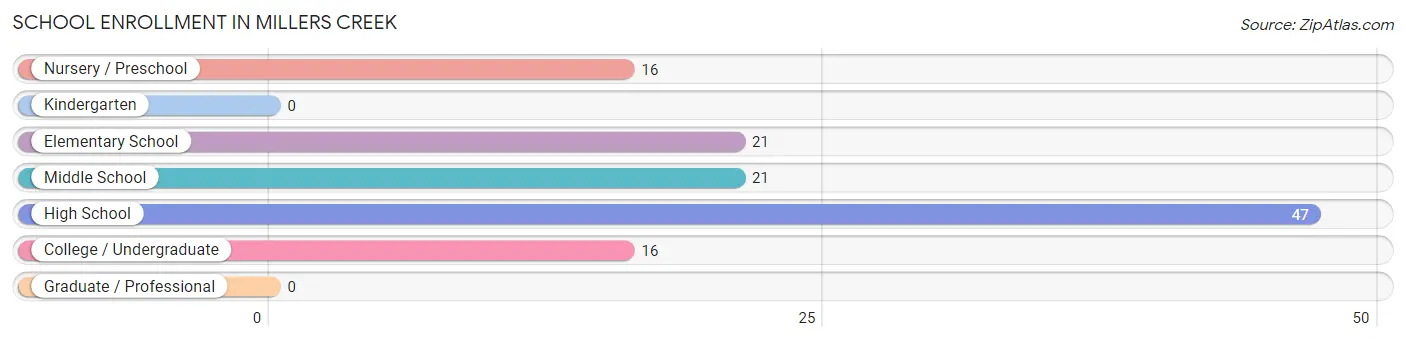
| School Level | # Students | % Students |
| Nursery / Preschool | 16 | 13.2% |
| Kindergarten | 0 | 0.0% |
| Elementary School | 21 | 17.4% |
| Middle School | 21 | 17.4% |
| High School | 47 | 38.8% |
| College / Undergraduate | 16 | 13.2% |
| Graduate / Professional | 0 | 0.0% |
| Total | 121 | 100.0% |
School Enrollment by Age by Funding Source in Millers Creek
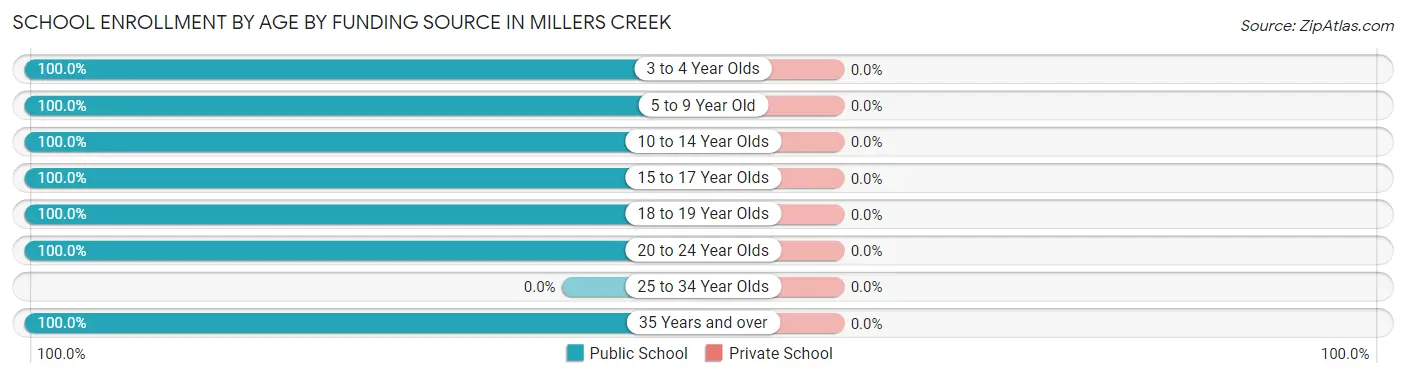
| Age Bracket | Public School | Private School |
| 3 to 4 Year Olds | 16 (100.0%) | 0 (0.0%) |
| 5 to 9 Year Old | 21 (100.0%) | 0 (0.0%) |
| 10 to 14 Year Olds | 30 (100.0%) | 0 (0.0%) |
| 15 to 17 Year Olds | 24 (100.0%) | 0 (0.0%) |
| 18 to 19 Year Olds | 14 (100.0%) | 0 (0.0%) |
| 20 to 24 Year Olds | 9 (100.0%) | 0 (0.0%) |
| 25 to 34 Year Olds | 0 (0.0%) | 0 (0.0%) |
| 35 Years and over | 7 (100.0%) | 0 (0.0%) |
| Total | 121 (100.0%) | 0 (0.0%) |
Educational Attainment by Field of Study in Millers Creek
Science & technology (39 | 25.7%), arts & humanities (34 | 22.4%), social sciences (19 | 12.5%), business (19 | 12.5%), and education (15 | 9.9%) are the most common fields of study among 152 individuals in Millers Creek who have obtained a bachelor's degree or higher.
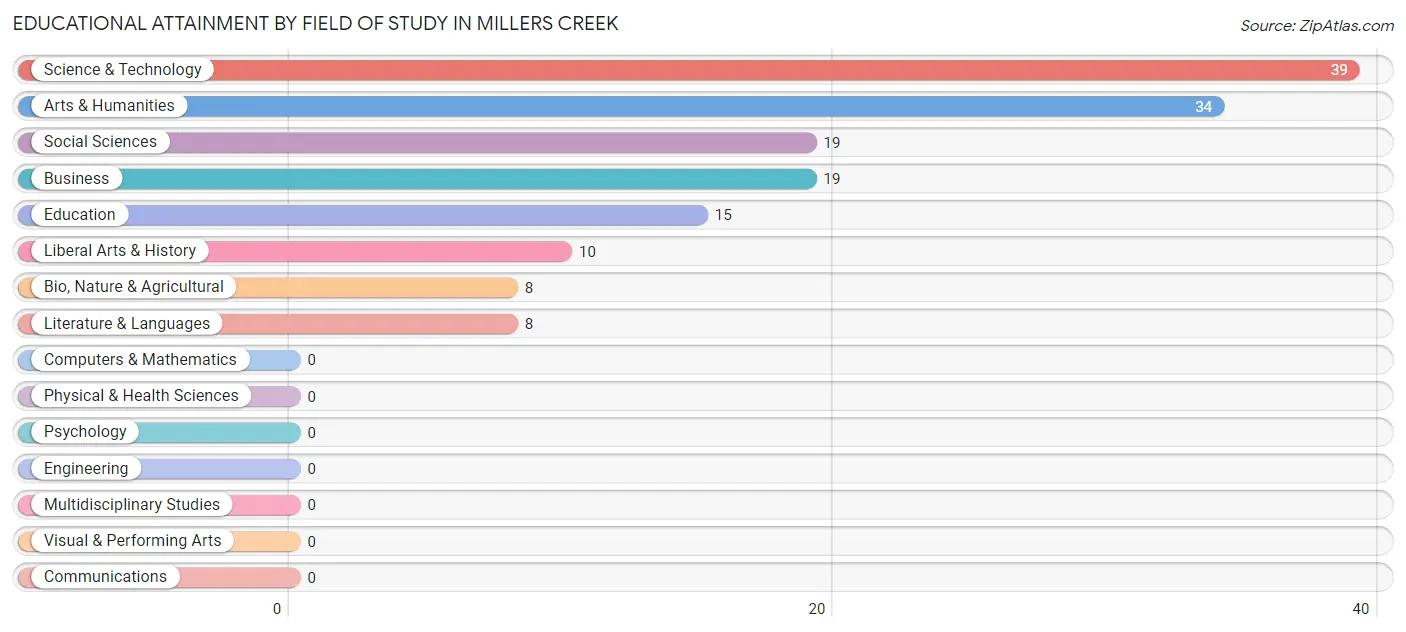
| Field of Study | # Graduates | % Graduates |
| Computers & Mathematics | 0 | 0.0% |
| Bio, Nature & Agricultural | 8 | 5.3% |
| Physical & Health Sciences | 0 | 0.0% |
| Psychology | 0 | 0.0% |
| Social Sciences | 19 | 12.5% |
| Engineering | 0 | 0.0% |
| Multidisciplinary Studies | 0 | 0.0% |
| Science & Technology | 39 | 25.7% |
| Business | 19 | 12.5% |
| Education | 15 | 9.9% |
| Literature & Languages | 8 | 5.3% |
| Liberal Arts & History | 10 | 6.6% |
| Visual & Performing Arts | 0 | 0.0% |
| Communications | 0 | 0.0% |
| Arts & Humanities | 34 | 22.4% |
| Total | 152 | 100.0% |
Transportation & Commute in Millers Creek
Vehicle Availability by Sex in Millers Creek
The most prevalent vehicle ownership categories in Millers Creek are males with 1 vehicle (147, accounting for 35.7%) and females with 1 vehicle (40, making up 57.4%).
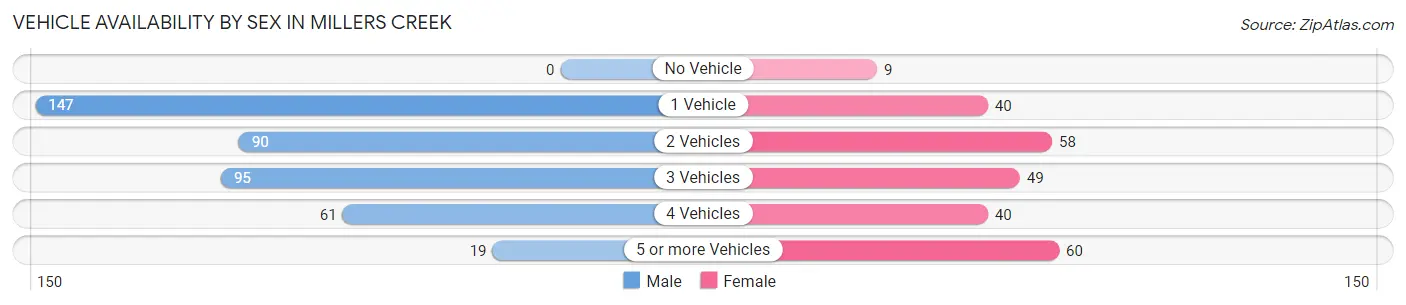
| Vehicles Available | Male | Female |
| No Vehicle | 0 (0.0%) | 9 (3.5%) |
| 1 Vehicle | 147 (35.7%) | 40 (15.6%) |
| 2 Vehicles | 90 (21.8%) | 58 (22.7%) |
| 3 Vehicles | 95 (23.1%) | 49 (19.1%) |
| 4 Vehicles | 61 (14.8%) | 40 (15.6%) |
| 5 or more Vehicles | 19 (4.6%) | 60 (23.4%) |
| Total | 412 (100.0%) | 256 (100.0%) |
Commute Time in Millers Creek
The most frequently occuring commute durations in Millers Creek are 10 to 14 minutes (176 commuters, 29.5%), 15 to 19 minutes (172 commuters, 28.8%), and 20 to 24 minutes (71 commuters, 11.9%).
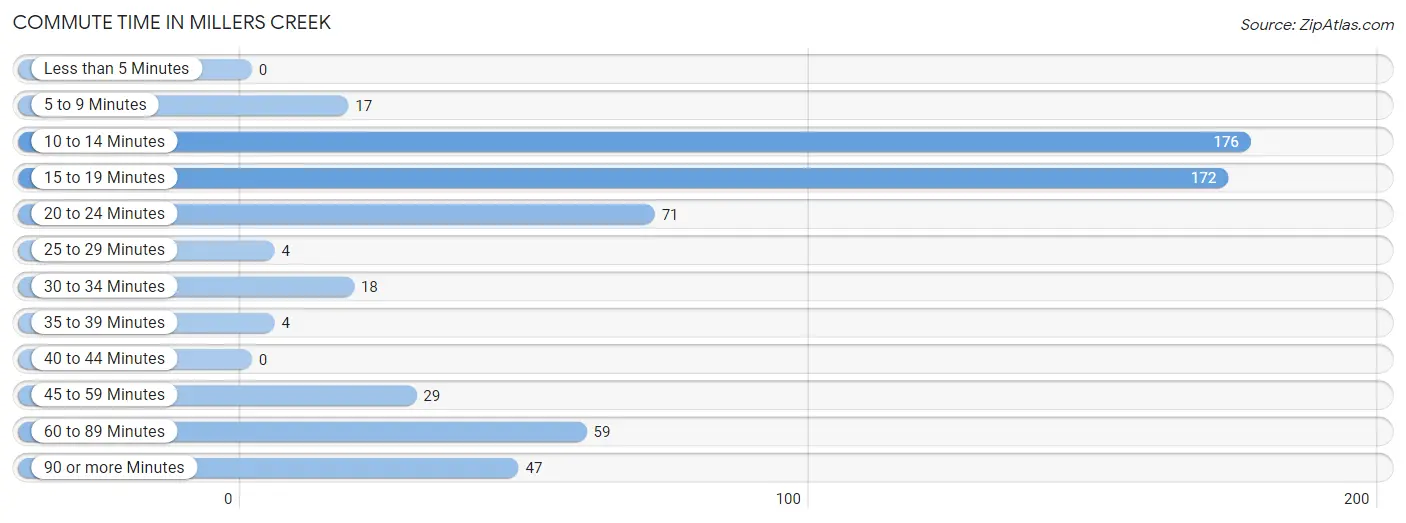
| Commute Time | # Commuters | % Commuters |
| Less than 5 Minutes | 0 | 0.0% |
| 5 to 9 Minutes | 17 | 2.9% |
| 10 to 14 Minutes | 176 | 29.5% |
| 15 to 19 Minutes | 172 | 28.8% |
| 20 to 24 Minutes | 71 | 11.9% |
| 25 to 29 Minutes | 4 | 0.7% |
| 30 to 34 Minutes | 18 | 3.0% |
| 35 to 39 Minutes | 4 | 0.7% |
| 40 to 44 Minutes | 0 | 0.0% |
| 45 to 59 Minutes | 29 | 4.9% |
| 60 to 89 Minutes | 59 | 9.9% |
| 90 or more Minutes | 47 | 7.9% |
Commute Time by Sex in Millers Creek
The most common commute times in Millers Creek are 10 to 14 minutes (95 commuters, 25.1%) for males and 15 to 19 minutes (86 commuters, 39.3%) for females.
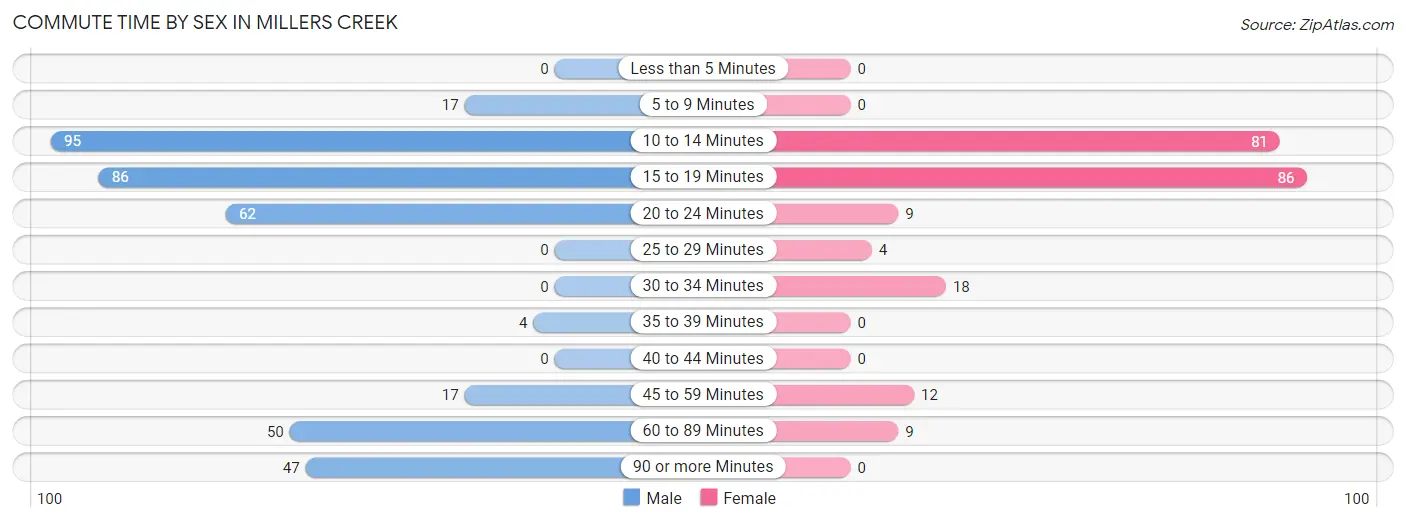
| Commute Time | Male | Female |
| Less than 5 Minutes | 0 (0.0%) | 0 (0.0%) |
| 5 to 9 Minutes | 17 (4.5%) | 0 (0.0%) |
| 10 to 14 Minutes | 95 (25.1%) | 81 (37.0%) |
| 15 to 19 Minutes | 86 (22.8%) | 86 (39.3%) |
| 20 to 24 Minutes | 62 (16.4%) | 9 (4.1%) |
| 25 to 29 Minutes | 0 (0.0%) | 4 (1.8%) |
| 30 to 34 Minutes | 0 (0.0%) | 18 (8.2%) |
| 35 to 39 Minutes | 4 (1.1%) | 0 (0.0%) |
| 40 to 44 Minutes | 0 (0.0%) | 0 (0.0%) |
| 45 to 59 Minutes | 17 (4.5%) | 12 (5.5%) |
| 60 to 89 Minutes | 50 (13.2%) | 9 (4.1%) |
| 90 or more Minutes | 47 (12.4%) | 0 (0.0%) |
Time of Departure to Work by Sex in Millers Creek
The most frequent times of departure to work in Millers Creek are 7:30 AM to 7:59 AM (102, 27.0%) for males and 7:30 AM to 7:59 AM (78, 35.6%) for females.
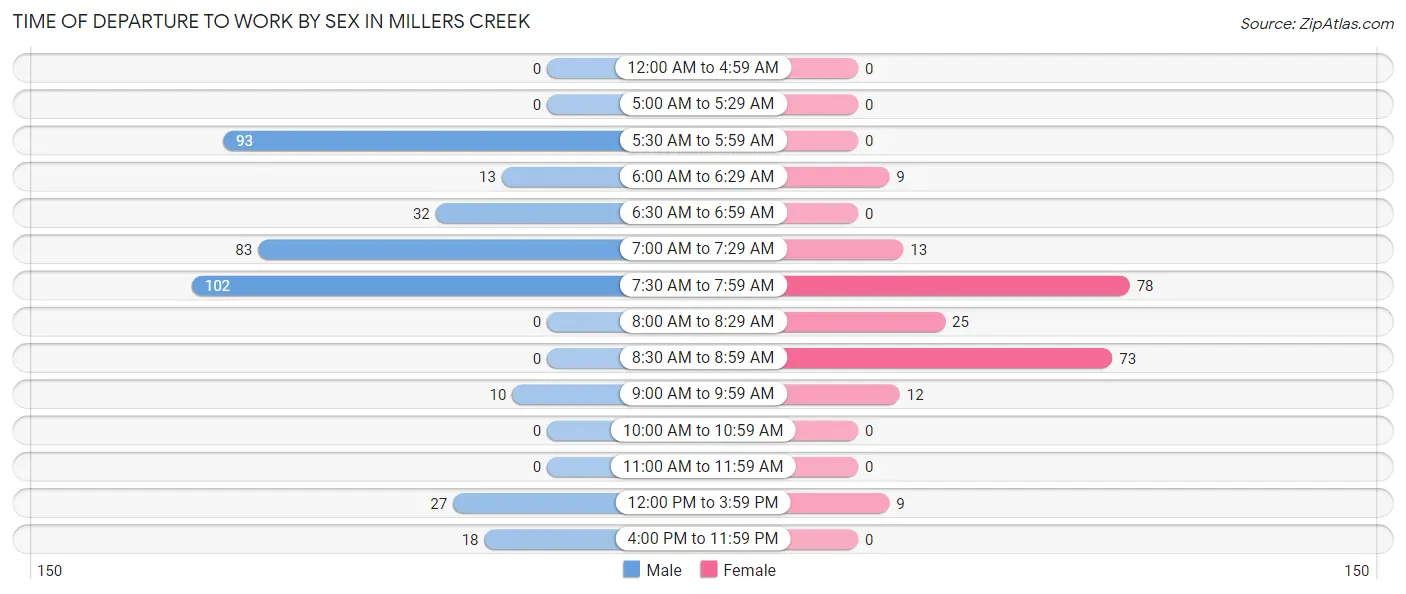
| Time of Departure | Male | Female |
| 12:00 AM to 4:59 AM | 0 (0.0%) | 0 (0.0%) |
| 5:00 AM to 5:29 AM | 0 (0.0%) | 0 (0.0%) |
| 5:30 AM to 5:59 AM | 93 (24.6%) | 0 (0.0%) |
| 6:00 AM to 6:29 AM | 13 (3.4%) | 9 (4.1%) |
| 6:30 AM to 6:59 AM | 32 (8.5%) | 0 (0.0%) |
| 7:00 AM to 7:29 AM | 83 (22.0%) | 13 (5.9%) |
| 7:30 AM to 7:59 AM | 102 (27.0%) | 78 (35.6%) |
| 8:00 AM to 8:29 AM | 0 (0.0%) | 25 (11.4%) |
| 8:30 AM to 8:59 AM | 0 (0.0%) | 73 (33.3%) |
| 9:00 AM to 9:59 AM | 10 (2.6%) | 12 (5.5%) |
| 10:00 AM to 10:59 AM | 0 (0.0%) | 0 (0.0%) |
| 11:00 AM to 11:59 AM | 0 (0.0%) | 0 (0.0%) |
| 12:00 PM to 3:59 PM | 27 (7.1%) | 9 (4.1%) |
| 4:00 PM to 11:59 PM | 18 (4.8%) | 0 (0.0%) |
| Total | 378 (100.0%) | 219 (100.0%) |
Housing Occupancy in Millers Creek
Occupancy by Ownership in Millers Creek
Of the total 759 dwellings in Millers Creek, owner-occupied units account for 655 (86.3%), while renter-occupied units make up 104 (13.7%).
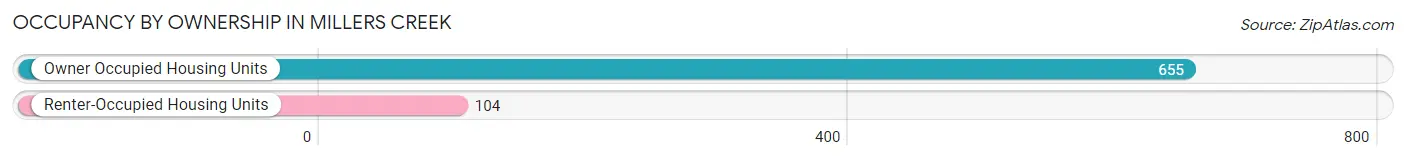
| Occupancy | # Housing Units | % Housing Units |
| Owner Occupied Housing Units | 655 | 86.3% |
| Renter-Occupied Housing Units | 104 | 13.7% |
| Total Occupied Housing Units | 759 | 100.0% |
Occupancy by Household Size in Millers Creek
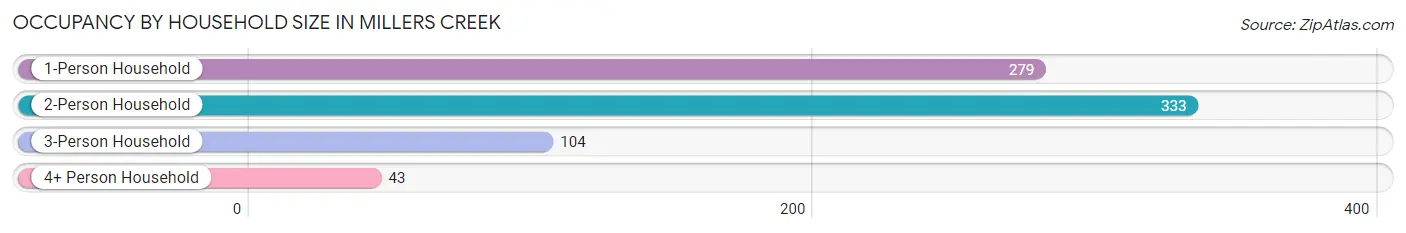
| Household Size | # Housing Units | % Housing Units |
| 1-Person Household | 279 | 36.8% |
| 2-Person Household | 333 | 43.9% |
| 3-Person Household | 104 | 13.7% |
| 4+ Person Household | 43 | 5.7% |
| Total Housing Units | 759 | 100.0% |
Occupancy by Ownership by Household Size in Millers Creek
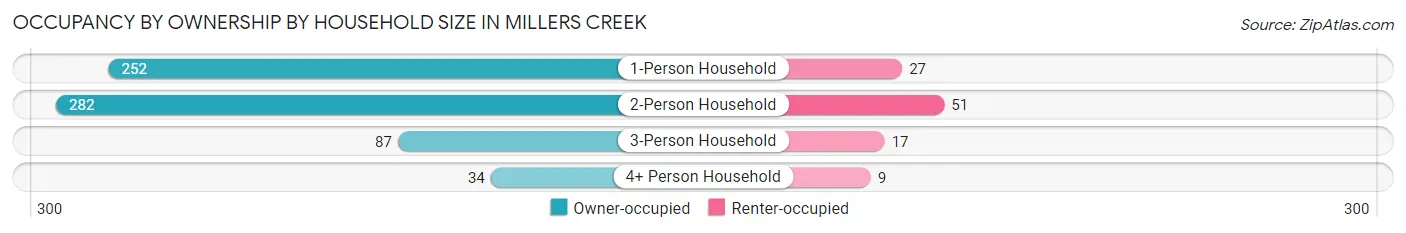
| Household Size | Owner-occupied | Renter-occupied |
| 1-Person Household | 252 (90.3%) | 27 (9.7%) |
| 2-Person Household | 282 (84.7%) | 51 (15.3%) |
| 3-Person Household | 87 (83.7%) | 17 (16.4%) |
| 4+ Person Household | 34 (79.1%) | 9 (20.9%) |
| Total Housing Units | 655 (86.3%) | 104 (13.7%) |
Occupancy by Educational Attainment in Millers Creek
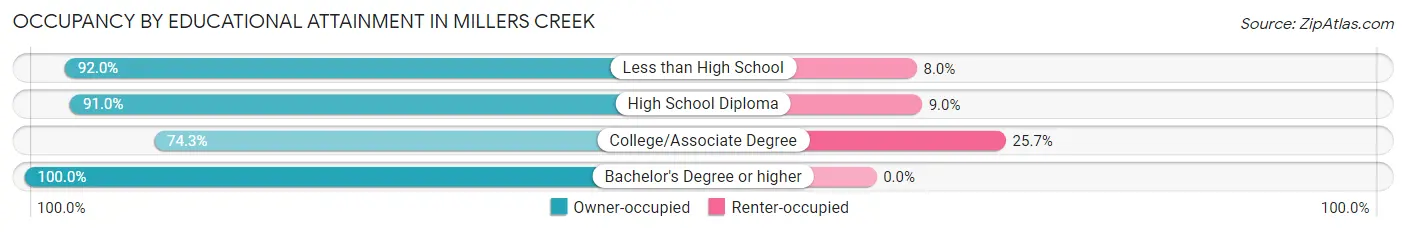
| Household Size | Owner-occupied | Renter-occupied |
| Less than High School | 138 (92.0%) | 12 (8.0%) |
| High School Diploma | 252 (91.0%) | 25 (9.0%) |
| College/Associate Degree | 194 (74.3%) | 67 (25.7%) |
| Bachelor's Degree or higher | 71 (100.0%) | 0 (0.0%) |
Occupancy by Age of Householder in Millers Creek
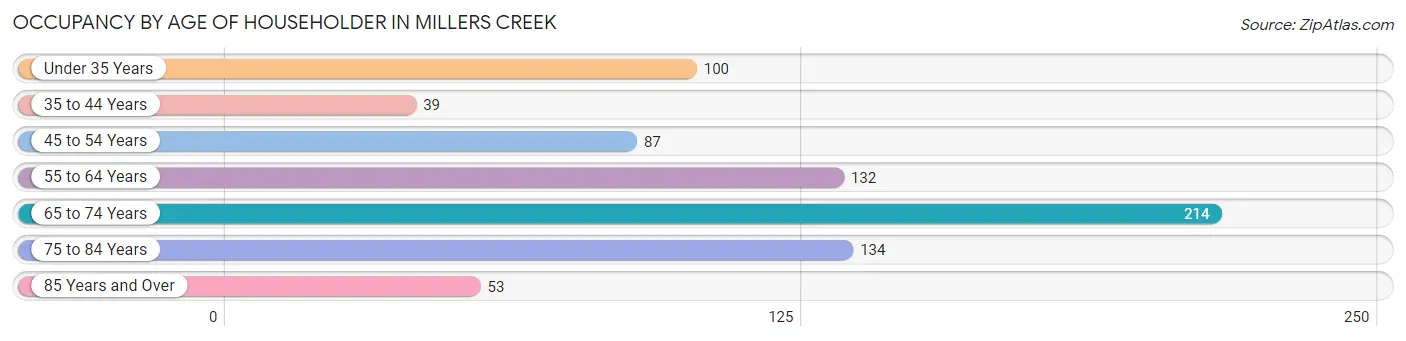
| Age Bracket | # Households | % Households |
| Under 35 Years | 100 | 13.2% |
| 35 to 44 Years | 39 | 5.1% |
| 45 to 54 Years | 87 | 11.5% |
| 55 to 64 Years | 132 | 17.4% |
| 65 to 74 Years | 214 | 28.2% |
| 75 to 84 Years | 134 | 17.6% |
| 85 Years and Over | 53 | 7.0% |
| Total | 759 | 100.0% |
Housing Finances in Millers Creek
Median Income by Occupancy in Millers Creek
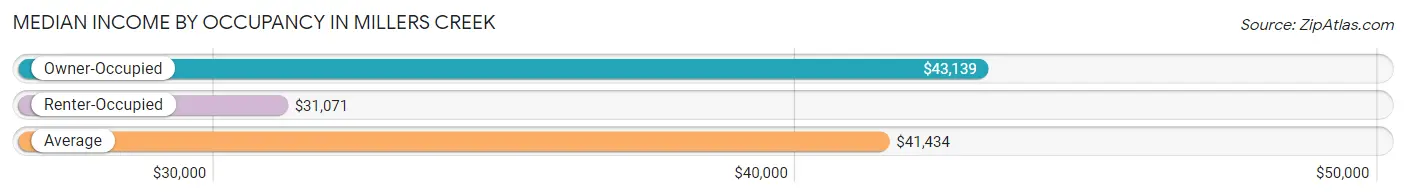
| Occupancy Type | # Households | Median Income |
| Owner-Occupied | 655 (86.3%) | $43,139 |
| Renter-Occupied | 104 (13.7%) | $31,071 |
| Average | 759 (100.0%) | $41,434 |
Occupancy by Householder Income Bracket in Millers Creek
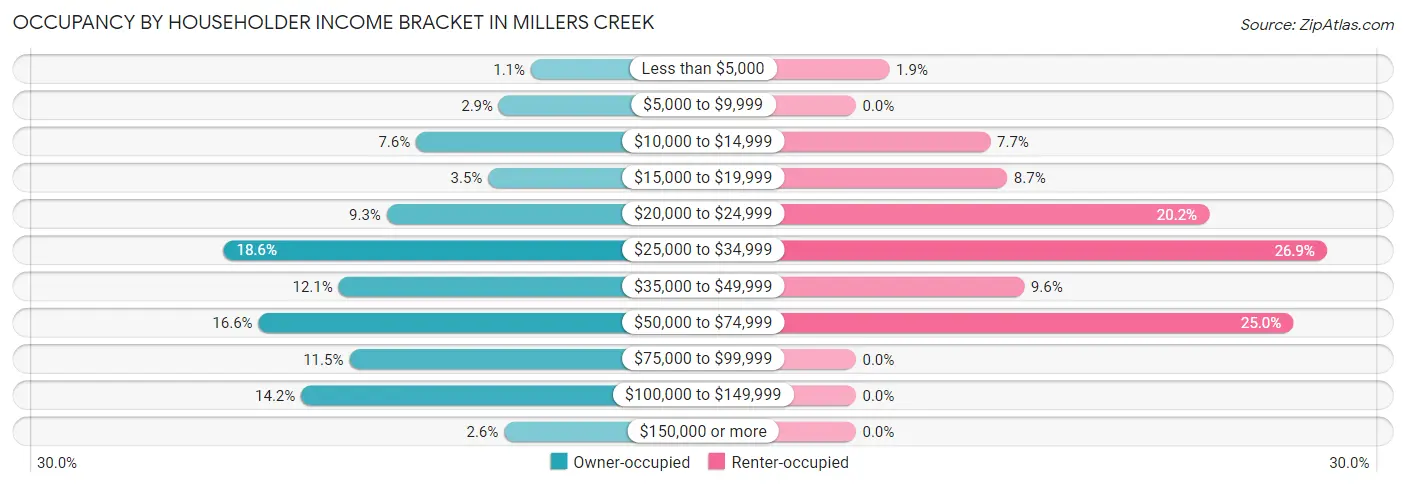
| Income Bracket | Owner-occupied | Renter-occupied |
| Less than $5,000 | 7 (1.1%) | 2 (1.9%) |
| $5,000 to $9,999 | 19 (2.9%) | 0 (0.0%) |
| $10,000 to $14,999 | 50 (7.6%) | 8 (7.7%) |
| $15,000 to $19,999 | 23 (3.5%) | 9 (8.6%) |
| $20,000 to $24,999 | 61 (9.3%) | 21 (20.2%) |
| $25,000 to $34,999 | 122 (18.6%) | 28 (26.9%) |
| $35,000 to $49,999 | 79 (12.1%) | 10 (9.6%) |
| $50,000 to $74,999 | 109 (16.6%) | 26 (25.0%) |
| $75,000 to $99,999 | 75 (11.5%) | 0 (0.0%) |
| $100,000 to $149,999 | 93 (14.2%) | 0 (0.0%) |
| $150,000 or more | 17 (2.6%) | 0 (0.0%) |
| Total | 655 (100.0%) | 104 (100.0%) |
Monthly Housing Cost Tiers in Millers Creek
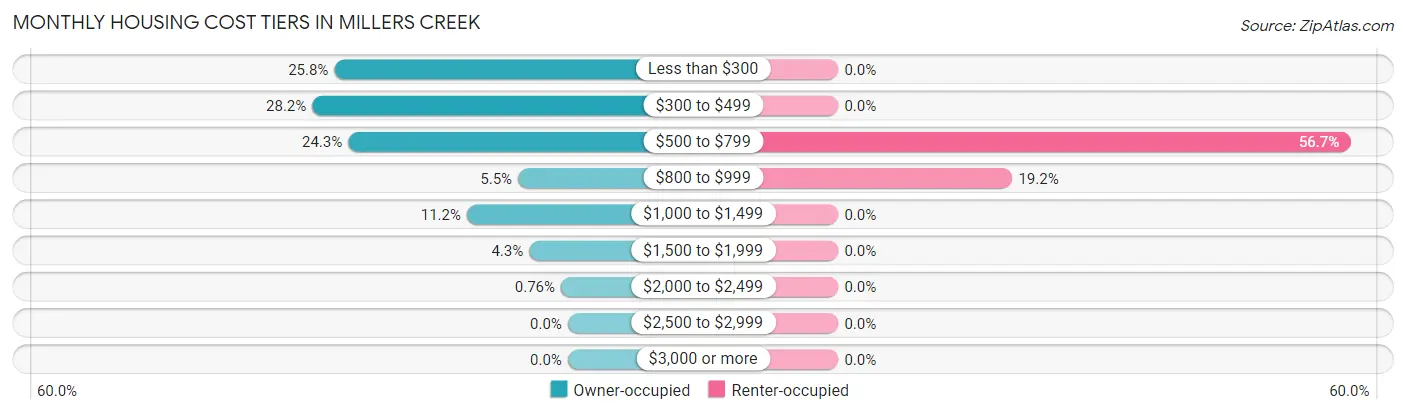
| Monthly Cost | Owner-occupied | Renter-occupied |
| Less than $300 | 169 (25.8%) | 0 (0.0%) |
| $300 to $499 | 185 (28.2%) | 0 (0.0%) |
| $500 to $799 | 159 (24.3%) | 59 (56.7%) |
| $800 to $999 | 36 (5.5%) | 20 (19.2%) |
| $1,000 to $1,499 | 73 (11.2%) | 0 (0.0%) |
| $1,500 to $1,999 | 28 (4.3%) | 0 (0.0%) |
| $2,000 to $2,499 | 5 (0.8%) | 0 (0.0%) |
| $2,500 to $2,999 | 0 (0.0%) | 0 (0.0%) |
| $3,000 or more | 0 (0.0%) | 0 (0.0%) |
| Total | 655 (100.0%) | 104 (100.0%) |
Physical Housing Characteristics in Millers Creek
Housing Structures in Millers Creek
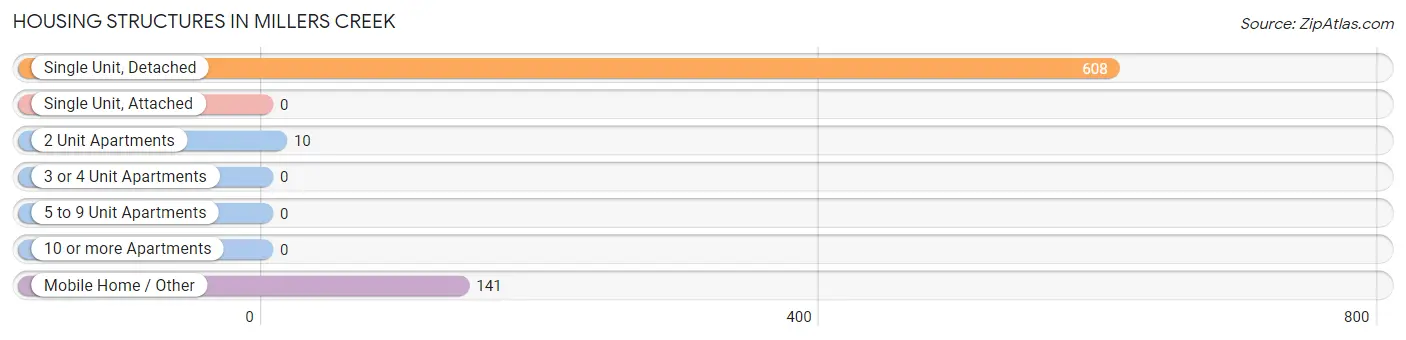
| Structure Type | # Housing Units | % Housing Units |
| Single Unit, Detached | 608 | 80.1% |
| Single Unit, Attached | 0 | 0.0% |
| 2 Unit Apartments | 10 | 1.3% |
| 3 or 4 Unit Apartments | 0 | 0.0% |
| 5 to 9 Unit Apartments | 0 | 0.0% |
| 10 or more Apartments | 0 | 0.0% |
| Mobile Home / Other | 141 | 18.6% |
| Total | 759 | 100.0% |
Housing Structures by Occupancy in Millers Creek
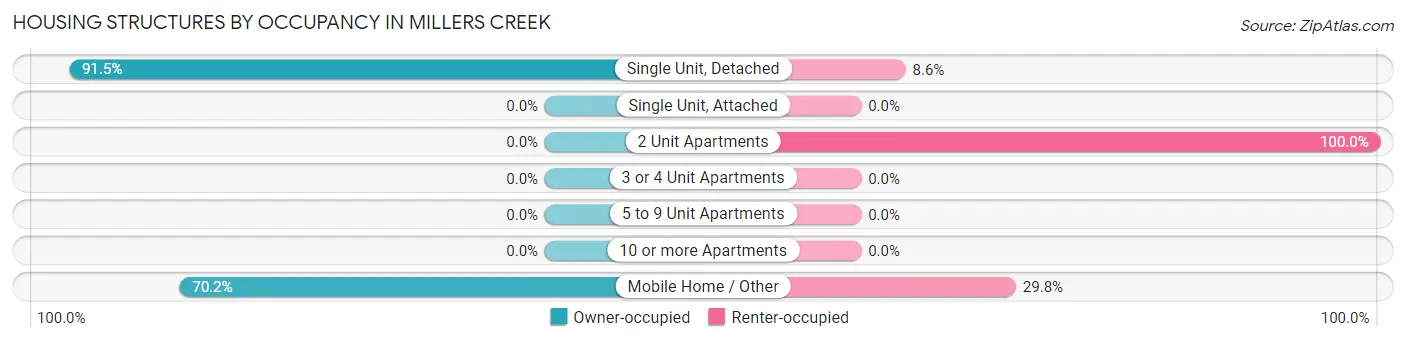
| Structure Type | Owner-occupied | Renter-occupied |
| Single Unit, Detached | 556 (91.4%) | 52 (8.6%) |
| Single Unit, Attached | 0 (0.0%) | 0 (0.0%) |
| 2 Unit Apartments | 0 (0.0%) | 10 (100.0%) |
| 3 or 4 Unit Apartments | 0 (0.0%) | 0 (0.0%) |
| 5 to 9 Unit Apartments | 0 (0.0%) | 0 (0.0%) |
| 10 or more Apartments | 0 (0.0%) | 0 (0.0%) |
| Mobile Home / Other | 99 (70.2%) | 42 (29.8%) |
| Total | 655 (86.3%) | 104 (13.7%) |
Housing Structures by Number of Rooms in Millers Creek
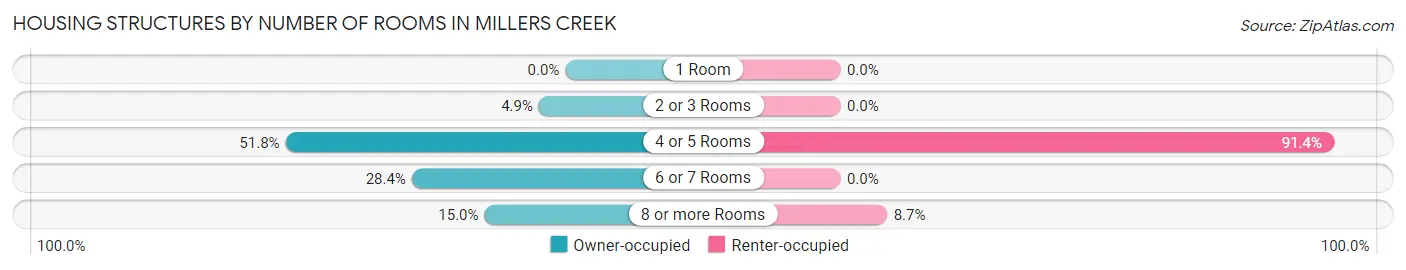
| Number of Rooms | Owner-occupied | Renter-occupied |
| 1 Room | 0 (0.0%) | 0 (0.0%) |
| 2 or 3 Rooms | 32 (4.9%) | 0 (0.0%) |
| 4 or 5 Rooms | 339 (51.8%) | 95 (91.3%) |
| 6 or 7 Rooms | 186 (28.4%) | 0 (0.0%) |
| 8 or more Rooms | 98 (15.0%) | 9 (8.6%) |
| Total | 655 (100.0%) | 104 (100.0%) |
Housing Structure by Heating Type in Millers Creek
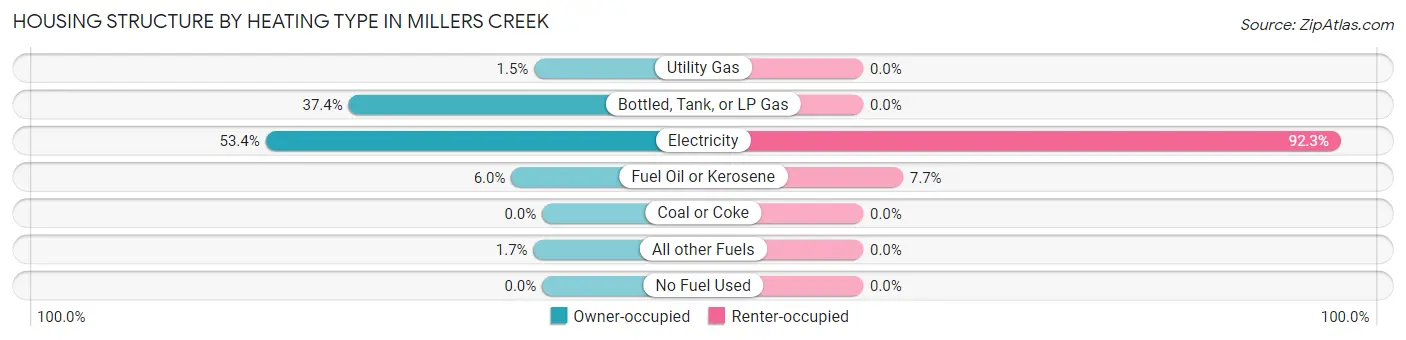
| Heating Type | Owner-occupied | Renter-occupied |
| Utility Gas | 10 (1.5%) | 0 (0.0%) |
| Bottled, Tank, or LP Gas | 245 (37.4%) | 0 (0.0%) |
| Electricity | 350 (53.4%) | 96 (92.3%) |
| Fuel Oil or Kerosene | 39 (5.9%) | 8 (7.7%) |
| Coal or Coke | 0 (0.0%) | 0 (0.0%) |
| All other Fuels | 11 (1.7%) | 0 (0.0%) |
| No Fuel Used | 0 (0.0%) | 0 (0.0%) |
| Total | 655 (100.0%) | 104 (100.0%) |
Household Vehicle Usage in Millers Creek
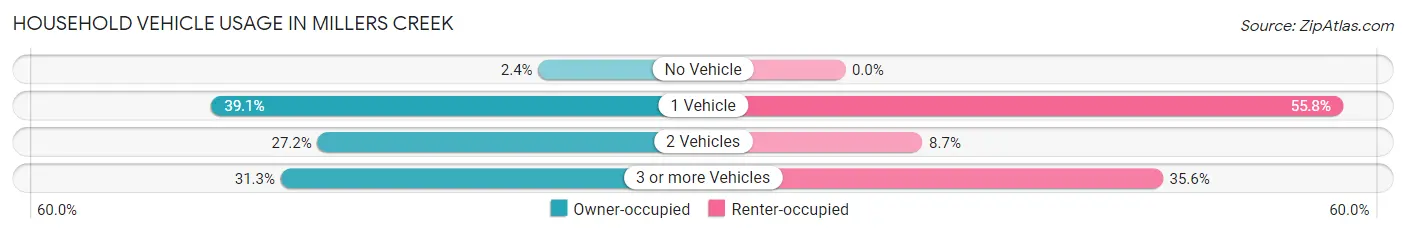
| Vehicles per Household | Owner-occupied | Renter-occupied |
| No Vehicle | 16 (2.4%) | 0 (0.0%) |
| 1 Vehicle | 256 (39.1%) | 58 (55.8%) |
| 2 Vehicles | 178 (27.2%) | 9 (8.6%) |
| 3 or more Vehicles | 205 (31.3%) | 37 (35.6%) |
| Total | 655 (100.0%) | 104 (100.0%) |
Real Estate & Mortgages in Millers Creek
Real Estate and Mortgage Overview in Millers Creek
| Characteristic | Without Mortgage | With Mortgage |
| Housing Units | 517 | 138 |
| Median Property Value | $169,800 | $200,000 |
| Median Household Income | $34,250 | $0 |
| Monthly Housing Costs | $381 | $0 |
| Real Estate Taxes | $1,088 | $0 |
Property Value by Mortgage Status in Millers Creek
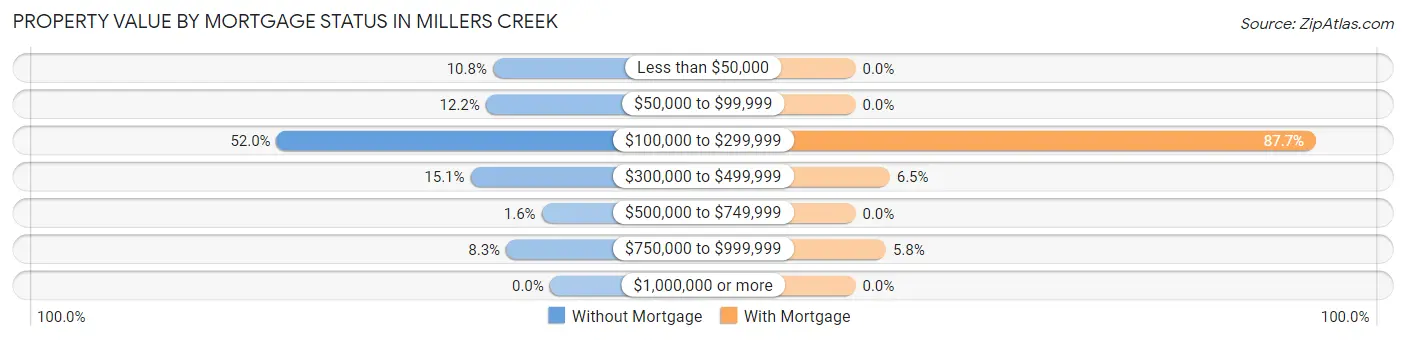
| Property Value | Without Mortgage | With Mortgage |
| Less than $50,000 | 56 (10.8%) | 0 (0.0%) |
| $50,000 to $99,999 | 63 (12.2%) | 0 (0.0%) |
| $100,000 to $299,999 | 269 (52.0%) | 121 (87.7%) |
| $300,000 to $499,999 | 78 (15.1%) | 9 (6.5%) |
| $500,000 to $749,999 | 8 (1.5%) | 0 (0.0%) |
| $750,000 to $999,999 | 43 (8.3%) | 8 (5.8%) |
| $1,000,000 or more | 0 (0.0%) | 0 (0.0%) |
| Total | 517 (100.0%) | 138 (100.0%) |
Household Income by Mortgage Status in Millers Creek
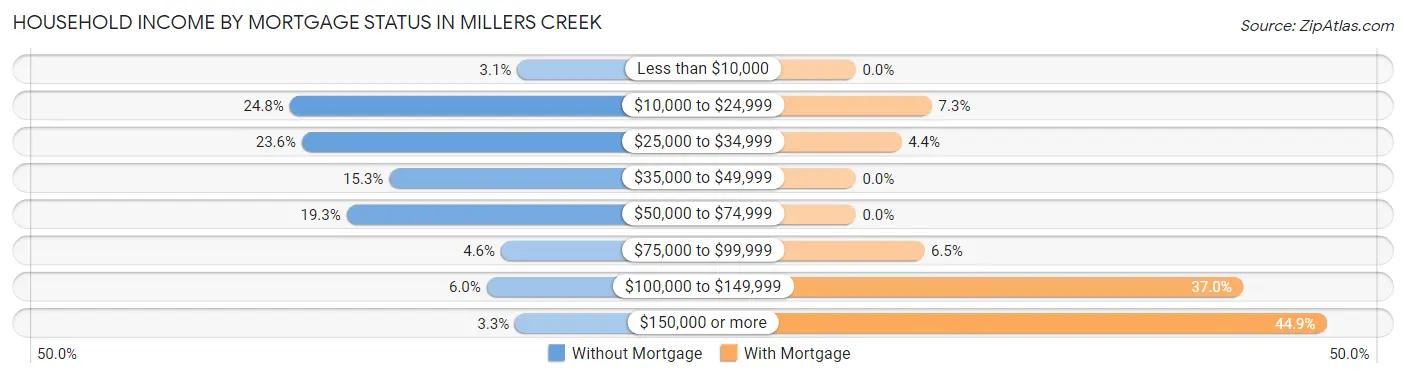
| Household Income | Without Mortgage | With Mortgage |
| Less than $10,000 | 16 (3.1%) | 0 (0.0%) |
| $10,000 to $24,999 | 128 (24.8%) | 10 (7.2%) |
| $25,000 to $34,999 | 122 (23.6%) | 6 (4.3%) |
| $35,000 to $49,999 | 79 (15.3%) | 0 (0.0%) |
| $50,000 to $74,999 | 100 (19.3%) | 0 (0.0%) |
| $75,000 to $99,999 | 24 (4.6%) | 9 (6.5%) |
| $100,000 to $149,999 | 31 (6.0%) | 51 (37.0%) |
| $150,000 or more | 17 (3.3%) | 62 (44.9%) |
| Total | 517 (100.0%) | 138 (100.0%) |
Property Value to Household Income Ratio in Millers Creek
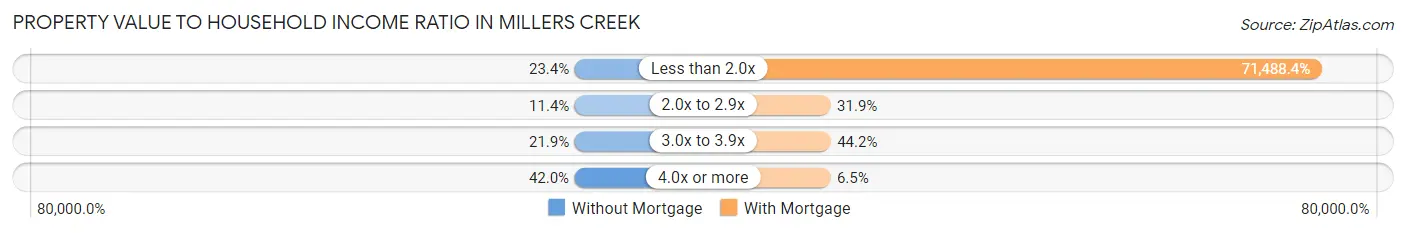
| Value-to-Income Ratio | Without Mortgage | With Mortgage |
| Less than 2.0x | 121 (23.4%) | 98,654 (71,488.4%) |
| 2.0x to 2.9x | 59 (11.4%) | 44 (31.9%) |
| 3.0x to 3.9x | 113 (21.9%) | 61 (44.2%) |
| 4.0x or more | 217 (42.0%) | 9 (6.5%) |
| Total | 517 (100.0%) | 138 (100.0%) |
Real Estate Taxes by Mortgage Status in Millers Creek
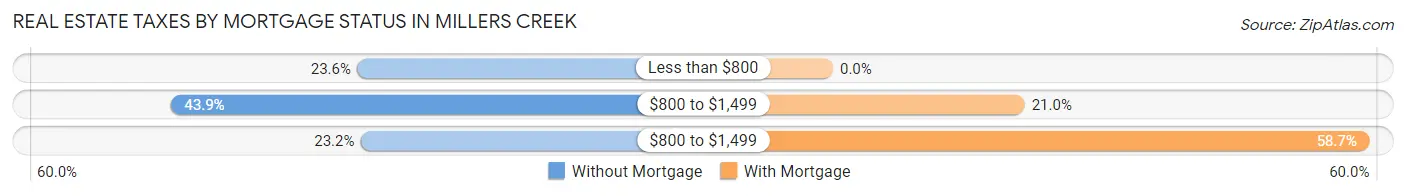
| Property Taxes | Without Mortgage | With Mortgage |
| Less than $800 | 122 (23.6%) | 0 (0.0%) |
| $800 to $1,499 | 227 (43.9%) | 29 (21.0%) |
| $800 to $1,499 | 120 (23.2%) | 81 (58.7%) |
| Total | 517 (100.0%) | 138 (100.0%) |
Health & Disability in Millers Creek
Health Insurance Coverage by Age in Millers Creek
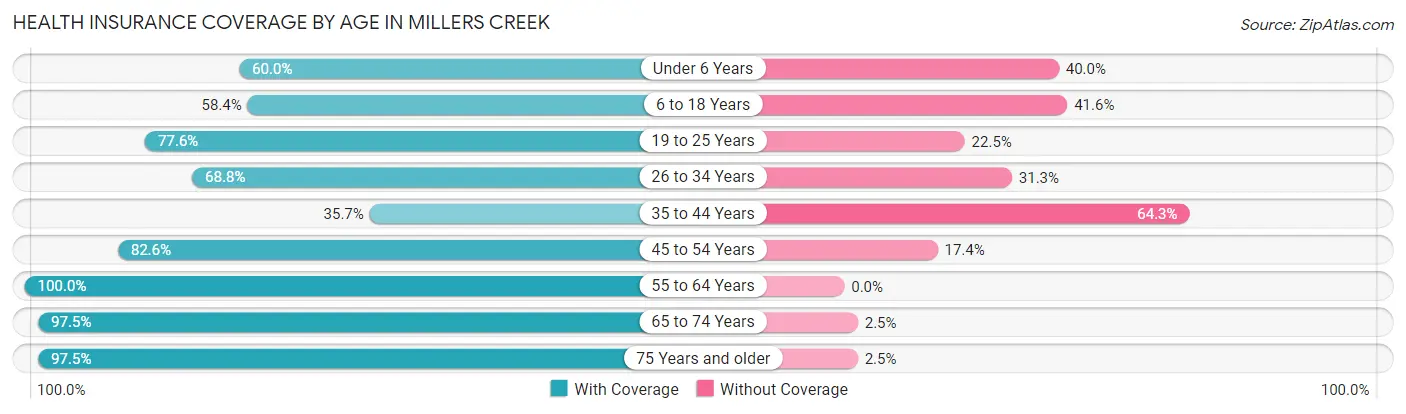
| Age Bracket | With Coverage | Without Coverage |
| Under 6 Years | 24 (60.0%) | 16 (40.0%) |
| 6 to 18 Years | 52 (58.4%) | 37 (41.6%) |
| 19 to 25 Years | 38 (77.5%) | 11 (22.5%) |
| 26 to 34 Years | 132 (68.8%) | 60 (31.2%) |
| 35 to 44 Years | 46 (35.7%) | 83 (64.3%) |
| 45 to 54 Years | 152 (82.6%) | 32 (17.4%) |
| 55 to 64 Years | 193 (100.0%) | 0 (0.0%) |
| 65 to 74 Years | 311 (97.5%) | 8 (2.5%) |
| 75 Years and older | 273 (97.5%) | 7 (2.5%) |
| Total | 1,221 (82.8%) | 254 (17.2%) |
Health Insurance Coverage by Citizenship Status in Millers Creek
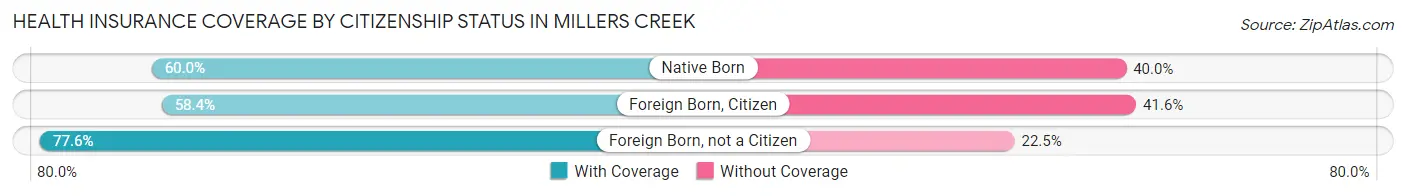
| Citizenship Status | With Coverage | Without Coverage |
| Native Born | 24 (60.0%) | 16 (40.0%) |
| Foreign Born, Citizen | 52 (58.4%) | 37 (41.6%) |
| Foreign Born, not a Citizen | 38 (77.5%) | 11 (22.5%) |
Health Insurance Coverage by Household Income in Millers Creek
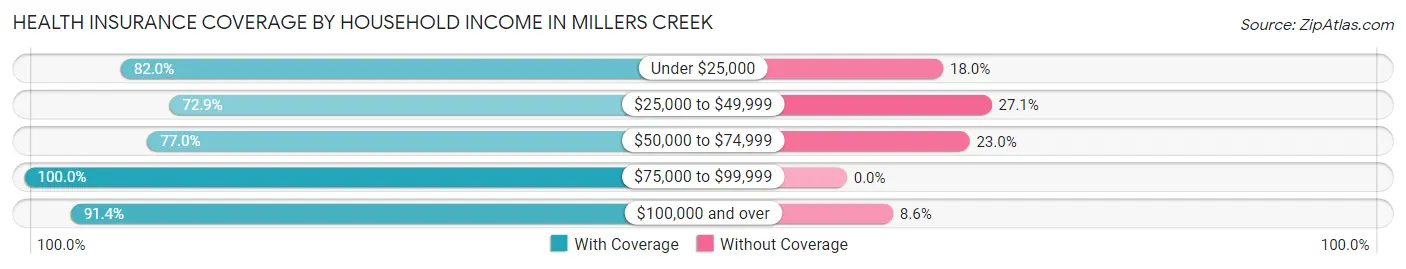
| Household Income | With Coverage | Without Coverage |
| Under $25,000 | 209 (82.0%) | 46 (18.0%) |
| $25,000 to $49,999 | 274 (72.9%) | 102 (27.1%) |
| $50,000 to $74,999 | 268 (77.0%) | 80 (23.0%) |
| $75,000 to $99,999 | 195 (100.0%) | 0 (0.0%) |
| $100,000 and over | 275 (91.4%) | 26 (8.6%) |
Public vs Private Health Insurance Coverage by Age in Millers Creek
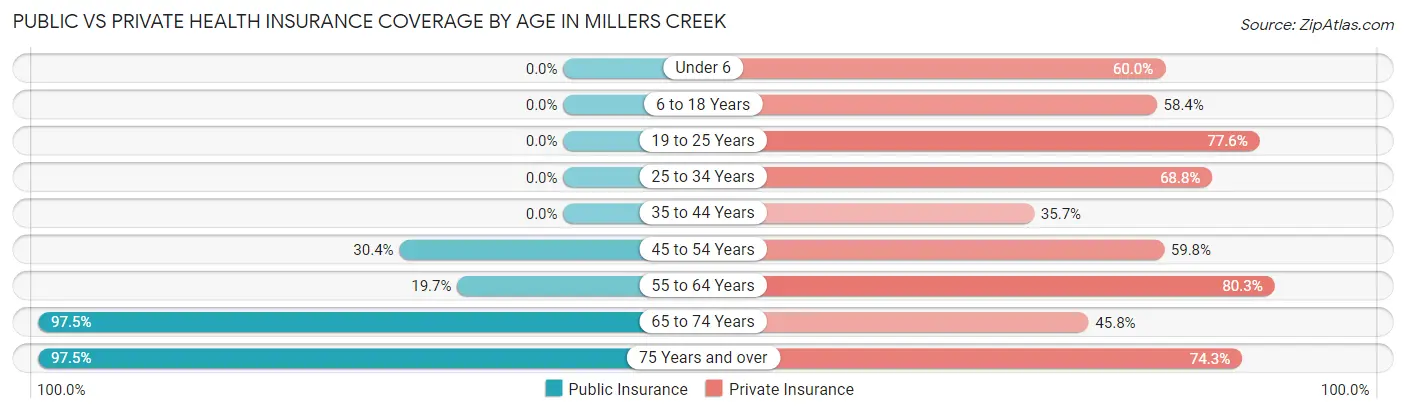
| Age Bracket | Public Insurance | Private Insurance |
| Under 6 | 0 (0.0%) | 24 (60.0%) |
| 6 to 18 Years | 0 (0.0%) | 52 (58.4%) |
| 19 to 25 Years | 0 (0.0%) | 38 (77.5%) |
| 25 to 34 Years | 0 (0.0%) | 132 (68.8%) |
| 35 to 44 Years | 0 (0.0%) | 46 (35.7%) |
| 45 to 54 Years | 56 (30.4%) | 110 (59.8%) |
| 55 to 64 Years | 38 (19.7%) | 155 (80.3%) |
| 65 to 74 Years | 311 (97.5%) | 146 (45.8%) |
| 75 Years and over | 273 (97.5%) | 208 (74.3%) |
| Total | 678 (46.0%) | 911 (61.8%) |
Disability Status by Sex by Age in Millers Creek
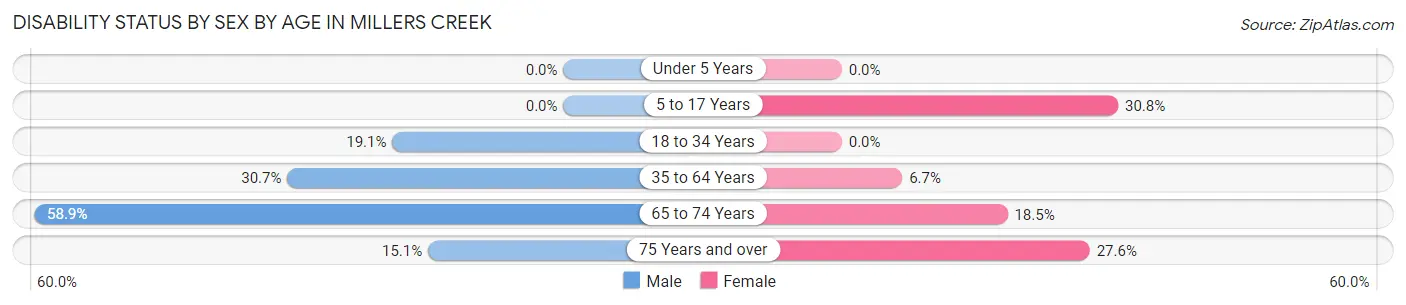
| Age Bracket | Male | Female |
| Under 5 Years | 0 (0.0%) | 0 (0.0%) |
| 5 to 17 Years | 0 (0.0%) | 16 (30.8%) |
| 18 to 34 Years | 20 (19.1%) | 0 (0.0%) |
| 35 to 64 Years | 87 (30.7%) | 15 (6.7%) |
| 65 to 74 Years | 89 (58.9%) | 31 (18.4%) |
| 75 Years and over | 22 (15.1%) | 37 (27.6%) |
Disability Class by Sex by Age in Millers Creek
Disability Class: Hearing Difficulty
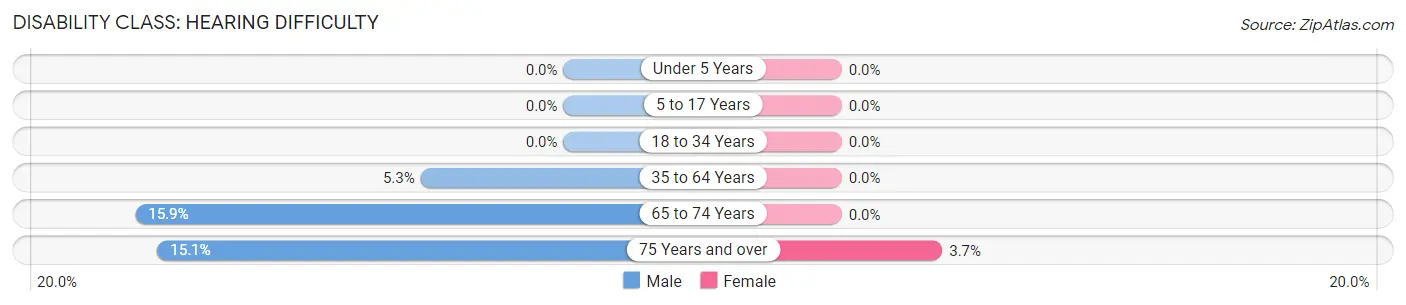
| Age Bracket | Male | Female |
| Under 5 Years | 0 (0.0%) | 0 (0.0%) |
| 5 to 17 Years | 0 (0.0%) | 0 (0.0%) |
| 18 to 34 Years | 0 (0.0%) | 0 (0.0%) |
| 35 to 64 Years | 15 (5.3%) | 0 (0.0%) |
| 65 to 74 Years | 24 (15.9%) | 0 (0.0%) |
| 75 Years and over | 22 (15.1%) | 5 (3.7%) |
Disability Class: Vision Difficulty
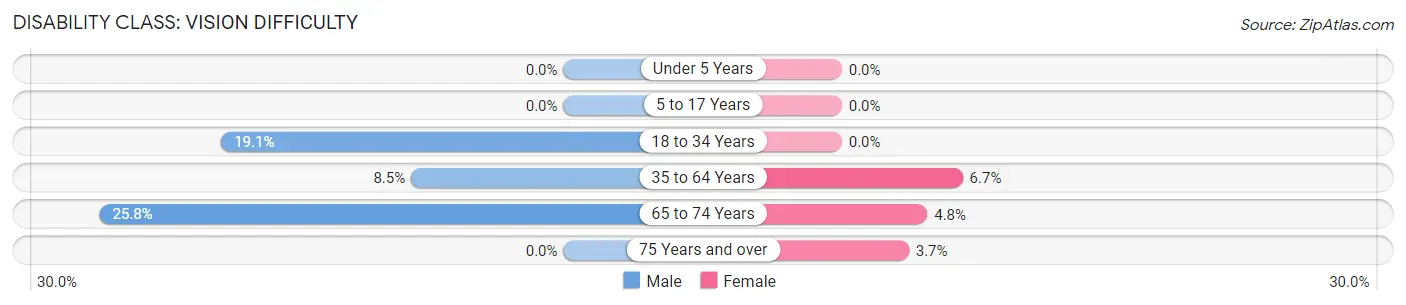
| Age Bracket | Male | Female |
| Under 5 Years | 0 (0.0%) | 0 (0.0%) |
| 5 to 17 Years | 0 (0.0%) | 0 (0.0%) |
| 18 to 34 Years | 20 (19.1%) | 0 (0.0%) |
| 35 to 64 Years | 24 (8.5%) | 15 (6.7%) |
| 65 to 74 Years | 39 (25.8%) | 8 (4.8%) |
| 75 Years and over | 0 (0.0%) | 5 (3.7%) |
Disability Class: Cognitive Difficulty
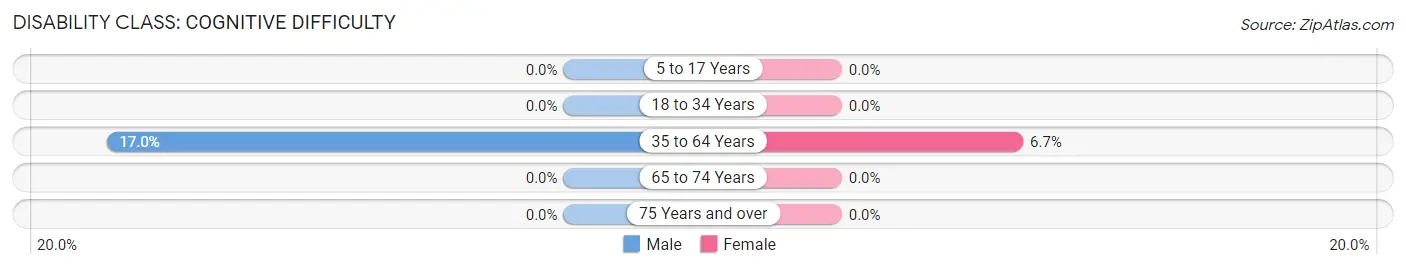
| Age Bracket | Male | Female |
| 5 to 17 Years | 0 (0.0%) | 0 (0.0%) |
| 18 to 34 Years | 0 (0.0%) | 0 (0.0%) |
| 35 to 64 Years | 48 (17.0%) | 15 (6.7%) |
| 65 to 74 Years | 0 (0.0%) | 0 (0.0%) |
| 75 Years and over | 0 (0.0%) | 0 (0.0%) |
Disability Class: Ambulatory Difficulty

| Age Bracket | Male | Female |
| 5 to 17 Years | 0 (0.0%) | 16 (30.8%) |
| 18 to 34 Years | 0 (0.0%) | 0 (0.0%) |
| 35 to 64 Years | 25 (8.8%) | 15 (6.7%) |
| 65 to 74 Years | 89 (58.9%) | 23 (13.7%) |
| 75 Years and over | 0 (0.0%) | 37 (27.6%) |
Disability Class: Self-Care Difficulty
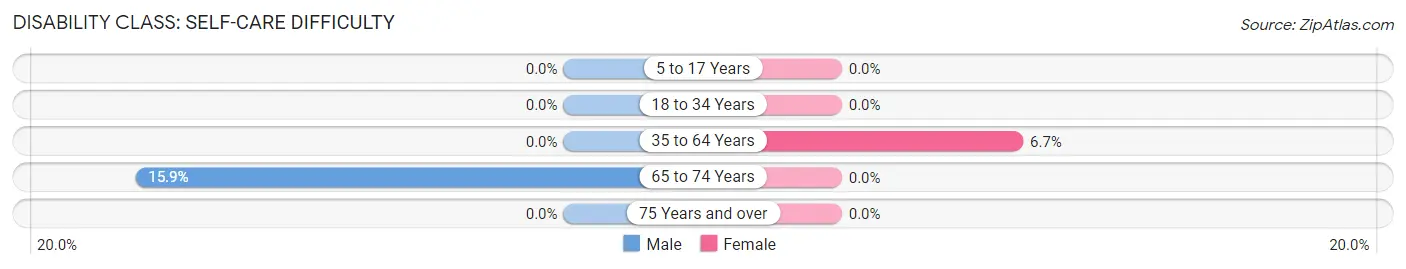
| Age Bracket | Male | Female |
| 5 to 17 Years | 0 (0.0%) | 0 (0.0%) |
| 18 to 34 Years | 0 (0.0%) | 0 (0.0%) |
| 35 to 64 Years | 0 (0.0%) | 15 (6.7%) |
| 65 to 74 Years | 24 (15.9%) | 0 (0.0%) |
| 75 Years and over | 0 (0.0%) | 0 (0.0%) |
Technology Access in Millers Creek
Computing Device Access in Millers Creek
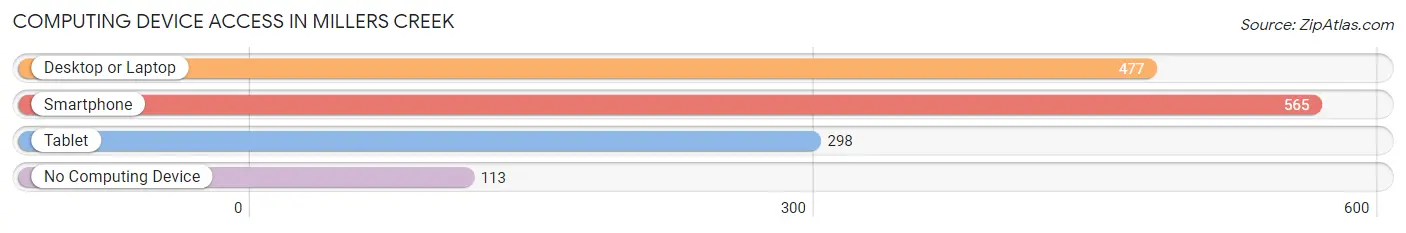
| Device Type | # Households | % Households |
| Desktop or Laptop | 477 | 62.8% |
| Smartphone | 565 | 74.4% |
| Tablet | 298 | 39.3% |
| No Computing Device | 113 | 14.9% |
| Total | 759 | 100.0% |
Internet Access in Millers Creek
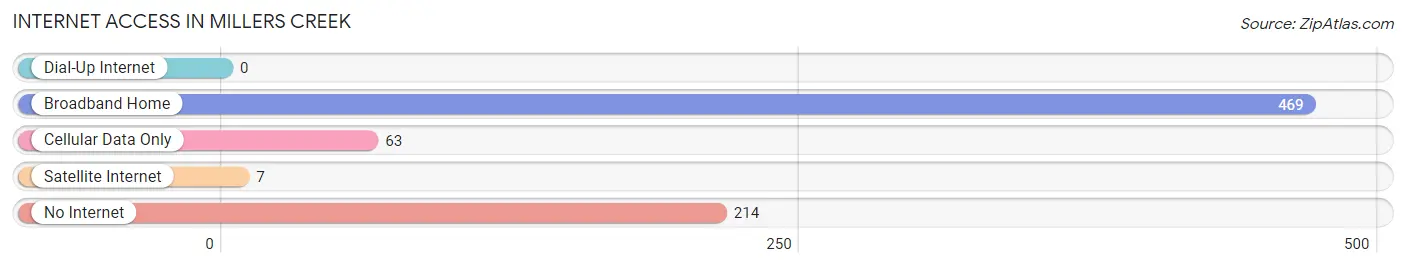
| Internet Type | # Households | % Households |
| Dial-Up Internet | 0 | 0.0% |
| Broadband Home | 469 | 61.8% |
| Cellular Data Only | 63 | 8.3% |
| Satellite Internet | 7 | 0.9% |
| No Internet | 214 | 28.2% |
| Total | 759 | 100.0% |
Millers Creek Summary
Miller’s Creek is a small unincorporated community located in Wilkes County, North Carolina. It is situated in the foothills of the Blue Ridge Mountains, approximately 20 miles east of the city of Wilkesboro. The community is named after the Miller family, who were among the first settlers in the area.
History
The Miller family first settled in the area in the late 1700s. The family was originally from Pennsylvania and had migrated south in search of better land and opportunities. The Millers were among the first settlers in the area and established a small farm. The family also built a small church, which served as the center of the community.
The community of Miller’s Creek was officially established in 1845. The town was named after the Miller family and was home to a variety of businesses, including a general store, a blacksmith shop, and a post office. The town also had a school, which was attended by both children and adults.
In the late 1800s, the town began to grow and prosper. The railroad was extended to Miller’s Creek in 1891, which allowed for the transportation of goods and people. This helped to spur economic growth in the area and allowed for the development of new businesses.
The town continued to grow and prosper until the Great Depression. During this time, many of the businesses in Miller’s Creek closed and the population began to decline. The town was able to recover after the Depression, but it never regained its former prosperity.
Geography
Miller’s Creek is located in the foothills of the Blue Ridge Mountains in Wilkes County, North Carolina. The town is situated at an elevation of 1,400 feet and is surrounded by rolling hills and forests. The town is located approximately 20 miles east of the city of Wilkesboro and is accessible via US Highway 421.
The climate in Miller’s Creek is mild and temperate. The average temperature in the summer is around 75 degrees Fahrenheit and the average temperature in the winter is around 40 degrees Fahrenheit. The town receives an average of 45 inches of rain per year.
Economy
The economy of Miller’s Creek is largely based on agriculture. The town is home to several farms, which produce a variety of crops, including corn, soybeans, and tobacco. The town also has a few small businesses, including a general store and a post office.
Demographics
As of the 2010 census, the population of Miller’s Creek was 1,092. The town is predominantly white, with 92.3% of the population identifying as such. The median household income in Miller’s Creek is $35,000 and the median age is 44.
Conclusion
Miller’s Creek is a small unincorporated community located in Wilkes County, North Carolina. The town was established in 1845 and was named after the Miller family, who were among the first settlers in the area. The town is situated in the foothills of the Blue Ridge Mountains and is home to a variety of businesses, including a general store and a post office. The economy of Miller’s Creek is largely based on agriculture and the town has a population of 1,092 as of the 2010 census.
Common Questions
What is Per Capita Income in Millers Creek?
Per Capita income in Millers Creek is $29,210.
What is the Median Family Income in Millers Creek?
Median Family Income in Millers Creek is $59,764.
What is the Median Household income in Millers Creek?
Median Household Income in Millers Creek is $41,434.
What is Income or Wage Gap in Millers Creek?
Income or Wage Gap in Millers Creek is 5.9%.
Women in Millers Creek earn 94.1 cents for every dollar earned by a man.
What is Inequality or Gini Index in Millers Creek?
Inequality or Gini Index in Millers Creek is 0.39.
What is the Total Population of Millers Creek?
Total Population of Millers Creek is 1,475.
What is the Total Male Population of Millers Creek?
Total Male Population of Millers Creek is 737.
What is the Total Female Population of Millers Creek?
Total Female Population of Millers Creek is 738.
What is the Ratio of Males per 100 Females in Millers Creek?
There are 99.86 Males per 100 Females in Millers Creek.
What is the Ratio of Females per 100 Males in Millers Creek?
There are 100.14 Females per 100 Males in Millers Creek.
What is the Median Population Age in Millers Creek?
Median Population Age in Millers Creek is 59.3 Years.
What is the Average Family Size in Millers Creek
Average Family Size in Millers Creek is 2.5 People.
What is the Average Household Size in Millers Creek
Average Household Size in Millers Creek is 1.9 People.
How Large is the Labor Force in Millers Creek?
There are 747 People in the Labor Forcein in Millers Creek.
What is the Percentage of People in the Labor Force in Millers Creek?
54.0% of People are in the Labor Force in Millers Creek.
What is the Unemployment Rate in Millers Creek?
Unemployment Rate in Millers Creek is 7.1%.