Lewiston Woodville, NC Map & Demographics
Lewiston Woodville Map
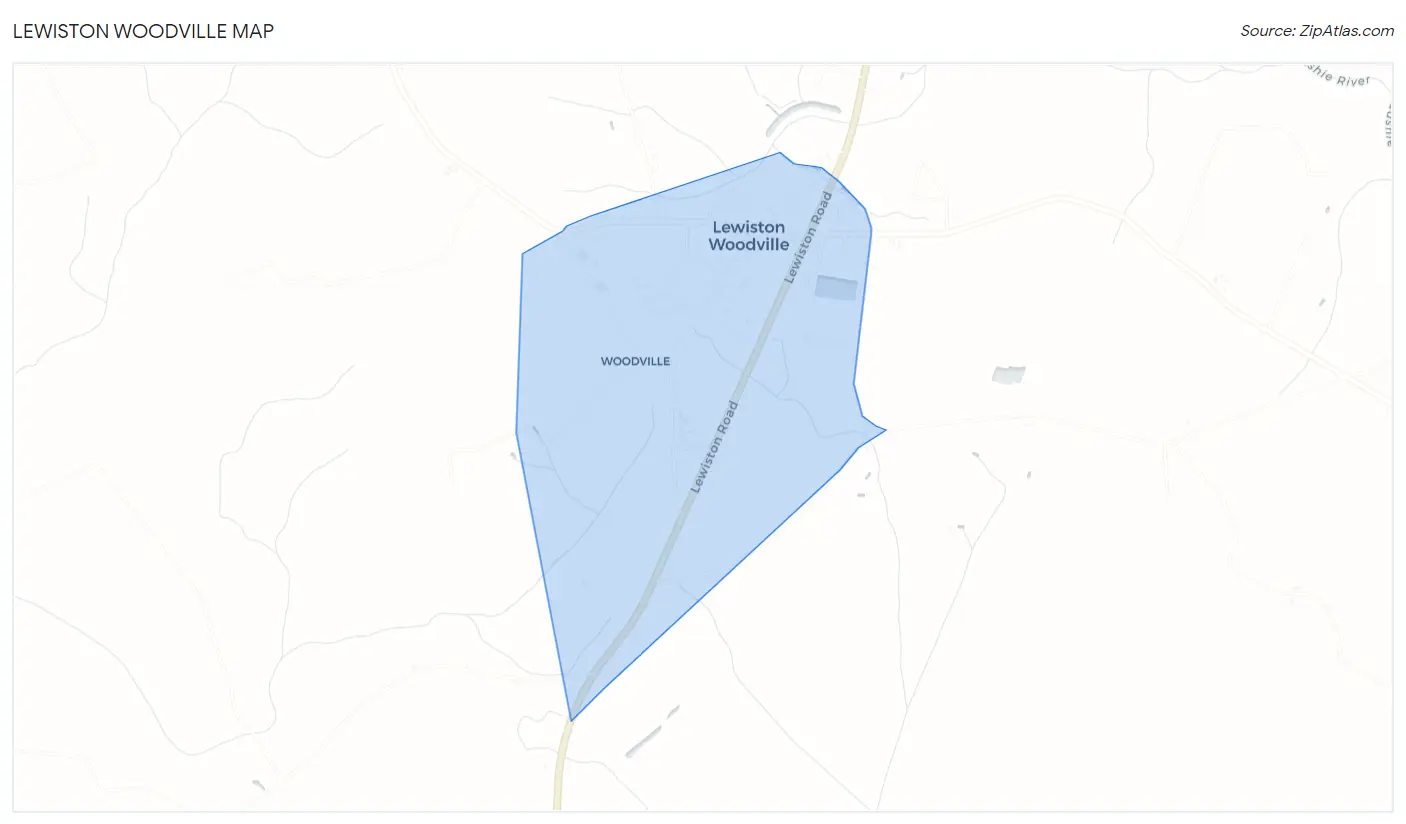
Lewiston Woodville Overview
$33,724
PER CAPITA INCOME
$41,944
AVG HOUSEHOLD INCOME
0.54
INEQUALITY / GINI INDEX
458
TOTAL POPULATION
168
MALE POPULATION
290
FEMALE POPULATION
57.93
MALES / 100 FEMALES
172.62
FEMALES / 100 MALES
52.0
MEDIAN AGE
2.8
AVG FAMILY SIZE
2.4
AVG HOUSEHOLD SIZE
169
LABOR FORCE [ PEOPLE ]
45.3%
PERCENT IN LABOR FORCE
9.5%
UNEMPLOYMENT RATE
Lewiston Woodville Zip Codes
Lewiston Woodville Area Codes
Income in Lewiston Woodville
Income Overview in Lewiston Woodville
| Characteristic | Number | Measure |
| Per Capita Income | 458 | $33,724 |
| Median Family Income | 123 | $0 |
| Mean Family Income | 123 | $116,387 |
| Median Household Income | 192 | $41,944 |
| Mean Household Income | 192 | $86,217 |
| Income Deficit | 123 | $0 |
| Wage / Income Gap (%) | 458 | 0.00% |
| Wage / Income Gap ($) | 458 | 100.00¢ per $1 |
| Gini / Inequality Index | 458 | 0.54 |
Earnings by Sex in Lewiston Woodville
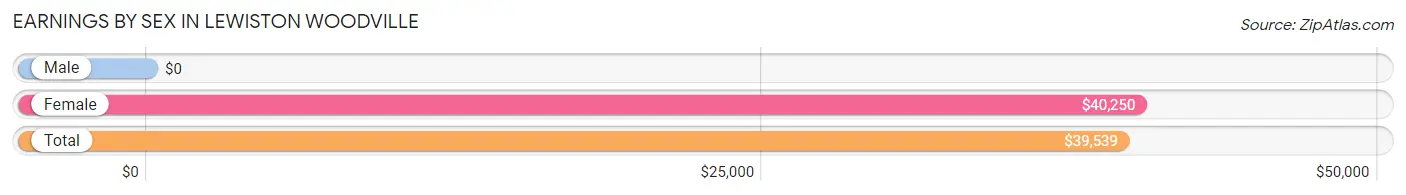
| Sex | Number | Average Earnings |
| Male | 67 (38.7%) | $0 |
| Female | 106 (61.3%) | $40,250 |
| Total | 173 (100.0%) | $39,539 |
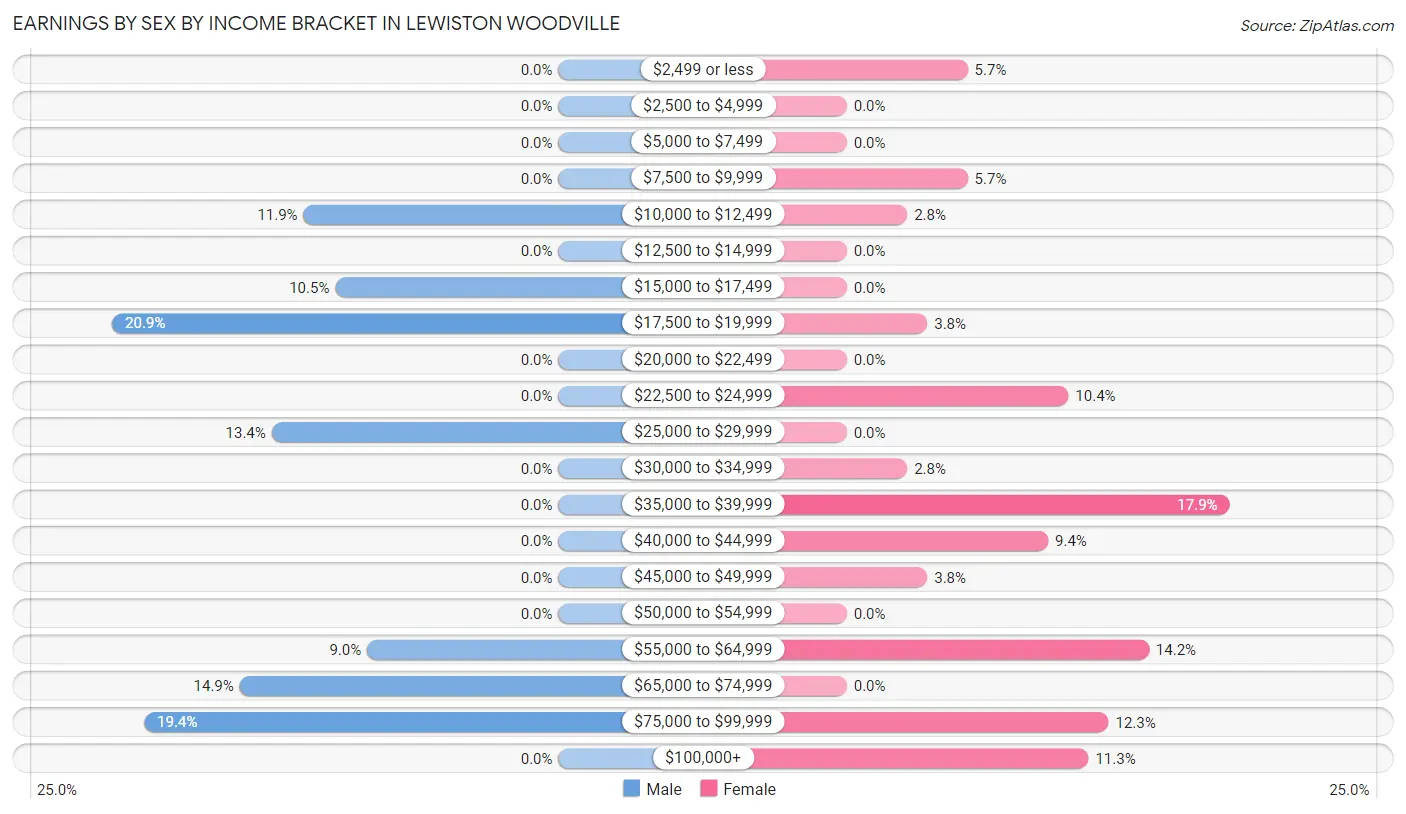
Earnings by Sex by Income Bracket in Lewiston Woodville
The most common earnings brackets in Lewiston Woodville are $17,500 to $19,999 for men (14 | 20.9%) and $35,000 to $39,999 for women (19 | 17.9%).
| Income | Male | Female |
| $2,499 or less | 0 (0.0%) | 6 (5.7%) |
| $2,500 to $4,999 | 0 (0.0%) | 0 (0.0%) |
| $5,000 to $7,499 | 0 (0.0%) | 0 (0.0%) |
| $7,500 to $9,999 | 0 (0.0%) | 6 (5.7%) |
| $10,000 to $12,499 | 8 (11.9%) | 3 (2.8%) |
| $12,500 to $14,999 | 0 (0.0%) | 0 (0.0%) |
| $15,000 to $17,499 | 7 (10.4%) | 0 (0.0%) |
| $17,500 to $19,999 | 14 (20.9%) | 4 (3.8%) |
| $20,000 to $22,499 | 0 (0.0%) | 0 (0.0%) |
| $22,500 to $24,999 | 0 (0.0%) | 11 (10.4%) |
| $25,000 to $29,999 | 9 (13.4%) | 0 (0.0%) |
| $30,000 to $34,999 | 0 (0.0%) | 3 (2.8%) |
| $35,000 to $39,999 | 0 (0.0%) | 19 (17.9%) |
| $40,000 to $44,999 | 0 (0.0%) | 10 (9.4%) |
| $45,000 to $49,999 | 0 (0.0%) | 4 (3.8%) |
| $50,000 to $54,999 | 0 (0.0%) | 0 (0.0%) |
| $55,000 to $64,999 | 6 (9.0%) | 15 (14.1%) |
| $65,000 to $74,999 | 10 (14.9%) | 0 (0.0%) |
| $75,000 to $99,999 | 13 (19.4%) | 13 (12.3%) |
| $100,000+ | 0 (0.0%) | 12 (11.3%) |
| Total | 67 (100.0%) | 106 (100.0%) |
Earnings by Sex by Educational Attainment in Lewiston Woodville
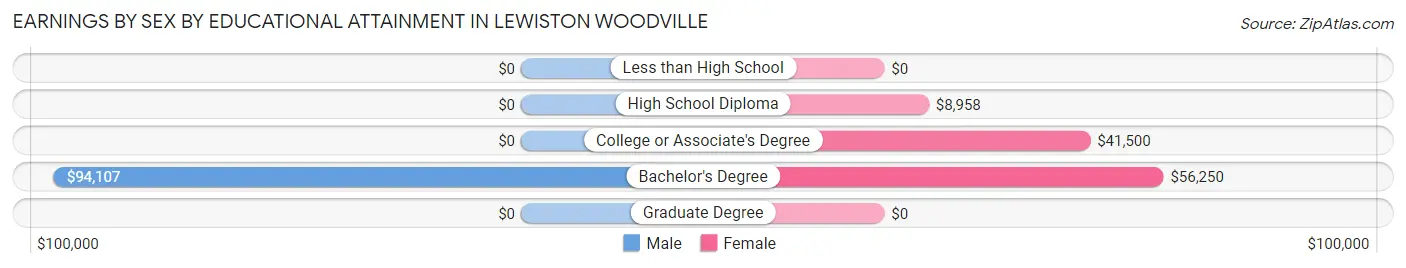
| Educational Attainment | Male Income | Female Income |
| Less than High School | - | - |
| High School Diploma | - | - |
| College or Associate's Degree | - | - |
| Bachelor's Degree | $94,107 | $56,250 |
| Graduate Degree | - | - |
| Total | - | - |
Family Income in Lewiston Woodville
Family Income Brackets in Lewiston Woodville
According to the Lewiston Woodville family income data, there are 45 families falling into the $100,000 to $149,999 income range, which is the most common income bracket and makes up 36.6% of all families.
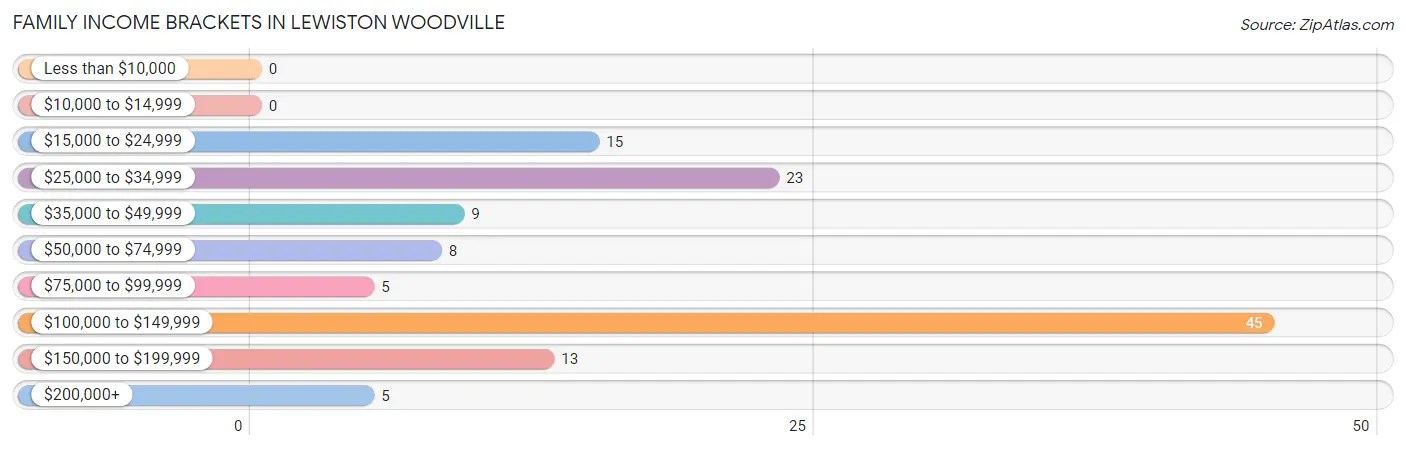
| Income Bracket | # Families | % Families |
| Less than $10,000 | 0 | 0.0% |
| $10,000 to $14,999 | 0 | 0.0% |
| $15,000 to $24,999 | 15 | 12.2% |
| $25,000 to $34,999 | 23 | 18.7% |
| $35,000 to $49,999 | 9 | 7.3% |
| $50,000 to $74,999 | 8 | 6.5% |
| $75,000 to $99,999 | 5 | 4.1% |
| $100,000 to $149,999 | 45 | 36.6% |
| $150,000 to $199,999 | 13 | 10.6% |
| $200,000+ | 5 | 4.1% |
Family Income by Famaliy Size in Lewiston Woodville
3-person families (25 | 20.3%) account for the highest median family income in Lewiston Woodville with $128,906 per family, while 3-person families (25 | 20.3%) have the highest median income of $42,969 per family member.
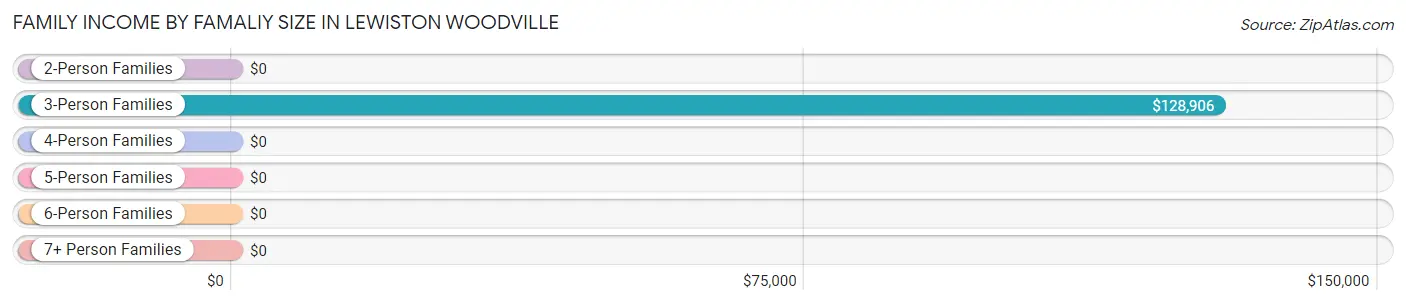
| Income Bracket | # Families | Median Income |
| 2-Person Families | 51 (41.5%) | $0 |
| 3-Person Families | 25 (20.3%) | $128,906 |
| 4-Person Families | 36 (29.3%) | $0 |
| 5-Person Families | 2 (1.6%) | $0 |
| 6-Person Families | 9 (7.3%) | $0 |
| 7+ Person Families | 0 (0.0%) | $0 |
| Total | 123 (100.0%) | $0 |
Family Income by Number of Earners in Lewiston Woodville
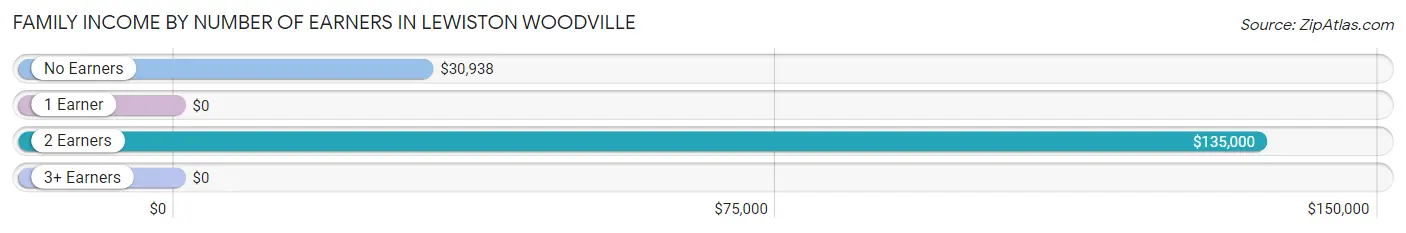
| Number of Earners | # Families | Median Income |
| No Earners | 24 (19.5%) | $30,938 |
| 1 Earner | 53 (43.1%) | $0 |
| 2 Earners | 46 (37.4%) | $135,000 |
| 3+ Earners | 0 (0.0%) | $0 |
| Total | 123 (100.0%) | $0 |
Household Income in Lewiston Woodville
Household Income Brackets in Lewiston Woodville
With 45 households falling in the category, the $100,000 to $149,999 income range is the most frequent in Lewiston Woodville, accounting for 23.4% of all households. In contrast, only 5 households (2.6%) fall into the $75,000 to $99,999 income bracket, making it the least populous group.
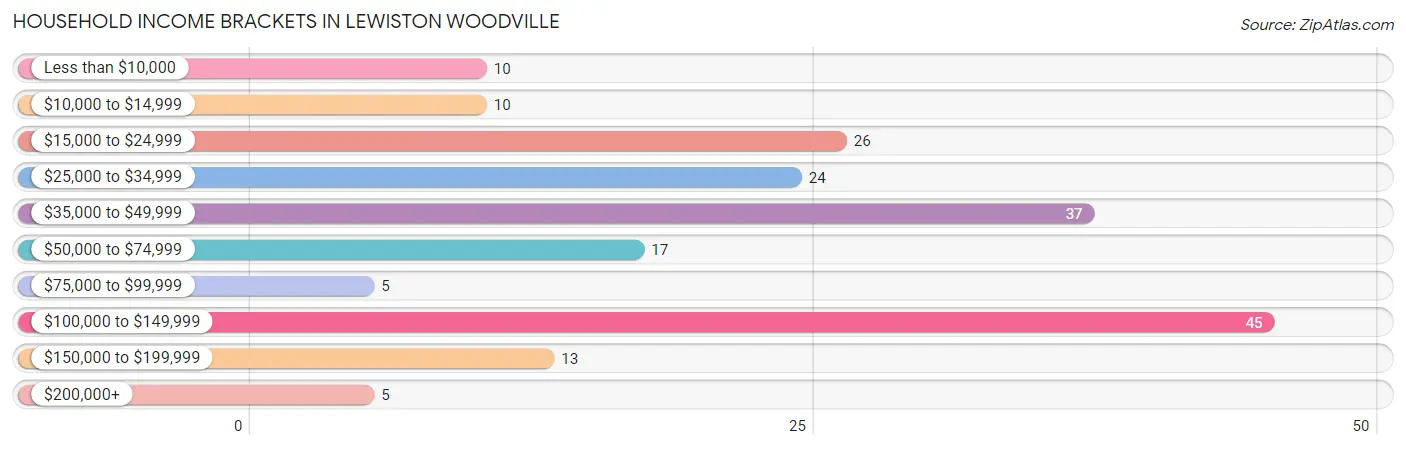
| Income Bracket | # Households | % Households |
| Less than $10,000 | 10 | 5.2% |
| $10,000 to $14,999 | 10 | 5.2% |
| $15,000 to $24,999 | 26 | 13.5% |
| $25,000 to $34,999 | 24 | 12.5% |
| $35,000 to $49,999 | 37 | 19.3% |
| $50,000 to $74,999 | 17 | 8.9% |
| $75,000 to $99,999 | 5 | 2.6% |
| $100,000 to $149,999 | 45 | 23.4% |
| $150,000 to $199,999 | 13 | 6.8% |
| $200,000+ | 5 | 2.6% |
Household Income by Householder Age in Lewiston Woodville
The median household income in Lewiston Woodville is $41,944, with the highest median household income of $56,250 found in the 25 to 44 years age bracket for the primary householder. A total of 40 households (20.8%) fall into this category.
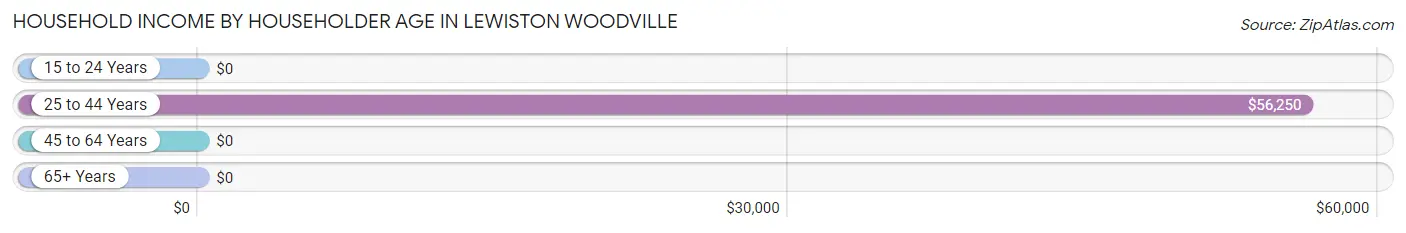
| Income Bracket | # Households | Median Income |
| 15 to 24 Years | 0 (0.0%) | $0 |
| 25 to 44 Years | 40 (20.8%) | $56,250 |
| 45 to 64 Years | 55 (28.6%) | $0 |
| 65+ Years | 97 (50.5%) | $0 |
| Total | 192 (100.0%) | $41,944 |
Poverty in Lewiston Woodville
Income Below Poverty by Sex and Age in Lewiston Woodville
With 17.3% poverty level for males and 31.0% for females among the residents of Lewiston Woodville, under 5 year old males and 15 year old females are the most vulnerable to poverty, with 10 males (100.0%) and 6 females (100.0%) in their respective age groups living below the poverty level.
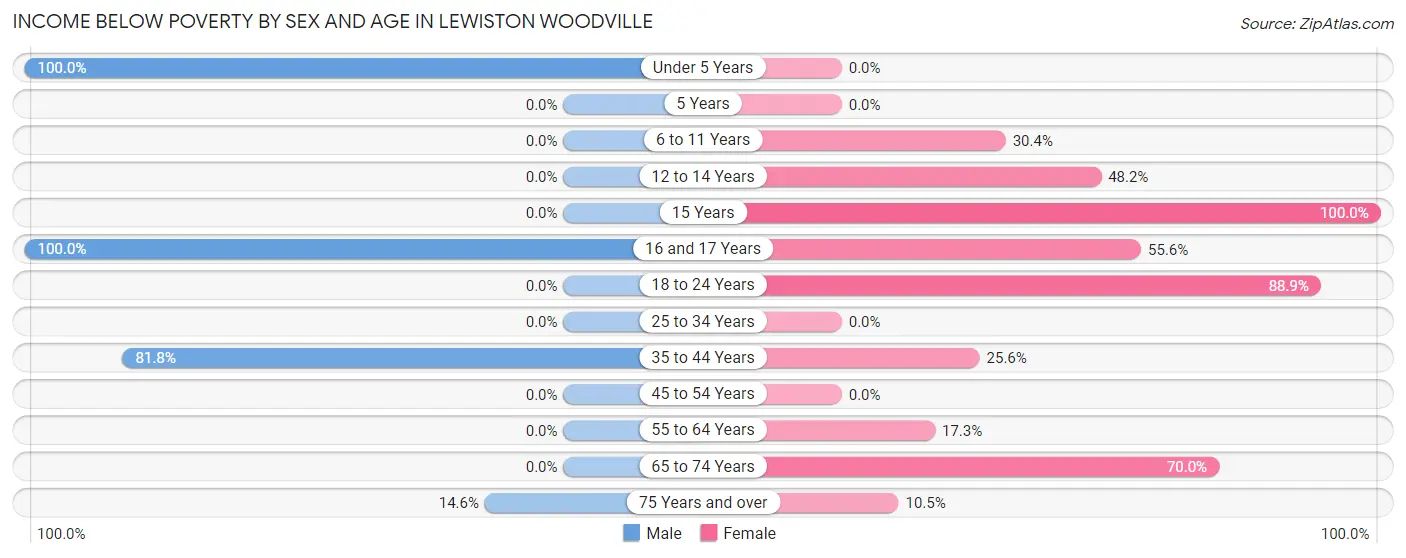
| Age Bracket | Male | Female |
| Under 5 Years | 10 (100.0%) | 0 (0.0%) |
| 5 Years | 0 (0.0%) | 0 (0.0%) |
| 6 to 11 Years | 0 (0.0%) | 7 (30.4%) |
| 12 to 14 Years | 0 (0.0%) | 13 (48.1%) |
| 15 Years | 0 (0.0%) | 6 (100.0%) |
| 16 and 17 Years | 3 (100.0%) | 10 (55.6%) |
| 18 to 24 Years | 0 (0.0%) | 16 (88.9%) |
| 25 to 34 Years | 0 (0.0%) | 0 (0.0%) |
| 35 to 44 Years | 9 (81.8%) | 11 (25.6%) |
| 45 to 54 Years | 0 (0.0%) | 0 (0.0%) |
| 55 to 64 Years | 0 (0.0%) | 9 (17.3%) |
| 65 to 74 Years | 0 (0.0%) | 14 (70.0%) |
| 75 Years and over | 7 (14.6%) | 4 (10.5%) |
| Total | 29 (17.3%) | 90 (31.0%) |
Income Above Poverty by Sex and Age in Lewiston Woodville
According to the poverty statistics in Lewiston Woodville, males aged 6 to 11 years and females aged under 5 years are the age groups that are most secure financially, with 100.0% of males and 100.0% of females in these age groups living above the poverty line.
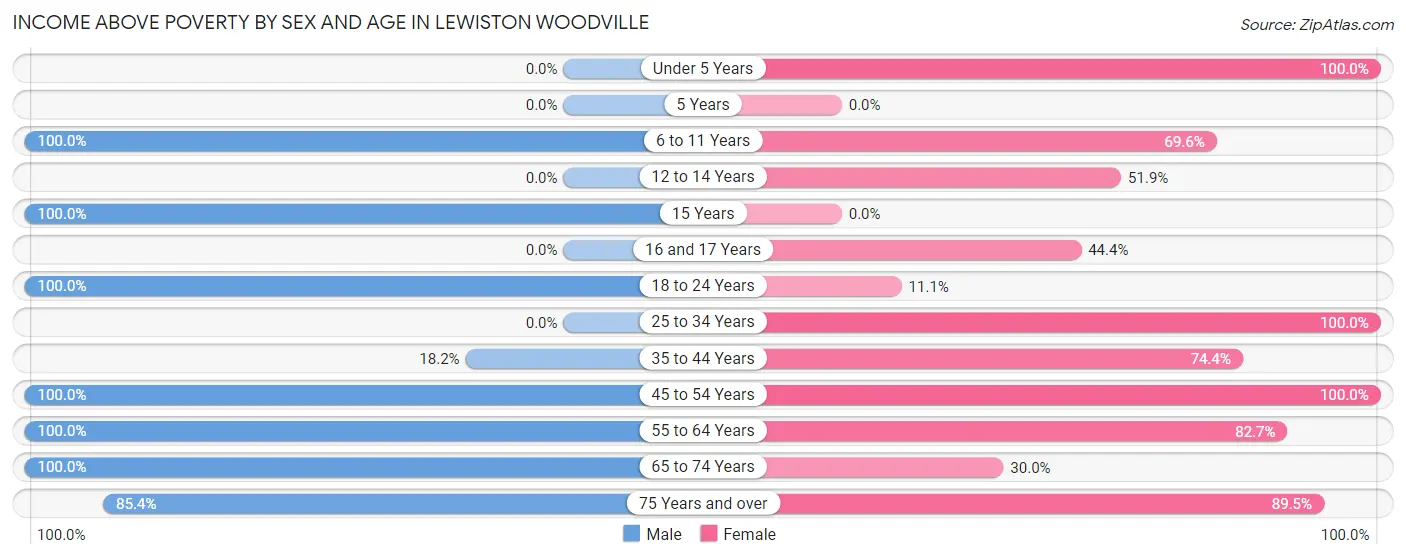
| Age Bracket | Male | Female |
| Under 5 Years | 0 (0.0%) | 7 (100.0%) |
| 5 Years | 0 (0.0%) | 0 (0.0%) |
| 6 to 11 Years | 9 (100.0%) | 16 (69.6%) |
| 12 to 14 Years | 0 (0.0%) | 14 (51.8%) |
| 15 Years | 3 (100.0%) | 0 (0.0%) |
| 16 and 17 Years | 0 (0.0%) | 8 (44.4%) |
| 18 to 24 Years | 11 (100.0%) | 2 (11.1%) |
| 25 to 34 Years | 0 (0.0%) | 10 (100.0%) |
| 35 to 44 Years | 2 (18.2%) | 32 (74.4%) |
| 45 to 54 Years | 20 (100.0%) | 28 (100.0%) |
| 55 to 64 Years | 26 (100.0%) | 43 (82.7%) |
| 65 to 74 Years | 27 (100.0%) | 6 (30.0%) |
| 75 Years and over | 41 (85.4%) | 34 (89.5%) |
| Total | 139 (82.7%) | 200 (69.0%) |
Income Below Poverty Among Married-Couple Families in Lewiston Woodville
The poverty statistics for married-couple families in Lewiston Woodville show that 2.9% or 2 of the total 70 families live below the poverty line. Families with no children have the highest poverty rate of 3.4%, comprising of 2 families. On the other hand, families with 3 or 4 children have the lowest poverty rate of 0.0%, which includes 0 families.
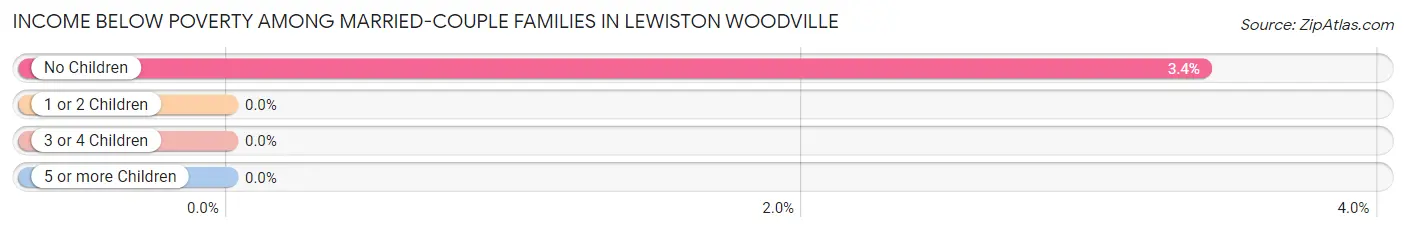
| Children | Above Poverty | Below Poverty |
| No Children | 57 (96.6%) | 2 (3.4%) |
| 1 or 2 Children | 0 (0.0%) | 0 (0.0%) |
| 3 or 4 Children | 11 (100.0%) | 0 (0.0%) |
| 5 or more Children | 0 (0.0%) | 0 (0.0%) |
| Total | 68 (97.1%) | 2 (2.9%) |
Income Below Poverty Among Single-Parent Households in Lewiston Woodville
According to the poverty data in Lewiston Woodville, 100.0% or 9 single-father households and 25.0% or 11 single-mother households are living below the poverty line. Among single-father households, those with 3 or 4 children have the highest poverty rate, with 9 households (100.0%) experiencing poverty. Likewise, among single-mother households, those with 3 or 4 children have the highest poverty rate, with 7 households (100.0%) falling below the poverty line.
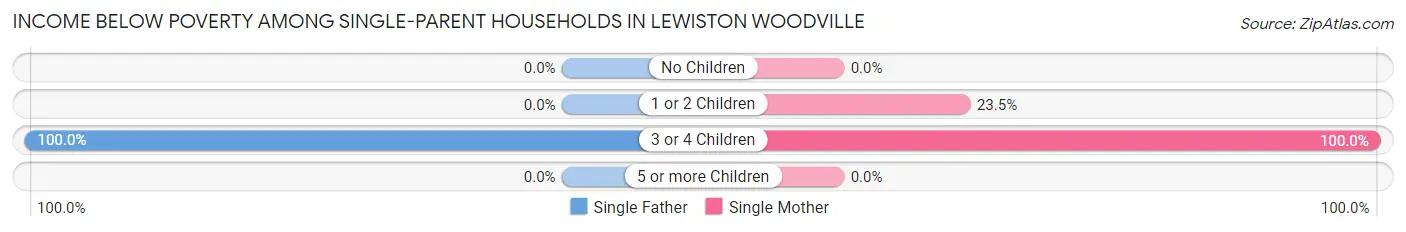
| Children | Single Father | Single Mother |
| No Children | 0 (0.0%) | 0 (0.0%) |
| 1 or 2 Children | 0 (0.0%) | 4 (23.5%) |
| 3 or 4 Children | 9 (100.0%) | 7 (100.0%) |
| 5 or more Children | 0 (0.0%) | 0 (0.0%) |
| Total | 9 (100.0%) | 11 (25.0%) |
Income Below Poverty Among Married-Couple vs Single-Parent Households in Lewiston Woodville
The poverty data for Lewiston Woodville shows that 2 of the married-couple family households (2.9%) and 20 of the single-parent households (37.7%) are living below the poverty level. Within the married-couple family households, those with no children have the highest poverty rate, with 2 households (3.4%) falling below the poverty line. Among the single-parent households, those with 3 or 4 children have the highest poverty rate, with 16 household (100.0%) living below poverty.
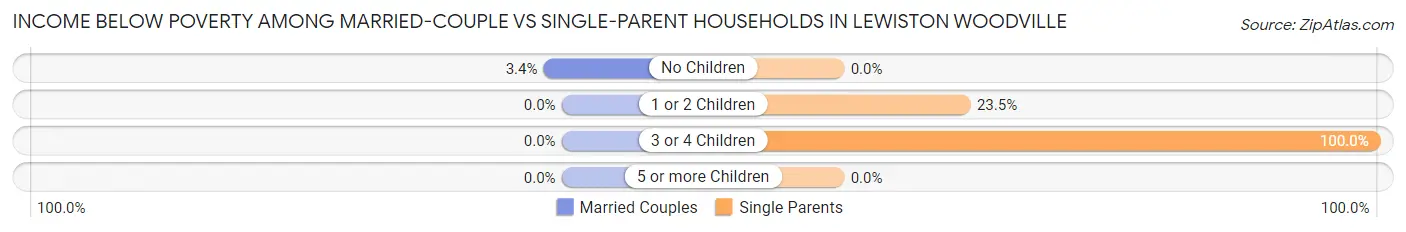
| Children | Married-Couple Families | Single-Parent Households |
| No Children | 2 (3.4%) | 0 (0.0%) |
| 1 or 2 Children | 0 (0.0%) | 4 (23.5%) |
| 3 or 4 Children | 0 (0.0%) | 16 (100.0%) |
| 5 or more Children | 0 (0.0%) | 0 (0.0%) |
| Total | 2 (2.9%) | 20 (37.7%) |
Race in Lewiston Woodville
The most populous races in Lewiston Woodville are Black / African American (306 | 66.8%), White / Caucasian (117 | 25.6%), and Two or more Races (34 | 7.4%).
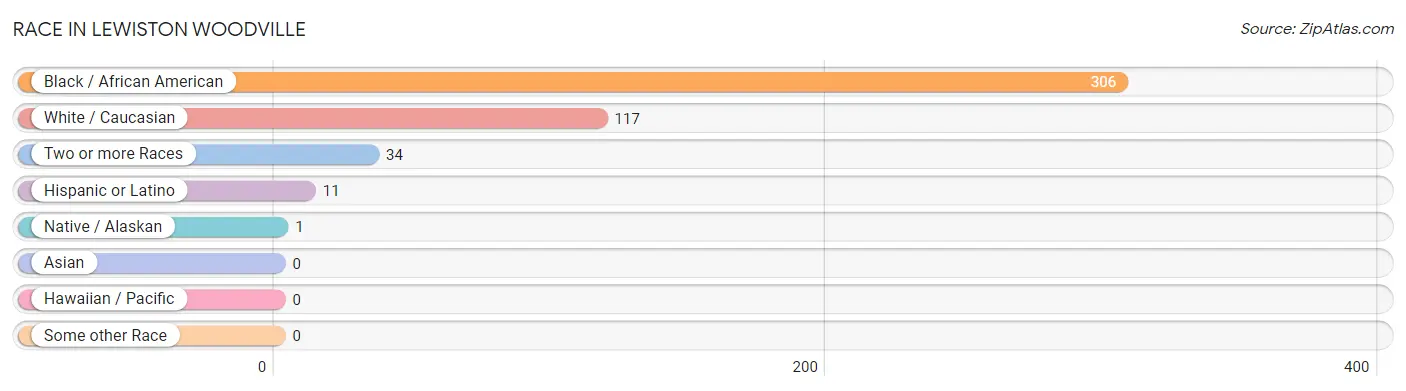
| Race | # Population | % Population |
| Asian | 0 | 0.0% |
| Black / African American | 306 | 66.8% |
| Hawaiian / Pacific | 0 | 0.0% |
| Hispanic or Latino | 11 | 2.4% |
| Native / Alaskan | 1 | 0.2% |
| White / Caucasian | 117 | 25.6% |
| Two or more Races | 34 | 7.4% |
| Some other Race | 0 | 0.0% |
| Total | 458 | 100.0% |
Ancestry in Lewiston Woodville
The most populous ancestries reported in Lewiston Woodville are American (90 | 19.7%), French (14 | 3.1%), English (11 | 2.4%), Italian (11 | 2.4%), and Mexican (11 | 2.4%), together accounting for 29.9% of all Lewiston Woodville residents.
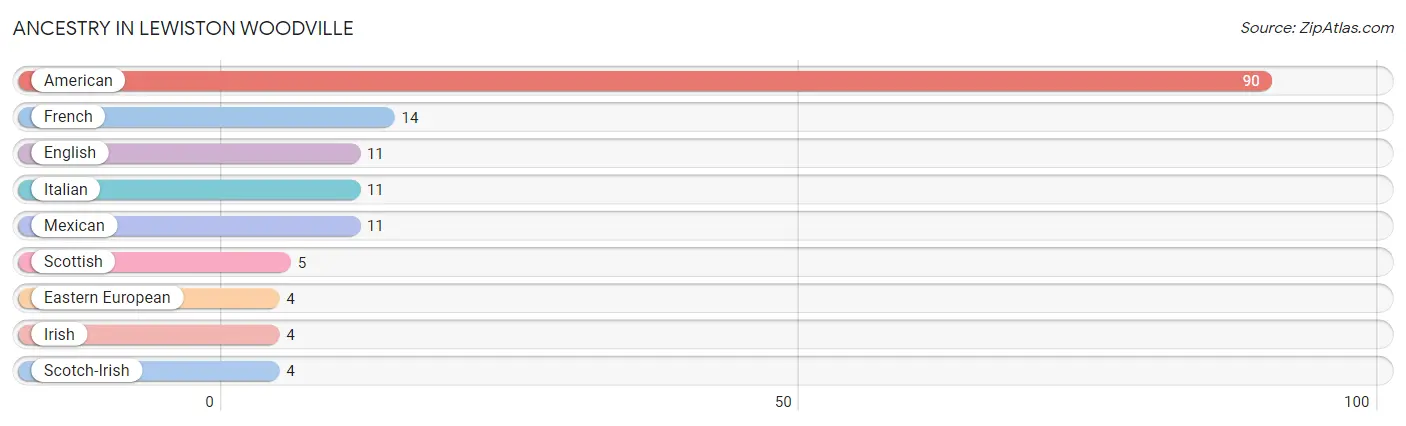
| Ancestry | # Population | % Population |
| American | 90 | 19.7% |
| Eastern European | 4 | 0.9% |
| English | 11 | 2.4% |
| French | 14 | 3.1% |
| Irish | 4 | 0.9% |
| Italian | 11 | 2.4% |
| Mexican | 11 | 2.4% |
| Scotch-Irish | 4 | 0.9% |
| Scottish | 5 | 1.1% | View All 9 Rows |
Immigrants in Lewiston Woodville

| Immigration Origin | # Population | % Population | View All 0 Rows |
Sex and Age in Lewiston Woodville
Sex and Age in Lewiston Woodville
The most populous age groups in Lewiston Woodville are 75 to 79 Years (44 | 26.2%) for men and 15 to 19 Years (42 | 14.5%) for women.
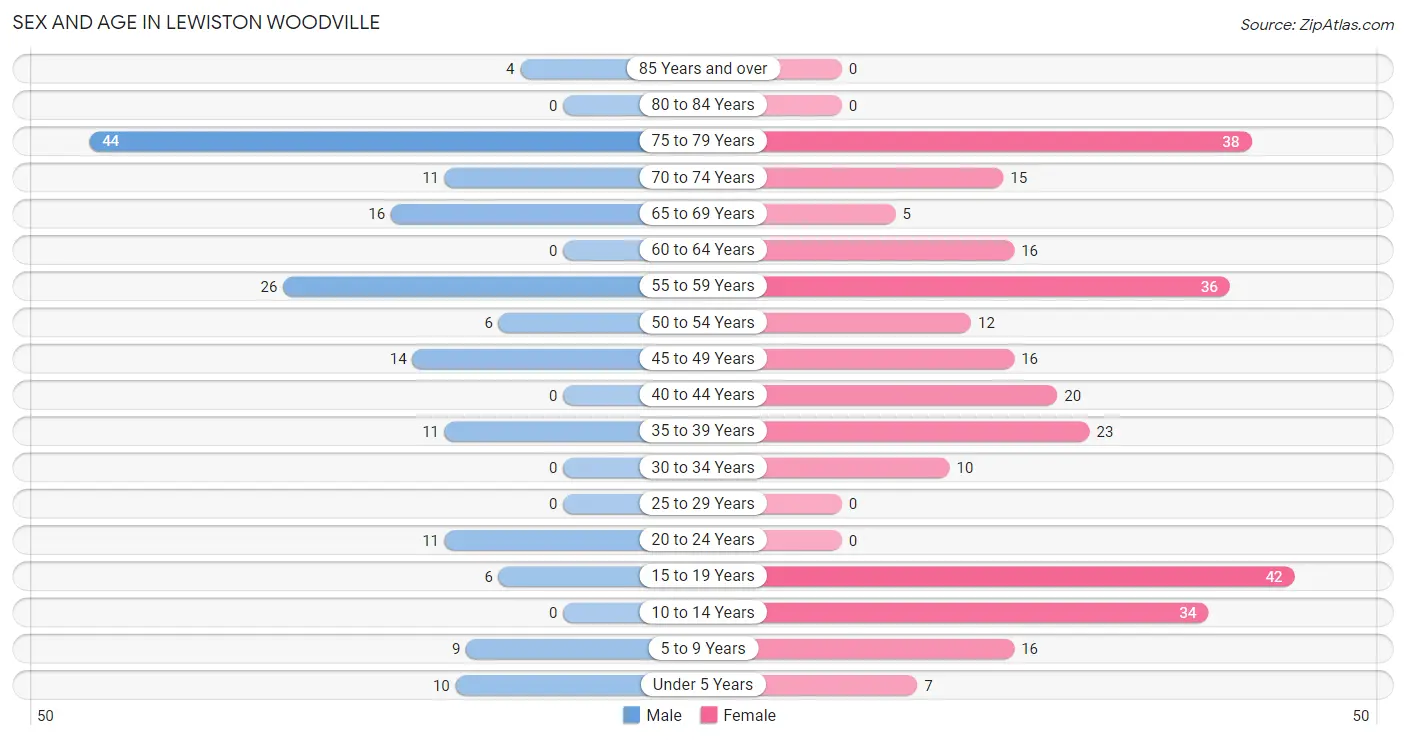
| Age Bracket | Male | Female |
| Under 5 Years | 10 (5.9%) | 7 (2.4%) |
| 5 to 9 Years | 9 (5.4%) | 16 (5.5%) |
| 10 to 14 Years | 0 (0.0%) | 34 (11.7%) |
| 15 to 19 Years | 6 (3.6%) | 42 (14.5%) |
| 20 to 24 Years | 11 (6.6%) | 0 (0.0%) |
| 25 to 29 Years | 0 (0.0%) | 0 (0.0%) |
| 30 to 34 Years | 0 (0.0%) | 10 (3.5%) |
| 35 to 39 Years | 11 (6.6%) | 23 (7.9%) |
| 40 to 44 Years | 0 (0.0%) | 20 (6.9%) |
| 45 to 49 Years | 14 (8.3%) | 16 (5.5%) |
| 50 to 54 Years | 6 (3.6%) | 12 (4.1%) |
| 55 to 59 Years | 26 (15.5%) | 36 (12.4%) |
| 60 to 64 Years | 0 (0.0%) | 16 (5.5%) |
| 65 to 69 Years | 16 (9.5%) | 5 (1.7%) |
| 70 to 74 Years | 11 (6.6%) | 15 (5.2%) |
| 75 to 79 Years | 44 (26.2%) | 38 (13.1%) |
| 80 to 84 Years | 0 (0.0%) | 0 (0.0%) |
| 85 Years and over | 4 (2.4%) | 0 (0.0%) |
| Total | 168 (100.0%) | 290 (100.0%) |
Families and Households in Lewiston Woodville
Median Family Size in Lewiston Woodville
The median family size in Lewiston Woodville is 2.80 persons per family, with single male/father families (9 | 7.3%) accounting for the largest median family size of 3.67 persons per family. On the other hand, single female/mother families (44 | 35.8%) represent the smallest median family size with 2.68 persons per family.
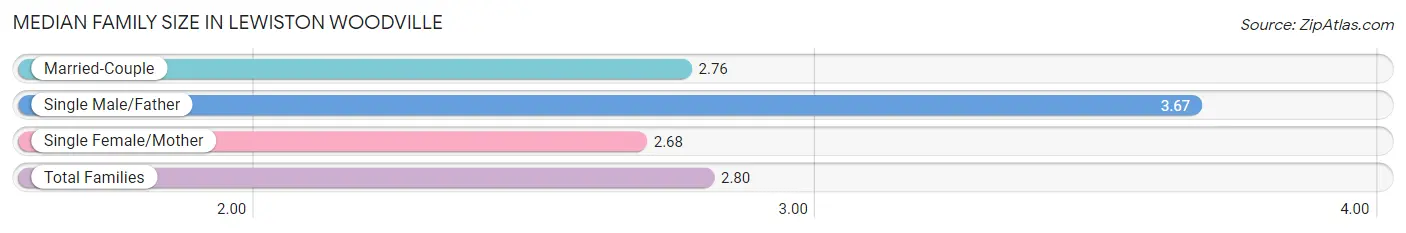
| Family Type | # Families | Family Size |
| Married-Couple | 70 (56.9%) | 2.76 |
| Single Male/Father | 9 (7.3%) | 3.67 |
| Single Female/Mother | 44 (35.8%) | 2.68 |
| Total Families | 123 (100.0%) | 2.80 |
Median Household Size in Lewiston Woodville
The median household size in Lewiston Woodville is 2.39 persons per household, with single male/father households (9 | 4.7%) accounting for the largest median household size of 4.78 persons per household. non-family households (69 | 35.9%) represent the smallest median household size with 1.36 persons per household.
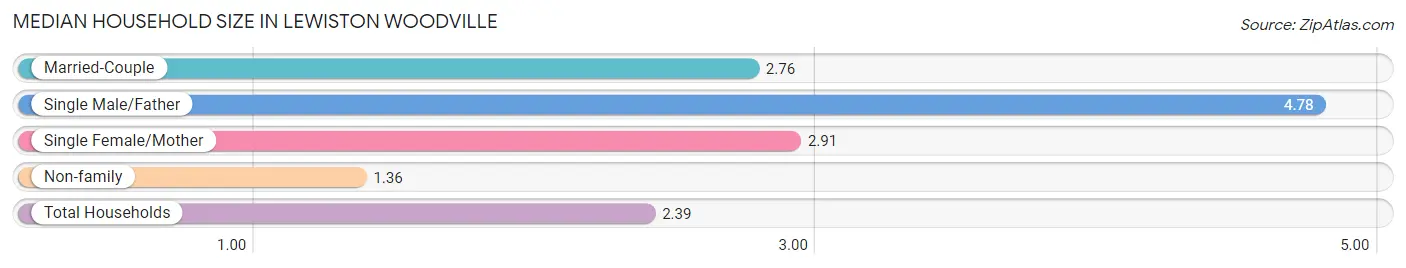
| Household Type | # Households | Household Size |
| Married-Couple | 70 (36.5%) | 2.76 |
| Single Male/Father | 9 (4.7%) | 4.78 |
| Single Female/Mother | 44 (22.9%) | 2.91 |
| Non-family | 69 (35.9%) | 1.36 |
| Total Households | 192 (100.0%) | 2.39 |
Household Size by Marriage Status in Lewiston Woodville
Out of a total of 192 households in Lewiston Woodville, 123 (64.1%) are family households, while 69 (35.9%) are nonfamily households. The most numerous type of family households are 2-person households, comprising 45, and the most common type of nonfamily households are 1-person households, comprising 58.
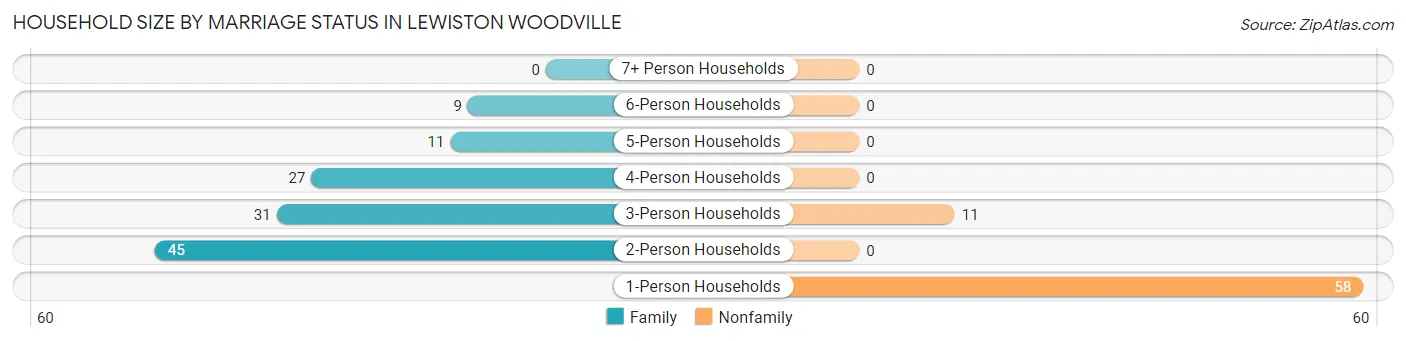
| Household Size | Family Households | Nonfamily Households |
| 1-Person Households | - | 58 (30.2%) |
| 2-Person Households | 45 (23.4%) | 0 (0.0%) |
| 3-Person Households | 31 (16.2%) | 11 (5.7%) |
| 4-Person Households | 27 (14.1%) | 0 (0.0%) |
| 5-Person Households | 11 (5.7%) | 0 (0.0%) |
| 6-Person Households | 9 (4.7%) | 0 (0.0%) |
| 7+ Person Households | 0 (0.0%) | 0 (0.0%) |
| Total | 123 (64.1%) | 69 (35.9%) |
Female Fertility in Lewiston Woodville
Fertility by Age in Lewiston Woodville
Average fertility rate in Lewiston Woodville is 108.0 births per 1,000 women. Women in the age bracket of 20 to 34 years have the highest fertility rate with 1,000.0 births per 1,000 women. Women in the age bracket of 20 to 34 years acount for 83.3% of all women with births.
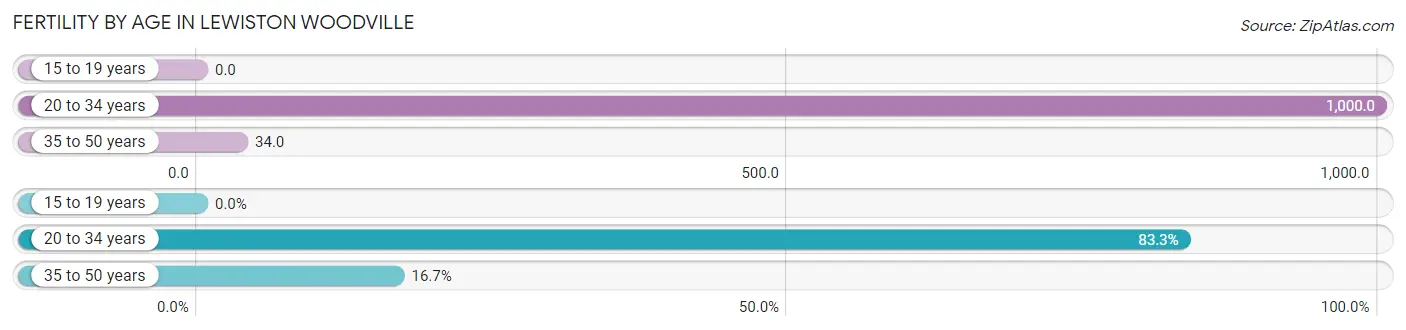
| Age Bracket | Women with Births | Births / 1,000 Women |
| 15 to 19 years | 0 (0.0%) | 0.0 |
| 20 to 34 years | 10 (83.3%) | 1,000.0 |
| 35 to 50 years | 2 (16.7%) | 34.0 |
| Total | 12 (100.0%) | 108.0 |
Fertility by Age by Marriage Status in Lewiston Woodville
16.7% of women with births (12) in Lewiston Woodville are married. The highest percentage of unmarried women with births falls into 20 to 34 years age bracket with 100.0% of them unmarried at the time of birth, while the lowest percentage of unmarried women with births belong to 35 to 50 years age bracket with 0.0% of them unmarried.
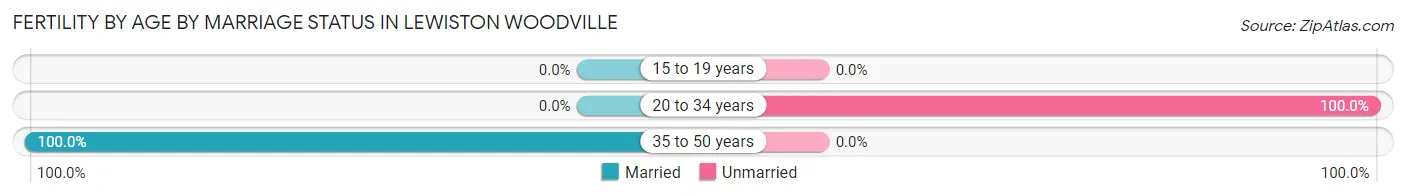
| Age Bracket | Married | Unmarried |
| 15 to 19 years | 0 (0.0%) | 0 (0.0%) |
| 20 to 34 years | 0 (0.0%) | 10 (100.0%) |
| 35 to 50 years | 2 (100.0%) | 0 (0.0%) |
| Total | 2 (16.7%) | 10 (83.3%) |
Fertility by Education in Lewiston Woodville
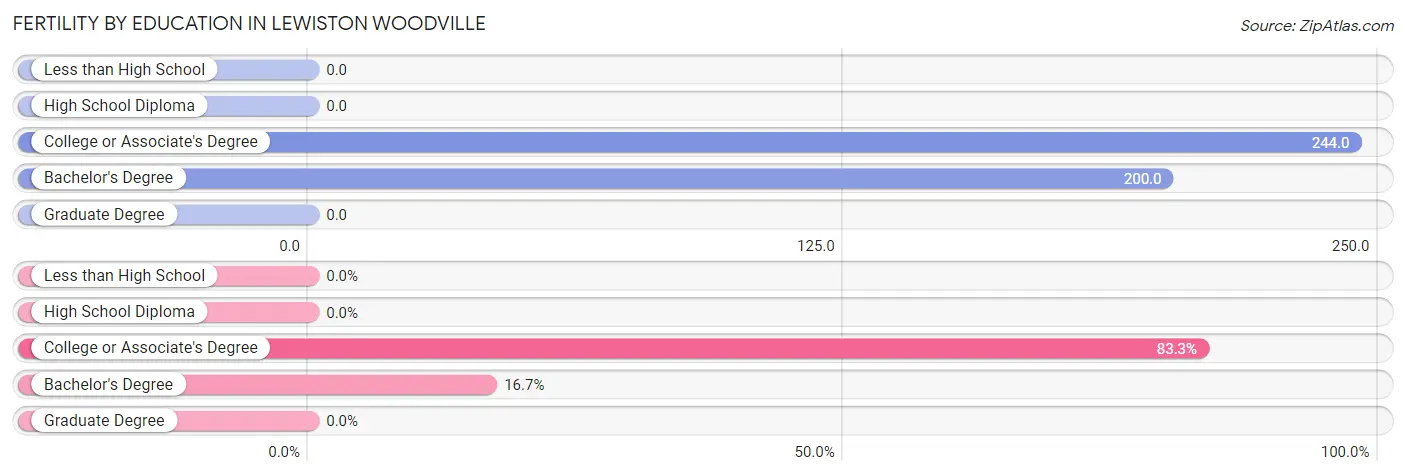
| Educational Attainment | Women with Births | Births / 1,000 Women |
| Less than High School | 0 (0.0%) | 0.0 |
| High School Diploma | 0 (0.0%) | 0.0 |
| College or Associate's Degree | 10 (83.3%) | 244.0 |
| Bachelor's Degree | 2 (16.7%) | 200.0 |
| Graduate Degree | 0 (0.0%) | 0.0 |
| Total | 12 (100.0%) | 108.0 |
Fertility by Education by Marriage Status in Lewiston Woodville
83.3% of women with births in Lewiston Woodville are unmarried. Women with the educational attainment of bachelor's degree are most likely to be married with 100.0% of them married at childbirth, while women with the educational attainment of college or associate's degree are least likely to be married with 100.0% of them unmarried at childbirth.
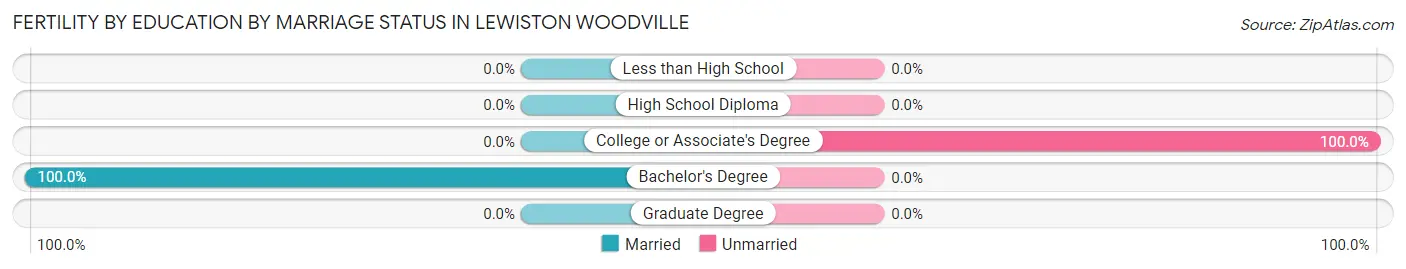
| Educational Attainment | Married | Unmarried |
| Less than High School | 0 (0.0%) | 0 (0.0%) |
| High School Diploma | 0 (0.0%) | 0 (0.0%) |
| College or Associate's Degree | 0 (0.0%) | 10 (100.0%) |
| Bachelor's Degree | 2 (100.0%) | 0 (0.0%) |
| Graduate Degree | 0 (0.0%) | 0 (0.0%) |
| Total | 2 (16.7%) | 10 (83.3%) |
Employment Characteristics in Lewiston Woodville
Employment by Class of Employer in Lewiston Woodville
Among the 150 employed individuals in Lewiston Woodville, private company employees (84 | 56.0%), state government employees (34 | 22.7%), and federal government employees (19 | 12.7%) make up the most common classes of employment.
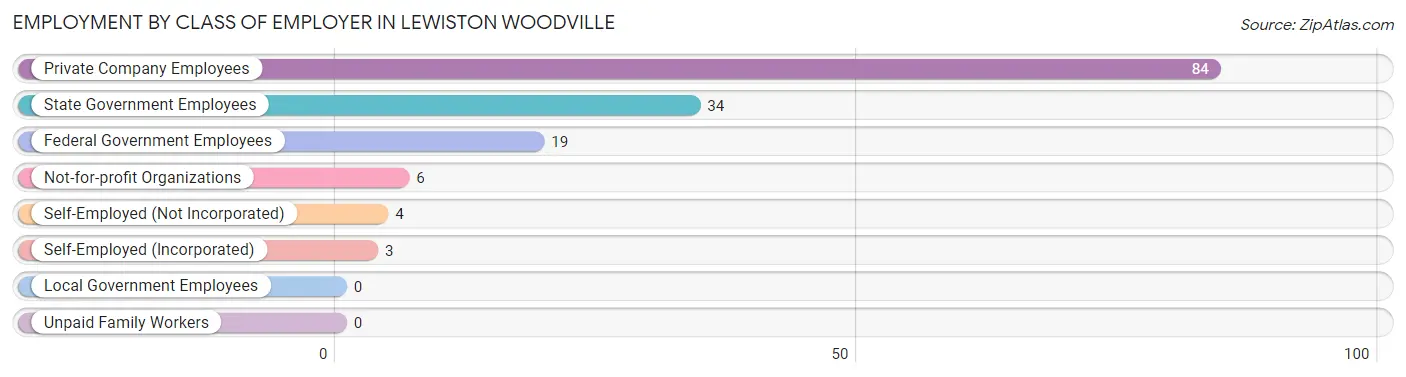
| Employer Class | # Employees | % Employees |
| Private Company Employees | 84 | 56.0% |
| Self-Employed (Incorporated) | 3 | 2.0% |
| Self-Employed (Not Incorporated) | 4 | 2.7% |
| Not-for-profit Organizations | 6 | 4.0% |
| Local Government Employees | 0 | 0.0% |
| State Government Employees | 34 | 22.7% |
| Federal Government Employees | 19 | 12.7% |
| Unpaid Family Workers | 0 | 0.0% |
| Total | 150 | 100.0% |
Employment Status by Age in Lewiston Woodville
According to the labor force statistics for Lewiston Woodville, out of the total population over 16 years of age (373), 45.3% or 169 individuals are in the labor force, with 9.5% or 16 of them unemployed. The age group with the highest labor force participation rate is 30 to 34 years, with 100.0% or 10 individuals in the labor force. Within the labor force, the 60 to 64 years age range has the highest percentage of unemployed individuals, with 57.1% or 4 of them being unemployed.
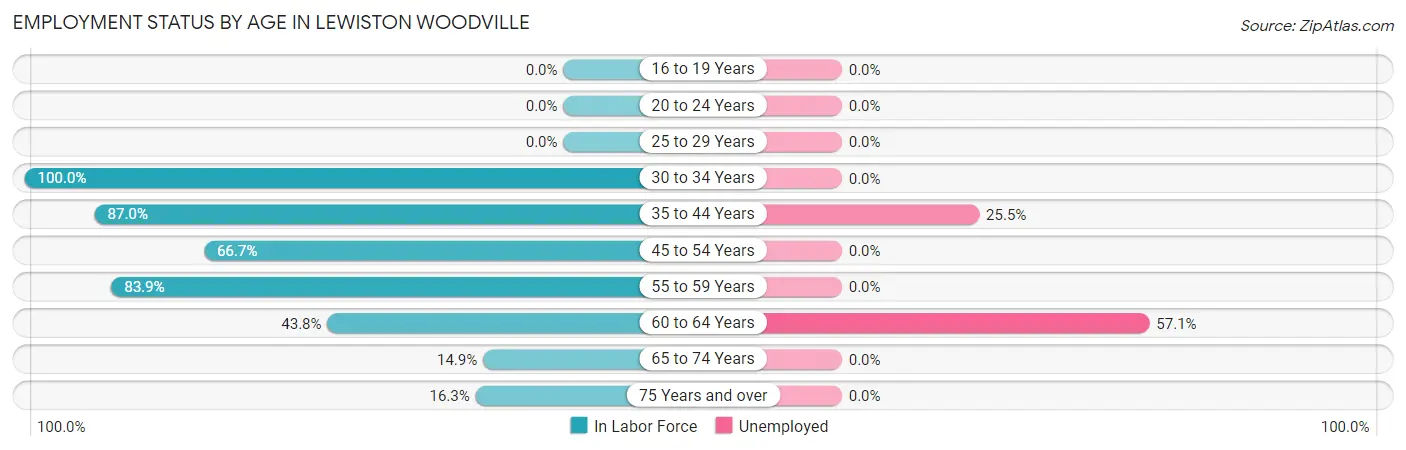
| Age Bracket | In Labor Force | Unemployed |
| 16 to 19 Years | 0 (0.0%) | 0 (0.0%) |
| 20 to 24 Years | 0 (0.0%) | 0 (0.0%) |
| 25 to 29 Years | 0 (0.0%) | 0 (0.0%) |
| 30 to 34 Years | 10 (100.0%) | 0 (0.0%) |
| 35 to 44 Years | 47 (87.0%) | 12 (25.5%) |
| 45 to 54 Years | 32 (66.7%) | 0 (0.0%) |
| 55 to 59 Years | 52 (83.9%) | 0 (0.0%) |
| 60 to 64 Years | 7 (43.8%) | 4 (57.1%) |
| 65 to 74 Years | 7 (14.9%) | 0 (0.0%) |
| 75 Years and over | 14 (16.3%) | 0 (0.0%) |
| Total | 169 (45.3%) | 16 (9.5%) |
Employment Status by Educational Attainment in Lewiston Woodville
According to labor force statistics for Lewiston Woodville, 77.9% of individuals (148) out of the total population between 25 and 64 years of age (190) are in the labor force, with 10.8% or 16 of them being unemployed. The group with the highest labor force participation rate are those with the educational attainment of college / associate degree, with 92.8% or 77 individuals in the labor force. Within the labor force, individuals with college / associate degree education have the highest percentage of unemployment, with 15.6% or 12 of them being unemployed.
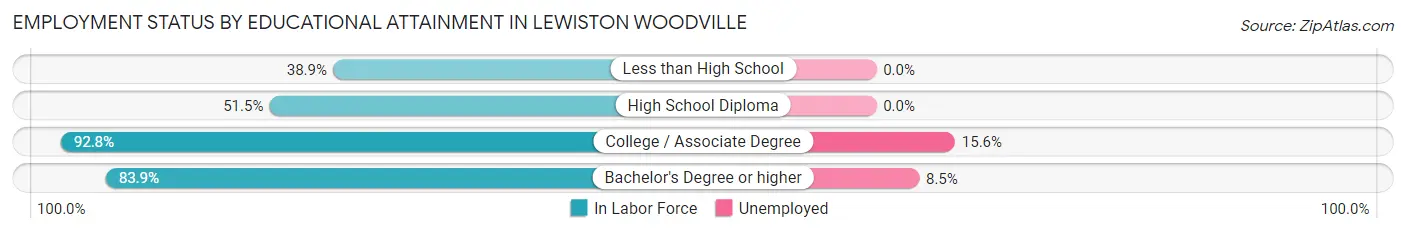
| Educational Attainment | In Labor Force | Unemployed |
| Less than High School | 7 (38.9%) | 0 (0.0%) |
| High School Diploma | 17 (51.5%) | 0 (0.0%) |
| College / Associate Degree | 77 (92.8%) | 13 (15.6%) |
| Bachelor's Degree or higher | 47 (83.9%) | 5 (8.5%) |
| Total | 148 (77.9%) | 21 (10.8%) |
Employment Occupations by Sex in Lewiston Woodville
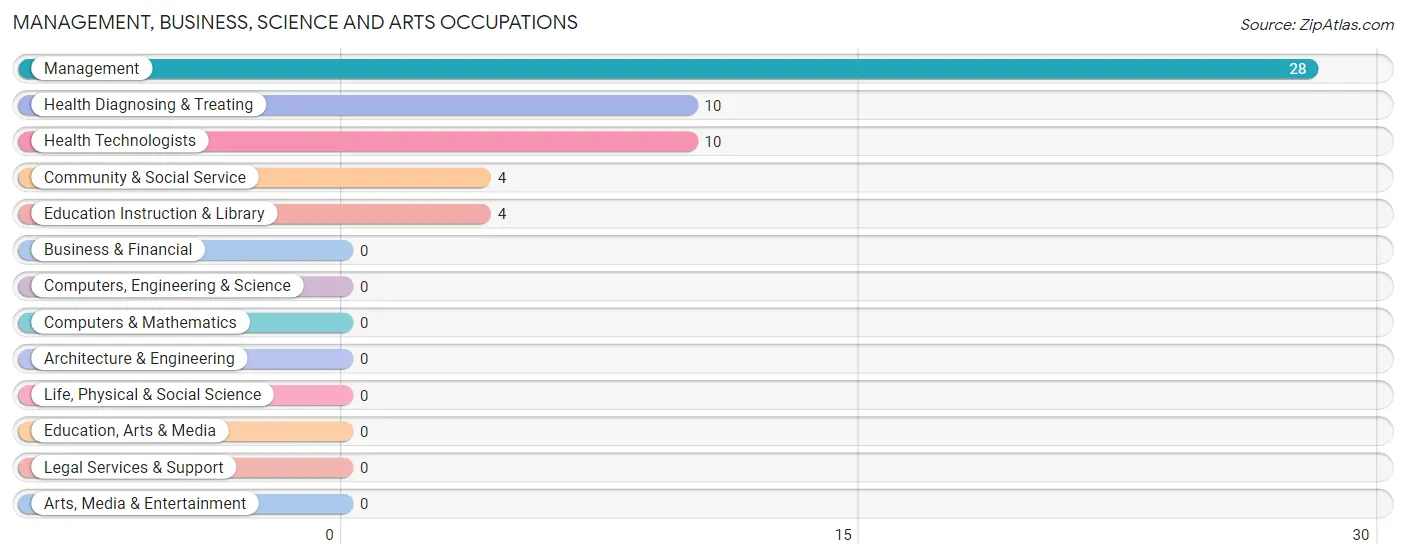
Management, Business, Science and Arts Occupations
The most common Management, Business, Science and Arts occupations in Lewiston Woodville are Management (28 | 18.3%), Health Diagnosing & Treating (10 | 6.5%), Health Technologists (10 | 6.5%), Community & Social Service (4 | 2.6%), and Education Instruction & Library (4 | 2.6%).
Management, Business, Science and Arts Occupations by Sex
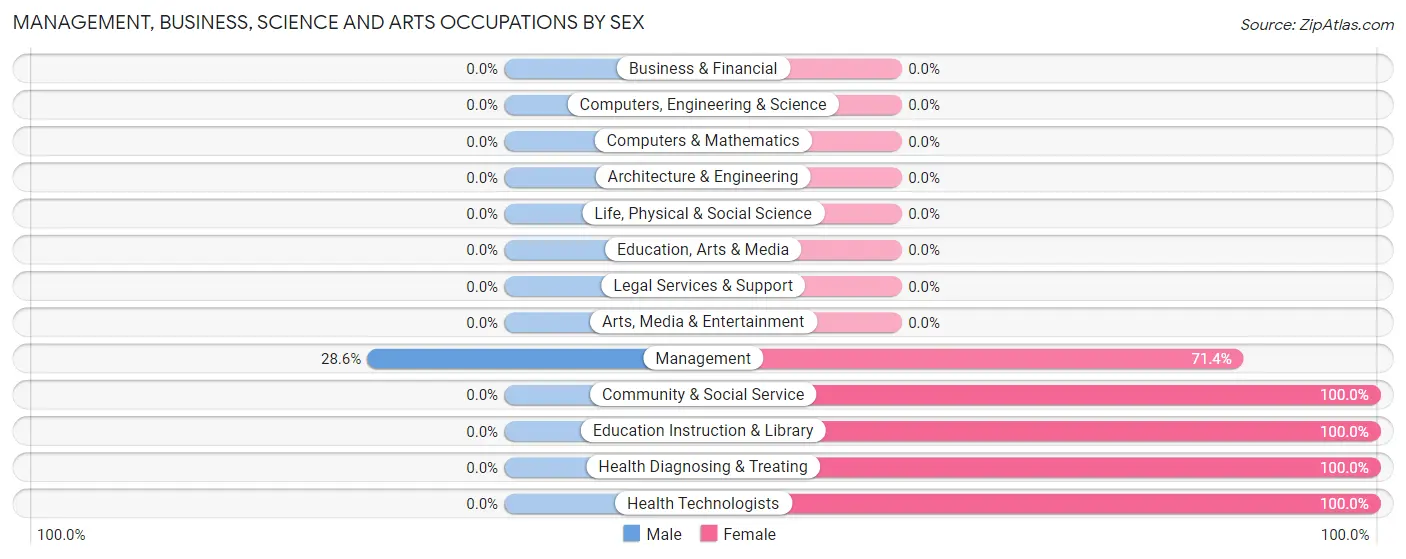
| Occupation | Male | Female |
| Management | 8 (28.6%) | 20 (71.4%) |
| Business & Financial | 0 (0.0%) | 0 (0.0%) |
| Computers, Engineering & Science | 0 (0.0%) | 0 (0.0%) |
| Computers & Mathematics | 0 (0.0%) | 0 (0.0%) |
| Architecture & Engineering | 0 (0.0%) | 0 (0.0%) |
| Life, Physical & Social Science | 0 (0.0%) | 0 (0.0%) |
| Community & Social Service | 0 (0.0%) | 4 (100.0%) |
| Education, Arts & Media | 0 (0.0%) | 0 (0.0%) |
| Legal Services & Support | 0 (0.0%) | 0 (0.0%) |
| Education Instruction & Library | 0 (0.0%) | 4 (100.0%) |
| Arts, Media & Entertainment | 0 (0.0%) | 0 (0.0%) |
| Health Diagnosing & Treating | 0 (0.0%) | 10 (100.0%) |
| Health Technologists | 0 (0.0%) | 10 (100.0%) |
| Total (Category) | 8 (19.1%) | 34 (80.9%) |
| Total (Overall) | 63 (41.2%) | 90 (58.8%) |
Services Occupations
The most common Services occupations in Lewiston Woodville are Food Preparation & Serving (14 | 9.1%), Cleaning & Maintenance (11 | 7.2%), and Healthcare Support (6 | 3.9%).
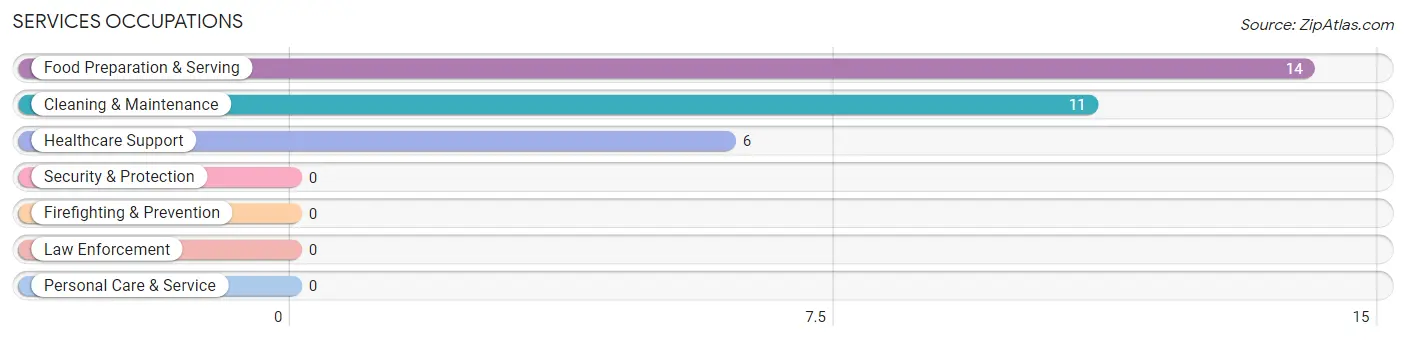
Services Occupations by Sex
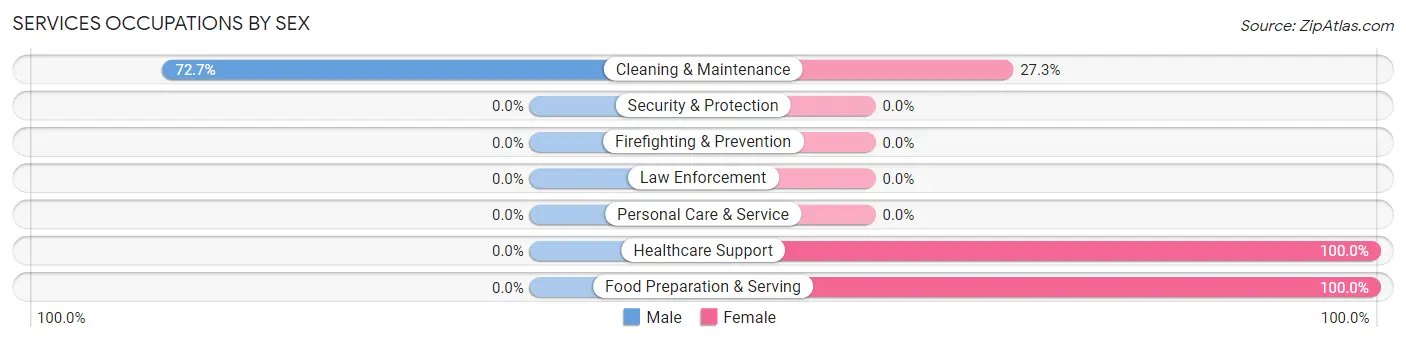
| Occupation | Male | Female |
| Healthcare Support | 0 (0.0%) | 6 (100.0%) |
| Security & Protection | 0 (0.0%) | 0 (0.0%) |
| Firefighting & Prevention | 0 (0.0%) | 0 (0.0%) |
| Law Enforcement | 0 (0.0%) | 0 (0.0%) |
| Food Preparation & Serving | 0 (0.0%) | 14 (100.0%) |
| Cleaning & Maintenance | 8 (72.7%) | 3 (27.3%) |
| Personal Care & Service | 0 (0.0%) | 0 (0.0%) |
| Total (Category) | 8 (25.8%) | 23 (74.2%) |
| Total (Overall) | 63 (41.2%) | 90 (58.8%) |
Sales and Office Occupations
The most common Sales and Office occupations in Lewiston Woodville are , and Office & Administration (33 | 21.6%).

Sales and Office Occupations by Sex
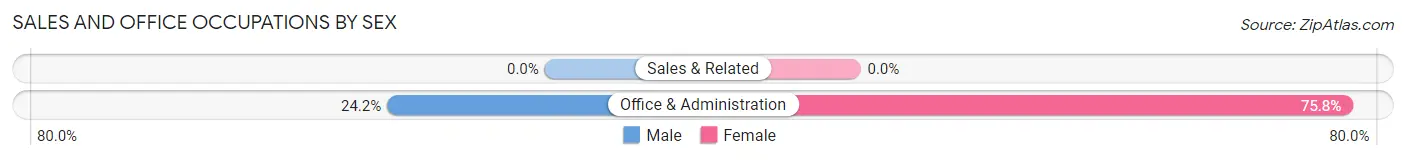
| Occupation | Male | Female |
| Sales & Related | 0 (0.0%) | 0 (0.0%) |
| Office & Administration | 8 (24.2%) | 25 (75.8%) |
| Total (Category) | 8 (24.2%) | 25 (75.8%) |
| Total (Overall) | 63 (41.2%) | 90 (58.8%) |
Natural Resources, Construction and Maintenance Occupations
Natural Resources, Construction and Maintenance Occupations by Sex
| Occupation | Male | Female |
| Farming, Fishing & Forestry | 0 (0.0%) | 0 (0.0%) |
| Construction & Extraction | 0 (0.0%) | 0 (0.0%) |
| Installation, Maintenance & Repair | 0 (0.0%) | 0 (0.0%) |
| Total (Category) | 0 (0.0%) | 0 (0.0%) |
| Total (Overall) | 63 (41.2%) | 90 (58.8%) |
Production, Transportation and Moving Occupations
The most common Production, Transportation and Moving occupations in Lewiston Woodville are Production (29 | 19.0%), Material Moving (16 | 10.5%), and Transportation (2 | 1.3%).
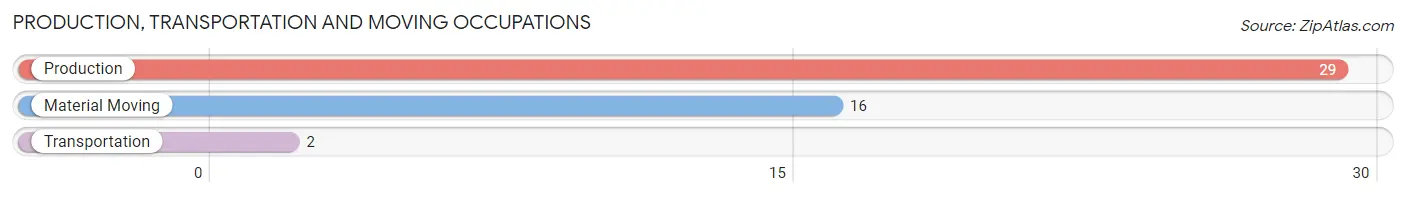
Production, Transportation and Moving Occupations by Sex
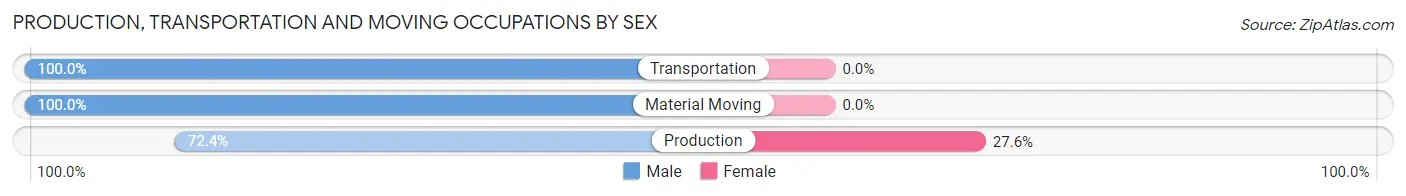
| Occupation | Male | Female |
| Production | 21 (72.4%) | 8 (27.6%) |
| Transportation | 2 (100.0%) | 0 (0.0%) |
| Material Moving | 16 (100.0%) | 0 (0.0%) |
| Total (Category) | 39 (83.0%) | 8 (17.0%) |
| Total (Overall) | 63 (41.2%) | 90 (58.8%) |
Employment Industries by Sex in Lewiston Woodville
Employment Industries in Lewiston Woodville
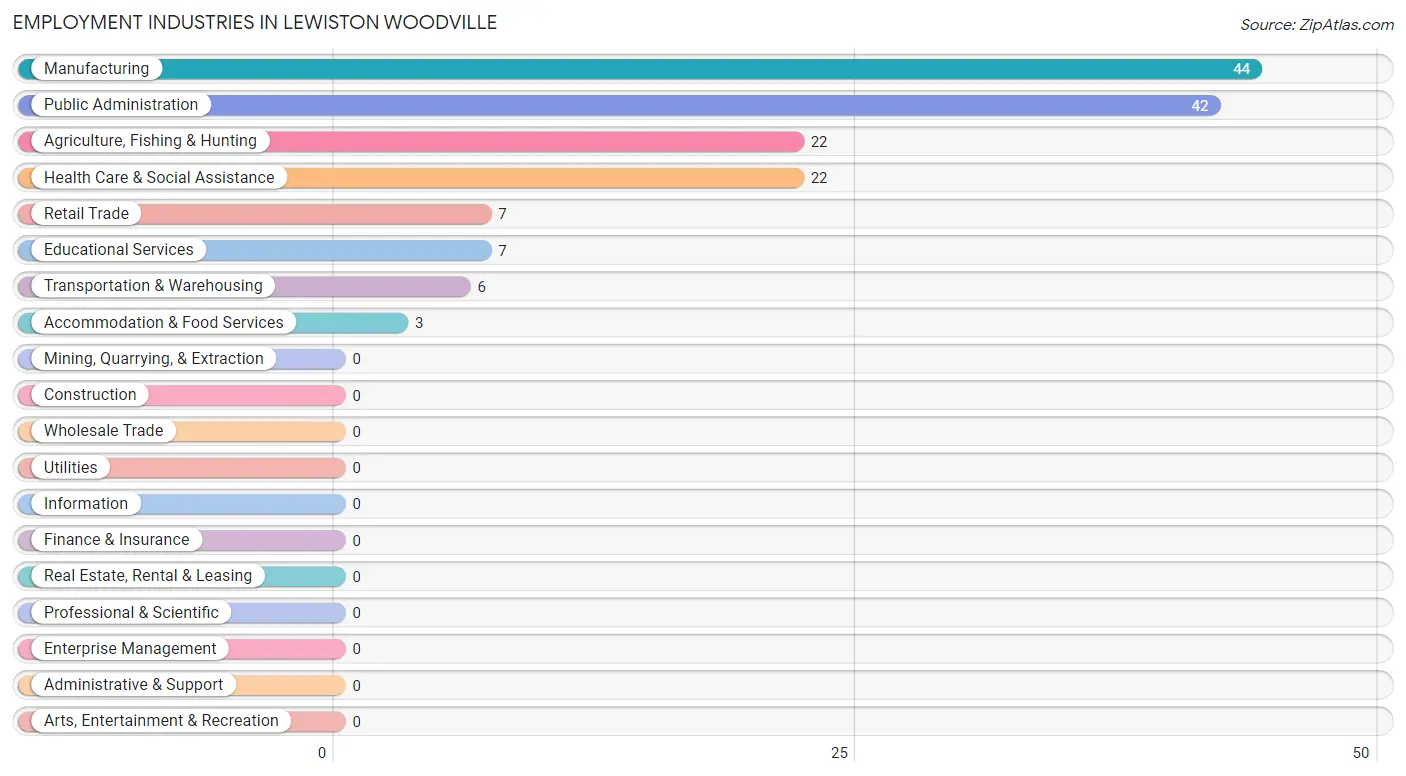
The major employment industries in Lewiston Woodville include Manufacturing (44 | 28.8%), Public Administration (42 | 27.5%), Agriculture, Fishing & Hunting (22 | 14.4%), Health Care & Social Assistance (22 | 14.4%), and Retail Trade (7 | 4.6%).
Employment Industries by Sex in Lewiston Woodville
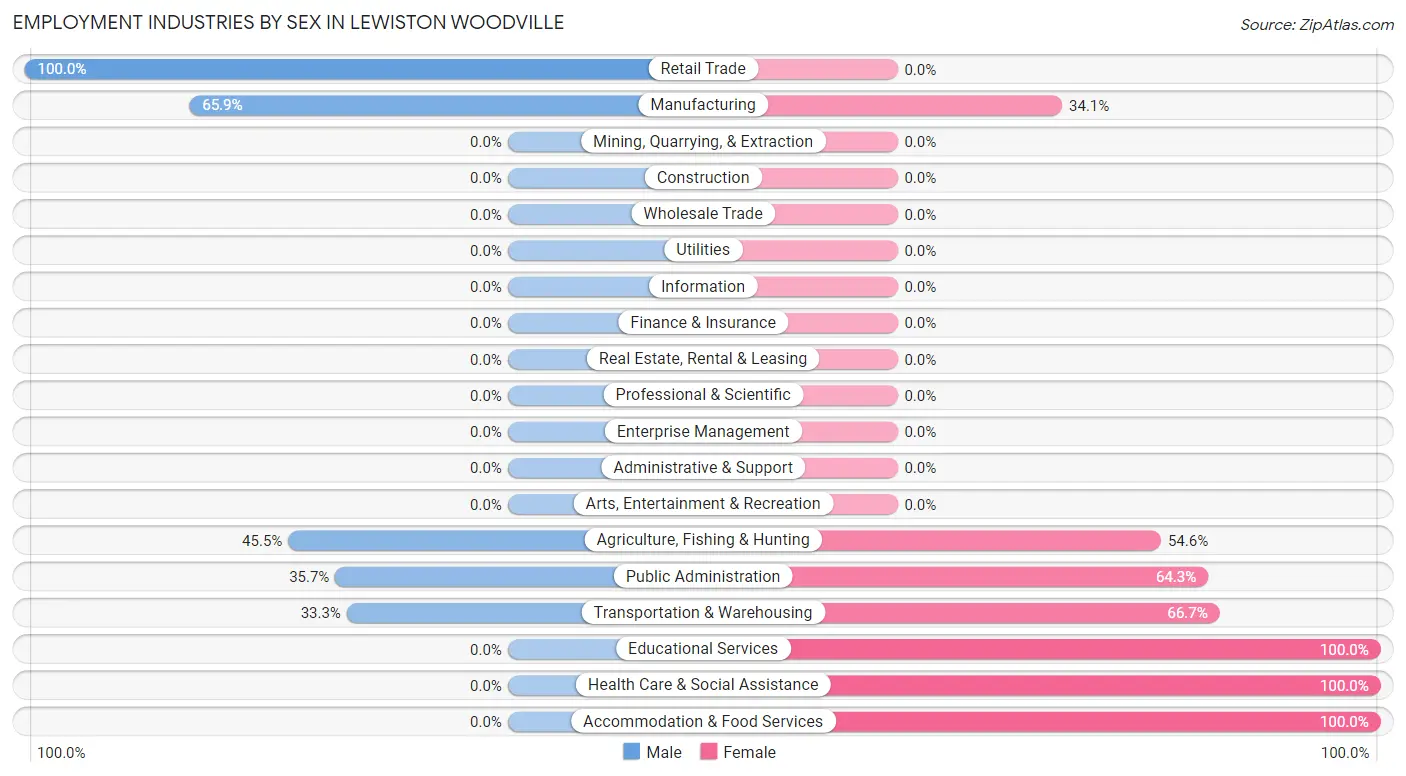
The Lewiston Woodville industries that see more men than women are Retail Trade (100.0%), Manufacturing (65.9%), and Agriculture, Fishing & Hunting (45.5%), whereas the industries that tend to have a higher number of women are Educational Services (100.0%), Health Care & Social Assistance (100.0%), and Accommodation & Food Services (100.0%).
| Industry | Male | Female |
| Agriculture, Fishing & Hunting | 10 (45.5%) | 12 (54.5%) |
| Mining, Quarrying, & Extraction | 0 (0.0%) | 0 (0.0%) |
| Construction | 0 (0.0%) | 0 (0.0%) |
| Manufacturing | 29 (65.9%) | 15 (34.1%) |
| Wholesale Trade | 0 (0.0%) | 0 (0.0%) |
| Retail Trade | 7 (100.0%) | 0 (0.0%) |
| Transportation & Warehousing | 2 (33.3%) | 4 (66.7%) |
| Utilities | 0 (0.0%) | 0 (0.0%) |
| Information | 0 (0.0%) | 0 (0.0%) |
| Finance & Insurance | 0 (0.0%) | 0 (0.0%) |
| Real Estate, Rental & Leasing | 0 (0.0%) | 0 (0.0%) |
| Professional & Scientific | 0 (0.0%) | 0 (0.0%) |
| Enterprise Management | 0 (0.0%) | 0 (0.0%) |
| Administrative & Support | 0 (0.0%) | 0 (0.0%) |
| Educational Services | 0 (0.0%) | 7 (100.0%) |
| Health Care & Social Assistance | 0 (0.0%) | 22 (100.0%) |
| Arts, Entertainment & Recreation | 0 (0.0%) | 0 (0.0%) |
| Accommodation & Food Services | 0 (0.0%) | 3 (100.0%) |
| Public Administration | 15 (35.7%) | 27 (64.3%) |
| Total | 63 (41.2%) | 90 (58.8%) |
Education in Lewiston Woodville
School Enrollment in Lewiston Woodville
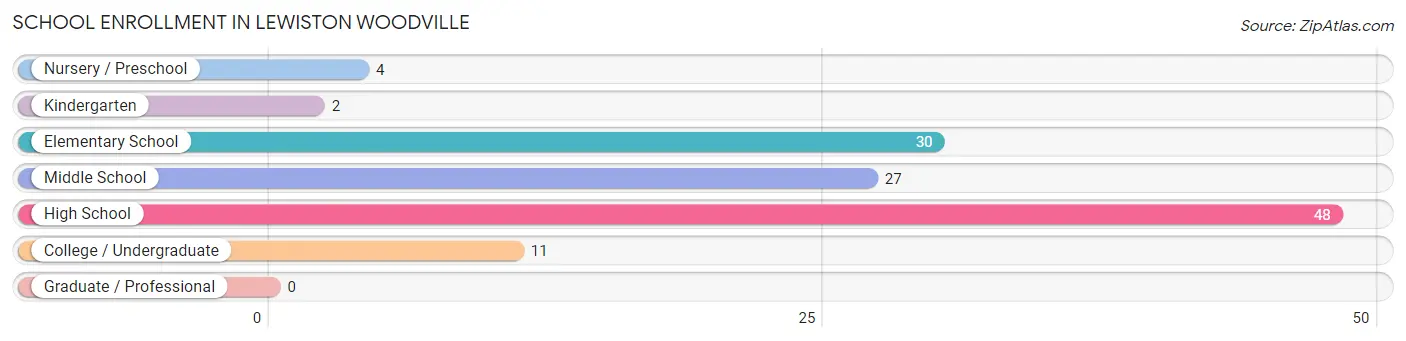
The most common levels of schooling among the 122 students in Lewiston Woodville are high school (48 | 39.3%), elementary school (30 | 24.6%), and middle school (27 | 22.1%).
| School Level | # Students | % Students |
| Nursery / Preschool | 4 | 3.3% |
| Kindergarten | 2 | 1.6% |
| Elementary School | 30 | 24.6% |
| Middle School | 27 | 22.1% |
| High School | 48 | 39.3% |
| College / Undergraduate | 11 | 9.0% |
| Graduate / Professional | 0 | 0.0% |
| Total | 122 | 100.0% |
School Enrollment by Age by Funding Source in Lewiston Woodville
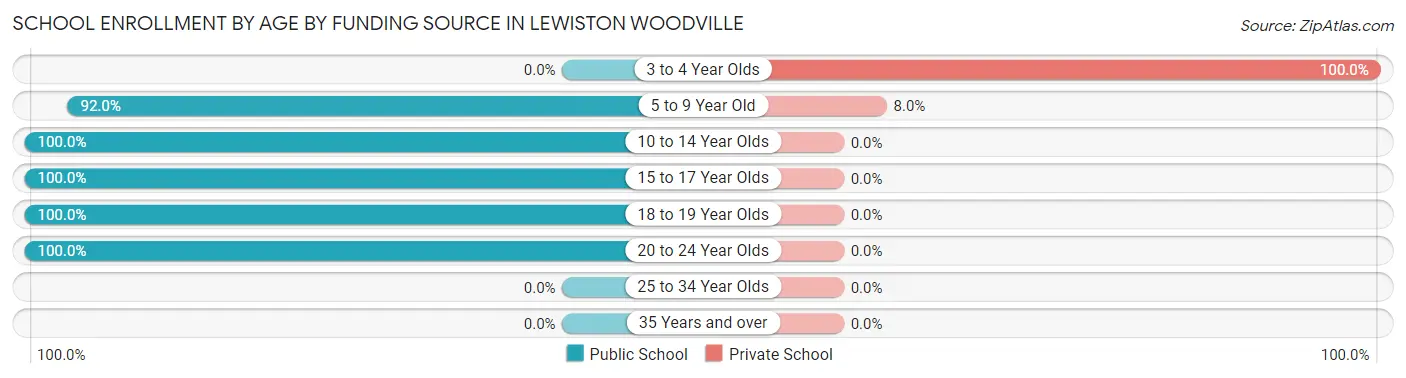
Out of a total of 122 students who are enrolled in schools in Lewiston Woodville, 6 (4.9%) attend a private institution, while the remaining 116 (95.1%) are enrolled in public schools. The age group of 3 to 4 year olds has the highest likelihood of being enrolled in private schools, with 4 (100.0% in the age bracket) enrolled. Conversely, the age group of 10 to 14 year olds has the lowest likelihood of being enrolled in a private school, with 34 (100.0% in the age bracket) attending a public institution.
| Age Bracket | Public School | Private School |
| 3 to 4 Year Olds | 0 (0.0%) | 4 (100.0%) |
| 5 to 9 Year Old | 23 (92.0%) | 2 (8.0%) |
| 10 to 14 Year Olds | 34 (100.0%) | 0 (0.0%) |
| 15 to 17 Year Olds | 30 (100.0%) | 0 (0.0%) |
| 18 to 19 Year Olds | 18 (100.0%) | 0 (0.0%) |
| 20 to 24 Year Olds | 11 (100.0%) | 0 (0.0%) |
| 25 to 34 Year Olds | 0 (0.0%) | 0 (0.0%) |
| 35 Years and over | 0 (0.0%) | 0 (0.0%) |
| Total | 116 (95.1%) | 6 (4.9%) |
Educational Attainment by Field of Study in Lewiston Woodville
Business (25 | 41.0%), science & technology (9 | 14.7%), arts & humanities (8 | 13.1%), psychology (7 | 11.5%), and computers & mathematics (6 | 9.8%) are the most common fields of study among 61 individuals in Lewiston Woodville who have obtained a bachelor's degree or higher.
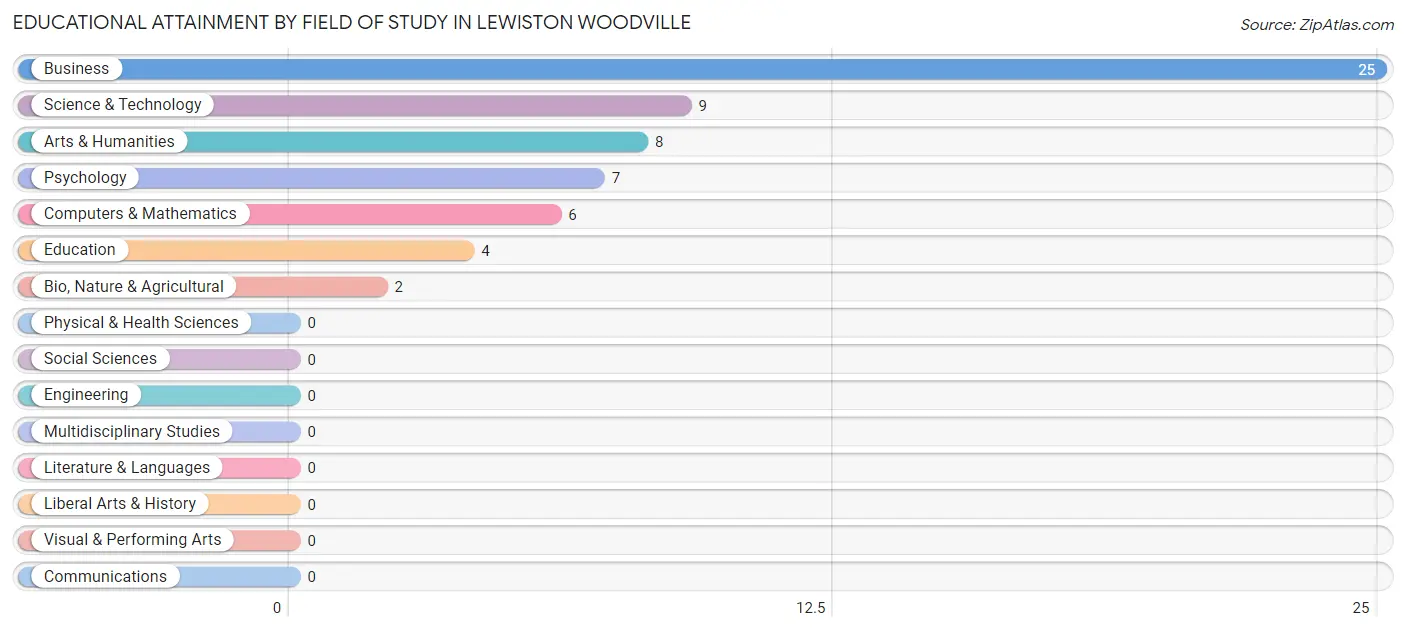
| Field of Study | # Graduates | % Graduates |
| Computers & Mathematics | 6 | 9.8% |
| Bio, Nature & Agricultural | 2 | 3.3% |
| Physical & Health Sciences | 0 | 0.0% |
| Psychology | 7 | 11.5% |
| Social Sciences | 0 | 0.0% |
| Engineering | 0 | 0.0% |
| Multidisciplinary Studies | 0 | 0.0% |
| Science & Technology | 9 | 14.7% |
| Business | 25 | 41.0% |
| Education | 4 | 6.6% |
| Literature & Languages | 0 | 0.0% |
| Liberal Arts & History | 0 | 0.0% |
| Visual & Performing Arts | 0 | 0.0% |
| Communications | 0 | 0.0% |
| Arts & Humanities | 8 | 13.1% |
| Total | 61 | 100.0% |
Transportation & Commute in Lewiston Woodville
Vehicle Availability by Sex in Lewiston Woodville
The most prevalent vehicle ownership categories in Lewiston Woodville are males with 3 vehicles (24, accounting for 38.1%) and females with 3 vehicles (24, making up 27.6%).
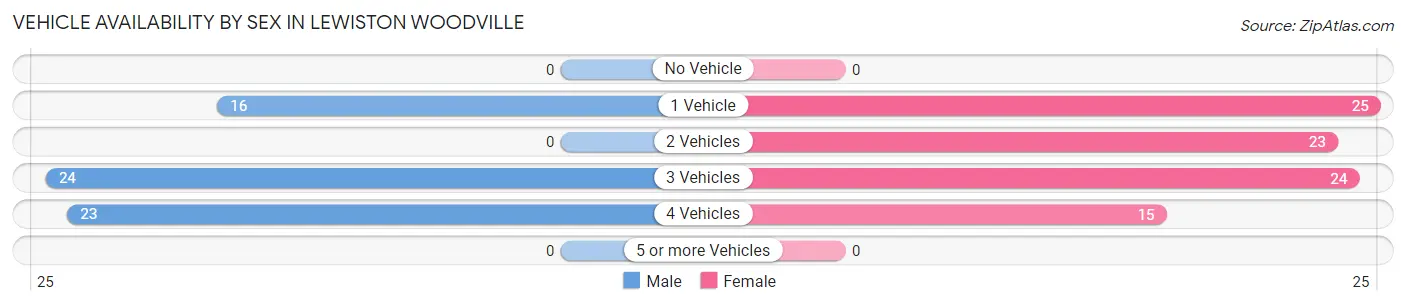
| Vehicles Available | Male | Female |
| No Vehicle | 0 (0.0%) | 0 (0.0%) |
| 1 Vehicle | 16 (25.4%) | 25 (28.7%) |
| 2 Vehicles | 0 (0.0%) | 23 (26.4%) |
| 3 Vehicles | 24 (38.1%) | 24 (27.6%) |
| 4 Vehicles | 23 (36.5%) | 15 (17.2%) |
| 5 or more Vehicles | 0 (0.0%) | 0 (0.0%) |
| Total | 63 (100.0%) | 87 (100.0%) |
Commute Time in Lewiston Woodville
The most frequently occuring commute durations in Lewiston Woodville are 30 to 34 minutes (41 commuters, 29.1%), 90 or more minutes (26 commuters, 18.4%), and 10 to 14 minutes (15 commuters, 10.6%).
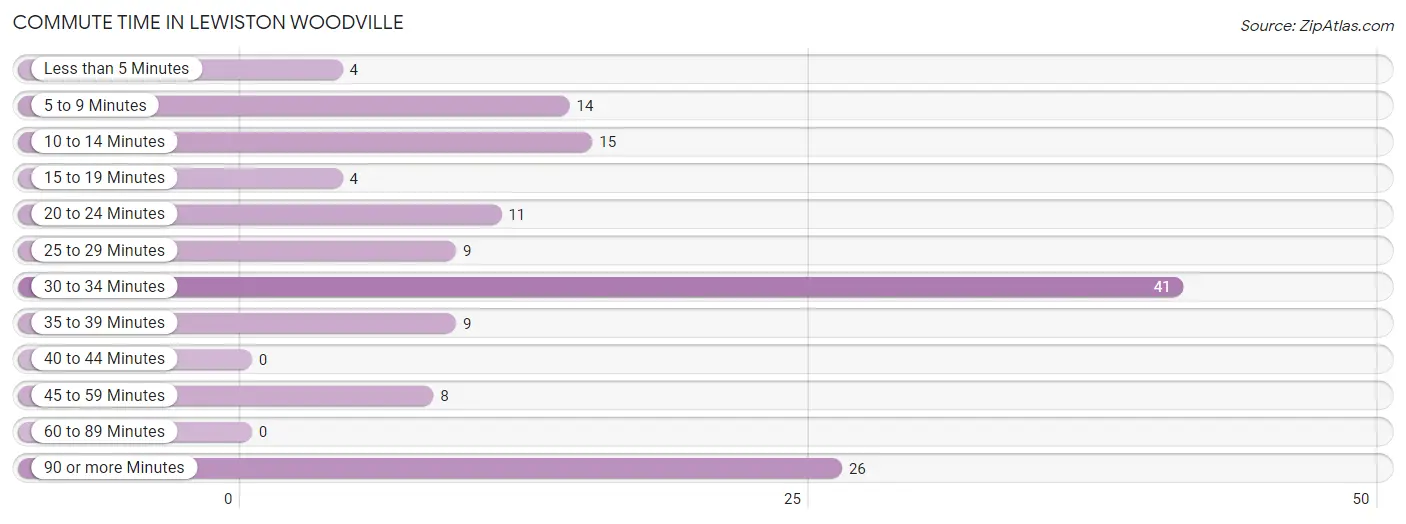
| Commute Time | # Commuters | % Commuters |
| Less than 5 Minutes | 4 | 2.8% |
| 5 to 9 Minutes | 14 | 9.9% |
| 10 to 14 Minutes | 15 | 10.6% |
| 15 to 19 Minutes | 4 | 2.8% |
| 20 to 24 Minutes | 11 | 7.8% |
| 25 to 29 Minutes | 9 | 6.4% |
| 30 to 34 Minutes | 41 | 29.1% |
| 35 to 39 Minutes | 9 | 6.4% |
| 40 to 44 Minutes | 0 | 0.0% |
| 45 to 59 Minutes | 8 | 5.7% |
| 60 to 89 Minutes | 0 | 0.0% |
| 90 or more Minutes | 26 | 18.4% |
Commute Time by Sex in Lewiston Woodville
The most common commute times in Lewiston Woodville are 30 to 34 minutes (16 commuters, 25.4%) for males and 30 to 34 minutes (25 commuters, 32.1%) for females.
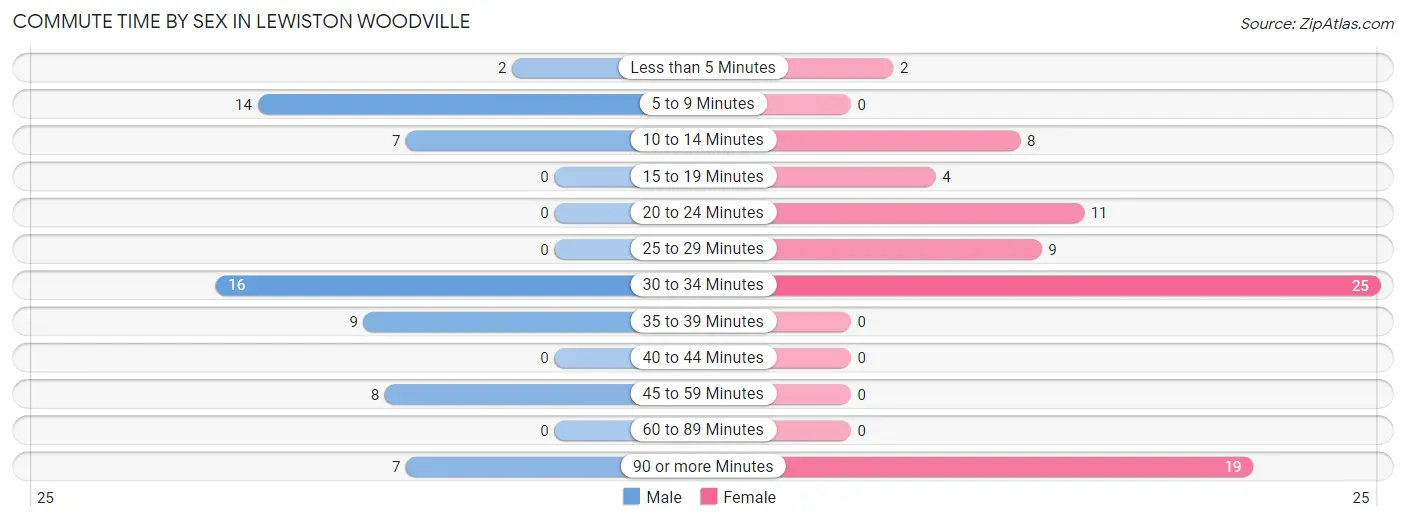
| Commute Time | Male | Female |
| Less than 5 Minutes | 2 (3.2%) | 2 (2.6%) |
| 5 to 9 Minutes | 14 (22.2%) | 0 (0.0%) |
| 10 to 14 Minutes | 7 (11.1%) | 8 (10.3%) |
| 15 to 19 Minutes | 0 (0.0%) | 4 (5.1%) |
| 20 to 24 Minutes | 0 (0.0%) | 11 (14.1%) |
| 25 to 29 Minutes | 0 (0.0%) | 9 (11.5%) |
| 30 to 34 Minutes | 16 (25.4%) | 25 (32.1%) |
| 35 to 39 Minutes | 9 (14.3%) | 0 (0.0%) |
| 40 to 44 Minutes | 0 (0.0%) | 0 (0.0%) |
| 45 to 59 Minutes | 8 (12.7%) | 0 (0.0%) |
| 60 to 89 Minutes | 0 (0.0%) | 0 (0.0%) |
| 90 or more Minutes | 7 (11.1%) | 19 (24.4%) |
Time of Departure to Work by Sex in Lewiston Woodville
The most frequent times of departure to work in Lewiston Woodville are 7:00 AM to 7:29 AM (25, 39.7%) for males and 6:00 AM to 6:29 AM (23, 29.5%) for females.
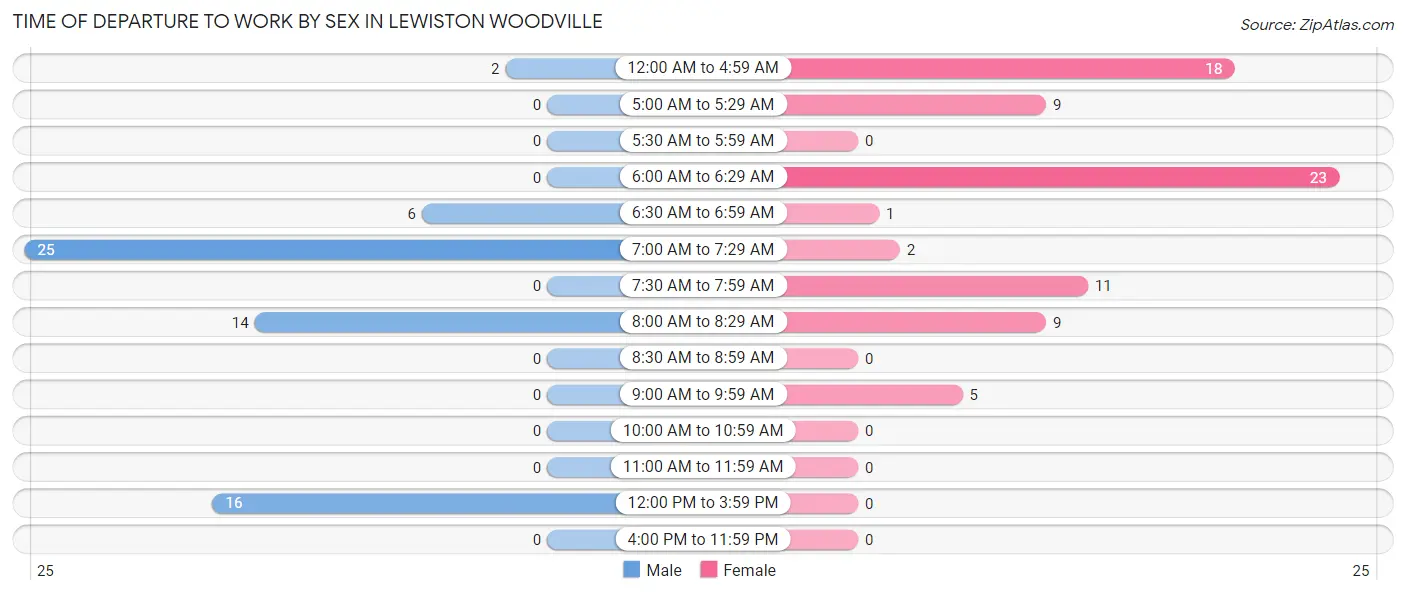
| Time of Departure | Male | Female |
| 12:00 AM to 4:59 AM | 2 (3.2%) | 18 (23.1%) |
| 5:00 AM to 5:29 AM | 0 (0.0%) | 9 (11.5%) |
| 5:30 AM to 5:59 AM | 0 (0.0%) | 0 (0.0%) |
| 6:00 AM to 6:29 AM | 0 (0.0%) | 23 (29.5%) |
| 6:30 AM to 6:59 AM | 6 (9.5%) | 1 (1.3%) |
| 7:00 AM to 7:29 AM | 25 (39.7%) | 2 (2.6%) |
| 7:30 AM to 7:59 AM | 0 (0.0%) | 11 (14.1%) |
| 8:00 AM to 8:29 AM | 14 (22.2%) | 9 (11.5%) |
| 8:30 AM to 8:59 AM | 0 (0.0%) | 0 (0.0%) |
| 9:00 AM to 9:59 AM | 0 (0.0%) | 5 (6.4%) |
| 10:00 AM to 10:59 AM | 0 (0.0%) | 0 (0.0%) |
| 11:00 AM to 11:59 AM | 0 (0.0%) | 0 (0.0%) |
| 12:00 PM to 3:59 PM | 16 (25.4%) | 0 (0.0%) |
| 4:00 PM to 11:59 PM | 0 (0.0%) | 0 (0.0%) |
| Total | 63 (100.0%) | 78 (100.0%) |
Housing Occupancy in Lewiston Woodville
Occupancy by Ownership in Lewiston Woodville
Of the total 192 dwellings in Lewiston Woodville, owner-occupied units account for 154 (80.2%), while renter-occupied units make up 38 (19.8%).
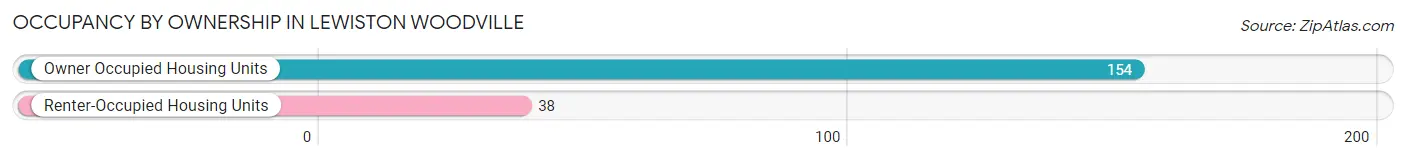
| Occupancy | # Housing Units | % Housing Units |
| Owner Occupied Housing Units | 154 | 80.2% |
| Renter-Occupied Housing Units | 38 | 19.8% |
| Total Occupied Housing Units | 192 | 100.0% |
Occupancy by Household Size in Lewiston Woodville
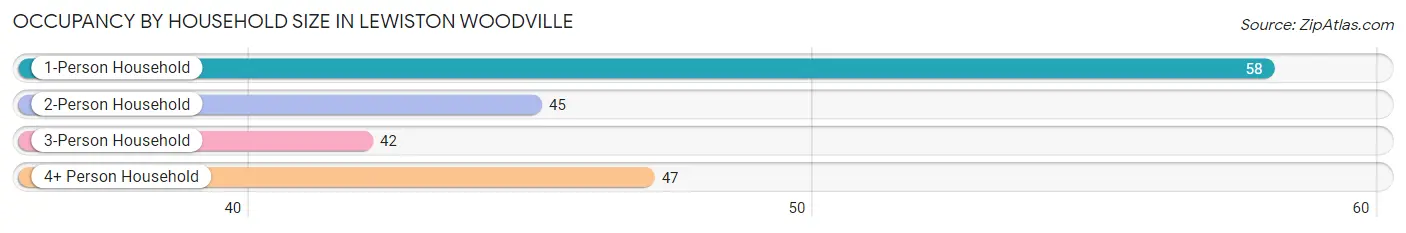
| Household Size | # Housing Units | % Housing Units |
| 1-Person Household | 58 | 30.2% |
| 2-Person Household | 45 | 23.4% |
| 3-Person Household | 42 | 21.9% |
| 4+ Person Household | 47 | 24.5% |
| Total Housing Units | 192 | 100.0% |
Occupancy by Ownership by Household Size in Lewiston Woodville
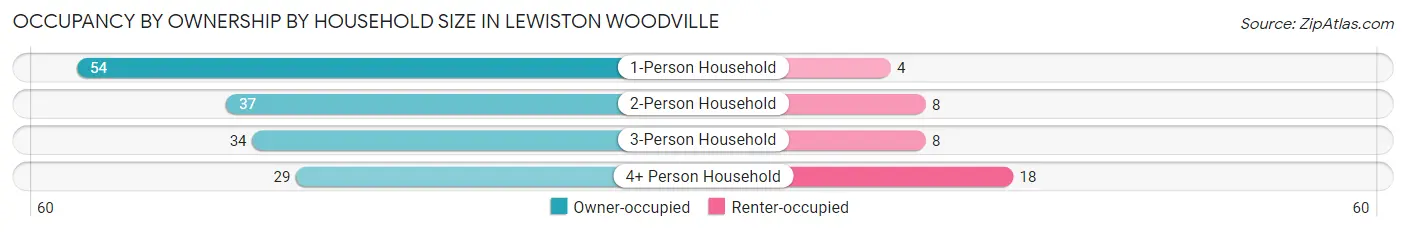
| Household Size | Owner-occupied | Renter-occupied |
| 1-Person Household | 54 (93.1%) | 4 (6.9%) |
| 2-Person Household | 37 (82.2%) | 8 (17.8%) |
| 3-Person Household | 34 (80.9%) | 8 (19.1%) |
| 4+ Person Household | 29 (61.7%) | 18 (38.3%) |
| Total Housing Units | 154 (80.2%) | 38 (19.8%) |
Occupancy by Educational Attainment in Lewiston Woodville
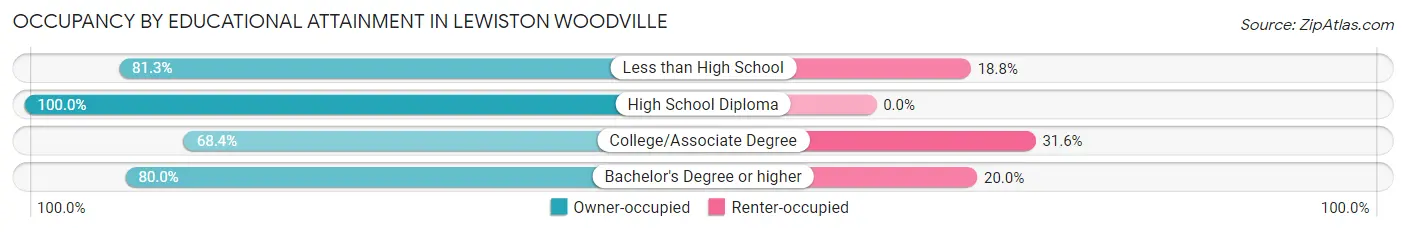
| Household Size | Owner-occupied | Renter-occupied |
| Less than High School | 52 (81.2%) | 12 (18.8%) |
| High School Diploma | 31 (100.0%) | 0 (0.0%) |
| College/Associate Degree | 39 (68.4%) | 18 (31.6%) |
| Bachelor's Degree or higher | 32 (80.0%) | 8 (20.0%) |
Occupancy by Age of Householder in Lewiston Woodville
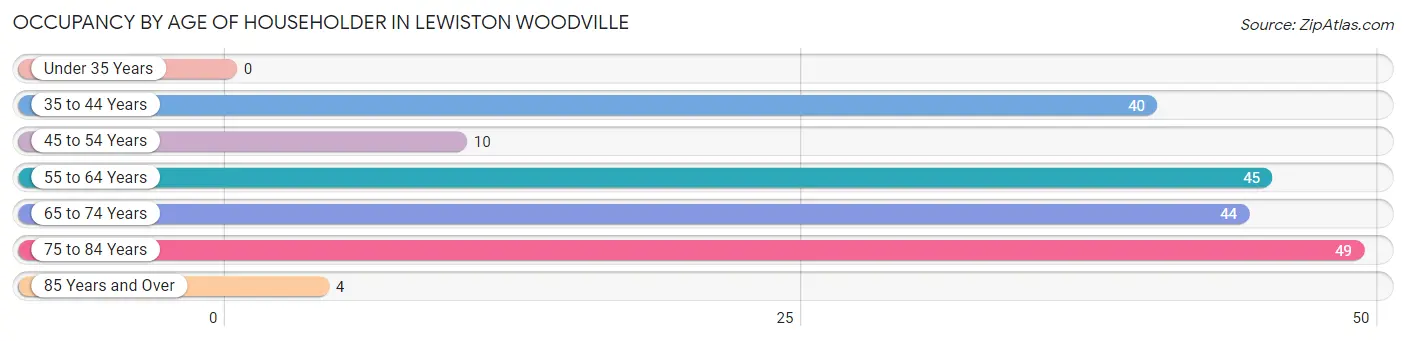
| Age Bracket | # Households | % Households |
| Under 35 Years | 0 | 0.0% |
| 35 to 44 Years | 40 | 20.8% |
| 45 to 54 Years | 10 | 5.2% |
| 55 to 64 Years | 45 | 23.4% |
| 65 to 74 Years | 44 | 22.9% |
| 75 to 84 Years | 49 | 25.5% |
| 85 Years and Over | 4 | 2.1% |
| Total | 192 | 100.0% |
Housing Finances in Lewiston Woodville
Median Income by Occupancy in Lewiston Woodville
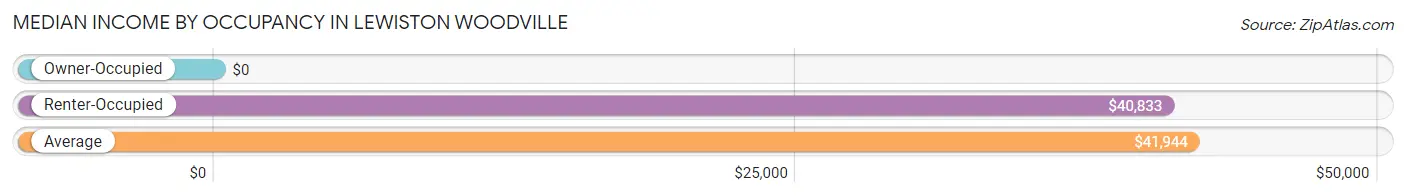
| Occupancy Type | # Households | Median Income |
| Owner-Occupied | 154 (80.2%) | $0 |
| Renter-Occupied | 38 (19.8%) | $40,833 |
| Average | 192 (100.0%) | $41,944 |
Occupancy by Householder Income Bracket in Lewiston Woodville
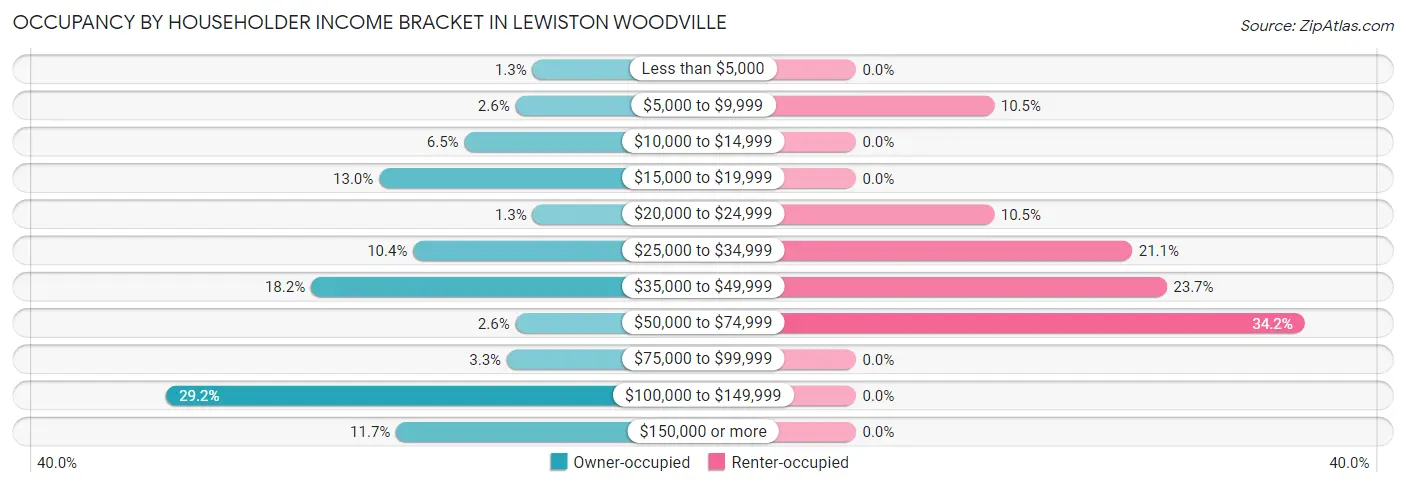
| Income Bracket | Owner-occupied | Renter-occupied |
| Less than $5,000 | 2 (1.3%) | 0 (0.0%) |
| $5,000 to $9,999 | 4 (2.6%) | 4 (10.5%) |
| $10,000 to $14,999 | 10 (6.5%) | 0 (0.0%) |
| $15,000 to $19,999 | 20 (13.0%) | 0 (0.0%) |
| $20,000 to $24,999 | 2 (1.3%) | 4 (10.5%) |
| $25,000 to $34,999 | 16 (10.4%) | 8 (21.0%) |
| $35,000 to $49,999 | 28 (18.2%) | 9 (23.7%) |
| $50,000 to $74,999 | 4 (2.6%) | 13 (34.2%) |
| $75,000 to $99,999 | 5 (3.3%) | 0 (0.0%) |
| $100,000 to $149,999 | 45 (29.2%) | 0 (0.0%) |
| $150,000 or more | 18 (11.7%) | 0 (0.0%) |
| Total | 154 (100.0%) | 38 (100.0%) |
Monthly Housing Cost Tiers in Lewiston Woodville
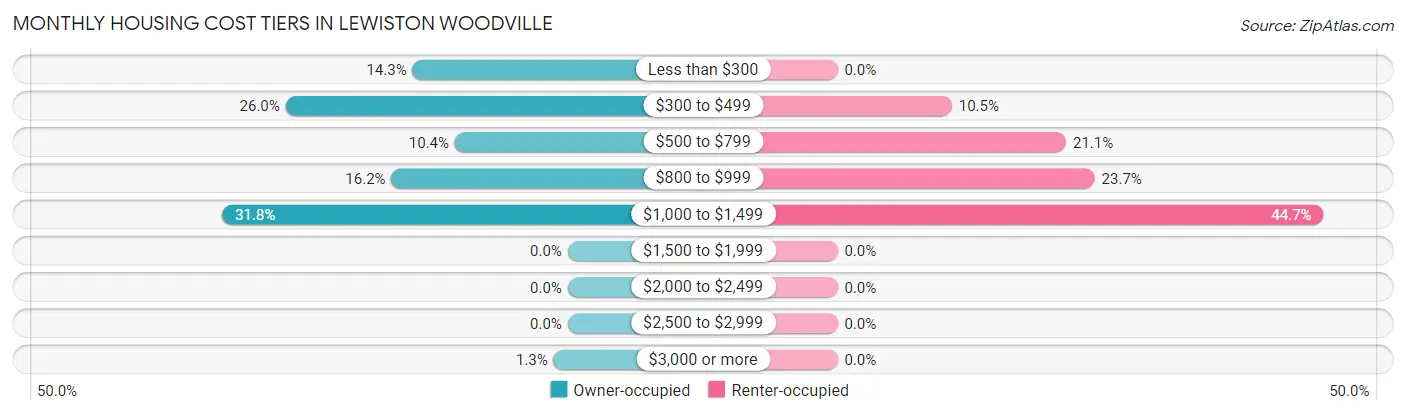
| Monthly Cost | Owner-occupied | Renter-occupied |
| Less than $300 | 22 (14.3%) | 0 (0.0%) |
| $300 to $499 | 40 (26.0%) | 4 (10.5%) |
| $500 to $799 | 16 (10.4%) | 8 (21.0%) |
| $800 to $999 | 25 (16.2%) | 9 (23.7%) |
| $1,000 to $1,499 | 49 (31.8%) | 17 (44.7%) |
| $1,500 to $1,999 | 0 (0.0%) | 0 (0.0%) |
| $2,000 to $2,499 | 0 (0.0%) | 0 (0.0%) |
| $2,500 to $2,999 | 0 (0.0%) | 0 (0.0%) |
| $3,000 or more | 2 (1.3%) | 0 (0.0%) |
| Total | 154 (100.0%) | 38 (100.0%) |
Physical Housing Characteristics in Lewiston Woodville
Housing Structures in Lewiston Woodville
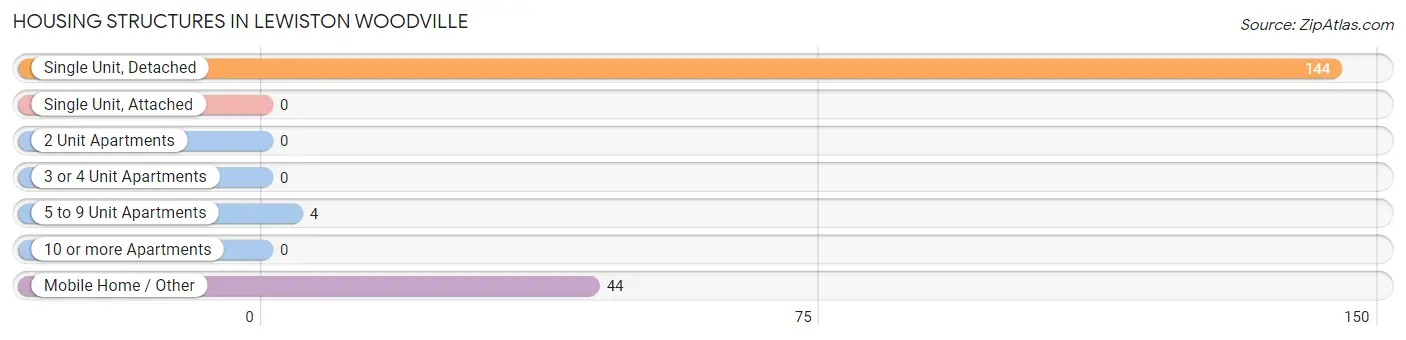
| Structure Type | # Housing Units | % Housing Units |
| Single Unit, Detached | 144 | 75.0% |
| Single Unit, Attached | 0 | 0.0% |
| 2 Unit Apartments | 0 | 0.0% |
| 3 or 4 Unit Apartments | 0 | 0.0% |
| 5 to 9 Unit Apartments | 4 | 2.1% |
| 10 or more Apartments | 0 | 0.0% |
| Mobile Home / Other | 44 | 22.9% |
| Total | 192 | 100.0% |
Housing Structures by Occupancy in Lewiston Woodville
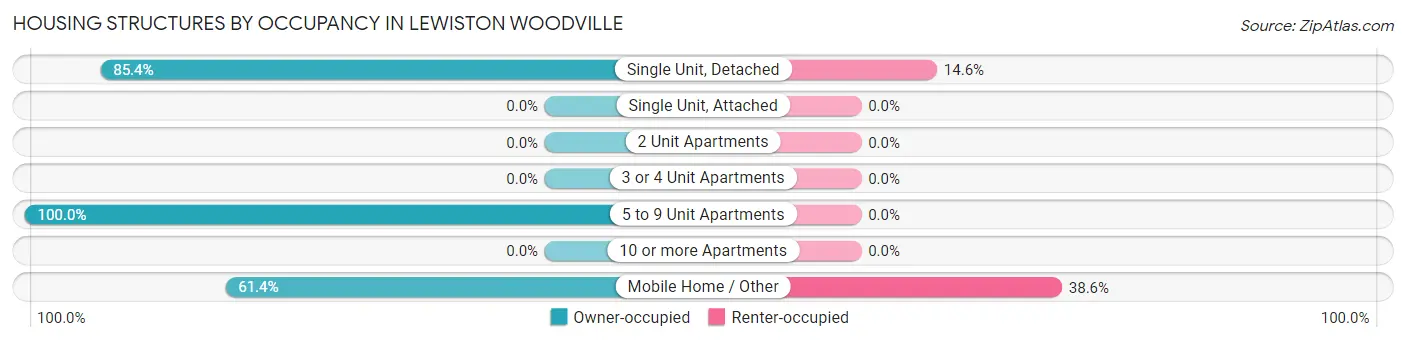
| Structure Type | Owner-occupied | Renter-occupied |
| Single Unit, Detached | 123 (85.4%) | 21 (14.6%) |
| Single Unit, Attached | 0 (0.0%) | 0 (0.0%) |
| 2 Unit Apartments | 0 (0.0%) | 0 (0.0%) |
| 3 or 4 Unit Apartments | 0 (0.0%) | 0 (0.0%) |
| 5 to 9 Unit Apartments | 4 (100.0%) | 0 (0.0%) |
| 10 or more Apartments | 0 (0.0%) | 0 (0.0%) |
| Mobile Home / Other | 27 (61.4%) | 17 (38.6%) |
| Total | 154 (80.2%) | 38 (19.8%) |
Housing Structures by Number of Rooms in Lewiston Woodville
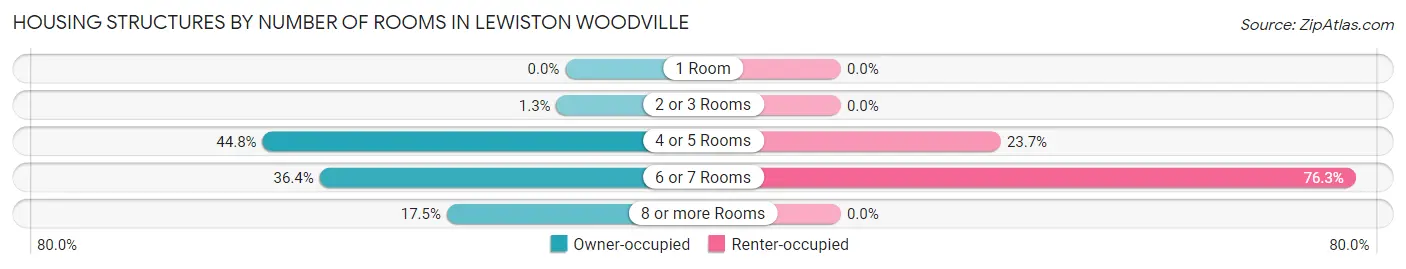
| Number of Rooms | Owner-occupied | Renter-occupied |
| 1 Room | 0 (0.0%) | 0 (0.0%) |
| 2 or 3 Rooms | 2 (1.3%) | 0 (0.0%) |
| 4 or 5 Rooms | 69 (44.8%) | 9 (23.7%) |
| 6 or 7 Rooms | 56 (36.4%) | 29 (76.3%) |
| 8 or more Rooms | 27 (17.5%) | 0 (0.0%) |
| Total | 154 (100.0%) | 38 (100.0%) |
Housing Structure by Heating Type in Lewiston Woodville
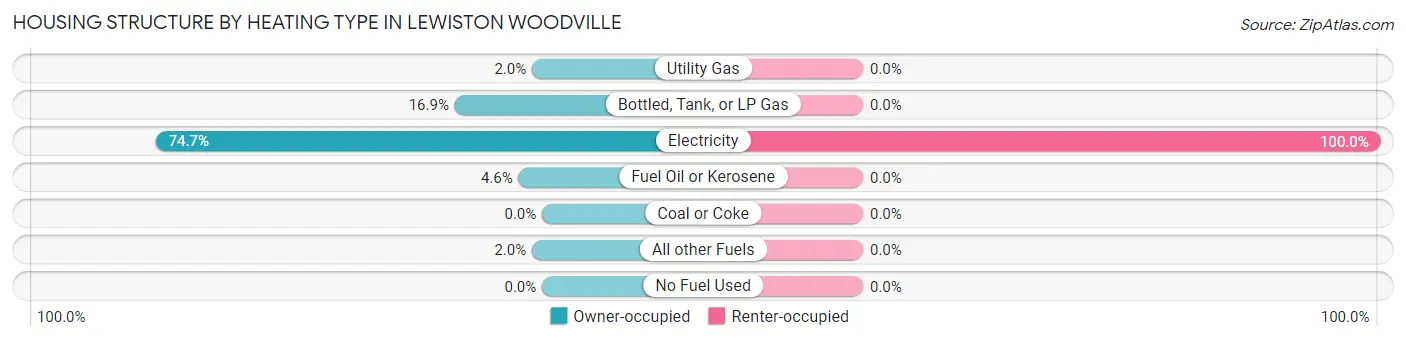
| Heating Type | Owner-occupied | Renter-occupied |
| Utility Gas | 3 (1.9%) | 0 (0.0%) |
| Bottled, Tank, or LP Gas | 26 (16.9%) | 0 (0.0%) |
| Electricity | 115 (74.7%) | 38 (100.0%) |
| Fuel Oil or Kerosene | 7 (4.5%) | 0 (0.0%) |
| Coal or Coke | 0 (0.0%) | 0 (0.0%) |
| All other Fuels | 3 (1.9%) | 0 (0.0%) |
| No Fuel Used | 0 (0.0%) | 0 (0.0%) |
| Total | 154 (100.0%) | 38 (100.0%) |
Household Vehicle Usage in Lewiston Woodville
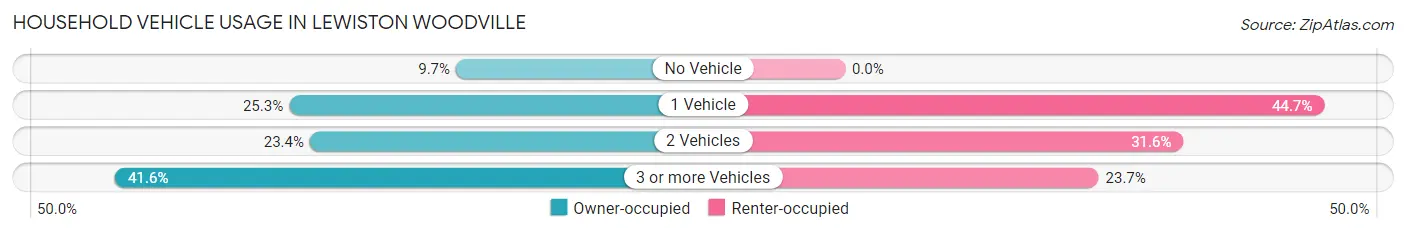
| Vehicles per Household | Owner-occupied | Renter-occupied |
| No Vehicle | 15 (9.7%) | 0 (0.0%) |
| 1 Vehicle | 39 (25.3%) | 17 (44.7%) |
| 2 Vehicles | 36 (23.4%) | 12 (31.6%) |
| 3 or more Vehicles | 64 (41.6%) | 9 (23.7%) |
| Total | 154 (100.0%) | 38 (100.0%) |
Real Estate & Mortgages in Lewiston Woodville
Real Estate and Mortgage Overview in Lewiston Woodville
| Characteristic | Without Mortgage | With Mortgage |
| Housing Units | 79 | 75 |
| Median Property Value | $49,300 | $127,800 |
| Median Household Income | - | - |
| Monthly Housing Costs | $434 | $2 |
| Real Estate Taxes | $717 | $0 |
Property Value by Mortgage Status in Lewiston Woodville
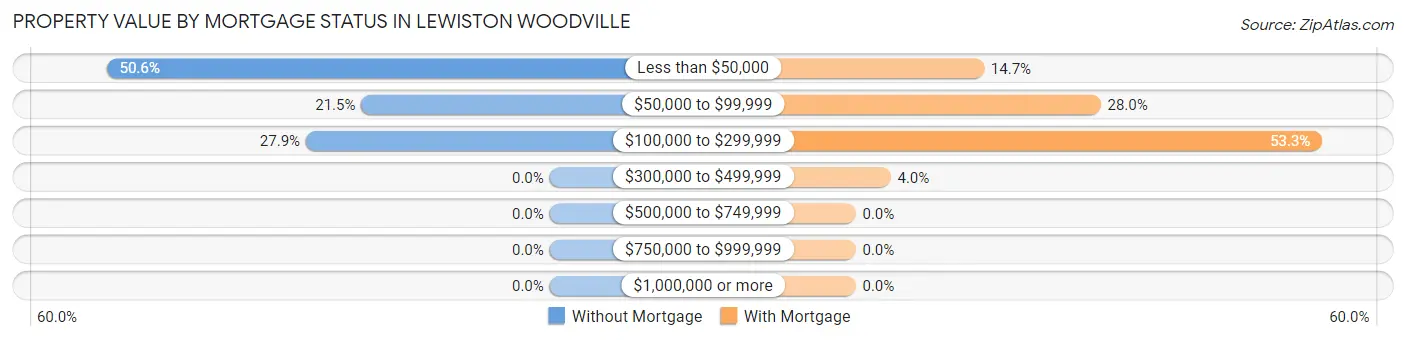
| Property Value | Without Mortgage | With Mortgage |
| Less than $50,000 | 40 (50.6%) | 11 (14.7%) |
| $50,000 to $99,999 | 17 (21.5%) | 21 (28.0%) |
| $100,000 to $299,999 | 22 (27.9%) | 40 (53.3%) |
| $300,000 to $499,999 | 0 (0.0%) | 3 (4.0%) |
| $500,000 to $749,999 | 0 (0.0%) | 0 (0.0%) |
| $750,000 to $999,999 | 0 (0.0%) | 0 (0.0%) |
| $1,000,000 or more | 0 (0.0%) | 0 (0.0%) |
| Total | 79 (100.0%) | 75 (100.0%) |
Household Income by Mortgage Status in Lewiston Woodville
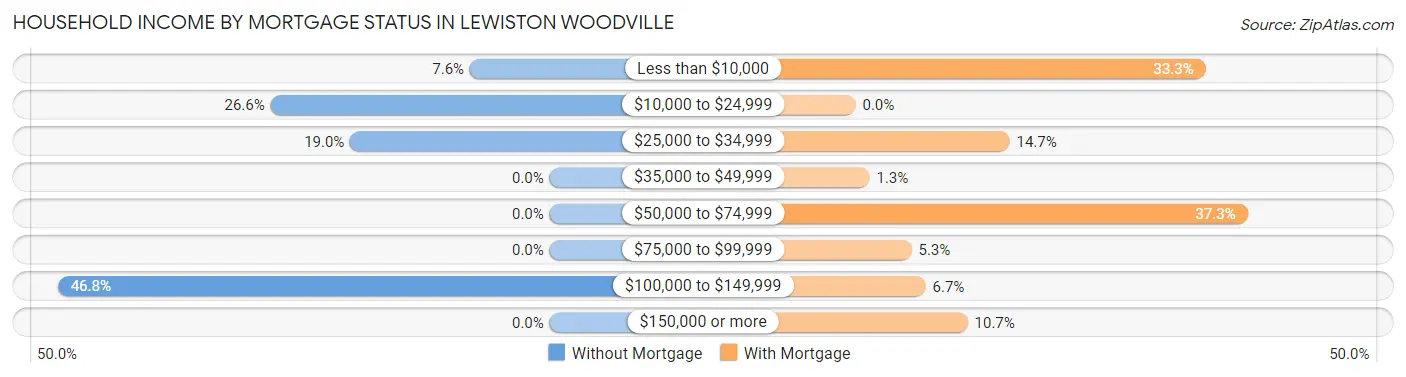
| Household Income | Without Mortgage | With Mortgage |
| Less than $10,000 | 6 (7.6%) | 25 (33.3%) |
| $10,000 to $24,999 | 21 (26.6%) | 0 (0.0%) |
| $25,000 to $34,999 | 15 (19.0%) | 11 (14.7%) |
| $35,000 to $49,999 | 0 (0.0%) | 1 (1.3%) |
| $50,000 to $74,999 | 0 (0.0%) | 28 (37.3%) |
| $75,000 to $99,999 | 0 (0.0%) | 4 (5.3%) |
| $100,000 to $149,999 | 37 (46.8%) | 5 (6.7%) |
| $150,000 or more | 0 (0.0%) | 8 (10.7%) |
| Total | 79 (100.0%) | 75 (100.0%) |
Property Value to Household Income Ratio in Lewiston Woodville
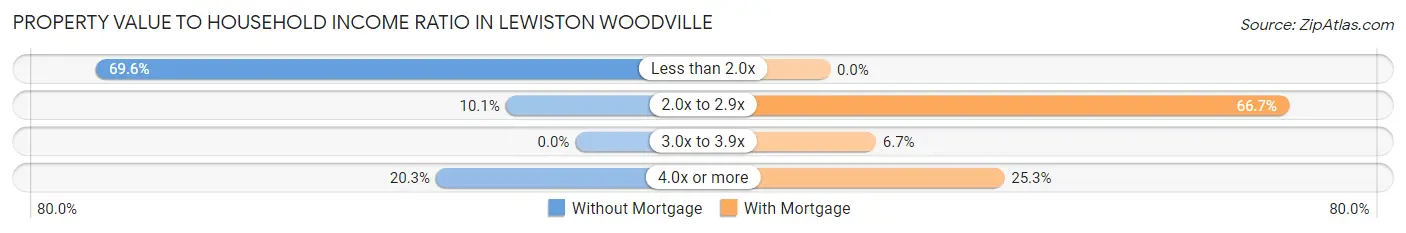
| Value-to-Income Ratio | Without Mortgage | With Mortgage |
| Less than 2.0x | 55 (69.6%) | 0 (0.0%) |
| 2.0x to 2.9x | 8 (10.1%) | 50 (66.7%) |
| 3.0x to 3.9x | 0 (0.0%) | 5 (6.7%) |
| 4.0x or more | 16 (20.3%) | 19 (25.3%) |
| Total | 79 (100.0%) | 75 (100.0%) |
Real Estate Taxes by Mortgage Status in Lewiston Woodville
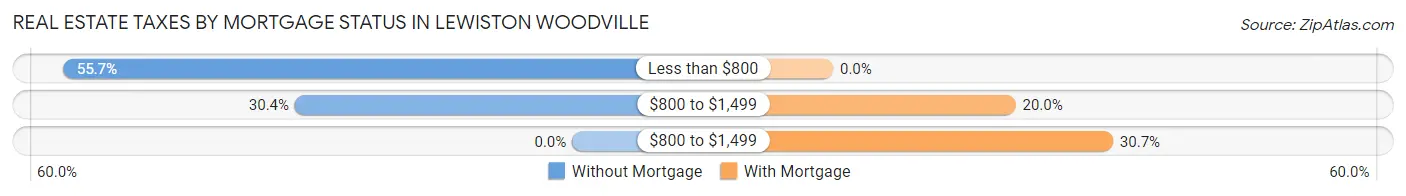
| Property Taxes | Without Mortgage | With Mortgage |
| Less than $800 | 44 (55.7%) | 0 (0.0%) |
| $800 to $1,499 | 24 (30.4%) | 15 (20.0%) |
| $800 to $1,499 | 0 (0.0%) | 23 (30.7%) |
| Total | 79 (100.0%) | 75 (100.0%) |
Health & Disability in Lewiston Woodville
Health Insurance Coverage by Age in Lewiston Woodville
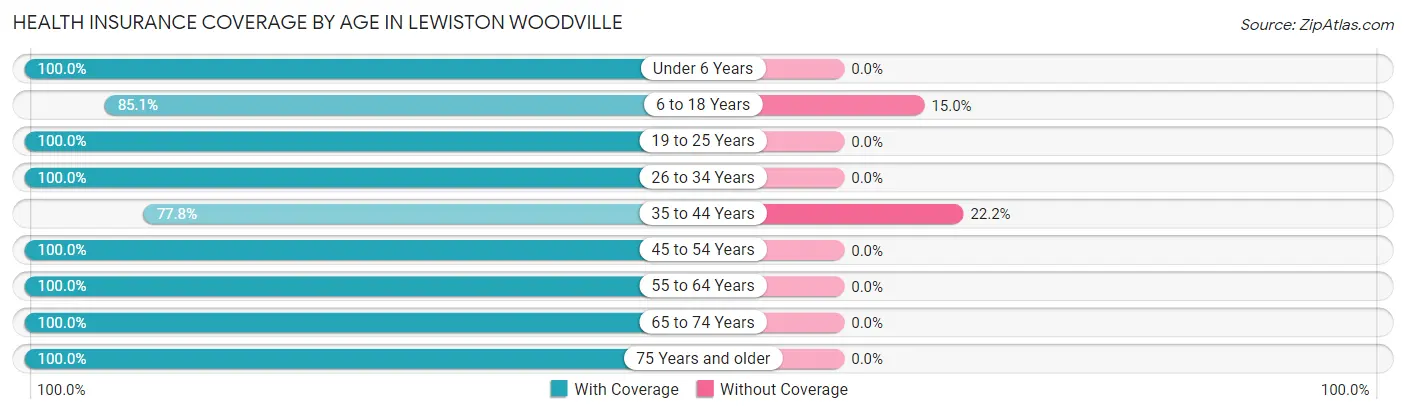
| Age Bracket | With Coverage | Without Coverage |
| Under 6 Years | 17 (100.0%) | 0 (0.0%) |
| 6 to 18 Years | 91 (85.1%) | 16 (14.9%) |
| 19 to 25 Years | 11 (100.0%) | 0 (0.0%) |
| 26 to 34 Years | 10 (100.0%) | 0 (0.0%) |
| 35 to 44 Years | 42 (77.8%) | 12 (22.2%) |
| 45 to 54 Years | 48 (100.0%) | 0 (0.0%) |
| 55 to 64 Years | 78 (100.0%) | 0 (0.0%) |
| 65 to 74 Years | 47 (100.0%) | 0 (0.0%) |
| 75 Years and older | 86 (100.0%) | 0 (0.0%) |
| Total | 430 (93.9%) | 28 (6.1%) |
Health Insurance Coverage by Citizenship Status in Lewiston Woodville
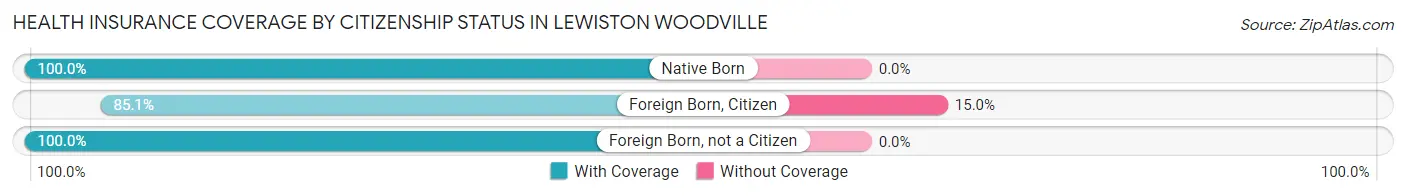
| Citizenship Status | With Coverage | Without Coverage |
| Native Born | 17 (100.0%) | 0 (0.0%) |
| Foreign Born, Citizen | 91 (85.1%) | 16 (14.9%) |
| Foreign Born, not a Citizen | 11 (100.0%) | 0 (0.0%) |
Health Insurance Coverage by Household Income in Lewiston Woodville
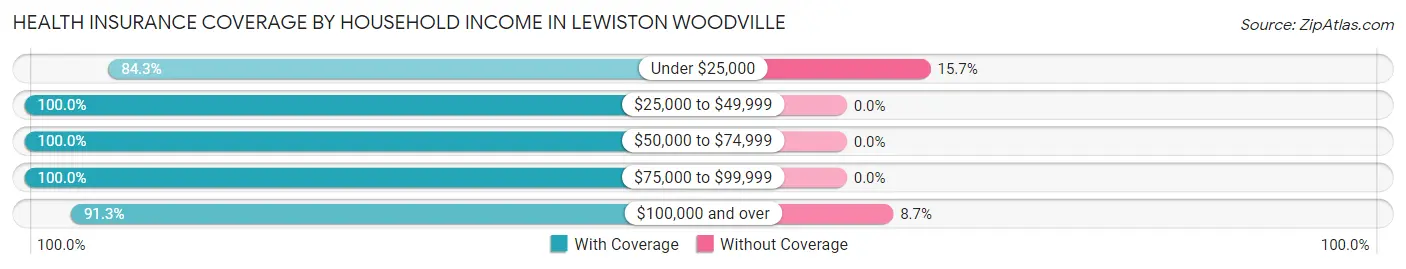
| Household Income | With Coverage | Without Coverage |
| Under $25,000 | 86 (84.3%) | 16 (15.7%) |
| $25,000 to $49,999 | 132 (100.0%) | 0 (0.0%) |
| $50,000 to $74,999 | 67 (100.0%) | 0 (0.0%) |
| $75,000 to $99,999 | 19 (100.0%) | 0 (0.0%) |
| $100,000 and over | 126 (91.3%) | 12 (8.7%) |
Public vs Private Health Insurance Coverage by Age in Lewiston Woodville
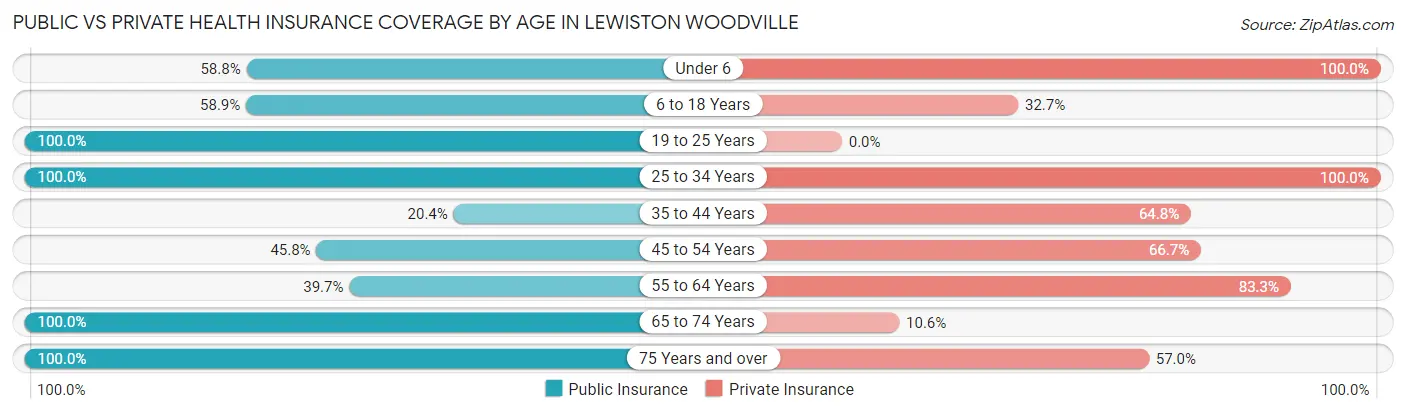
| Age Bracket | Public Insurance | Private Insurance |
| Under 6 | 10 (58.8%) | 17 (100.0%) |
| 6 to 18 Years | 63 (58.9%) | 35 (32.7%) |
| 19 to 25 Years | 11 (100.0%) | 0 (0.0%) |
| 25 to 34 Years | 10 (100.0%) | 10 (100.0%) |
| 35 to 44 Years | 11 (20.4%) | 35 (64.8%) |
| 45 to 54 Years | 22 (45.8%) | 32 (66.7%) |
| 55 to 64 Years | 31 (39.7%) | 65 (83.3%) |
| 65 to 74 Years | 47 (100.0%) | 5 (10.6%) |
| 75 Years and over | 86 (100.0%) | 49 (57.0%) |
| Total | 291 (63.5%) | 248 (54.1%) |
Disability Status by Sex by Age in Lewiston Woodville
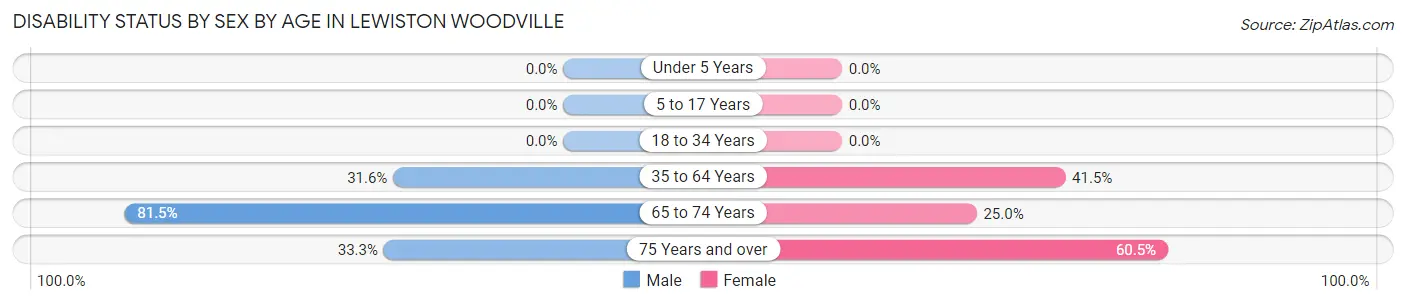
| Age Bracket | Male | Female |
| Under 5 Years | 0 (0.0%) | 0 (0.0%) |
| 5 to 17 Years | 0 (0.0%) | 0 (0.0%) |
| 18 to 34 Years | 0 (0.0%) | 0 (0.0%) |
| 35 to 64 Years | 18 (31.6%) | 51 (41.5%) |
| 65 to 74 Years | 22 (81.5%) | 5 (25.0%) |
| 75 Years and over | 16 (33.3%) | 23 (60.5%) |
Disability Class by Sex by Age in Lewiston Woodville
Disability Class: Hearing Difficulty
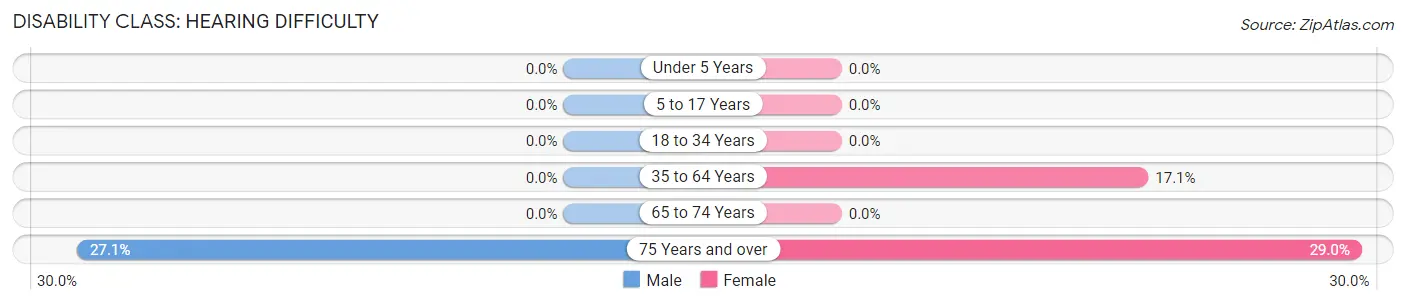
| Age Bracket | Male | Female |
| Under 5 Years | 0 (0.0%) | 0 (0.0%) |
| 5 to 17 Years | 0 (0.0%) | 0 (0.0%) |
| 18 to 34 Years | 0 (0.0%) | 0 (0.0%) |
| 35 to 64 Years | 0 (0.0%) | 21 (17.1%) |
| 65 to 74 Years | 0 (0.0%) | 0 (0.0%) |
| 75 Years and over | 13 (27.1%) | 11 (28.9%) |
Disability Class: Vision Difficulty
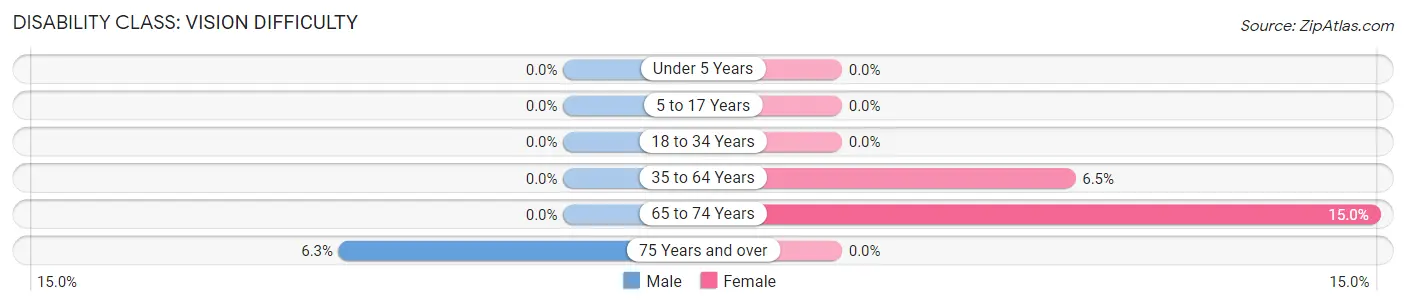
| Age Bracket | Male | Female |
| Under 5 Years | 0 (0.0%) | 0 (0.0%) |
| 5 to 17 Years | 0 (0.0%) | 0 (0.0%) |
| 18 to 34 Years | 0 (0.0%) | 0 (0.0%) |
| 35 to 64 Years | 0 (0.0%) | 8 (6.5%) |
| 65 to 74 Years | 0 (0.0%) | 3 (15.0%) |
| 75 Years and over | 3 (6.2%) | 0 (0.0%) |
Disability Class: Cognitive Difficulty
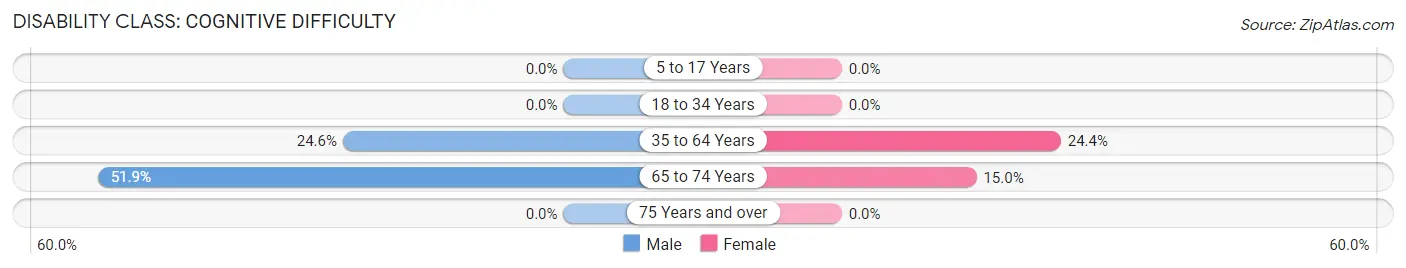
| Age Bracket | Male | Female |
| 5 to 17 Years | 0 (0.0%) | 0 (0.0%) |
| 18 to 34 Years | 0 (0.0%) | 0 (0.0%) |
| 35 to 64 Years | 14 (24.6%) | 30 (24.4%) |
| 65 to 74 Years | 14 (51.8%) | 3 (15.0%) |
| 75 Years and over | 0 (0.0%) | 0 (0.0%) |
Disability Class: Ambulatory Difficulty
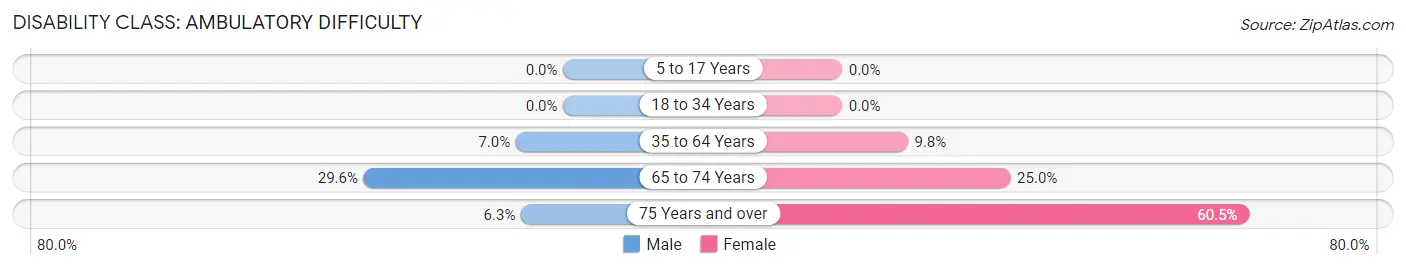
| Age Bracket | Male | Female |
| 5 to 17 Years | 0 (0.0%) | 0 (0.0%) |
| 18 to 34 Years | 0 (0.0%) | 0 (0.0%) |
| 35 to 64 Years | 4 (7.0%) | 12 (9.8%) |
| 65 to 74 Years | 8 (29.6%) | 5 (25.0%) |
| 75 Years and over | 3 (6.2%) | 23 (60.5%) |
Disability Class: Self-Care Difficulty
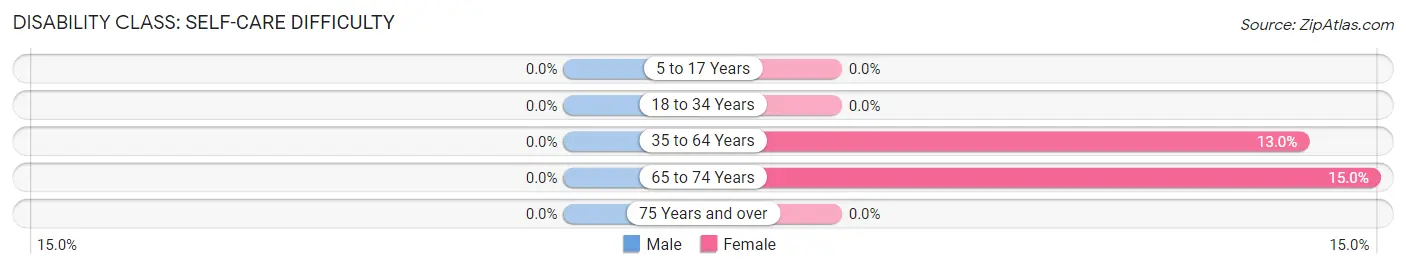
| Age Bracket | Male | Female |
| 5 to 17 Years | 0 (0.0%) | 0 (0.0%) |
| 18 to 34 Years | 0 (0.0%) | 0 (0.0%) |
| 35 to 64 Years | 0 (0.0%) | 16 (13.0%) |
| 65 to 74 Years | 0 (0.0%) | 3 (15.0%) |
| 75 Years and over | 0 (0.0%) | 0 (0.0%) |
Technology Access in Lewiston Woodville
Computing Device Access in Lewiston Woodville
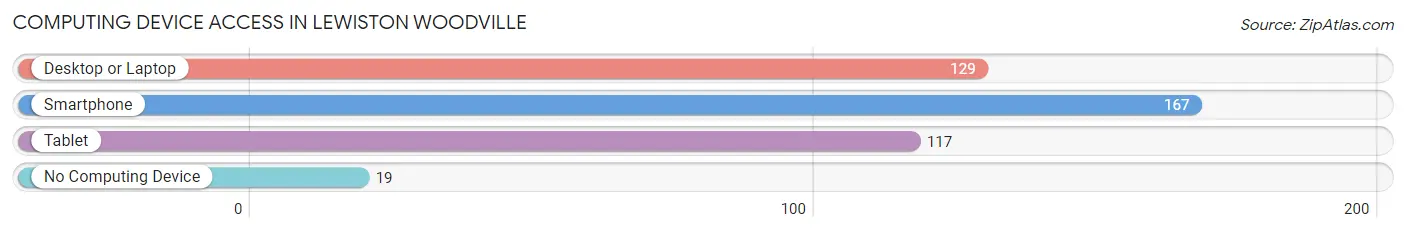
| Device Type | # Households | % Households |
| Desktop or Laptop | 129 | 67.2% |
| Smartphone | 167 | 87.0% |
| Tablet | 117 | 60.9% |
| No Computing Device | 19 | 9.9% |
| Total | 192 | 100.0% |
Internet Access in Lewiston Woodville
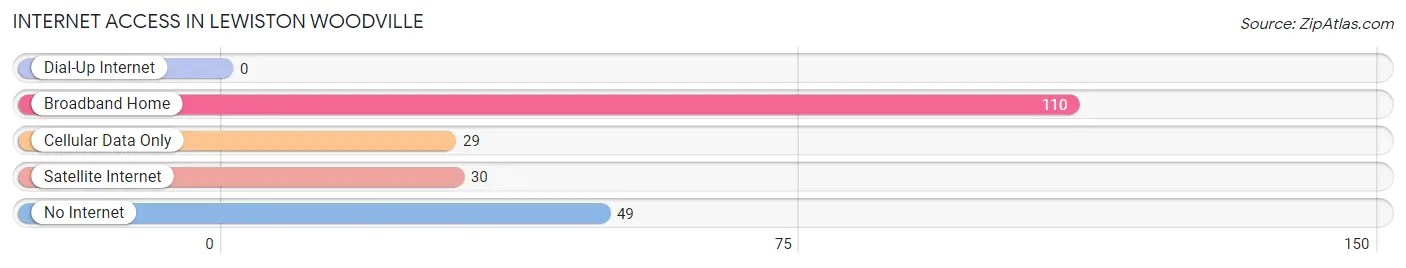
| Internet Type | # Households | % Households |
| Dial-Up Internet | 0 | 0.0% |
| Broadband Home | 110 | 57.3% |
| Cellular Data Only | 29 | 15.1% |
| Satellite Internet | 30 | 15.6% |
| No Internet | 49 | 25.5% |
| Total | 192 | 100.0% |
Lewiston Woodville Summary
Lewiston Woodville is a small town located in Bertie County, North Carolina. It is situated on the banks of the Cashie River, and is part of the Roanoke-Chowan region. The town has a population of approximately 1,000 people, and is the county seat of Bertie County.
Geography
Lewiston Woodville is located in the northeastern corner of North Carolina, in the Roanoke-Chowan region. It is situated on the banks of the Cashie River, and is surrounded by the towns of Windsor, Colerain, and Powellsville. The town is located approximately 30 miles from the Atlantic Ocean, and is part of the Albemarle Sound watershed. The town is located in a rural area, and is surrounded by farmland and forests.
History
The town of Lewiston Woodville was founded in 1790, and was named after two prominent families in the area, the Lewises and the Woods. The town was originally a trading post, and was a popular stop for travelers and traders. In 1809, the town was officially incorporated, and the first post office was established in 1810. The town was an important stop on the stagecoach route between Norfolk and Raleigh.
In the late 19th century, the town began to grow and develop. The railroad was extended to Lewiston Woodville in 1883, and the town became a major shipping center for the region. The town also became a popular tourist destination, and several hotels and resorts were built in the area.
Economy
The economy of Lewiston Woodville is largely based on agriculture and tourism. The town is home to several farms, and the surrounding area is known for its production of tobacco, cotton, and soybeans. The town is also home to several small businesses, including restaurants, shops, and other services.
Tourism is an important part of the local economy, and the town is home to several popular attractions, including the Cashie River Museum, the Cashie River Nature Center, and the Cashie River Wildlife Refuge. The town is also home to several festivals and events, including the Cashie River Festival and the Lewiston Woodville Music Festival.
Demographics
As of the 2010 census, the population of Lewiston Woodville was 1,000 people. The racial makeup of the town was 79.2% White, 17.2% African American, 0.7% Native American, 0.3% Asian, and 2.6% from other races. The median household income was $30,000, and the median age was 39.
Conclusion
Lewiston Woodville is a small town located in Bertie County, North Carolina. It is situated on the banks of the Cashie River, and is part of the Roanoke-Chowan region. The town has a population of approximately 1,000 people, and is the county seat of Bertie County. The economy of Lewiston Woodville is largely based on agriculture and tourism, and the town is home to several popular attractions. The population of the town is mostly White, with a small percentage of African Americans, Native Americans, and other races.
Common Questions
What is Per Capita Income in Lewiston Woodville?
Per Capita income in Lewiston Woodville is $33,724.
What is the Median Household income in Lewiston Woodville?
Median Household Income in Lewiston Woodville is $41,944.
What is Inequality or Gini Index in Lewiston Woodville?
Inequality or Gini Index in Lewiston Woodville is 0.54.
What is the Total Population of Lewiston Woodville?
Total Population of Lewiston Woodville is 458.
What is the Total Male Population of Lewiston Woodville?
Total Male Population of Lewiston Woodville is 168.
What is the Total Female Population of Lewiston Woodville?
Total Female Population of Lewiston Woodville is 290.
What is the Ratio of Males per 100 Females in Lewiston Woodville?
There are 57.93 Males per 100 Females in Lewiston Woodville.
What is the Ratio of Females per 100 Males in Lewiston Woodville?
There are 172.62 Females per 100 Males in Lewiston Woodville.
What is the Median Population Age in Lewiston Woodville?
Median Population Age in Lewiston Woodville is 52.0 Years.
What is the Average Family Size in Lewiston Woodville
Average Family Size in Lewiston Woodville is 2.8 People.
What is the Average Household Size in Lewiston Woodville
Average Household Size in Lewiston Woodville is 2.4 People.
How Large is the Labor Force in Lewiston Woodville?
There are 169 People in the Labor Forcein in Lewiston Woodville.
What is the Percentage of People in the Labor Force in Lewiston Woodville?
45.3% of People are in the Labor Force in Lewiston Woodville.
What is the Unemployment Rate in Lewiston Woodville?
Unemployment Rate in Lewiston Woodville is 9.5%.