Zip Codes with the Highest Percentage of Population Employed in Architecture & Engineering in Hendersonville, NC
RELATED REPORTS & OPTIONS
Architecture & Engineering
Hendersonville
Compare Zip Codes
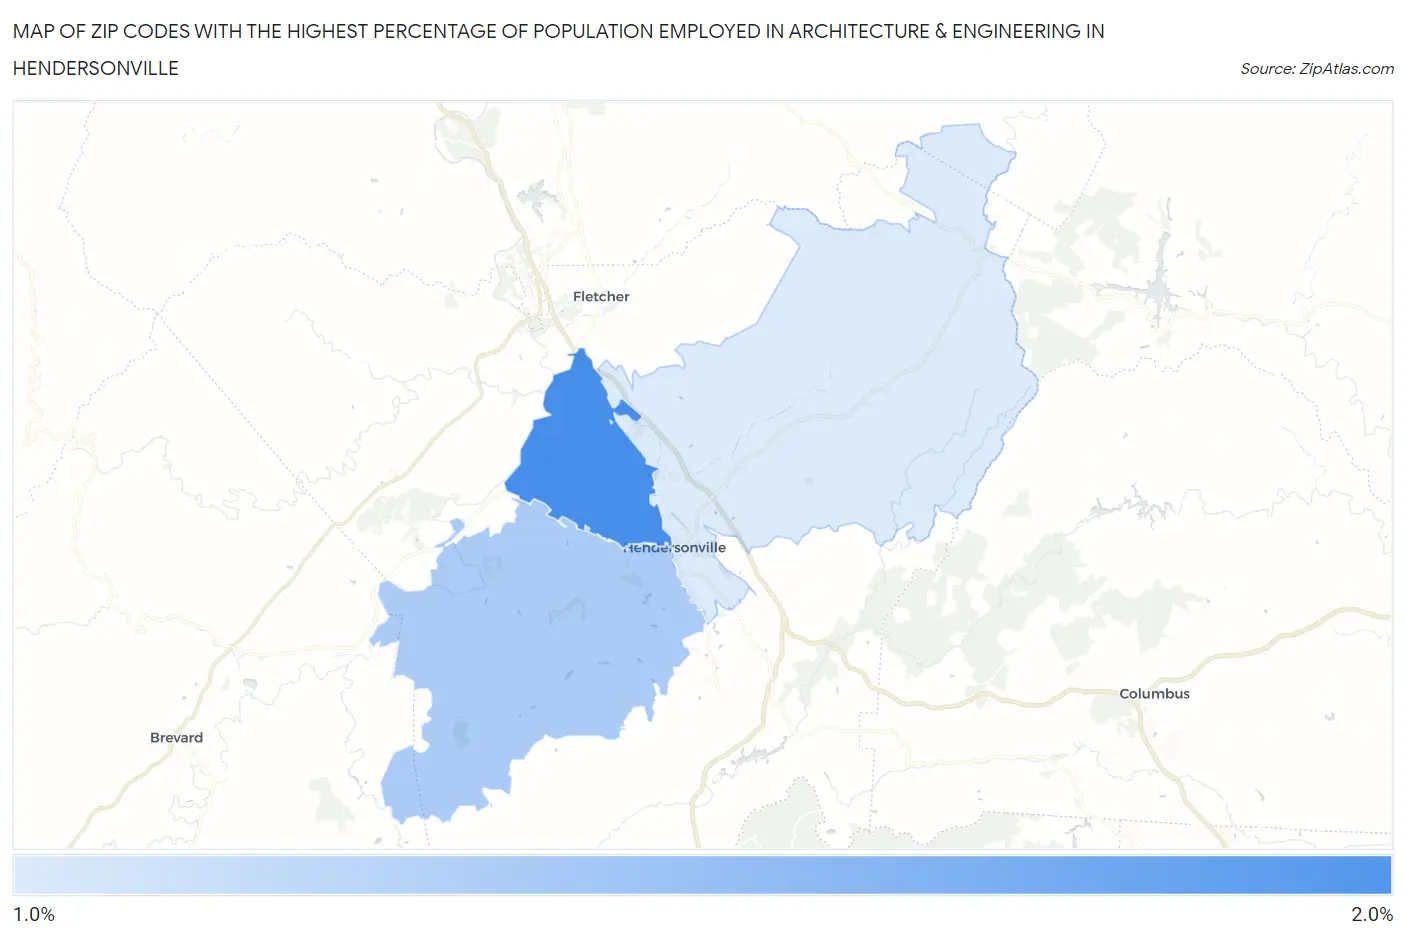
Map of Zip Codes with the Highest Percentage of Population Employed in Architecture & Engineering in Hendersonville
1.2%
1.8%
Zip Codes with the Highest Percentage of Population Employed in Architecture & Engineering in Hendersonville, NC
| Zip Code | % Employed | vs State | vs National | |
| 1. | 28791 | 1.8% | 1.9%(-0.114)#246 | 2.1%(-0.374)#10,976 |
| 2. | 28739 | 1.4% | 1.9%(-0.527)#340 | 2.1%(-0.788)#13,864 |
| 3. | 28792 | 1.2% | 1.9%(-0.734)#390 | 2.1%(-0.994)#15,439 |
1
Common Questions
What are the Top Zip Codes with the Highest Percentage of Population Employed in Architecture & Engineering in Hendersonville, NC?
Top Zip Codes with the Highest Percentage of Population Employed in Architecture & Engineering in Hendersonville, NC are:
What zip code has the Highest Percentage of Population Employed in Architecture & Engineering in Hendersonville, NC?
28791 has the Highest Percentage of Population Employed in Architecture & Engineering in Hendersonville, NC with 1.8%.
What is the Percentage of Population Employed in Architecture & Engineering in Hendersonville, NC?
Percentage of Population Employed in Architecture & Engineering in Hendersonville is 0.87%.
What is the Percentage of Population Employed in Architecture & Engineering in North Carolina?
Percentage of Population Employed in Architecture & Engineering in North Carolina is 1.9%.
What is the Percentage of Population Employed in Architecture & Engineering in the United States?
Percentage of Population Employed in Architecture & Engineering in the United States is 2.1%.