Zip Codes with the Highest Percentage of Population Employed in Architecture & Engineering in Lexington, NC
RELATED REPORTS & OPTIONS
Architecture & Engineering
Lexington
Compare Zip Codes
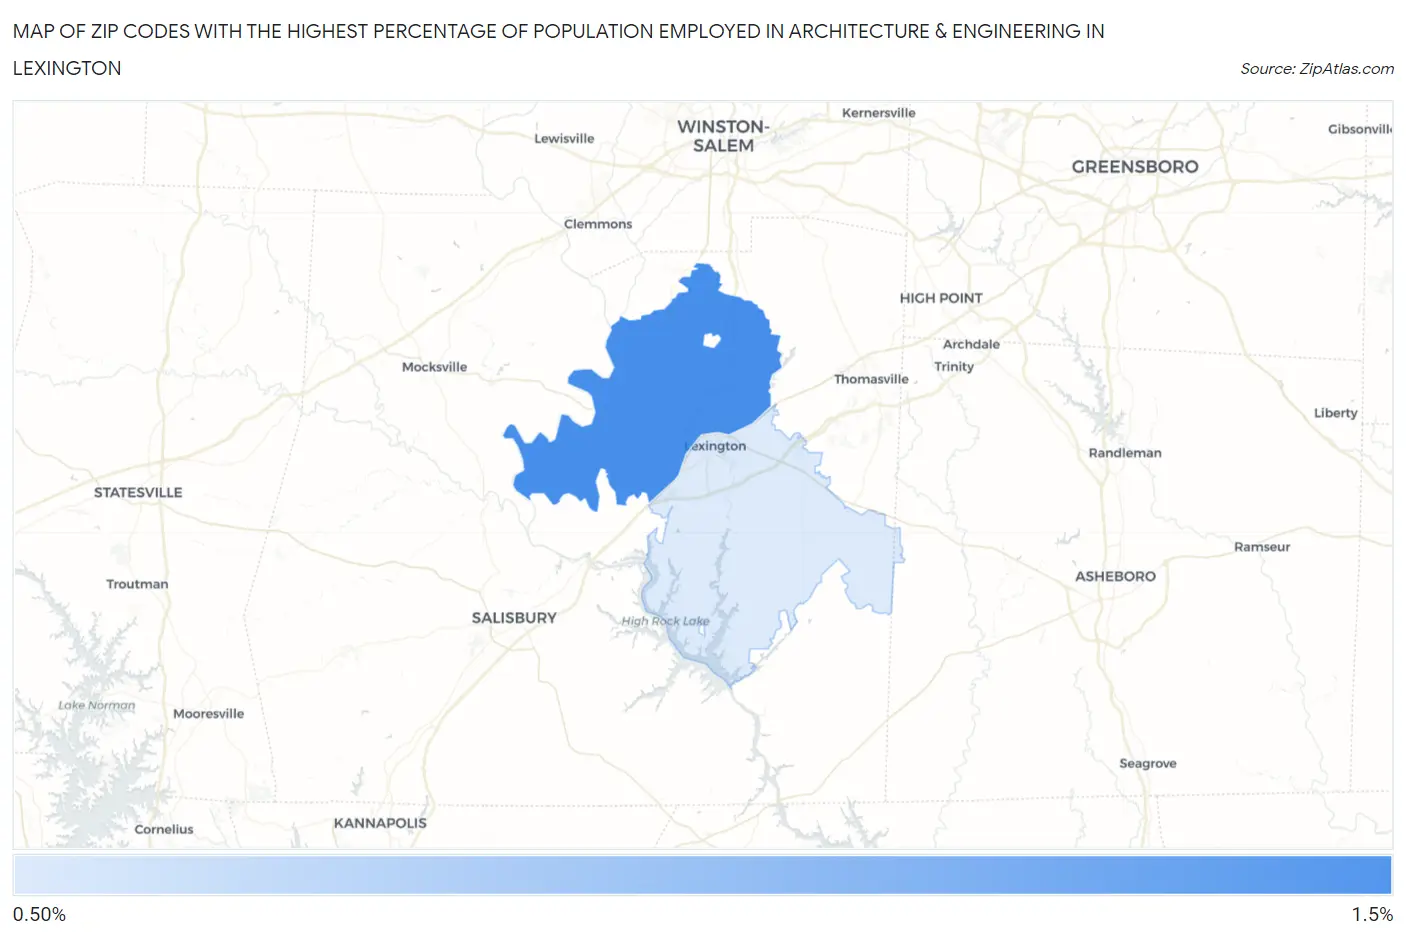
Map of Zip Codes with the Highest Percentage of Population Employed in Architecture & Engineering in Lexington
1.4%
1.4%
Zip Codes with the Highest Percentage of Population Employed in Architecture & Engineering in Lexington, NC
| Zip Code | % Employed | vs State | vs National | |
| 1. | 27295 | 1.4% | 1.9%(-0.469)#330 | 2.1%(-0.729)#13,438 |
| 2. | 27292 | 1.4% | 1.9%(-0.473)#333 | 2.1%(-0.734)#13,469 |
1
Common Questions
What are the Top Zip Codes with the Highest Percentage of Population Employed in Architecture & Engineering in Lexington, NC?
Top Zip Codes with the Highest Percentage of Population Employed in Architecture & Engineering in Lexington, NC are:
What zip code has the Highest Percentage of Population Employed in Architecture & Engineering in Lexington, NC?
27295 has the Highest Percentage of Population Employed in Architecture & Engineering in Lexington, NC with 1.4%.
What is the Percentage of Population Employed in Architecture & Engineering in Lexington, NC?
Percentage of Population Employed in Architecture & Engineering in Lexington is 0.25%.
What is the Percentage of Population Employed in Architecture & Engineering in North Carolina?
Percentage of Population Employed in Architecture & Engineering in North Carolina is 1.9%.
What is the Percentage of Population Employed in Architecture & Engineering in the United States?
Percentage of Population Employed in Architecture & Engineering in the United States is 2.1%.