Zip Codes with the Highest Percentage of Population Employed in Food Preparation & Serving in Hendersonville, NC
RELATED REPORTS & OPTIONS
Food Preparation & Serving
Hendersonville
Compare Zip Codes
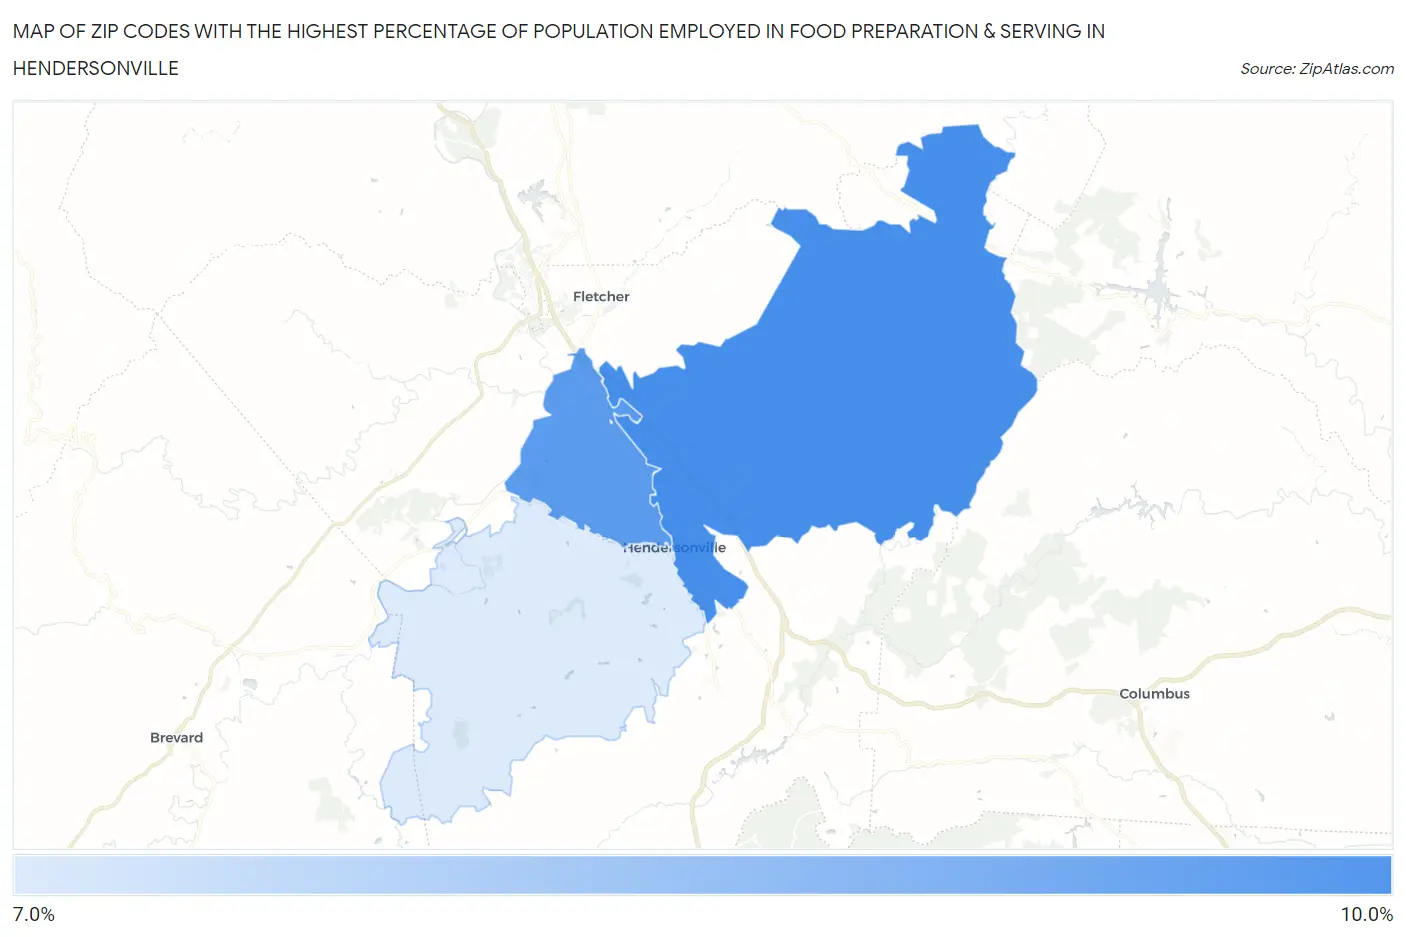
Map of Zip Codes with the Highest Percentage of Population Employed in Food Preparation & Serving in Hendersonville
7.1%
8.5%
Zip Codes with the Highest Percentage of Population Employed in Food Preparation & Serving in Hendersonville, NC
| Zip Code | % Employed | vs State | vs National | |
| 1. | 28792 | 8.5% | 5.3%(+3.25)#113 | 5.3%(+3.25)#4,033 |
| 2. | 28791 | 8.4% | 5.3%(+3.06)#117 | 5.3%(+3.06)#4,240 |
| 3. | 28739 | 7.1% | 5.3%(+1.85)#161 | 5.3%(+1.85)#6,266 |
1
Common Questions
What are the Top Zip Codes with the Highest Percentage of Population Employed in Food Preparation & Serving in Hendersonville, NC?
Top Zip Codes with the Highest Percentage of Population Employed in Food Preparation & Serving in Hendersonville, NC are:
What zip code has the Highest Percentage of Population Employed in Food Preparation & Serving in Hendersonville, NC?
28792 has the Highest Percentage of Population Employed in Food Preparation & Serving in Hendersonville, NC with 8.5%.
What is the Percentage of Population Employed in Food Preparation & Serving in Hendersonville, NC?
Percentage of Population Employed in Food Preparation & Serving in Hendersonville is 11.2%.
What is the Percentage of Population Employed in Food Preparation & Serving in North Carolina?
Percentage of Population Employed in Food Preparation & Serving in North Carolina is 5.3%.
What is the Percentage of Population Employed in Food Preparation & Serving in the United States?
Percentage of Population Employed in Food Preparation & Serving in the United States is 5.3%.