Zip Codes with the Highest Percentage of Population Employed in Architecture & Engineering in Waynesville, NC
RELATED REPORTS & OPTIONS
Architecture & Engineering
Waynesville
Compare Zip Codes
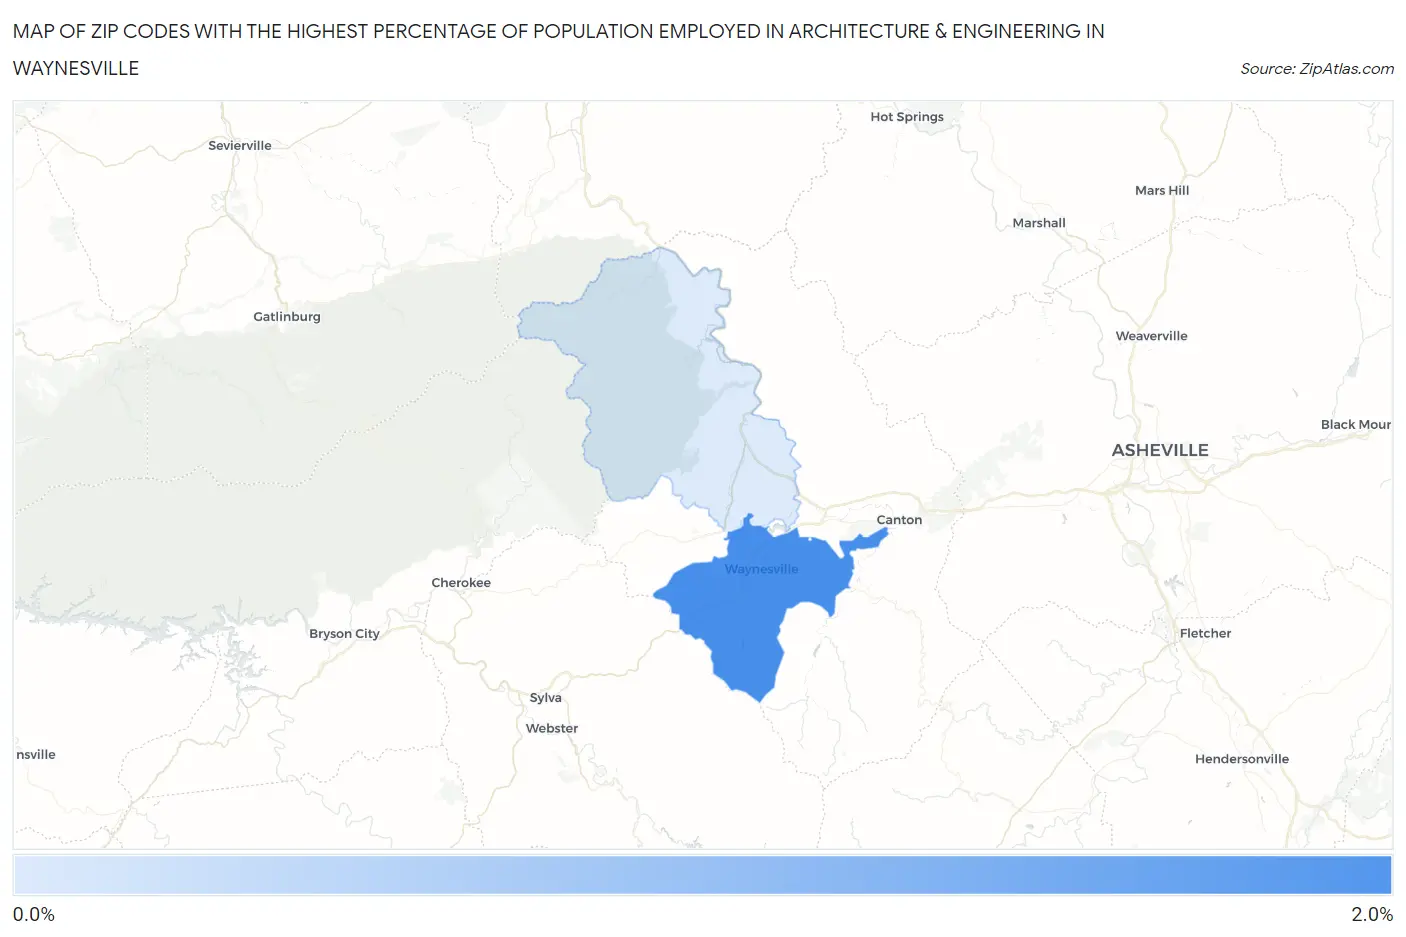
Map of Zip Codes with the Highest Percentage of Population Employed in Architecture & Engineering in Waynesville
0.37%
1.9%
Zip Codes with the Highest Percentage of Population Employed in Architecture & Engineering in Waynesville, NC
| Zip Code | % Employed | vs State | vs National | |
| 1. | 28786 | 1.9% | 1.9%(+0.049)#217 | 2.1%(-0.212)#9,998 |
| 2. | 28785 | 0.37% | 1.9%(-1.52)#556 | 2.1%(-1.78)#21,150 |
1
Common Questions
What are the Top Zip Codes with the Highest Percentage of Population Employed in Architecture & Engineering in Waynesville, NC?
Top Zip Codes with the Highest Percentage of Population Employed in Architecture & Engineering in Waynesville, NC are:
What zip code has the Highest Percentage of Population Employed in Architecture & Engineering in Waynesville, NC?
28786 has the Highest Percentage of Population Employed in Architecture & Engineering in Waynesville, NC with 1.9%.
What is the Percentage of Population Employed in Architecture & Engineering in Waynesville, NC?
Percentage of Population Employed in Architecture & Engineering in Waynesville is 1.8%.
What is the Percentage of Population Employed in Architecture & Engineering in North Carolina?
Percentage of Population Employed in Architecture & Engineering in North Carolina is 1.9%.
What is the Percentage of Population Employed in Architecture & Engineering in the United States?
Percentage of Population Employed in Architecture & Engineering in the United States is 2.1%.