Zip Codes with the Highest Percentage of Population with a Degree in Liberal Arts and History in Hendersonville, NC
RELATED REPORTS & OPTIONS
Liberal Arts and History
Hendersonville
Compare Zip Codes
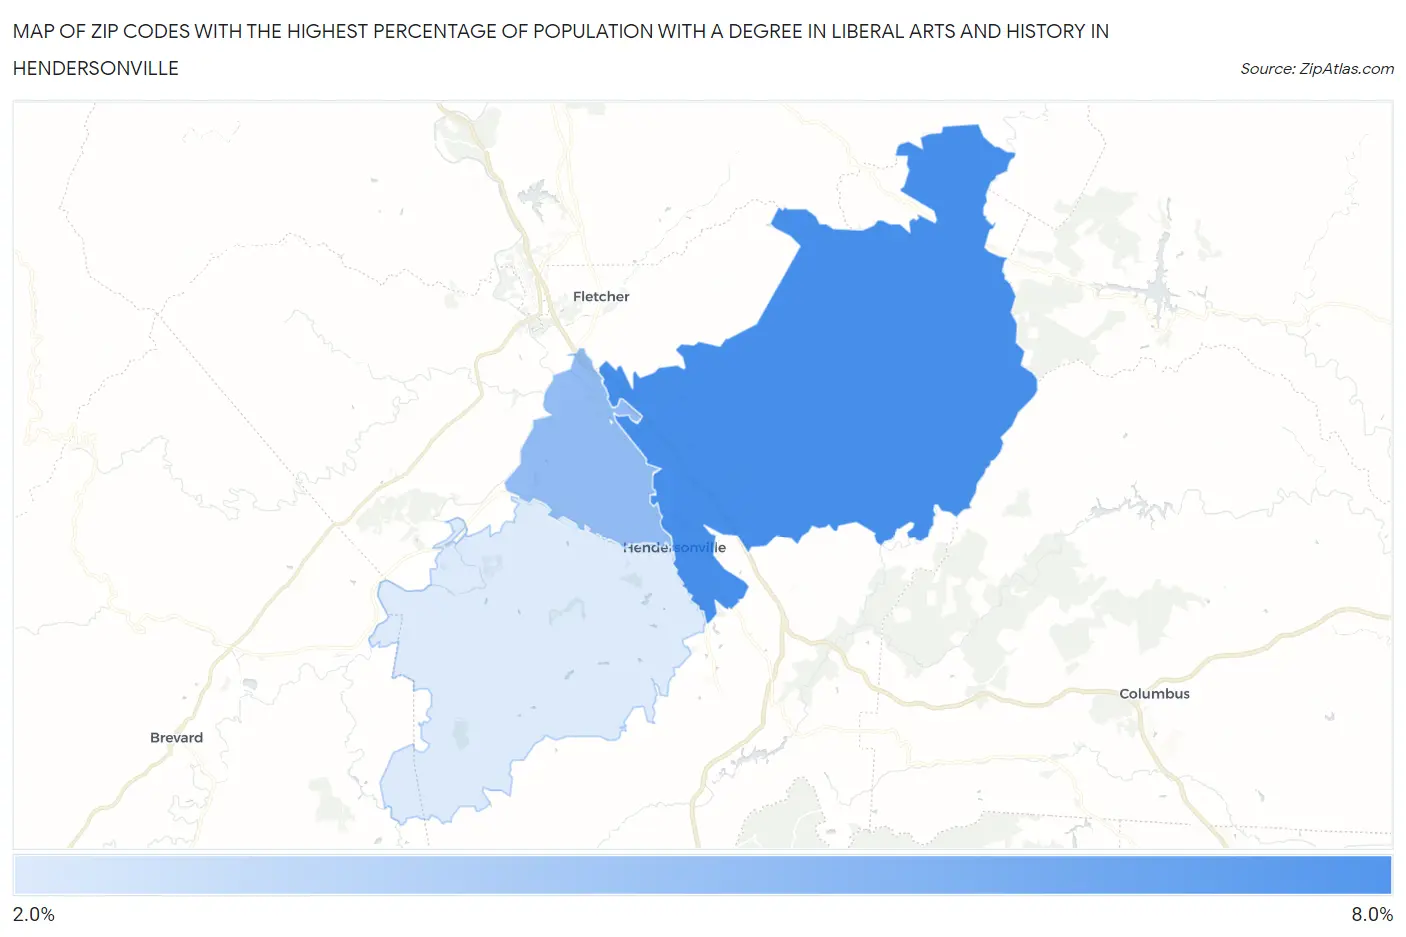
Map of Zip Codes with the Highest Percentage of Population with a Degree in Liberal Arts and History in Hendersonville
2.9%
7.0%
Zip Codes with the Highest Percentage of Population with a Degree in Liberal Arts and History in Hendersonville, NC
| Zip Code | % Graduates | vs State | vs National | |
| 1. | 28792 | 7.0% | 4.9%(+2.09)#170 | 4.9%(+2.11)#6,410 |
| 2. | 28791 | 4.9% | 4.9%(+0.035)#342 | 4.9%(+0.063)#11,539 |
| 3. | 28739 | 2.9% | 4.9%(-2.04)#532 | 4.9%(-2.01)#18,793 |
1
Common Questions
What are the Top Zip Codes with the Highest Percentage of Population with a Degree in Liberal Arts and History in Hendersonville, NC?
Top Zip Codes with the Highest Percentage of Population with a Degree in Liberal Arts and History in Hendersonville, NC are:
What zip code has the Highest Percentage of Population with a Degree in Liberal Arts and History in Hendersonville, NC?
28792 has the Highest Percentage of Population with a Degree in Liberal Arts and History in Hendersonville, NC with 7.0%.
What is the Percentage of Population with a Degree in Liberal Arts and History in Hendersonville, NC?
Percentage of Population with a Degree in Liberal Arts and History in Hendersonville is 5.0%.
What is the Percentage of Population with a Degree in Liberal Arts and History in North Carolina?
Percentage of Population with a Degree in Liberal Arts and History in North Carolina is 4.9%.
What is the Percentage of Population with a Degree in Liberal Arts and History in the United States?
Percentage of Population with a Degree in Liberal Arts and History in the United States is 4.9%.