Zip Codes with the Highest Percentage of Population Employed in Administrative & Support Services in Hendersonville, NC
RELATED REPORTS & OPTIONS
Administrative & Support Services
Hendersonville
Compare Zip Codes
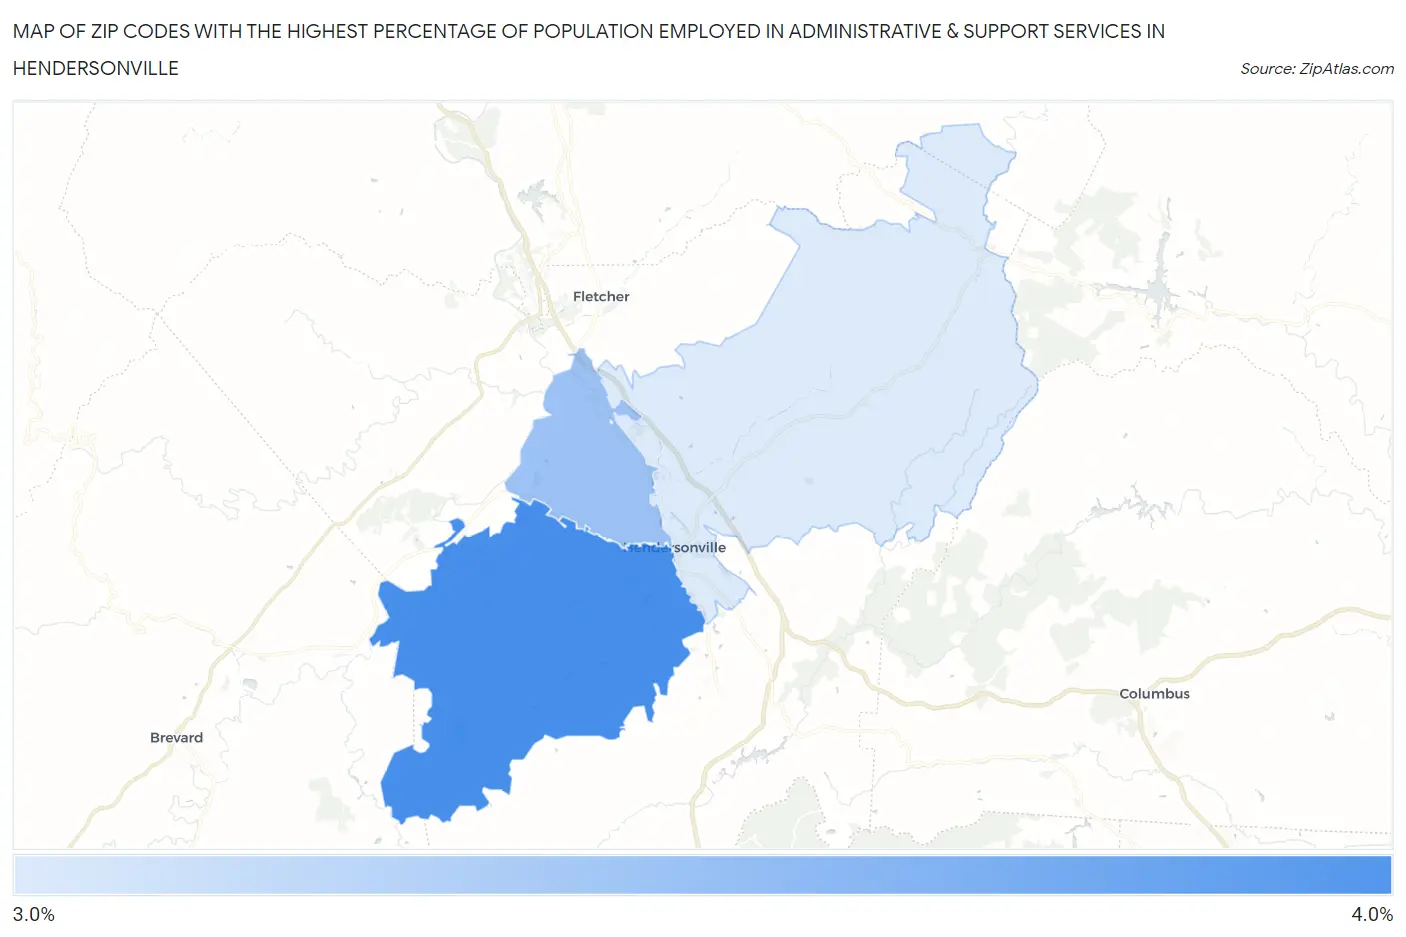
Map of Zip Codes with the Highest Percentage of Population Employed in Administrative & Support Services in Hendersonville
3.3%
3.9%
Zip Codes with the Highest Percentage of Population Employed in Administrative & Support Services in Hendersonville, NC
| Zip Code | % Employed | vs State | vs National | |
| 1. | 28739 | 3.9% | 4.3%(-0.341)#382 | 4.1%(-0.226)#10,993 |
| 2. | 28791 | 3.6% | 4.3%(-0.688)#420 | 4.1%(-0.573)#12,580 |
| 3. | 28792 | 3.3% | 4.3%(-0.974)#457 | 4.1%(-0.859)#13,992 |
1
Common Questions
What are the Top Zip Codes with the Highest Percentage of Population Employed in Administrative & Support Services in Hendersonville, NC?
Top Zip Codes with the Highest Percentage of Population Employed in Administrative & Support Services in Hendersonville, NC are:
What zip code has the Highest Percentage of Population Employed in Administrative & Support Services in Hendersonville, NC?
28739 has the Highest Percentage of Population Employed in Administrative & Support Services in Hendersonville, NC with 3.9%.
What is the Percentage of Population Employed in Administrative & Support Services in Hendersonville, NC?
Percentage of Population Employed in Administrative & Support Services in Hendersonville is 4.1%.
What is the Percentage of Population Employed in Administrative & Support Services in North Carolina?
Percentage of Population Employed in Administrative & Support Services in North Carolina is 4.3%.
What is the Percentage of Population Employed in Administrative & Support Services in the United States?
Percentage of Population Employed in Administrative & Support Services in the United States is 4.1%.