Zip Codes with the Highest Percentage of Population Employed in Architecture & Engineering in Mooresville, NC
RELATED REPORTS & OPTIONS
Architecture & Engineering
Mooresville
Compare Zip Codes
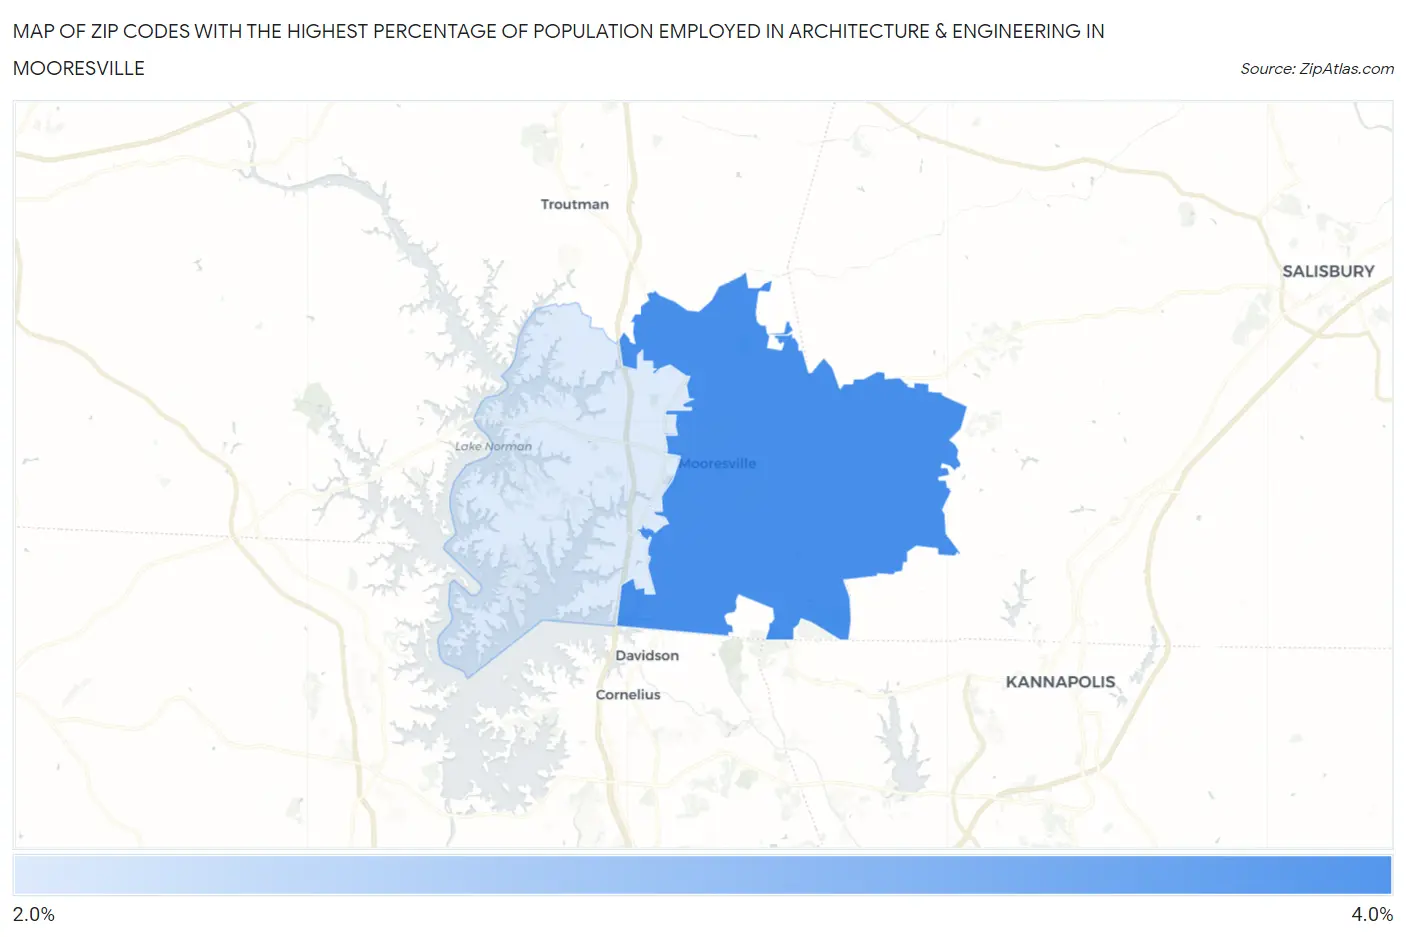
Map of Zip Codes with the Highest Percentage of Population Employed in Architecture & Engineering in Mooresville
2.9%
3.5%
Zip Codes with the Highest Percentage of Population Employed in Architecture & Engineering in Mooresville, NC
| Zip Code | % Employed | vs State | vs National | |
| 1. | 28115 | 3.5% | 1.9%(+1.64)#61 | 2.1%(+1.37)#3,669 |
| 2. | 28117 | 2.9% | 1.9%(+1.00)#104 | 2.1%(+0.744)#5,440 |
1
Common Questions
What are the Top Zip Codes with the Highest Percentage of Population Employed in Architecture & Engineering in Mooresville, NC?
Top Zip Codes with the Highest Percentage of Population Employed in Architecture & Engineering in Mooresville, NC are:
What zip code has the Highest Percentage of Population Employed in Architecture & Engineering in Mooresville, NC?
28115 has the Highest Percentage of Population Employed in Architecture & Engineering in Mooresville, NC with 3.5%.
What is the Percentage of Population Employed in Architecture & Engineering in Mooresville, NC?
Percentage of Population Employed in Architecture & Engineering in Mooresville is 3.8%.
What is the Percentage of Population Employed in Architecture & Engineering in North Carolina?
Percentage of Population Employed in Architecture & Engineering in North Carolina is 1.9%.
What is the Percentage of Population Employed in Architecture & Engineering in the United States?
Percentage of Population Employed in Architecture & Engineering in the United States is 2.1%.