Harrellsville, NC Map & Demographics
Harrellsville Map
Harrellsville Overview
$31,350
PER CAPITA INCOME
$62,292
AVG HOUSEHOLD INCOME
18.1%
WAGE / INCOME GAP [ % ]
81.9¢/ $1
WAGE / INCOME GAP [ $ ]
0.41
INEQUALITY / GINI INDEX
208
TOTAL POPULATION
97
MALE POPULATION
111
FEMALE POPULATION
87.39
MALES / 100 FEMALES
114.43
FEMALES / 100 MALES
44.3
MEDIAN AGE
4.0
AVG FAMILY SIZE
3.2
AVG HOUSEHOLD SIZE
101
LABOR FORCE [ PEOPLE ]
62.3%
PERCENT IN LABOR FORCE
15.8%
UNEMPLOYMENT RATE
Harrellsville Zip Codes
Harrellsville Area Codes
Income in Harrellsville
Income Overview in Harrellsville
| Characteristic | Number | Measure |
| Per Capita Income | 208 | $31,350 |
| Median Family Income | 33 | $0 |
| Mean Family Income | 33 | $128,921 |
| Median Household Income | 65 | $62,292 |
| Mean Household Income | 65 | $89,832 |
| Income Deficit | 33 | $0 |
| Wage / Income Gap (%) | 208 | 18.10% |
| Wage / Income Gap ($) | 208 | 81.90¢ per $1 |
| Gini / Inequality Index | 208 | 0.41 |
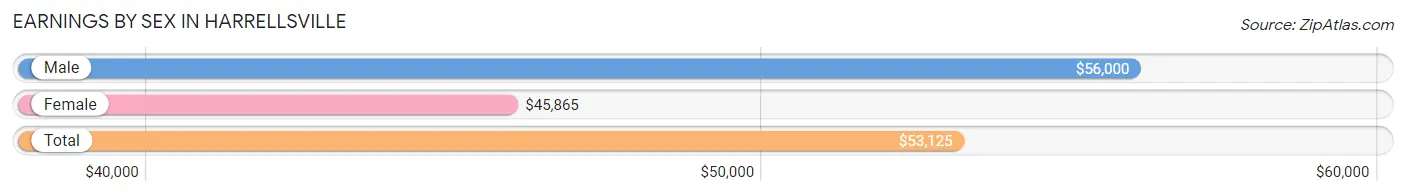
Earnings by Sex in Harrellsville
Average Earnings in Harrellsville are $53,125, $56,000 for men and $45,865 for women, a difference of 18.1%.
| Sex | Number | Average Earnings |
| Male | 60 (60.6%) | $56,000 |
| Female | 39 (39.4%) | $45,865 |
| Total | 99 (100.0%) | $53,125 |
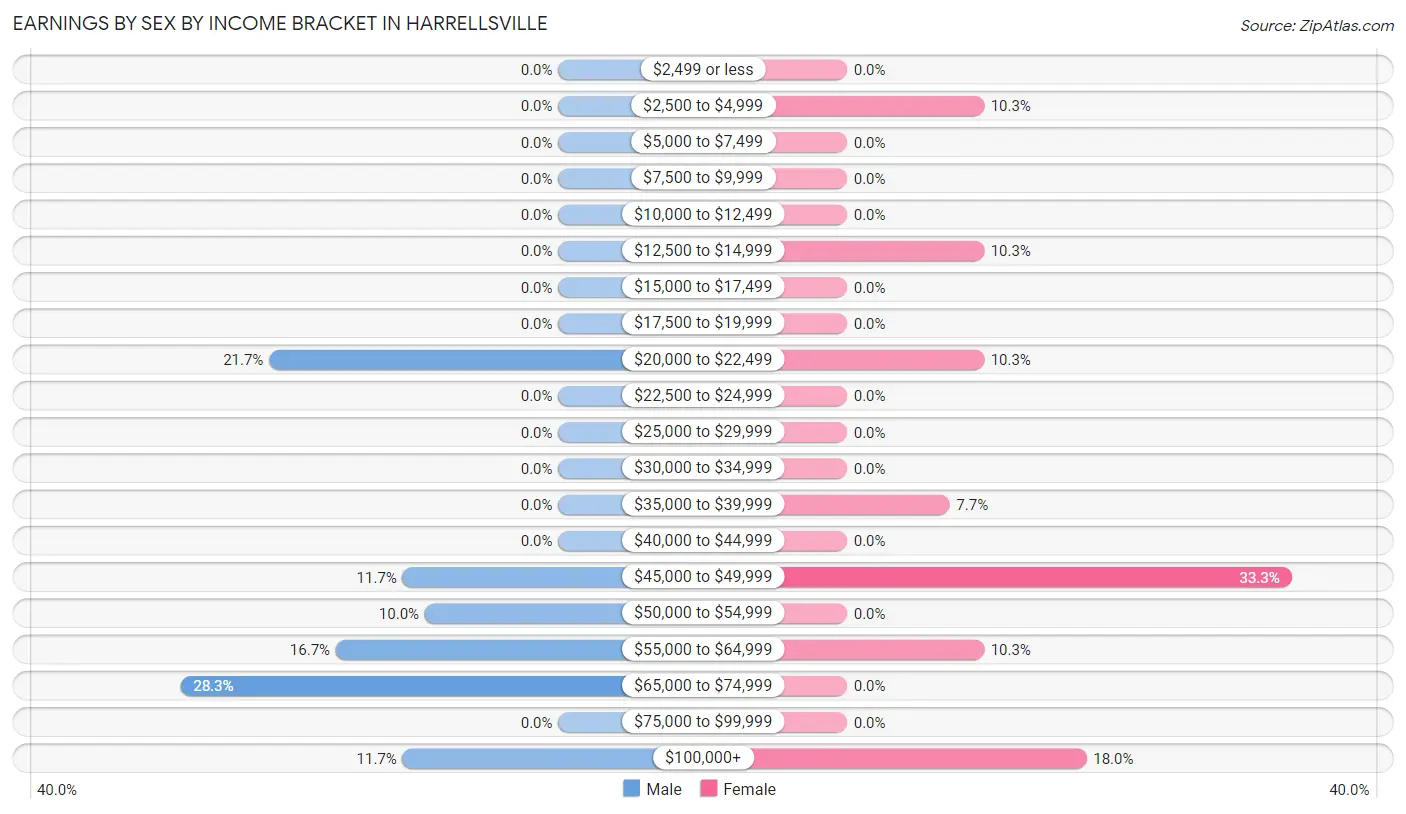
Earnings by Sex by Income Bracket in Harrellsville
The most common earnings brackets in Harrellsville are $65,000 to $74,999 for men (17 | 28.3%) and $45,000 to $49,999 for women (13 | 33.3%).
| Income | Male | Female |
| $2,499 or less | 0 (0.0%) | 0 (0.0%) |
| $2,500 to $4,999 | 0 (0.0%) | 4 (10.3%) |
| $5,000 to $7,499 | 0 (0.0%) | 0 (0.0%) |
| $7,500 to $9,999 | 0 (0.0%) | 0 (0.0%) |
| $10,000 to $12,499 | 0 (0.0%) | 0 (0.0%) |
| $12,500 to $14,999 | 0 (0.0%) | 4 (10.3%) |
| $15,000 to $17,499 | 0 (0.0%) | 0 (0.0%) |
| $17,500 to $19,999 | 0 (0.0%) | 0 (0.0%) |
| $20,000 to $22,499 | 13 (21.7%) | 4 (10.3%) |
| $22,500 to $24,999 | 0 (0.0%) | 0 (0.0%) |
| $25,000 to $29,999 | 0 (0.0%) | 0 (0.0%) |
| $30,000 to $34,999 | 0 (0.0%) | 0 (0.0%) |
| $35,000 to $39,999 | 0 (0.0%) | 3 (7.7%) |
| $40,000 to $44,999 | 0 (0.0%) | 0 (0.0%) |
| $45,000 to $49,999 | 7 (11.7%) | 13 (33.3%) |
| $50,000 to $54,999 | 6 (10.0%) | 0 (0.0%) |
| $55,000 to $64,999 | 10 (16.7%) | 4 (10.3%) |
| $65,000 to $74,999 | 17 (28.3%) | 0 (0.0%) |
| $75,000 to $99,999 | 0 (0.0%) | 0 (0.0%) |
| $100,000+ | 7 (11.7%) | 7 (17.9%) |
| Total | 60 (100.0%) | 39 (100.0%) |
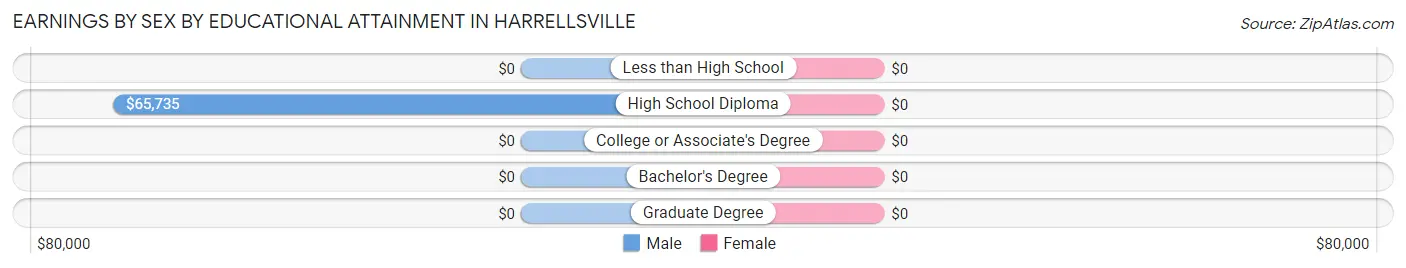
Earnings by Sex by Educational Attainment in Harrellsville
| Educational Attainment | Male Income | Female Income |
| Less than High School | - | - |
| High School Diploma | $65,735 | $0 |
| College or Associate's Degree | - | - |
| Bachelor's Degree | - | - |
| Graduate Degree | - | - |
| Total | $54,583 | $46,250 |
Family Income in Harrellsville
Family Income Brackets in Harrellsville
According to the Harrellsville family income data, there are 14 families falling into the $35,000 to $49,999 income range, which is the most common income bracket and makes up 42.4% of all families.
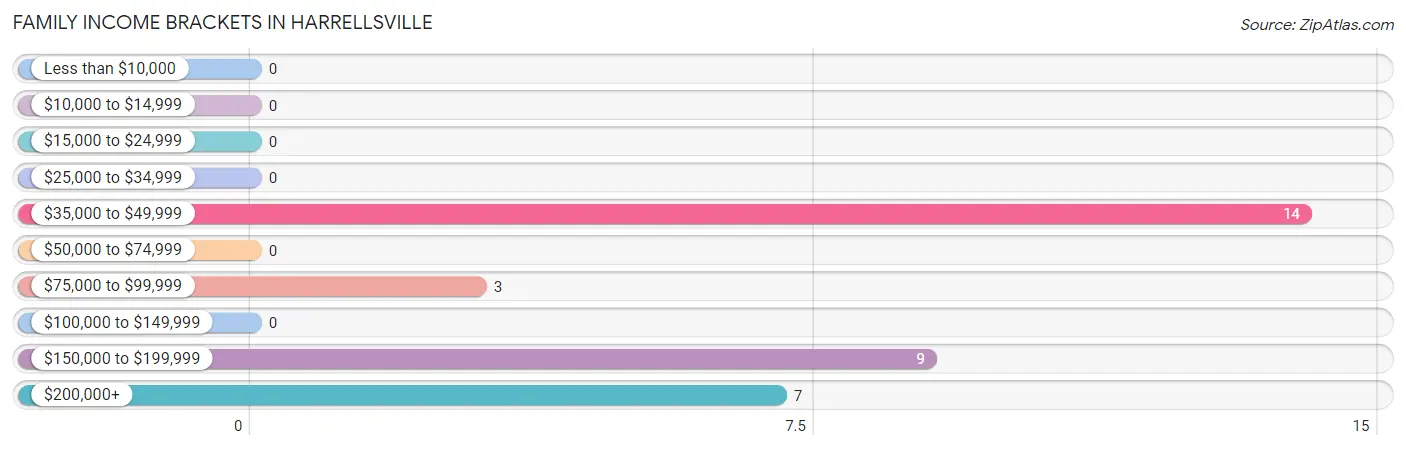
| Income Bracket | # Families | % Families |
| Less than $10,000 | 0 | 0.0% |
| $10,000 to $14,999 | 0 | 0.0% |
| $15,000 to $24,999 | 0 | 0.0% |
| $25,000 to $34,999 | 0 | 0.0% |
| $35,000 to $49,999 | 14 | 42.4% |
| $50,000 to $74,999 | 0 | 0.0% |
| $75,000 to $99,999 | 3 | 9.1% |
| $100,000 to $149,999 | 0 | 0.0% |
| $150,000 to $199,999 | 9 | 27.3% |
| $200,000+ | 7 | 21.2% |
Family Income by Famaliy Size in Harrellsville
2-person families (11 | 33.3%) account for the highest median family income in Harrellsville with $193,036 per family, while 2-person families (11 | 33.3%) have the highest median income of $96,518 per family member.
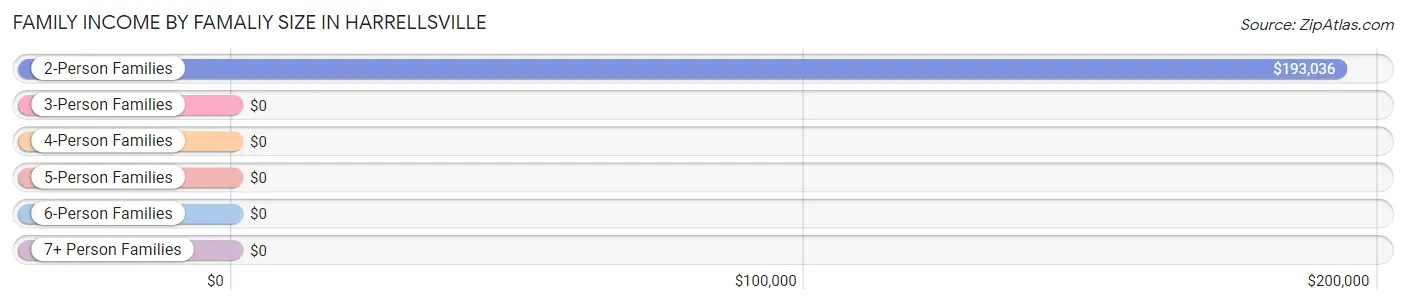
| Income Bracket | # Families | Median Income |
| 2-Person Families | 11 (33.3%) | $193,036 |
| 3-Person Families | 0 (0.0%) | $0 |
| 4-Person Families | 9 (27.3%) | $0 |
| 5-Person Families | 13 (39.4%) | $0 |
| 6-Person Families | 0 (0.0%) | $0 |
| 7+ Person Families | 0 (0.0%) | $0 |
| Total | 33 (100.0%) | $0 |
Family Income by Number of Earners in Harrellsville
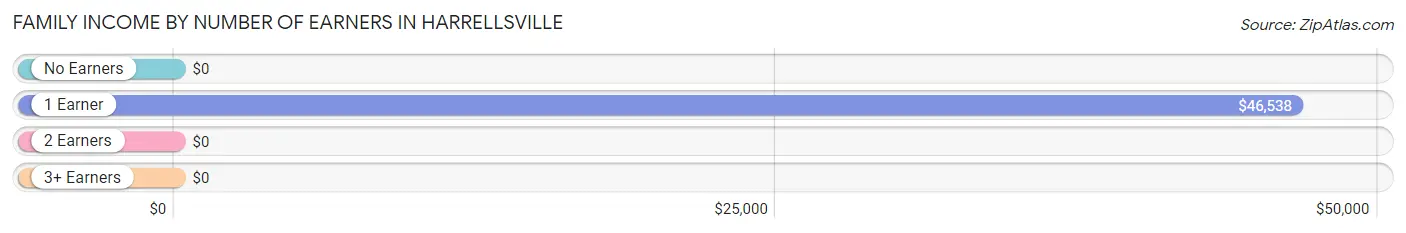
| Number of Earners | # Families | Median Income |
| No Earners | 3 (9.1%) | $0 |
| 1 Earner | 16 (48.5%) | $46,538 |
| 2 Earners | 7 (21.2%) | $0 |
| 3+ Earners | 7 (21.2%) | $0 |
| Total | 33 (100.0%) | $0 |
Household Income in Harrellsville
Household Income Brackets in Harrellsville
With 29 households falling in the category, the $50,000 to $74,999 income range is the most frequent in Harrellsville, accounting for 44.6% of all households.
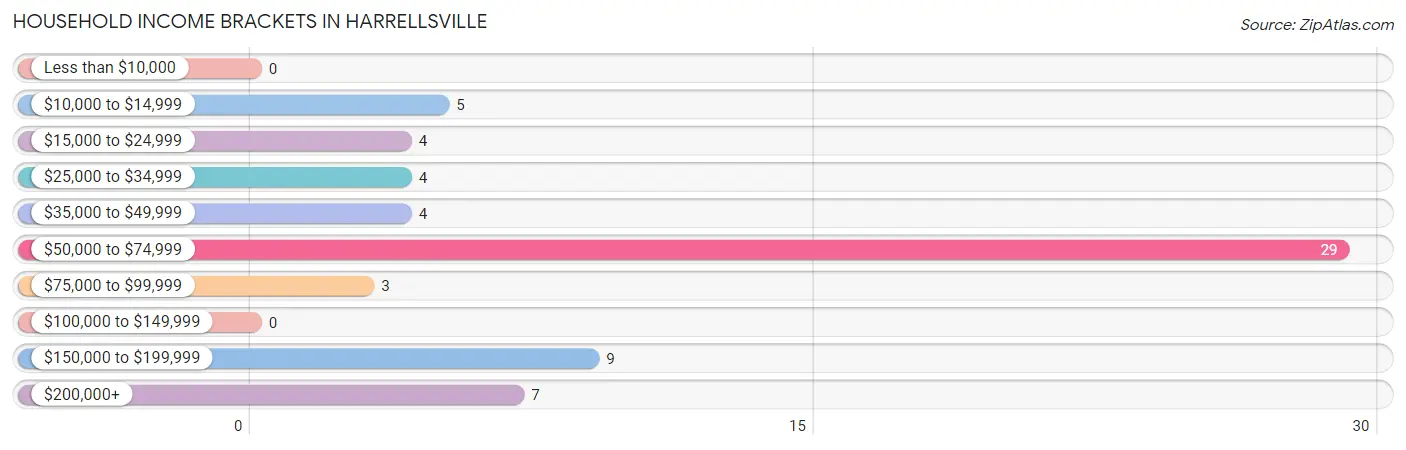
| Income Bracket | # Households | % Households |
| Less than $10,000 | 0 | 0.0% |
| $10,000 to $14,999 | 5 | 7.7% |
| $15,000 to $24,999 | 4 | 6.2% |
| $25,000 to $34,999 | 4 | 6.2% |
| $35,000 to $49,999 | 4 | 6.2% |
| $50,000 to $74,999 | 29 | 44.6% |
| $75,000 to $99,999 | 3 | 4.6% |
| $100,000 to $149,999 | 0 | 0.0% |
| $150,000 to $199,999 | 9 | 13.8% |
| $200,000+ | 7 | 10.8% |
Household Income by Householder Age in Harrellsville
| Income Bracket | # Households | Median Income |
| 15 to 24 Years | 10 (15.4%) | $0 |
| 25 to 44 Years | 19 (29.2%) | $0 |
| 45 to 64 Years | 21 (32.3%) | $0 |
| 65+ Years | 15 (23.1%) | $0 |
| Total | 65 (100.0%) | $62,292 |
Poverty in Harrellsville
Income Below Poverty by Sex and Age in Harrellsville
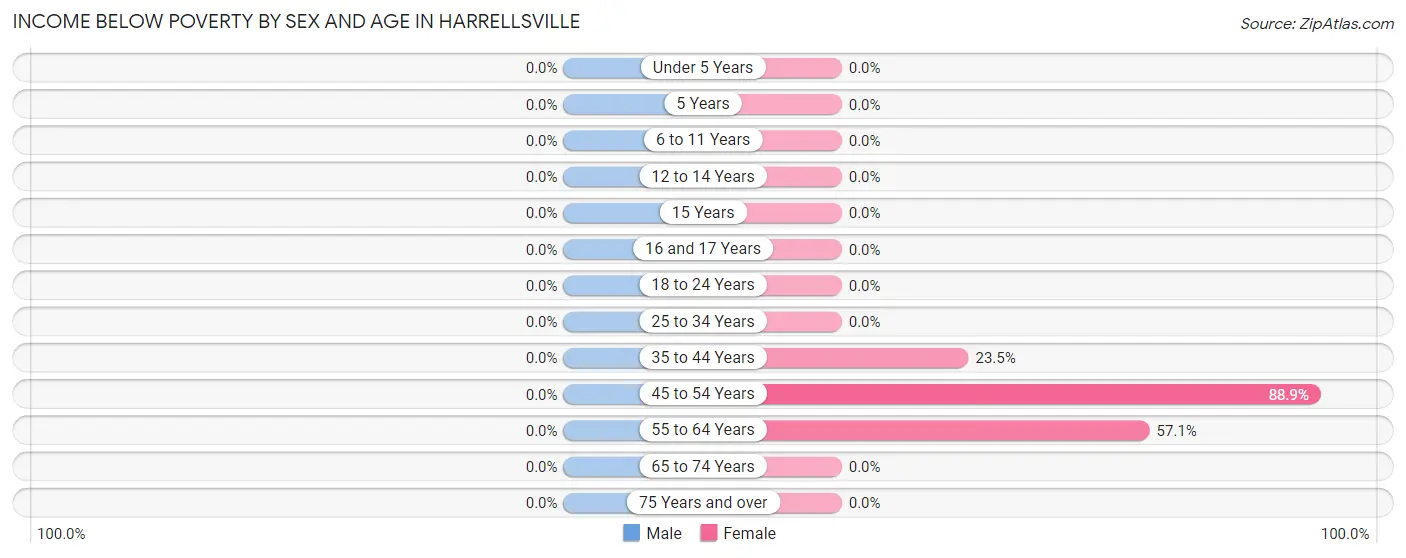
| Age Bracket | Male | Female |
| Under 5 Years | 0 (0.0%) | 0 (0.0%) |
| 5 Years | 0 (0.0%) | 0 (0.0%) |
| 6 to 11 Years | 0 (0.0%) | 0 (0.0%) |
| 12 to 14 Years | 0 (0.0%) | 0 (0.0%) |
| 15 Years | 0 (0.0%) | 0 (0.0%) |
| 16 and 17 Years | 0 (0.0%) | 0 (0.0%) |
| 18 to 24 Years | 0 (0.0%) | 0 (0.0%) |
| 25 to 34 Years | 0 (0.0%) | 0 (0.0%) |
| 35 to 44 Years | 0 (0.0%) | 4 (23.5%) |
| 45 to 54 Years | 0 (0.0%) | 32 (88.9%) |
| 55 to 64 Years | 0 (0.0%) | 4 (57.1%) |
| 65 to 74 Years | 0 (0.0%) | 0 (0.0%) |
| 75 Years and over | 0 (0.0%) | 0 (0.0%) |
| Total | 0 (0.0%) | 40 (36.0%) |
Income Above Poverty by Sex and Age in Harrellsville
According to the poverty statistics in Harrellsville, males aged 12 to 14 years and females aged 6 to 11 years are the age groups that are most secure financially, with 100.0% of males and 100.0% of females in these age groups living above the poverty line.
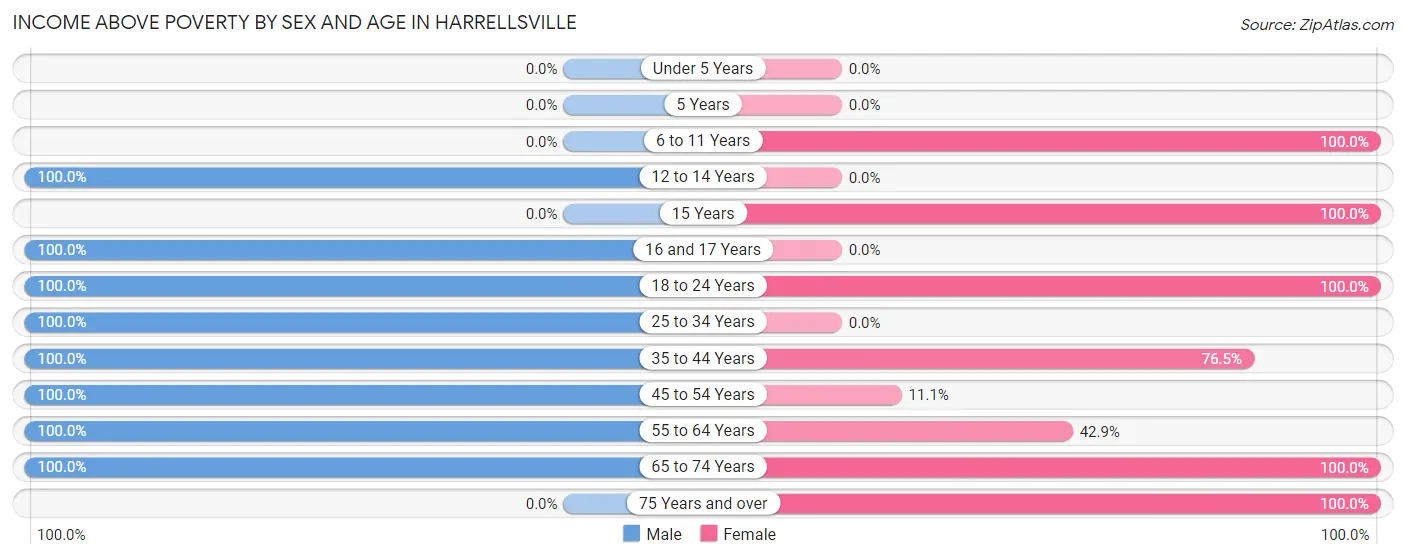
| Age Bracket | Male | Female |
| Under 5 Years | 0 (0.0%) | 0 (0.0%) |
| 5 Years | 0 (0.0%) | 0 (0.0%) |
| 6 to 11 Years | 0 (0.0%) | 29 (100.0%) |
| 12 to 14 Years | 13 (100.0%) | 0 (0.0%) |
| 15 Years | 0 (0.0%) | 4 (100.0%) |
| 16 and 17 Years | 14 (100.0%) | 0 (0.0%) |
| 18 to 24 Years | 10 (100.0%) | 4 (100.0%) |
| 25 to 34 Years | 3 (100.0%) | 0 (0.0%) |
| 35 to 44 Years | 21 (100.0%) | 13 (76.5%) |
| 45 to 54 Years | 24 (100.0%) | 4 (11.1%) |
| 55 to 64 Years | 2 (100.0%) | 3 (42.9%) |
| 65 to 74 Years | 10 (100.0%) | 9 (100.0%) |
| 75 Years and over | 0 (0.0%) | 5 (100.0%) |
| Total | 97 (100.0%) | 71 (64.0%) |
Income Below Poverty Among Married-Couple Families in Harrellsville
| Children | Above Poverty | Below Poverty |
| No Children | 18 (100.0%) | 0 (0.0%) |
| 1 or 2 Children | 2 (100.0%) | 0 (0.0%) |
| 3 or 4 Children | 0 (0.0%) | 0 (0.0%) |
| 5 or more Children | 0 (0.0%) | 0 (0.0%) |
| Total | 20 (100.0%) | 0 (0.0%) |
Income Below Poverty Among Single-Parent Households in Harrellsville
| Children | Single Father | Single Mother |
| No Children | 0 (0.0%) | 0 (0.0%) |
| 1 or 2 Children | 0 (0.0%) | 0 (0.0%) |
| 3 or 4 Children | 0 (0.0%) | 0 (0.0%) |
| 5 or more Children | 0 (0.0%) | 0 (0.0%) |
| Total | 0 (0.0%) | 0 (0.0%) |
Income Below Poverty Among Married-Couple vs Single-Parent Households in Harrellsville
| Children | Married-Couple Families | Single-Parent Households |
| No Children | 0 (0.0%) | 0 (0.0%) |
| 1 or 2 Children | 0 (0.0%) | 0 (0.0%) |
| 3 or 4 Children | 0 (0.0%) | 0 (0.0%) |
| 5 or more Children | 0 (0.0%) | 0 (0.0%) |
| Total | 0 (0.0%) | 0 (0.0%) |
Race in Harrellsville
The most populous races in Harrellsville are White / Caucasian (102 | 49.0%), Black / African American (87 | 41.8%), and Hispanic or Latino (19 | 9.1%).
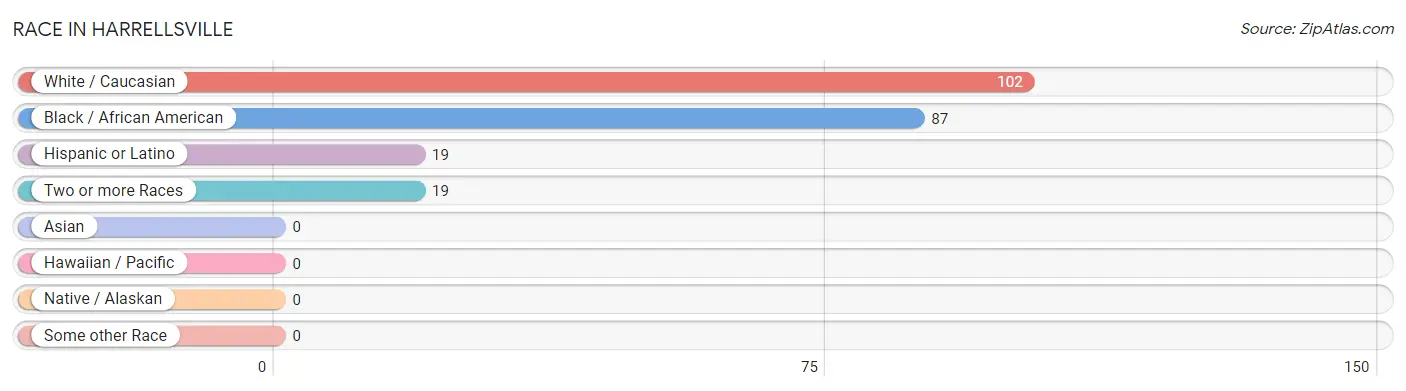
| Race | # Population | % Population |
| Asian | 0 | 0.0% |
| Black / African American | 87 | 41.8% |
| Hawaiian / Pacific | 0 | 0.0% |
| Hispanic or Latino | 19 | 9.1% |
| Native / Alaskan | 0 | 0.0% |
| White / Caucasian | 102 | 49.0% |
| Two or more Races | 19 | 9.1% |
| Some other Race | 0 | 0.0% |
| Total | 208 | 100.0% |
Ancestry in Harrellsville
The most populous ancestries reported in Harrellsville are American (22 | 10.6%), Cuban (19 | 9.1%), African (5 | 2.4%), Subsaharan African (5 | 2.4%), and English (1 | 0.5%), together accounting for 25.0% of all Harrellsville residents.
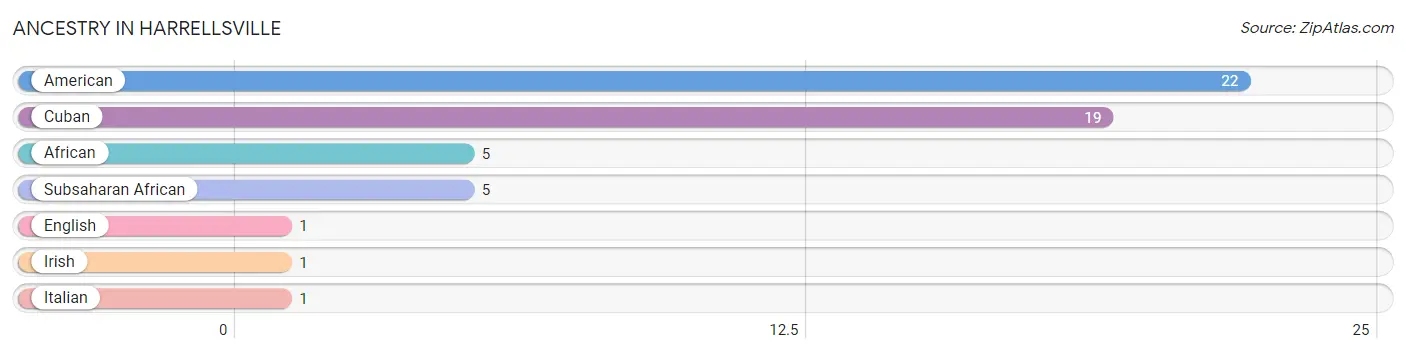
| Ancestry | # Population | % Population |
| African | 5 | 2.4% |
| American | 22 | 10.6% |
| Cuban | 19 | 9.1% |
| English | 1 | 0.5% |
| Irish | 1 | 0.5% |
| Italian | 1 | 0.5% |
| Subsaharan African | 5 | 2.4% | View All 7 Rows |
Immigrants in Harrellsville
The most numerous immigrant groups reported in Harrellsville came from Central America (19 | 9.1%), Latin America (19 | 9.1%), and Mexico (19 | 9.1%), together accounting for 27.4% of all Harrellsville residents.
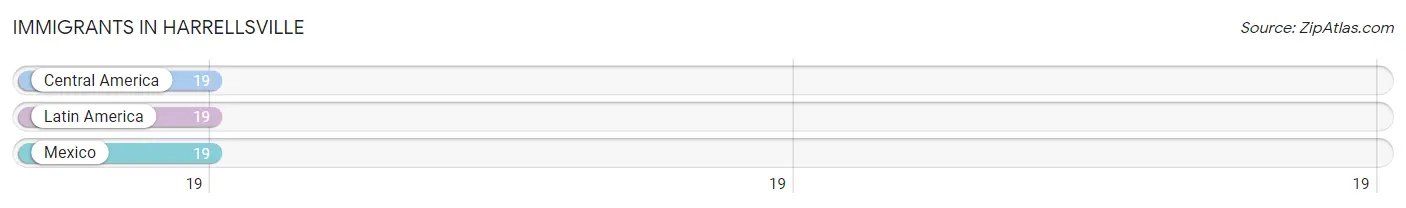
| Immigration Origin | # Population | % Population |
| Central America | 19 | 9.1% |
| Latin America | 19 | 9.1% |
| Mexico | 19 | 9.1% | View All 3 Rows |
Sex and Age in Harrellsville
Sex and Age in Harrellsville
The most populous age groups in Harrellsville are 45 to 49 Years (17 | 17.5%) for men and 10 to 14 Years (29 | 26.1%) for women.
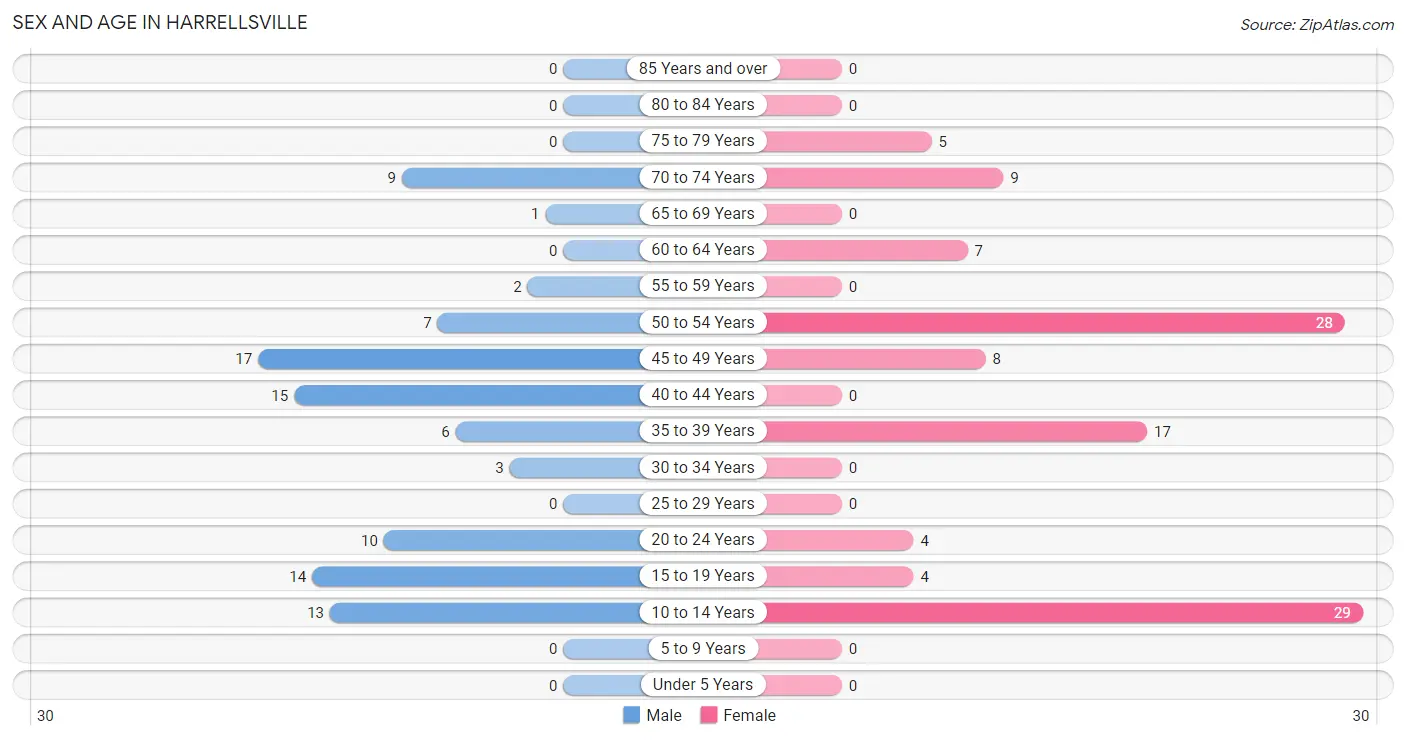
| Age Bracket | Male | Female |
| Under 5 Years | 0 (0.0%) | 0 (0.0%) |
| 5 to 9 Years | 0 (0.0%) | 0 (0.0%) |
| 10 to 14 Years | 13 (13.4%) | 29 (26.1%) |
| 15 to 19 Years | 14 (14.4%) | 4 (3.6%) |
| 20 to 24 Years | 10 (10.3%) | 4 (3.6%) |
| 25 to 29 Years | 0 (0.0%) | 0 (0.0%) |
| 30 to 34 Years | 3 (3.1%) | 0 (0.0%) |
| 35 to 39 Years | 6 (6.2%) | 17 (15.3%) |
| 40 to 44 Years | 15 (15.5%) | 0 (0.0%) |
| 45 to 49 Years | 17 (17.5%) | 8 (7.2%) |
| 50 to 54 Years | 7 (7.2%) | 28 (25.2%) |
| 55 to 59 Years | 2 (2.1%) | 0 (0.0%) |
| 60 to 64 Years | 0 (0.0%) | 7 (6.3%) |
| 65 to 69 Years | 1 (1.0%) | 0 (0.0%) |
| 70 to 74 Years | 9 (9.3%) | 9 (8.1%) |
| 75 to 79 Years | 0 (0.0%) | 5 (4.5%) |
| 80 to 84 Years | 0 (0.0%) | 0 (0.0%) |
| 85 Years and over | 0 (0.0%) | 0 (0.0%) |
| Total | 97 (100.0%) | 111 (100.0%) |
Families and Households in Harrellsville
Median Family Size in Harrellsville
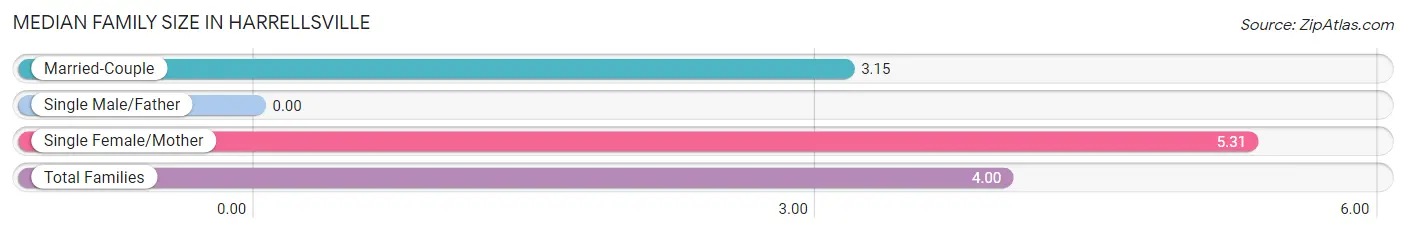
| Family Type | # Families | Family Size |
| Married-Couple | 20 (60.6%) | 3.15 |
| Single Male/Father | 0 (0.0%) | - |
| Single Female/Mother | 13 (39.4%) | 5.31 |
| Total Families | 33 (100.0%) | 4.00 |
Median Household Size in Harrellsville
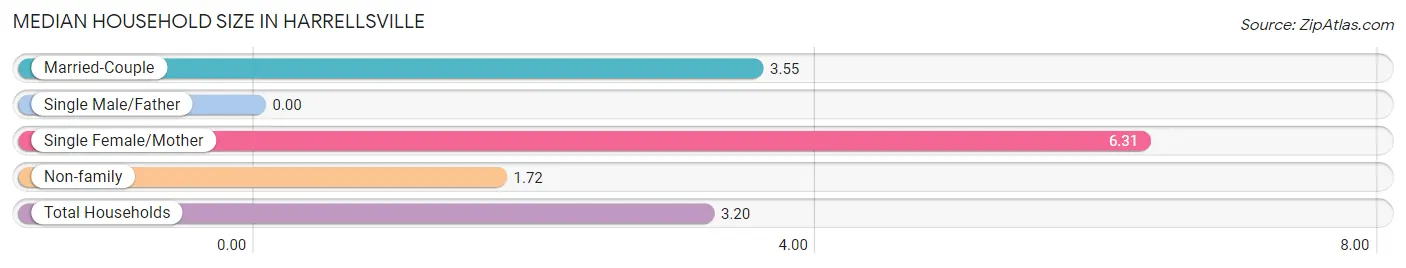
| Household Type | # Households | Household Size |
| Married-Couple | 20 (30.8%) | 3.55 |
| Single Male/Father | 0 (0.0%) | - |
| Single Female/Mother | 13 (20.0%) | 6.31 |
| Non-family | 32 (49.2%) | 1.72 |
| Total Households | 65 (100.0%) | 3.20 |
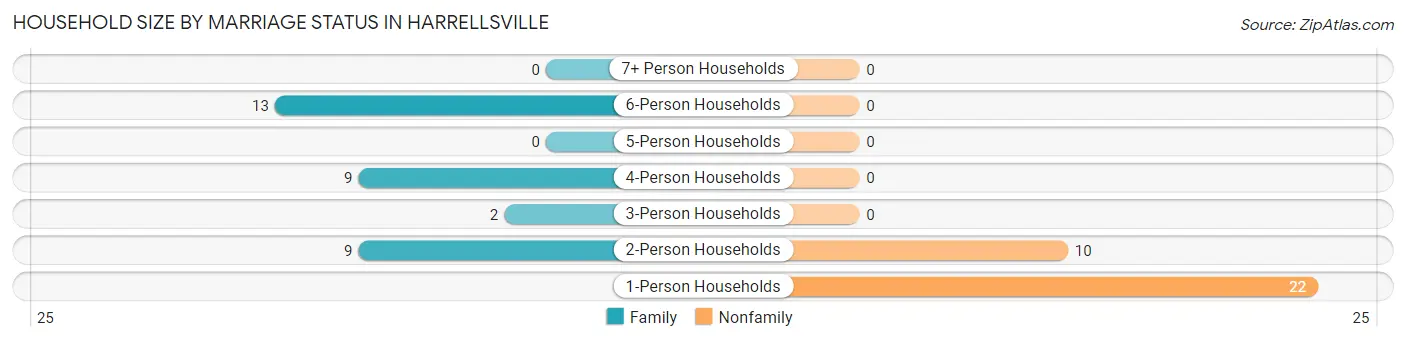
Household Size by Marriage Status in Harrellsville
Out of a total of 65 households in Harrellsville, 33 (50.8%) are family households, while 32 (49.2%) are nonfamily households. The most numerous type of family households are 6-person households, comprising 13, and the most common type of nonfamily households are 1-person households, comprising 22.
| Household Size | Family Households | Nonfamily Households |
| 1-Person Households | - | 22 (33.9%) |
| 2-Person Households | 9 (13.9%) | 10 (15.4%) |
| 3-Person Households | 2 (3.1%) | 0 (0.0%) |
| 4-Person Households | 9 (13.9%) | 0 (0.0%) |
| 5-Person Households | 0 (0.0%) | 0 (0.0%) |
| 6-Person Households | 13 (20.0%) | 0 (0.0%) |
| 7+ Person Households | 0 (0.0%) | 0 (0.0%) |
| Total | 33 (50.8%) | 32 (49.2%) |
Female Fertility in Harrellsville
Fertility by Age in Harrellsville
| Age Bracket | Women with Births | Births / 1,000 Women |
| 15 to 19 years | 0 (0.0%) | 0.0 |
| 20 to 34 years | 0 (0.0%) | 0.0 |
| 35 to 50 years | 0 (0.0%) | 0.0 |
| Total | 0 (0.0%) | 0.0 |
Fertility by Age by Marriage Status in Harrellsville
| Age Bracket | Married | Unmarried |
| 15 to 19 years | 0 (0.0%) | 0 (0.0%) |
| 20 to 34 years | 0 (0.0%) | 0 (0.0%) |
| 35 to 50 years | 0 (0.0%) | 0 (0.0%) |
| Total | 0 (0.0%) | 0 (0.0%) |
Fertility by Education in Harrellsville
| Educational Attainment | Women with Births | Births / 1,000 Women |
| Less than High School | 0 (0.0%) | 0.0 |
| High School Diploma | 0 (0.0%) | 0.0 |
| College or Associate's Degree | 0 (0.0%) | 0.0 |
| Bachelor's Degree | 0 (0.0%) | 0.0 |
| Graduate Degree | 0 (0.0%) | 0.0 |
| Total | 0 (0.0%) | 0.0 |
Fertility by Education by Marriage Status in Harrellsville
| Educational Attainment | Married | Unmarried |
| Less than High School | 0 (0.0%) | 0 (0.0%) |
| High School Diploma | 0 (0.0%) | 0 (0.0%) |
| College or Associate's Degree | 0 (0.0%) | 0 (0.0%) |
| Bachelor's Degree | 0 (0.0%) | 0 (0.0%) |
| Graduate Degree | 0 (0.0%) | 0 (0.0%) |
| Total | 0 (0.0%) | 0 (0.0%) |
Employment Characteristics in Harrellsville
Employment by Class of Employer in Harrellsville
Among the 81 employed individuals in Harrellsville, private company employees (58 | 71.6%), local government employees (16 | 19.8%), and federal government employees (7 | 8.6%) make up the most common classes of employment.
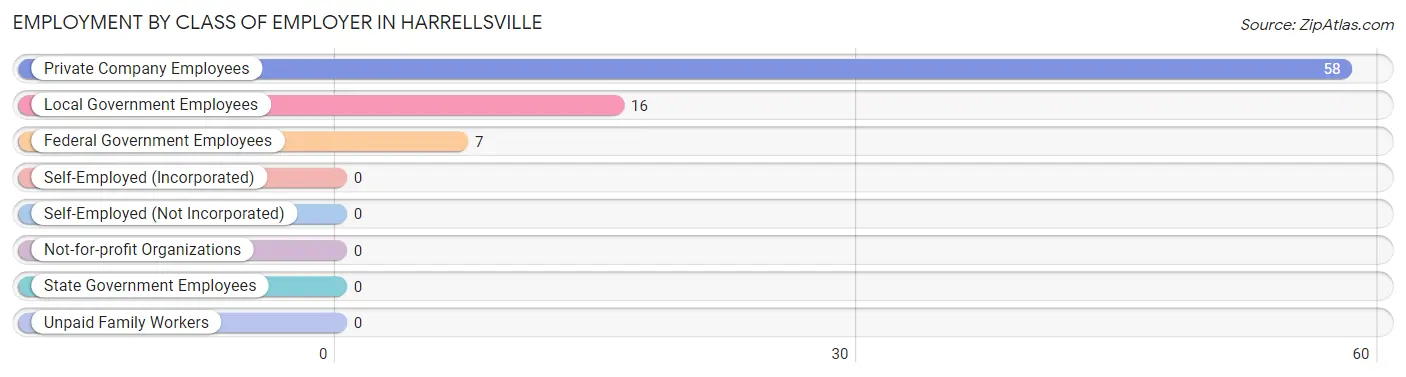
| Employer Class | # Employees | % Employees |
| Private Company Employees | 58 | 71.6% |
| Self-Employed (Incorporated) | 0 | 0.0% |
| Self-Employed (Not Incorporated) | 0 | 0.0% |
| Not-for-profit Organizations | 0 | 0.0% |
| Local Government Employees | 16 | 19.8% |
| State Government Employees | 0 | 0.0% |
| Federal Government Employees | 7 | 8.6% |
| Unpaid Family Workers | 0 | 0.0% |
| Total | 81 | 100.0% |
Employment Status by Age in Harrellsville
According to the labor force statistics for Harrellsville, out of the total population over 16 years of age (162), 62.3% or 101 individuals are in the labor force, with 15.8% or 16 of them unemployed. The age group with the highest labor force participation rate is 20 to 24 years, with 100.0% or 14 individuals in the labor force. Within the labor force, the 30 to 34 years age range has the highest percentage of unemployed individuals, with 100.0% or 3 of them being unemployed.
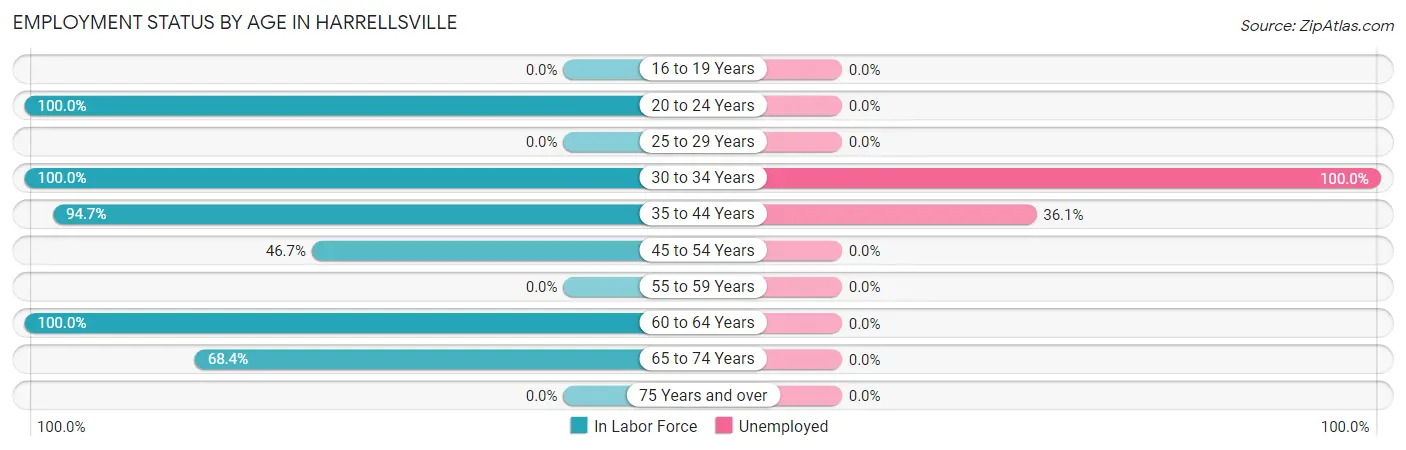
| Age Bracket | In Labor Force | Unemployed |
| 16 to 19 Years | 0 (0.0%) | 0 (0.0%) |
| 20 to 24 Years | 14 (100.0%) | 0 (0.0%) |
| 25 to 29 Years | 0 (0.0%) | 0 (0.0%) |
| 30 to 34 Years | 3 (100.0%) | 3 (100.0%) |
| 35 to 44 Years | 36 (94.7%) | 13 (36.1%) |
| 45 to 54 Years | 28 (46.7%) | 0 (0.0%) |
| 55 to 59 Years | 0 (0.0%) | 0 (0.0%) |
| 60 to 64 Years | 7 (100.0%) | 0 (0.0%) |
| 65 to 74 Years | 13 (68.4%) | 0 (0.0%) |
| 75 Years and over | 0 (0.0%) | 0 (0.0%) |
| Total | 101 (62.3%) | 16 (15.8%) |
Employment Status by Educational Attainment in Harrellsville
According to labor force statistics for Harrellsville, 67.3% of individuals (74) out of the total population between 25 and 64 years of age (110) are in the labor force, with 21.6% or 16 of them being unemployed. The group with the highest labor force participation rate are those with the educational attainment of bachelor's degree or higher, with 100.0% or 13 individuals in the labor force. Within the labor force, individuals with high school diploma education have the highest percentage of unemployment, with 29.5% or 13 of them being unemployed.
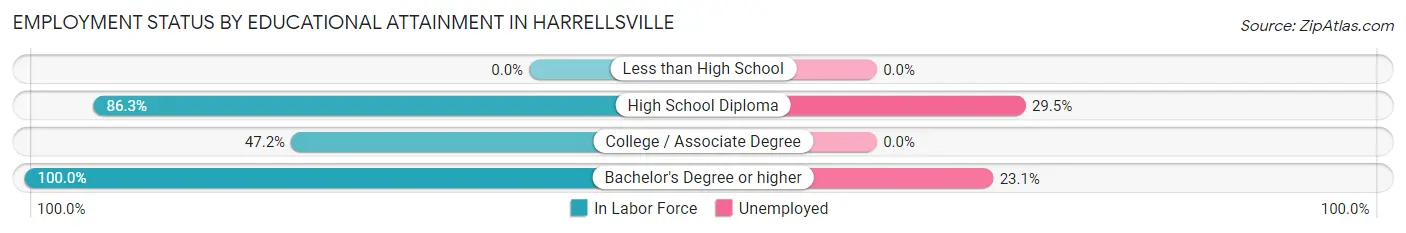
| Educational Attainment | In Labor Force | Unemployed |
| Less than High School | 0 (0.0%) | 0 (0.0%) |
| High School Diploma | 44 (86.3%) | 15 (29.5%) |
| College / Associate Degree | 17 (47.2%) | 0 (0.0%) |
| Bachelor's Degree or higher | 13 (100.0%) | 3 (23.1%) |
| Total | 74 (67.3%) | 24 (21.6%) |
Employment Occupations by Sex in Harrellsville
Management, Business, Science and Arts Occupations
The most common Management, Business, Science and Arts occupations in Harrellsville are Management (13 | 15.3%), Computers, Engineering & Science (13 | 15.3%), and Life, Physical & Social Science (13 | 15.3%).
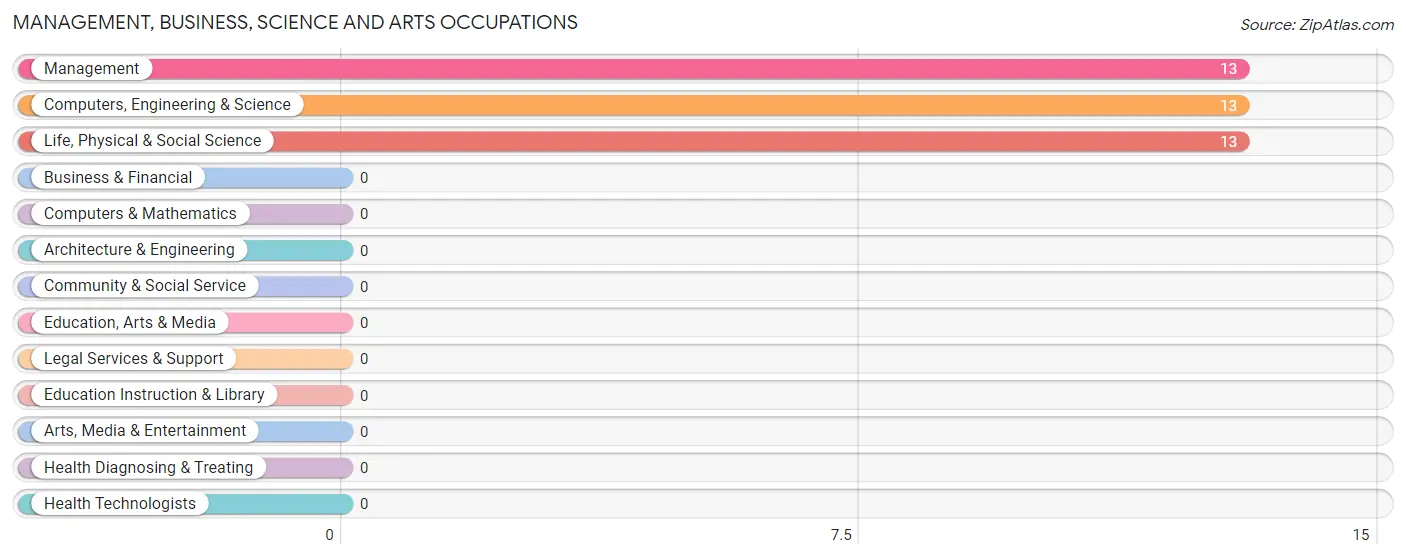
Management, Business, Science and Arts Occupations by Sex
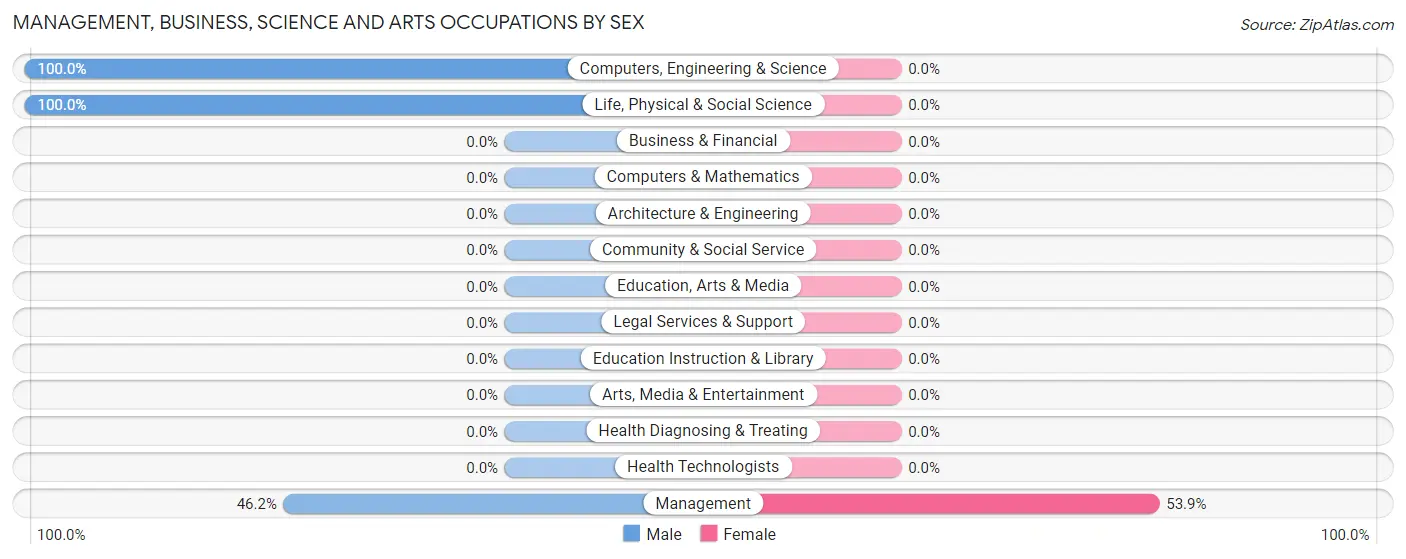
| Occupation | Male | Female |
| Management | 6 (46.2%) | 7 (53.8%) |
| Business & Financial | 0 (0.0%) | 0 (0.0%) |
| Computers, Engineering & Science | 13 (100.0%) | 0 (0.0%) |
| Computers & Mathematics | 0 (0.0%) | 0 (0.0%) |
| Architecture & Engineering | 0 (0.0%) | 0 (0.0%) |
| Life, Physical & Social Science | 13 (100.0%) | 0 (0.0%) |
| Community & Social Service | 0 (0.0%) | 0 (0.0%) |
| Education, Arts & Media | 0 (0.0%) | 0 (0.0%) |
| Legal Services & Support | 0 (0.0%) | 0 (0.0%) |
| Education Instruction & Library | 0 (0.0%) | 0 (0.0%) |
| Arts, Media & Entertainment | 0 (0.0%) | 0 (0.0%) |
| Health Diagnosing & Treating | 0 (0.0%) | 0 (0.0%) |
| Health Technologists | 0 (0.0%) | 0 (0.0%) |
| Total (Category) | 19 (73.1%) | 7 (26.9%) |
| Total (Overall) | 46 (54.1%) | 39 (45.9%) |
Services Occupations
The most common Services occupations in Harrellsville are , and Food Preparation & Serving (4 | 4.7%).
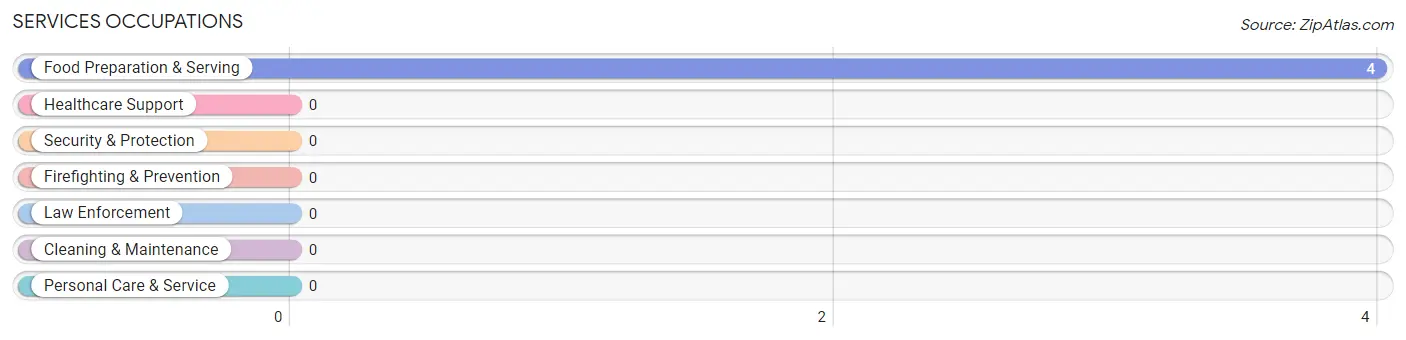
Services Occupations by Sex
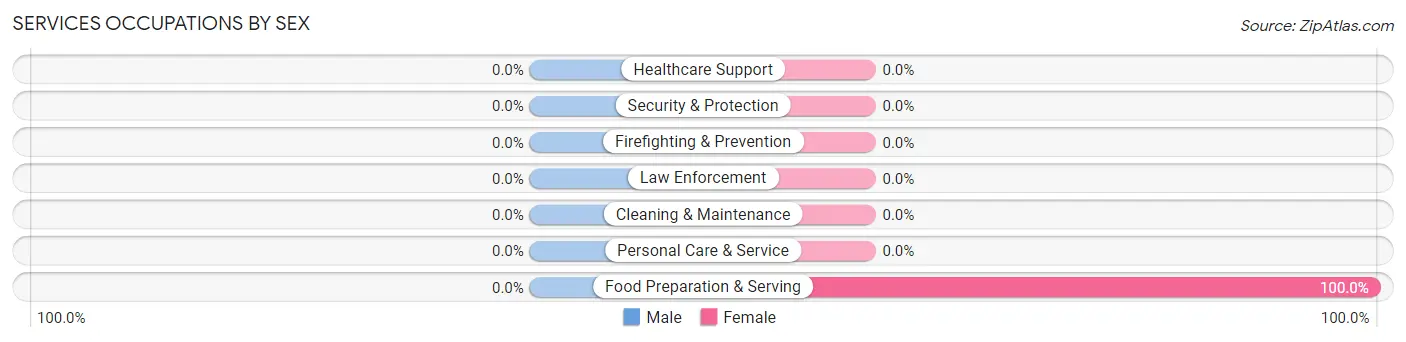
| Occupation | Male | Female |
| Healthcare Support | 0 (0.0%) | 0 (0.0%) |
| Security & Protection | 0 (0.0%) | 0 (0.0%) |
| Firefighting & Prevention | 0 (0.0%) | 0 (0.0%) |
| Law Enforcement | 0 (0.0%) | 0 (0.0%) |
| Food Preparation & Serving | 0 (0.0%) | 4 (100.0%) |
| Cleaning & Maintenance | 0 (0.0%) | 0 (0.0%) |
| Personal Care & Service | 0 (0.0%) | 0 (0.0%) |
| Total (Category) | 0 (0.0%) | 4 (100.0%) |
| Total (Overall) | 46 (54.1%) | 39 (45.9%) |
Sales and Office Occupations
The most common Sales and Office occupations in Harrellsville are Office & Administration (17 | 20.0%), and Sales & Related (7 | 8.2%).
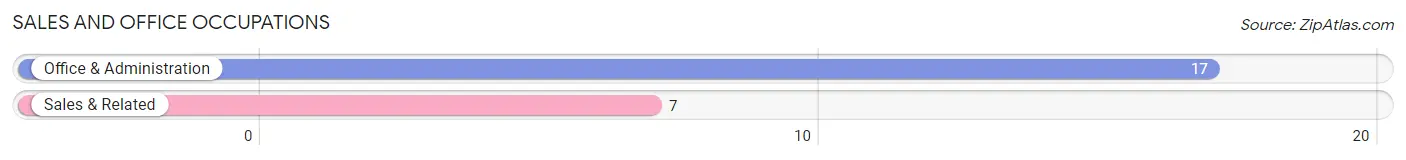
Sales and Office Occupations by Sex
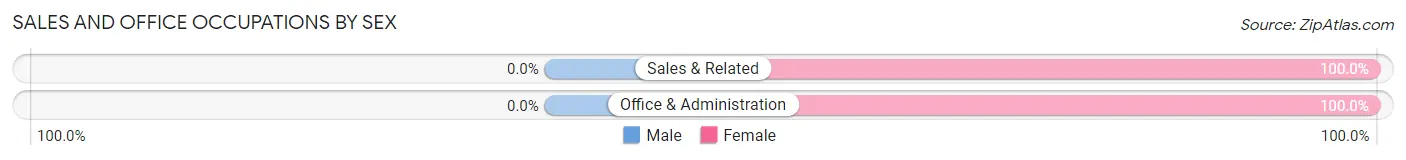
| Occupation | Male | Female |
| Sales & Related | 0 (0.0%) | 7 (100.0%) |
| Office & Administration | 0 (0.0%) | 17 (100.0%) |
| Total (Category) | 0 (0.0%) | 24 (100.0%) |
| Total (Overall) | 46 (54.1%) | 39 (45.9%) |
Natural Resources, Construction and Maintenance Occupations
The most common Natural Resources, Construction and Maintenance occupations in Harrellsville are , and Construction & Extraction (27 | 31.8%).
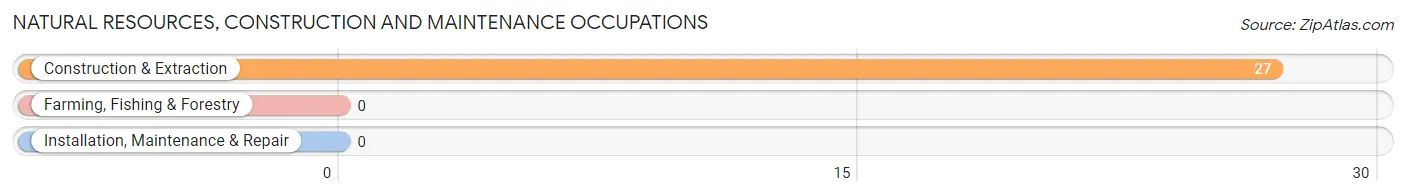
Natural Resources, Construction and Maintenance Occupations by Sex
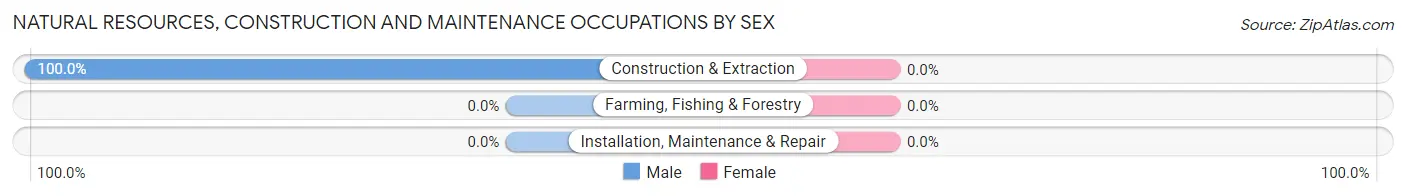
| Occupation | Male | Female |
| Farming, Fishing & Forestry | 0 (0.0%) | 0 (0.0%) |
| Construction & Extraction | 27 (100.0%) | 0 (0.0%) |
| Installation, Maintenance & Repair | 0 (0.0%) | 0 (0.0%) |
| Total (Category) | 27 (100.0%) | 0 (0.0%) |
| Total (Overall) | 46 (54.1%) | 39 (45.9%) |
Production, Transportation and Moving Occupations
The most common Production, Transportation and Moving occupations in Harrellsville are , and Material Moving (4 | 4.7%).
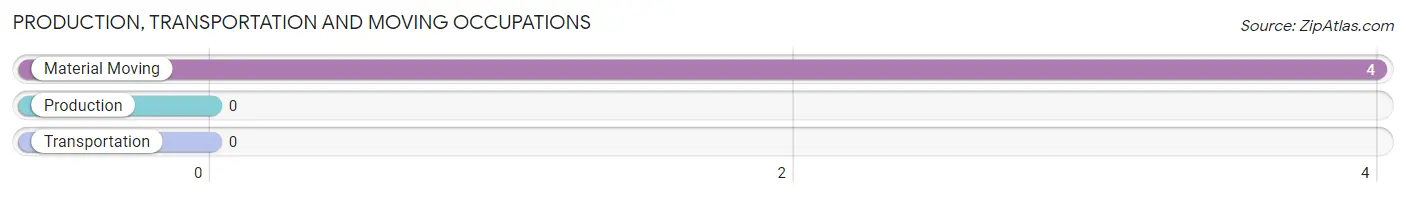
Production, Transportation and Moving Occupations by Sex
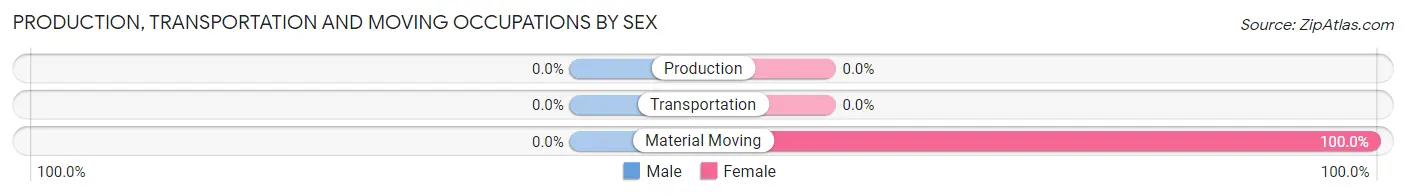
| Occupation | Male | Female |
| Production | 0 (0.0%) | 0 (0.0%) |
| Transportation | 0 (0.0%) | 0 (0.0%) |
| Material Moving | 0 (0.0%) | 4 (100.0%) |
| Total (Category) | 0 (0.0%) | 4 (100.0%) |
| Total (Overall) | 46 (54.1%) | 39 (45.9%) |
Employment Industries by Sex in Harrellsville
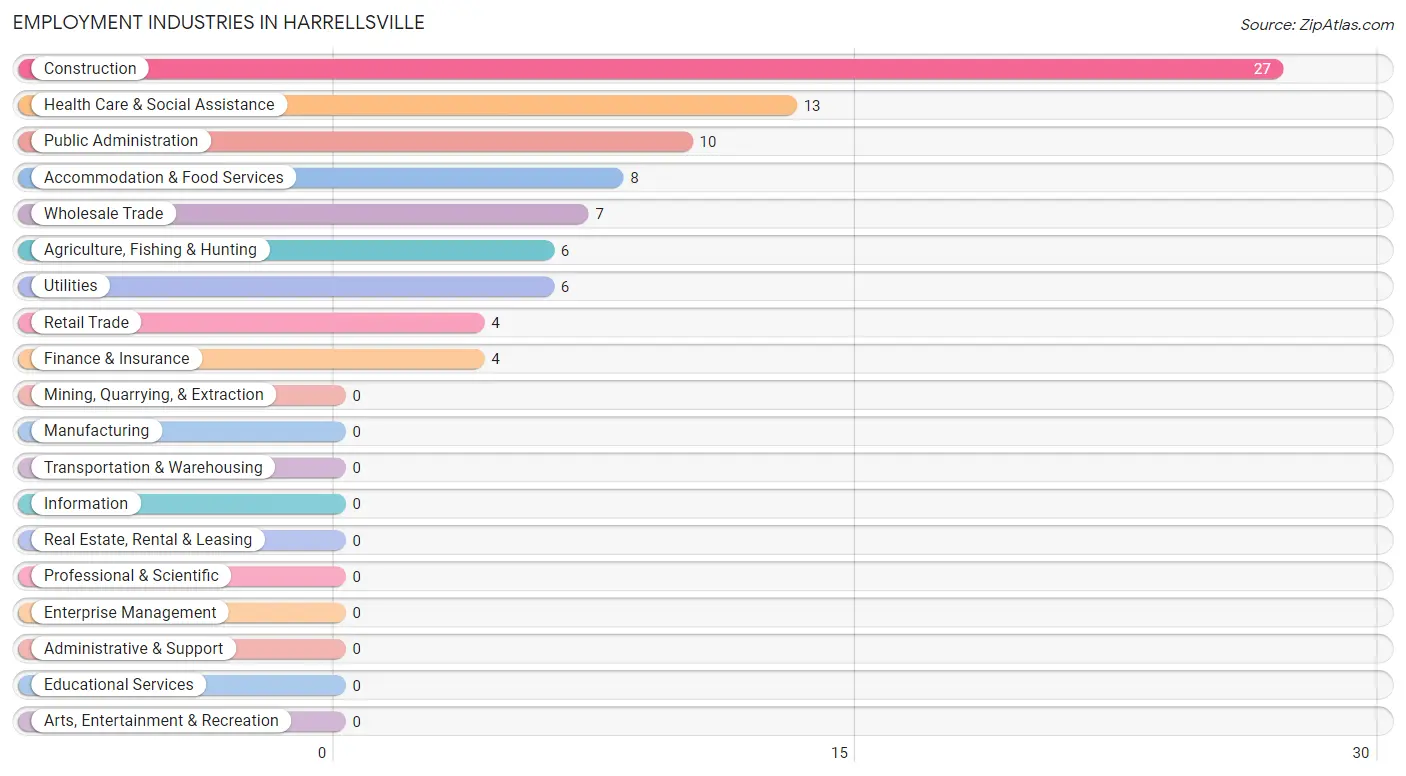
Employment Industries in Harrellsville
The major employment industries in Harrellsville include Construction (27 | 31.8%), Health Care & Social Assistance (13 | 15.3%), Public Administration (10 | 11.8%), Accommodation & Food Services (8 | 9.4%), and Wholesale Trade (7 | 8.2%).
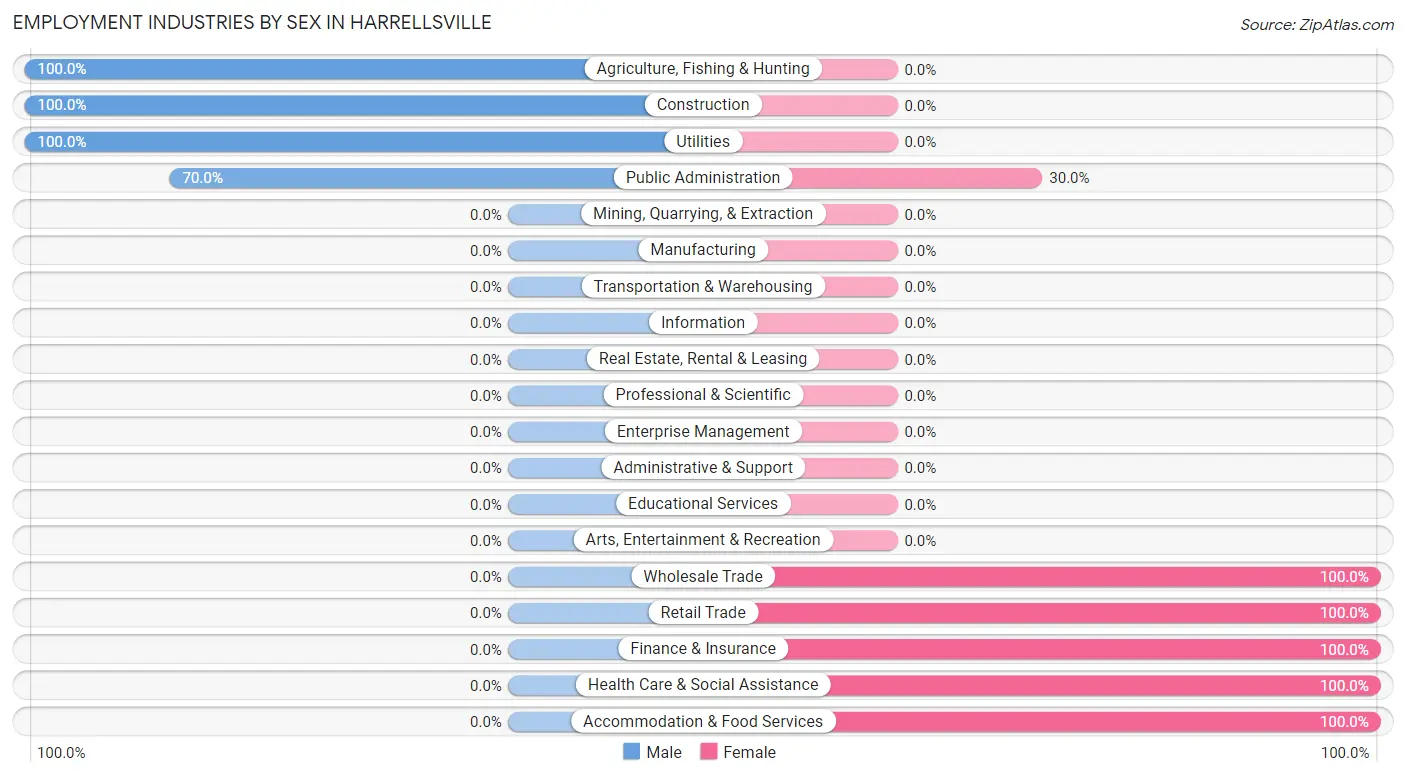
Employment Industries by Sex in Harrellsville
The Harrellsville industries that see more men than women are Agriculture, Fishing & Hunting (100.0%), Construction (100.0%), and Utilities (100.0%), whereas the industries that tend to have a higher number of women are Wholesale Trade (100.0%), Retail Trade (100.0%), and Finance & Insurance (100.0%).
| Industry | Male | Female |
| Agriculture, Fishing & Hunting | 6 (100.0%) | 0 (0.0%) |
| Mining, Quarrying, & Extraction | 0 (0.0%) | 0 (0.0%) |
| Construction | 27 (100.0%) | 0 (0.0%) |
| Manufacturing | 0 (0.0%) | 0 (0.0%) |
| Wholesale Trade | 0 (0.0%) | 7 (100.0%) |
| Retail Trade | 0 (0.0%) | 4 (100.0%) |
| Transportation & Warehousing | 0 (0.0%) | 0 (0.0%) |
| Utilities | 6 (100.0%) | 0 (0.0%) |
| Information | 0 (0.0%) | 0 (0.0%) |
| Finance & Insurance | 0 (0.0%) | 4 (100.0%) |
| Real Estate, Rental & Leasing | 0 (0.0%) | 0 (0.0%) |
| Professional & Scientific | 0 (0.0%) | 0 (0.0%) |
| Enterprise Management | 0 (0.0%) | 0 (0.0%) |
| Administrative & Support | 0 (0.0%) | 0 (0.0%) |
| Educational Services | 0 (0.0%) | 0 (0.0%) |
| Health Care & Social Assistance | 0 (0.0%) | 13 (100.0%) |
| Arts, Entertainment & Recreation | 0 (0.0%) | 0 (0.0%) |
| Accommodation & Food Services | 0 (0.0%) | 8 (100.0%) |
| Public Administration | 7 (70.0%) | 3 (30.0%) |
| Total | 46 (54.1%) | 39 (45.9%) |
Education in Harrellsville
School Enrollment in Harrellsville
The most common levels of schooling among the 62 students in Harrellsville are middle school (27 | 43.5%), high school (20 | 32.3%), and elementary school (15 | 24.2%).
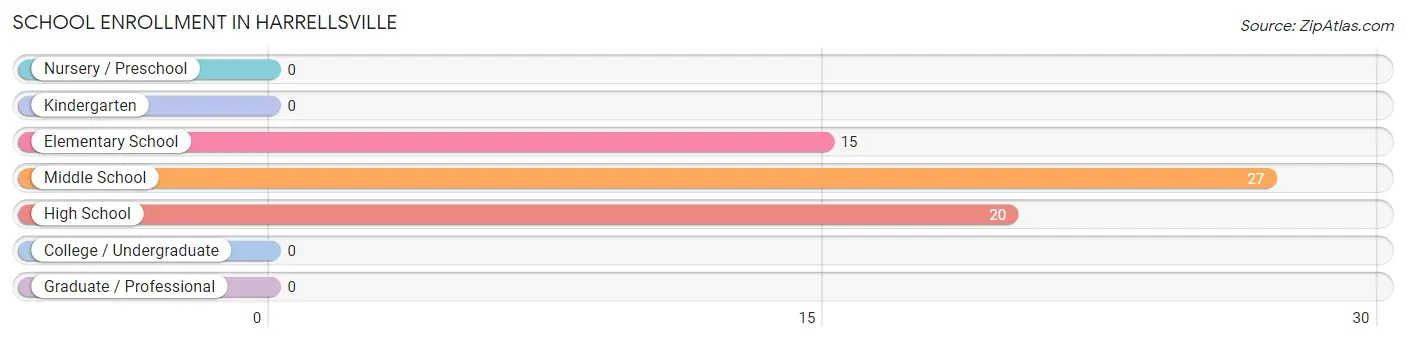
| School Level | # Students | % Students |
| Nursery / Preschool | 0 | 0.0% |
| Kindergarten | 0 | 0.0% |
| Elementary School | 15 | 24.2% |
| Middle School | 27 | 43.5% |
| High School | 20 | 32.3% |
| College / Undergraduate | 0 | 0.0% |
| Graduate / Professional | 0 | 0.0% |
| Total | 62 | 100.0% |
School Enrollment by Age by Funding Source in Harrellsville
Out of a total of 62 students who are enrolled in schools in Harrellsville, 4 (6.5%) attend a private institution, while the remaining 58 (93.5%) are enrolled in public schools. The age group of 15 to 17 year olds has the highest likelihood of being enrolled in private schools, with 4 (22.2% in the age bracket) enrolled. Conversely, the age group of 10 to 14 year olds has the lowest likelihood of being enrolled in a private school, with 42 (100.0% in the age bracket) attending a public institution.
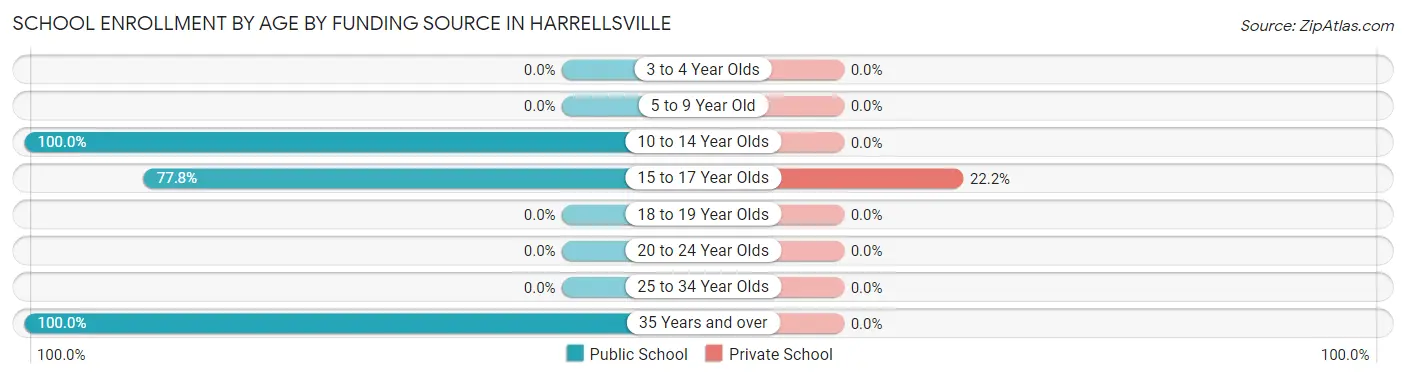
| Age Bracket | Public School | Private School |
| 3 to 4 Year Olds | 0 (0.0%) | 0 (0.0%) |
| 5 to 9 Year Old | 0 (0.0%) | 0 (0.0%) |
| 10 to 14 Year Olds | 42 (100.0%) | 0 (0.0%) |
| 15 to 17 Year Olds | 14 (77.8%) | 4 (22.2%) |
| 18 to 19 Year Olds | 0 (0.0%) | 0 (0.0%) |
| 20 to 24 Year Olds | 0 (0.0%) | 0 (0.0%) |
| 25 to 34 Year Olds | 0 (0.0%) | 0 (0.0%) |
| 35 Years and over | 2 (100.0%) | 0 (0.0%) |
| Total | 58 (93.5%) | 4 (6.5%) |
Educational Attainment by Field of Study in Harrellsville
Business (9 | 28.1%), education (7 | 21.9%), engineering (6 | 18.8%), visual & performing arts (6 | 18.8%), and social sciences (4 | 12.5%) are the most common fields of study among 32 individuals in Harrellsville who have obtained a bachelor's degree or higher.
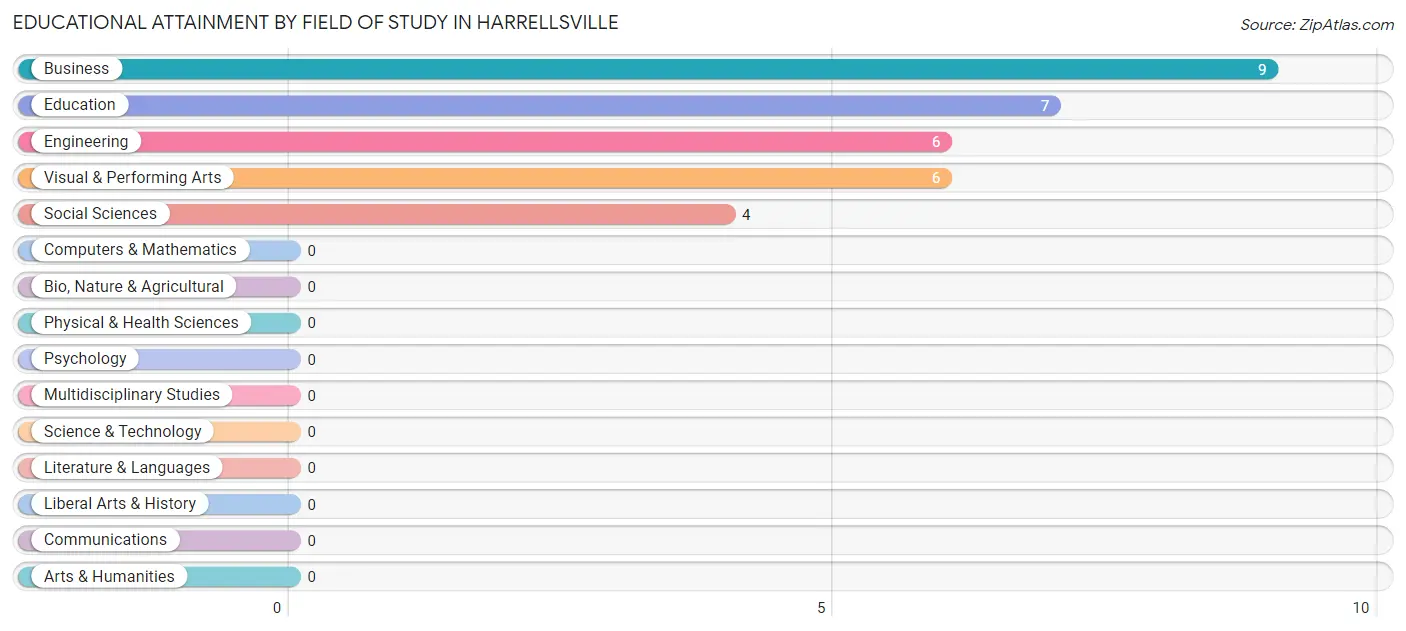
| Field of Study | # Graduates | % Graduates |
| Computers & Mathematics | 0 | 0.0% |
| Bio, Nature & Agricultural | 0 | 0.0% |
| Physical & Health Sciences | 0 | 0.0% |
| Psychology | 0 | 0.0% |
| Social Sciences | 4 | 12.5% |
| Engineering | 6 | 18.8% |
| Multidisciplinary Studies | 0 | 0.0% |
| Science & Technology | 0 | 0.0% |
| Business | 9 | 28.1% |
| Education | 7 | 21.9% |
| Literature & Languages | 0 | 0.0% |
| Liberal Arts & History | 0 | 0.0% |
| Visual & Performing Arts | 6 | 18.8% |
| Communications | 0 | 0.0% |
| Arts & Humanities | 0 | 0.0% |
| Total | 32 | 100.0% |
Transportation & Commute in Harrellsville
Vehicle Availability by Sex in Harrellsville
The most prevalent vehicle ownership categories in Harrellsville are males with 1 vehicle (23, accounting for 50.0%) and females with 1 vehicle (7, making up 65.7%).
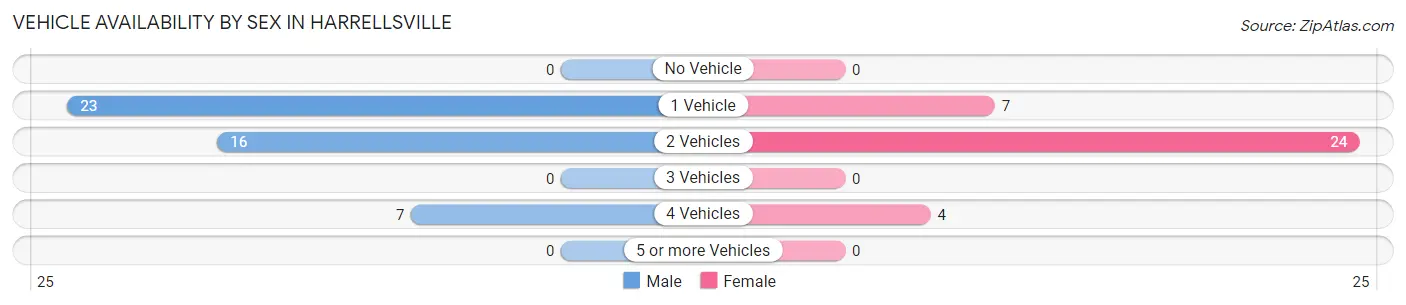
| Vehicles Available | Male | Female |
| No Vehicle | 0 (0.0%) | 0 (0.0%) |
| 1 Vehicle | 23 (50.0%) | 7 (20.0%) |
| 2 Vehicles | 16 (34.8%) | 24 (68.6%) |
| 3 Vehicles | 0 (0.0%) | 0 (0.0%) |
| 4 Vehicles | 7 (15.2%) | 4 (11.4%) |
| 5 or more Vehicles | 0 (0.0%) | 0 (0.0%) |
| Total | 46 (100.0%) | 35 (100.0%) |
Commute Time in Harrellsville
The most frequently occuring commute durations in Harrellsville are 60 to 89 minutes (27 commuters, 33.3%), 5 to 9 minutes (13 commuters, 16.1%), and 15 to 19 minutes (13 commuters, 16.1%).
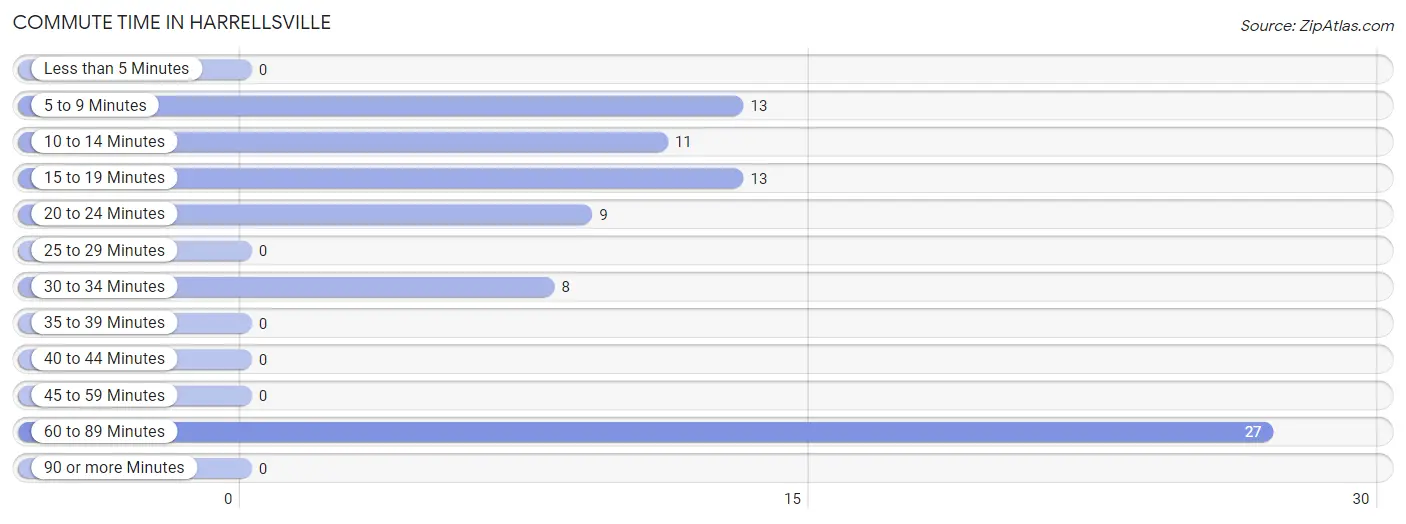
| Commute Time | # Commuters | % Commuters |
| Less than 5 Minutes | 0 | 0.0% |
| 5 to 9 Minutes | 13 | 16.1% |
| 10 to 14 Minutes | 11 | 13.6% |
| 15 to 19 Minutes | 13 | 16.1% |
| 20 to 24 Minutes | 9 | 11.1% |
| 25 to 29 Minutes | 0 | 0.0% |
| 30 to 34 Minutes | 8 | 9.9% |
| 35 to 39 Minutes | 0 | 0.0% |
| 40 to 44 Minutes | 0 | 0.0% |
| 45 to 59 Minutes | 0 | 0.0% |
| 60 to 89 Minutes | 27 | 33.3% |
| 90 or more Minutes | 0 | 0.0% |
Commute Time by Sex in Harrellsville
The most common commute times in Harrellsville are 60 to 89 minutes (27 commuters, 58.7%) for males and 15 to 19 minutes (13 commuters, 37.1%) for females.
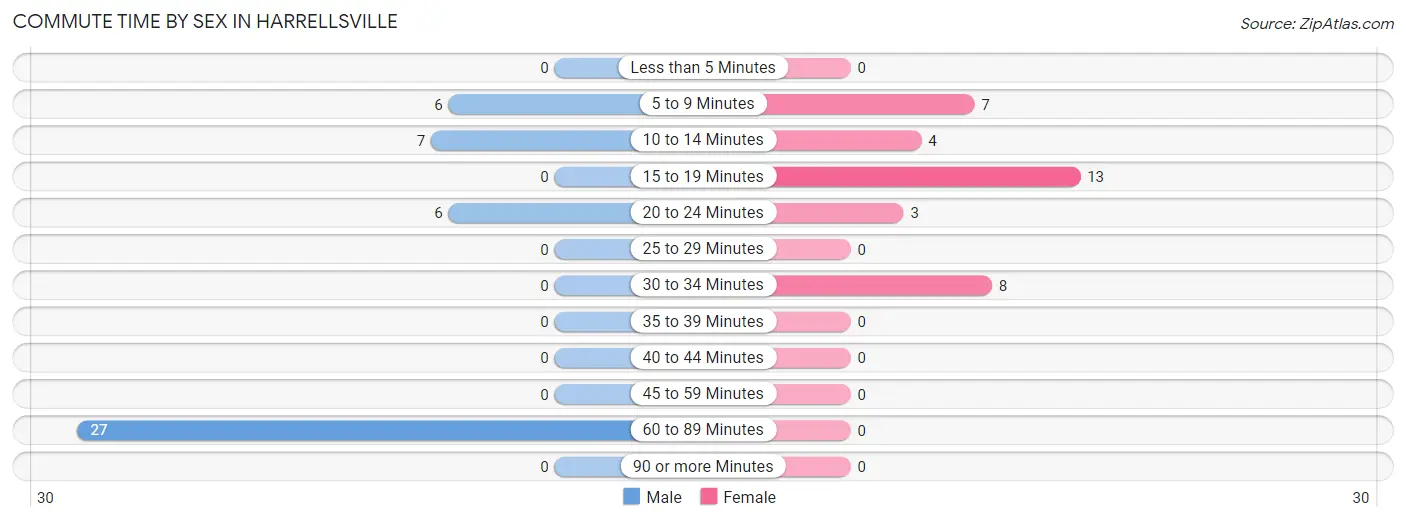
| Commute Time | Male | Female |
| Less than 5 Minutes | 0 (0.0%) | 0 (0.0%) |
| 5 to 9 Minutes | 6 (13.0%) | 7 (20.0%) |
| 10 to 14 Minutes | 7 (15.2%) | 4 (11.4%) |
| 15 to 19 Minutes | 0 (0.0%) | 13 (37.1%) |
| 20 to 24 Minutes | 6 (13.0%) | 3 (8.6%) |
| 25 to 29 Minutes | 0 (0.0%) | 0 (0.0%) |
| 30 to 34 Minutes | 0 (0.0%) | 8 (22.9%) |
| 35 to 39 Minutes | 0 (0.0%) | 0 (0.0%) |
| 40 to 44 Minutes | 0 (0.0%) | 0 (0.0%) |
| 45 to 59 Minutes | 0 (0.0%) | 0 (0.0%) |
| 60 to 89 Minutes | 27 (58.7%) | 0 (0.0%) |
| 90 or more Minutes | 0 (0.0%) | 0 (0.0%) |
Time of Departure to Work by Sex in Harrellsville
The most frequent times of departure to work in Harrellsville are 6:00 AM to 6:29 AM (17, 37.0%) for males and 8:00 AM to 8:29 AM (20, 57.1%) for females.
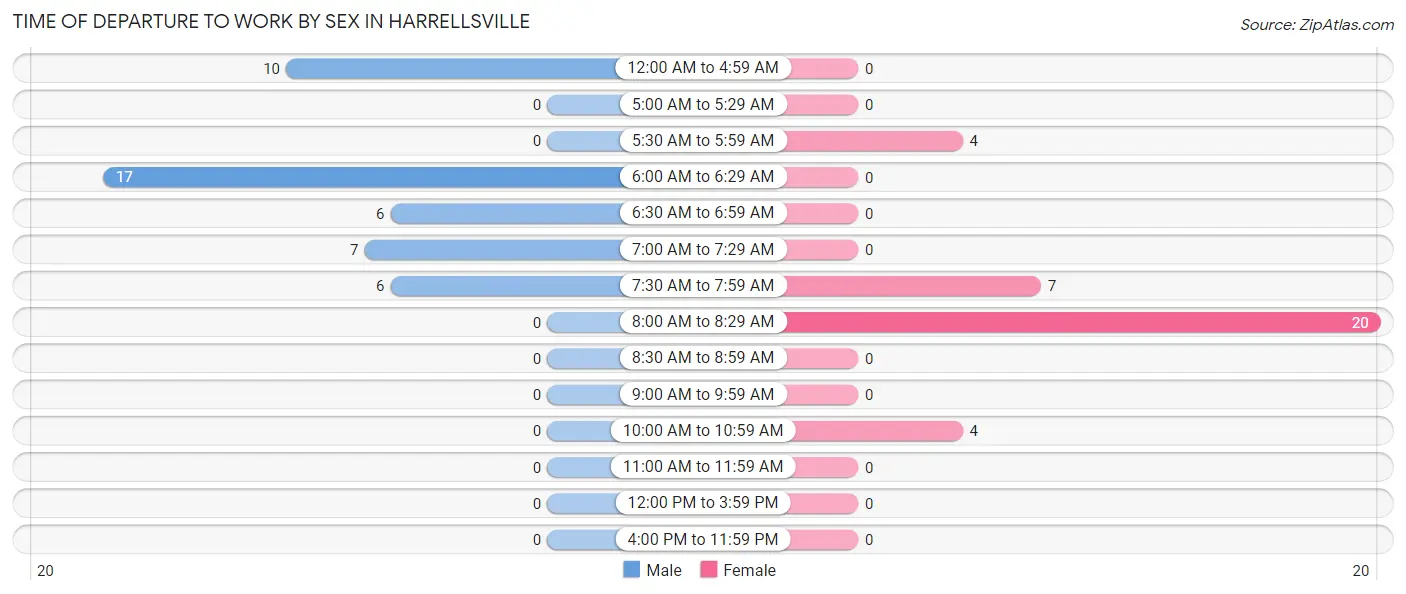
| Time of Departure | Male | Female |
| 12:00 AM to 4:59 AM | 10 (21.7%) | 0 (0.0%) |
| 5:00 AM to 5:29 AM | 0 (0.0%) | 0 (0.0%) |
| 5:30 AM to 5:59 AM | 0 (0.0%) | 4 (11.4%) |
| 6:00 AM to 6:29 AM | 17 (37.0%) | 0 (0.0%) |
| 6:30 AM to 6:59 AM | 6 (13.0%) | 0 (0.0%) |
| 7:00 AM to 7:29 AM | 7 (15.2%) | 0 (0.0%) |
| 7:30 AM to 7:59 AM | 6 (13.0%) | 7 (20.0%) |
| 8:00 AM to 8:29 AM | 0 (0.0%) | 20 (57.1%) |
| 8:30 AM to 8:59 AM | 0 (0.0%) | 0 (0.0%) |
| 9:00 AM to 9:59 AM | 0 (0.0%) | 0 (0.0%) |
| 10:00 AM to 10:59 AM | 0 (0.0%) | 4 (11.4%) |
| 11:00 AM to 11:59 AM | 0 (0.0%) | 0 (0.0%) |
| 12:00 PM to 3:59 PM | 0 (0.0%) | 0 (0.0%) |
| 4:00 PM to 11:59 PM | 0 (0.0%) | 0 (0.0%) |
| Total | 46 (100.0%) | 35 (100.0%) |
Housing Occupancy in Harrellsville
Occupancy by Ownership in Harrellsville
Of the total 65 dwellings in Harrellsville, owner-occupied units account for 47 (72.3%), while renter-occupied units make up 18 (27.7%).
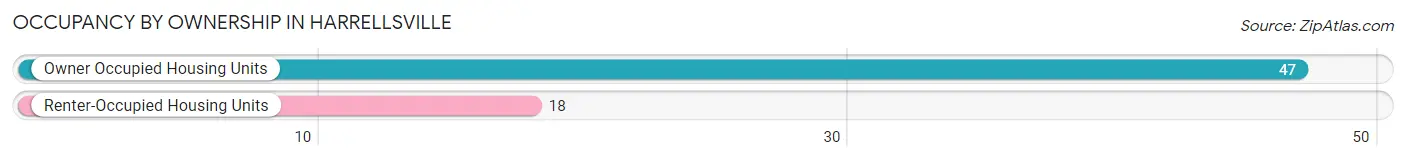
| Occupancy | # Housing Units | % Housing Units |
| Owner Occupied Housing Units | 47 | 72.3% |
| Renter-Occupied Housing Units | 18 | 27.7% |
| Total Occupied Housing Units | 65 | 100.0% |
Occupancy by Household Size in Harrellsville
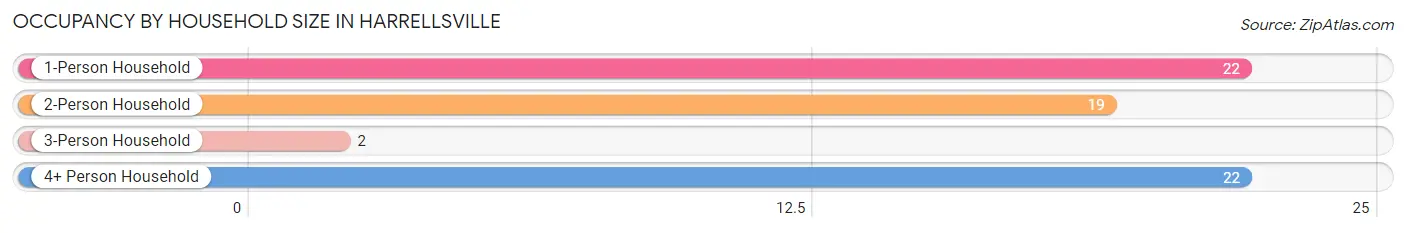
| Household Size | # Housing Units | % Housing Units |
| 1-Person Household | 22 | 33.9% |
| 2-Person Household | 19 | 29.2% |
| 3-Person Household | 2 | 3.1% |
| 4+ Person Household | 22 | 33.9% |
| Total Housing Units | 65 | 100.0% |
Occupancy by Ownership by Household Size in Harrellsville
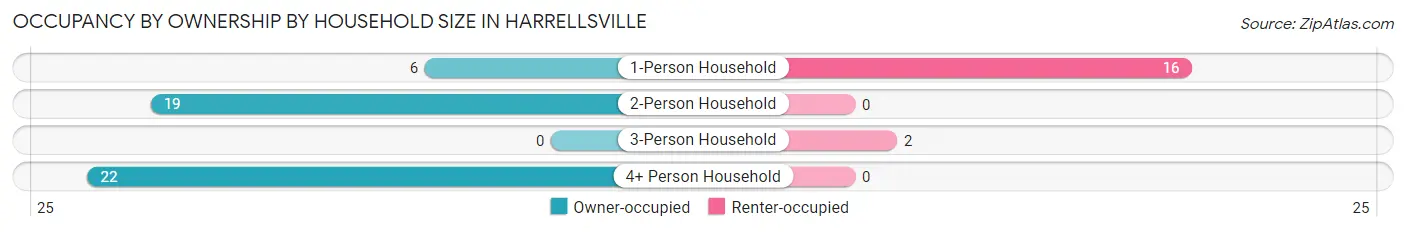
| Household Size | Owner-occupied | Renter-occupied |
| 1-Person Household | 6 (27.3%) | 16 (72.7%) |
| 2-Person Household | 19 (100.0%) | 0 (0.0%) |
| 3-Person Household | 0 (0.0%) | 2 (100.0%) |
| 4+ Person Household | 22 (100.0%) | 0 (0.0%) |
| Total Housing Units | 47 (72.3%) | 18 (27.7%) |
Occupancy by Educational Attainment in Harrellsville
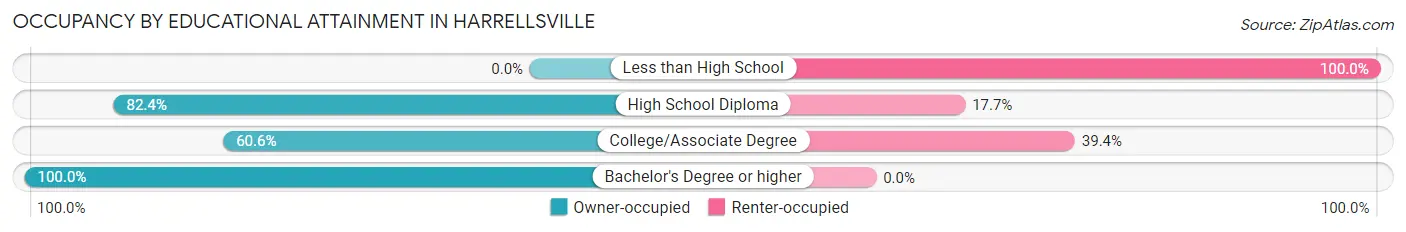
| Household Size | Owner-occupied | Renter-occupied |
| Less than High School | 0 (0.0%) | 2 (100.0%) |
| High School Diploma | 14 (82.4%) | 3 (17.6%) |
| College/Associate Degree | 20 (60.6%) | 13 (39.4%) |
| Bachelor's Degree or higher | 13 (100.0%) | 0 (0.0%) |
Occupancy by Age of Householder in Harrellsville
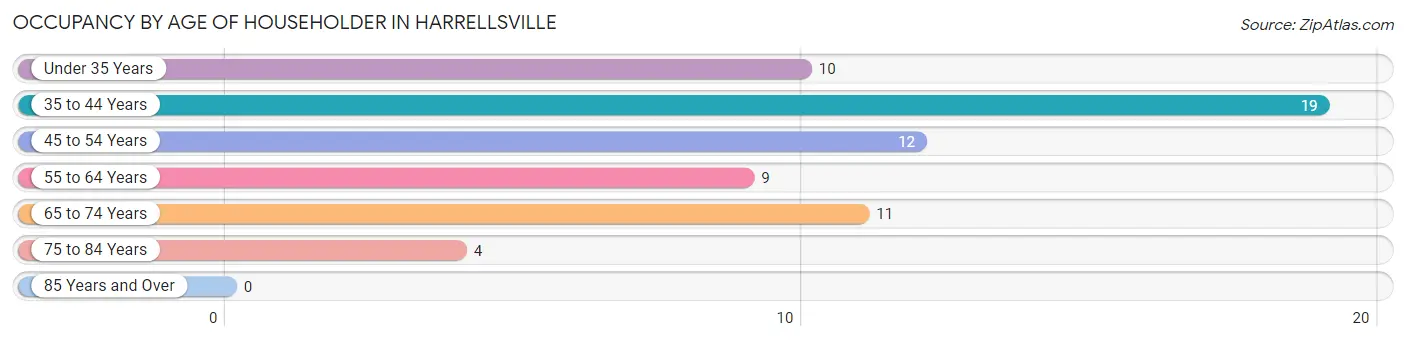
| Age Bracket | # Households | % Households |
| Under 35 Years | 10 | 15.4% |
| 35 to 44 Years | 19 | 29.2% |
| 45 to 54 Years | 12 | 18.5% |
| 55 to 64 Years | 9 | 13.9% |
| 65 to 74 Years | 11 | 16.9% |
| 75 to 84 Years | 4 | 6.1% |
| 85 Years and Over | 0 | 0.0% |
| Total | 65 | 100.0% |
Housing Finances in Harrellsville
Median Income by Occupancy in Harrellsville
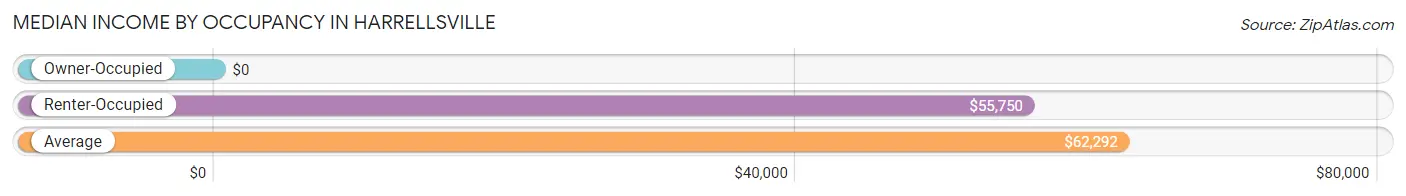
| Occupancy Type | # Households | Median Income |
| Owner-Occupied | 47 (72.3%) | $0 |
| Renter-Occupied | 18 (27.7%) | $55,750 |
| Average | 65 (100.0%) | $62,292 |
Occupancy by Householder Income Bracket in Harrellsville
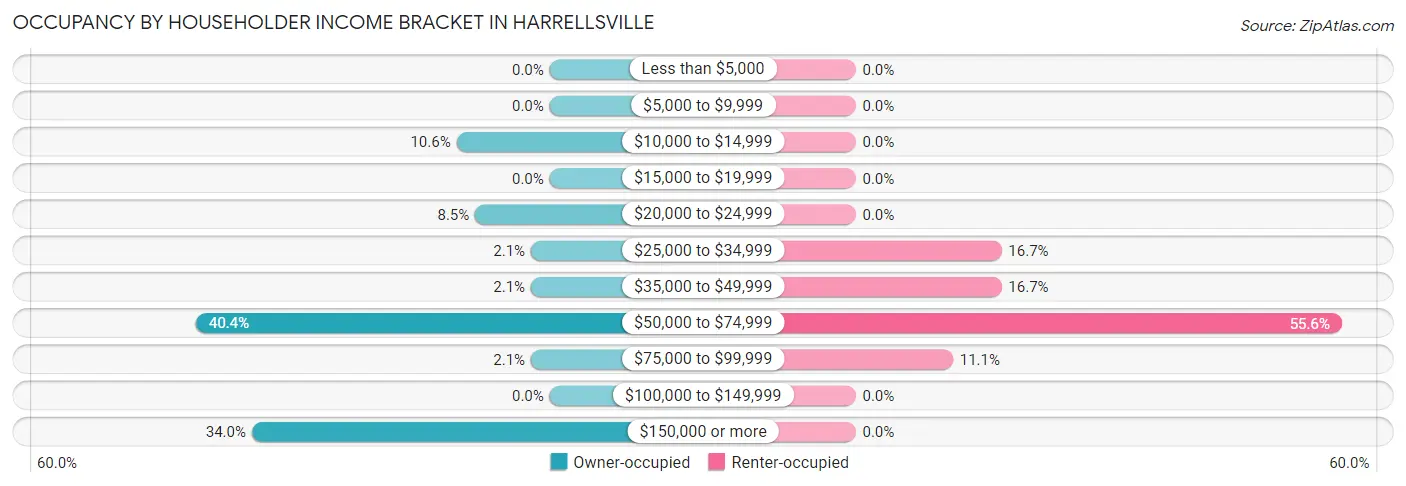
| Income Bracket | Owner-occupied | Renter-occupied |
| Less than $5,000 | 0 (0.0%) | 0 (0.0%) |
| $5,000 to $9,999 | 0 (0.0%) | 0 (0.0%) |
| $10,000 to $14,999 | 5 (10.6%) | 0 (0.0%) |
| $15,000 to $19,999 | 0 (0.0%) | 0 (0.0%) |
| $20,000 to $24,999 | 4 (8.5%) | 0 (0.0%) |
| $25,000 to $34,999 | 1 (2.1%) | 3 (16.7%) |
| $35,000 to $49,999 | 1 (2.1%) | 3 (16.7%) |
| $50,000 to $74,999 | 19 (40.4%) | 10 (55.6%) |
| $75,000 to $99,999 | 1 (2.1%) | 2 (11.1%) |
| $100,000 to $149,999 | 0 (0.0%) | 0 (0.0%) |
| $150,000 or more | 16 (34.0%) | 0 (0.0%) |
| Total | 47 (100.0%) | 18 (100.0%) |
Monthly Housing Cost Tiers in Harrellsville
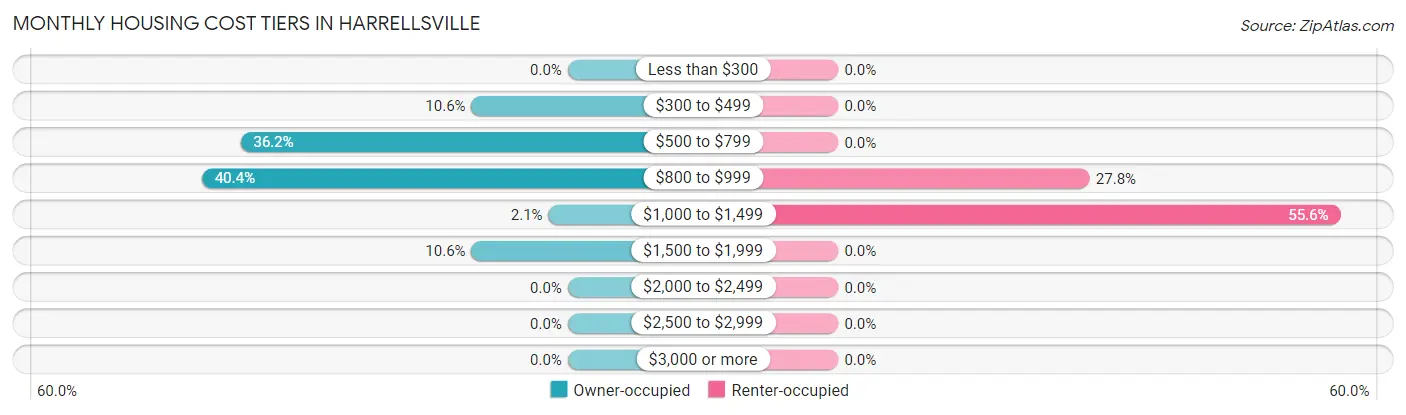
| Monthly Cost | Owner-occupied | Renter-occupied |
| Less than $300 | 0 (0.0%) | 0 (0.0%) |
| $300 to $499 | 5 (10.6%) | 0 (0.0%) |
| $500 to $799 | 17 (36.2%) | 0 (0.0%) |
| $800 to $999 | 19 (40.4%) | 5 (27.8%) |
| $1,000 to $1,499 | 1 (2.1%) | 10 (55.6%) |
| $1,500 to $1,999 | 5 (10.6%) | 0 (0.0%) |
| $2,000 to $2,499 | 0 (0.0%) | 0 (0.0%) |
| $2,500 to $2,999 | 0 (0.0%) | 0 (0.0%) |
| $3,000 or more | 0 (0.0%) | 0 (0.0%) |
| Total | 47 (100.0%) | 18 (100.0%) |
Physical Housing Characteristics in Harrellsville
Housing Structures in Harrellsville
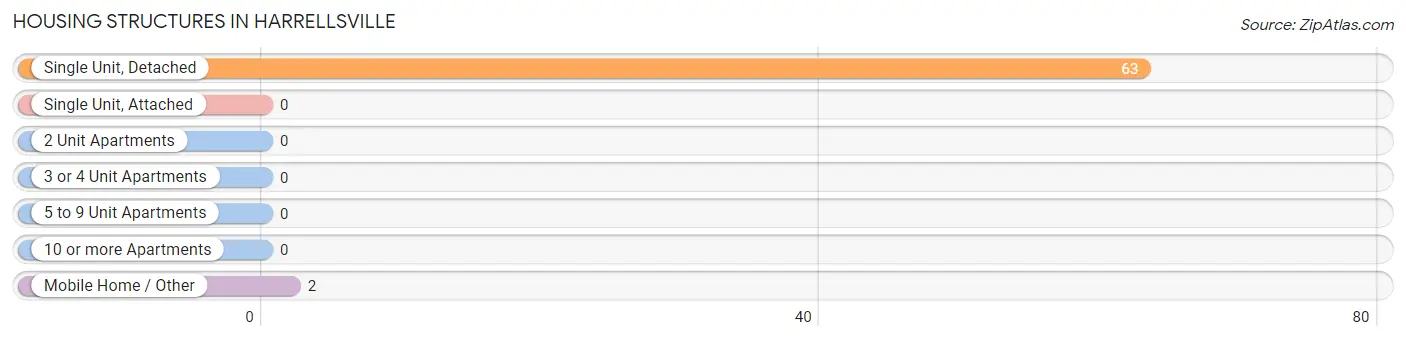
| Structure Type | # Housing Units | % Housing Units |
| Single Unit, Detached | 63 | 96.9% |
| Single Unit, Attached | 0 | 0.0% |
| 2 Unit Apartments | 0 | 0.0% |
| 3 or 4 Unit Apartments | 0 | 0.0% |
| 5 to 9 Unit Apartments | 0 | 0.0% |
| 10 or more Apartments | 0 | 0.0% |
| Mobile Home / Other | 2 | 3.1% |
| Total | 65 | 100.0% |
Housing Structures by Occupancy in Harrellsville
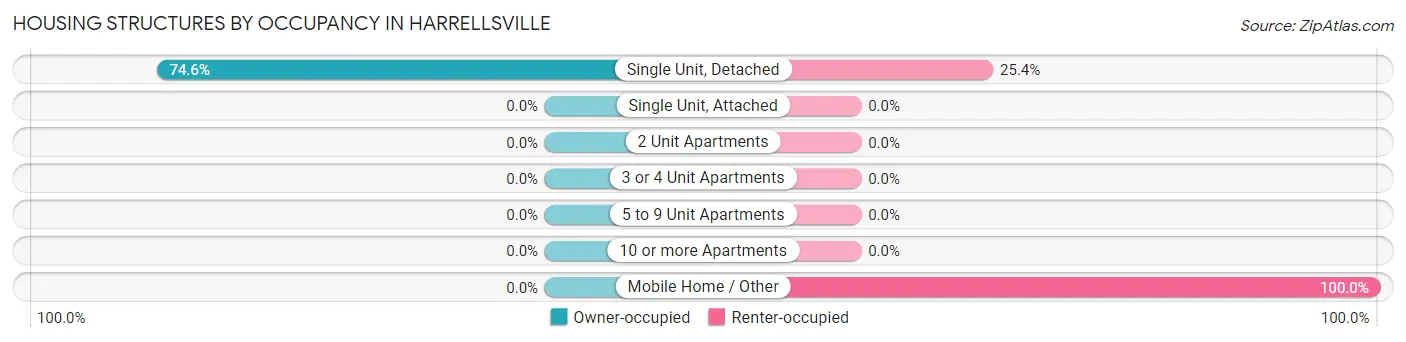
| Structure Type | Owner-occupied | Renter-occupied |
| Single Unit, Detached | 47 (74.6%) | 16 (25.4%) |
| Single Unit, Attached | 0 (0.0%) | 0 (0.0%) |
| 2 Unit Apartments | 0 (0.0%) | 0 (0.0%) |
| 3 or 4 Unit Apartments | 0 (0.0%) | 0 (0.0%) |
| 5 to 9 Unit Apartments | 0 (0.0%) | 0 (0.0%) |
| 10 or more Apartments | 0 (0.0%) | 0 (0.0%) |
| Mobile Home / Other | 0 (0.0%) | 2 (100.0%) |
| Total | 47 (72.3%) | 18 (27.7%) |
Housing Structures by Number of Rooms in Harrellsville
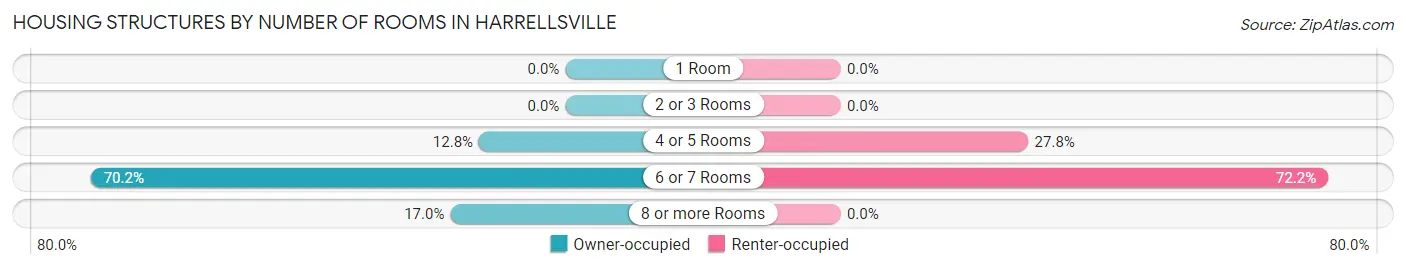
| Number of Rooms | Owner-occupied | Renter-occupied |
| 1 Room | 0 (0.0%) | 0 (0.0%) |
| 2 or 3 Rooms | 0 (0.0%) | 0 (0.0%) |
| 4 or 5 Rooms | 6 (12.8%) | 5 (27.8%) |
| 6 or 7 Rooms | 33 (70.2%) | 13 (72.2%) |
| 8 or more Rooms | 8 (17.0%) | 0 (0.0%) |
| Total | 47 (100.0%) | 18 (100.0%) |
Housing Structure by Heating Type in Harrellsville
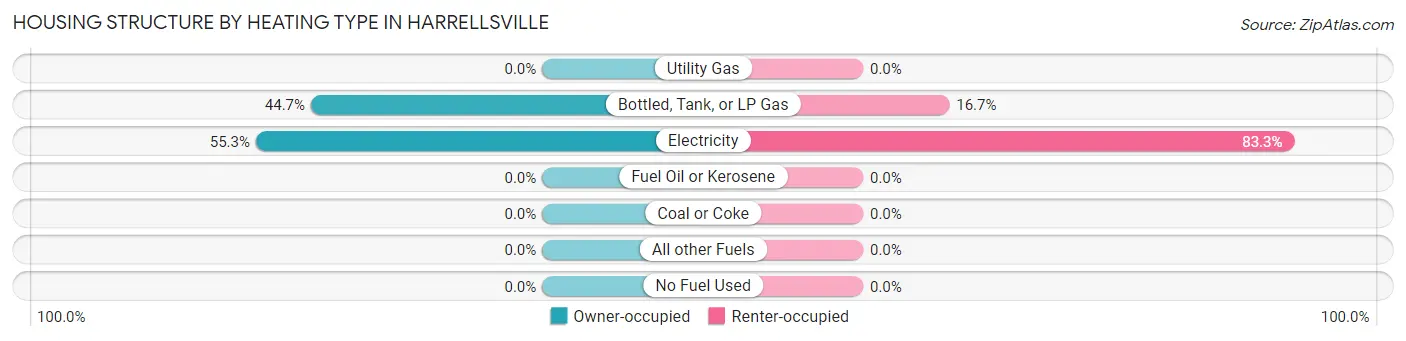
| Heating Type | Owner-occupied | Renter-occupied |
| Utility Gas | 0 (0.0%) | 0 (0.0%) |
| Bottled, Tank, or LP Gas | 21 (44.7%) | 3 (16.7%) |
| Electricity | 26 (55.3%) | 15 (83.3%) |
| Fuel Oil or Kerosene | 0 (0.0%) | 0 (0.0%) |
| Coal or Coke | 0 (0.0%) | 0 (0.0%) |
| All other Fuels | 0 (0.0%) | 0 (0.0%) |
| No Fuel Used | 0 (0.0%) | 0 (0.0%) |
| Total | 47 (100.0%) | 18 (100.0%) |
Household Vehicle Usage in Harrellsville
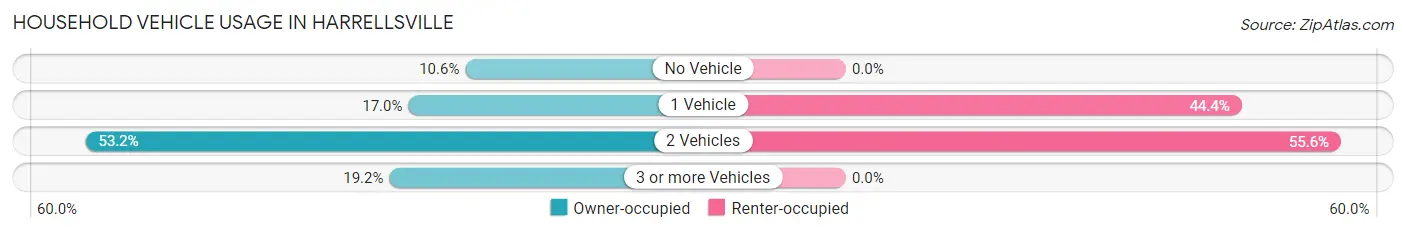
| Vehicles per Household | Owner-occupied | Renter-occupied |
| No Vehicle | 5 (10.6%) | 0 (0.0%) |
| 1 Vehicle | 8 (17.0%) | 8 (44.4%) |
| 2 Vehicles | 25 (53.2%) | 10 (55.6%) |
| 3 or more Vehicles | 9 (19.2%) | 0 (0.0%) |
| Total | 47 (100.0%) | 18 (100.0%) |
Real Estate & Mortgages in Harrellsville
Real Estate and Mortgage Overview in Harrellsville
| Characteristic | Without Mortgage | With Mortgage |
| Housing Units | 21 | 26 |
| Median Property Value | $109,700 | $151,800 |
| Median Household Income | $193,750 | $0 |
| Monthly Housing Costs | $679 | $0 |
| Real Estate Taxes | $986 | $0 |
Property Value by Mortgage Status in Harrellsville
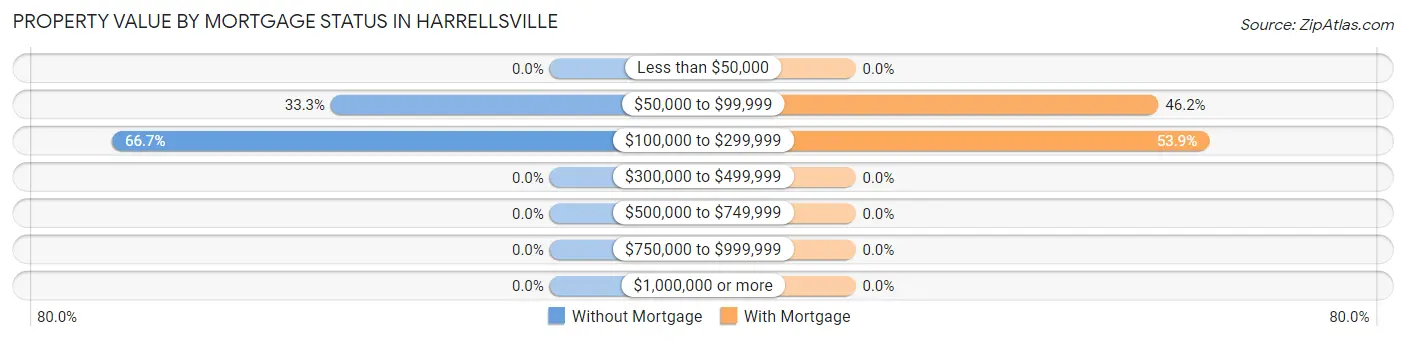
| Property Value | Without Mortgage | With Mortgage |
| Less than $50,000 | 0 (0.0%) | 0 (0.0%) |
| $50,000 to $99,999 | 7 (33.3%) | 12 (46.2%) |
| $100,000 to $299,999 | 14 (66.7%) | 14 (53.8%) |
| $300,000 to $499,999 | 0 (0.0%) | 0 (0.0%) |
| $500,000 to $749,999 | 0 (0.0%) | 0 (0.0%) |
| $750,000 to $999,999 | 0 (0.0%) | 0 (0.0%) |
| $1,000,000 or more | 0 (0.0%) | 0 (0.0%) |
| Total | 21 (100.0%) | 26 (100.0%) |
Household Income by Mortgage Status in Harrellsville
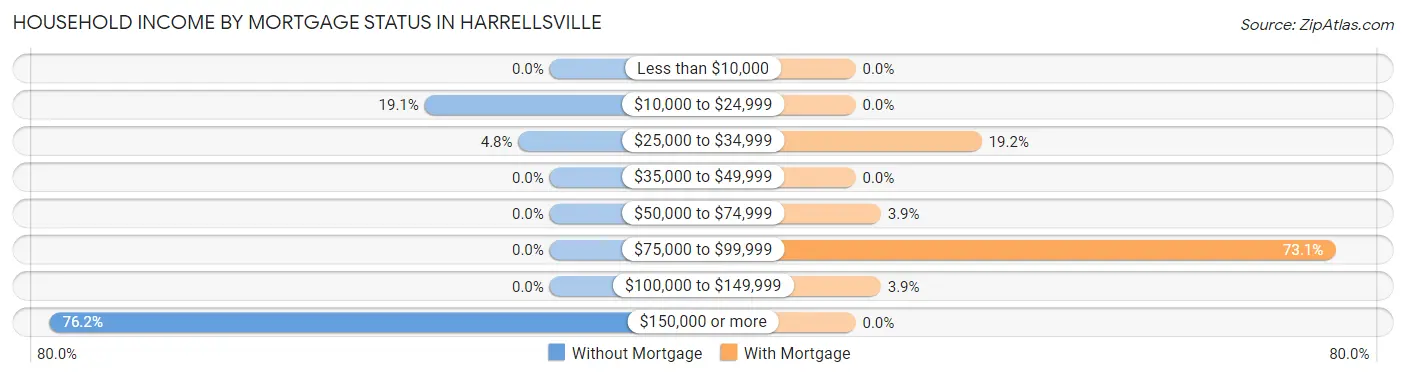
| Household Income | Without Mortgage | With Mortgage |
| Less than $10,000 | 0 (0.0%) | 0 (0.0%) |
| $10,000 to $24,999 | 4 (19.1%) | 0 (0.0%) |
| $25,000 to $34,999 | 1 (4.8%) | 5 (19.2%) |
| $35,000 to $49,999 | 0 (0.0%) | 0 (0.0%) |
| $50,000 to $74,999 | 0 (0.0%) | 1 (3.8%) |
| $75,000 to $99,999 | 0 (0.0%) | 19 (73.1%) |
| $100,000 to $149,999 | 0 (0.0%) | 1 (3.8%) |
| $150,000 or more | 16 (76.2%) | 0 (0.0%) |
| Total | 21 (100.0%) | 26 (100.0%) |
Property Value to Household Income Ratio in Harrellsville
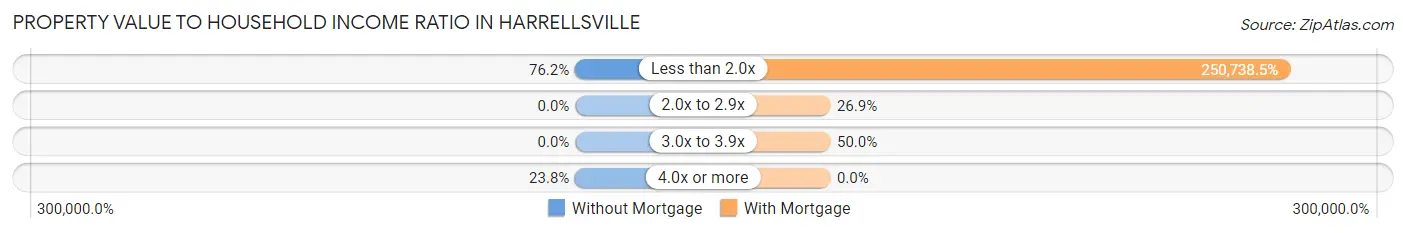
| Value-to-Income Ratio | Without Mortgage | With Mortgage |
| Less than 2.0x | 16 (76.2%) | 65,192 (250,738.5%) |
| 2.0x to 2.9x | 0 (0.0%) | 7 (26.9%) |
| 3.0x to 3.9x | 0 (0.0%) | 13 (50.0%) |
| 4.0x or more | 5 (23.8%) | 0 (0.0%) |
| Total | 21 (100.0%) | 26 (100.0%) |
Real Estate Taxes by Mortgage Status in Harrellsville
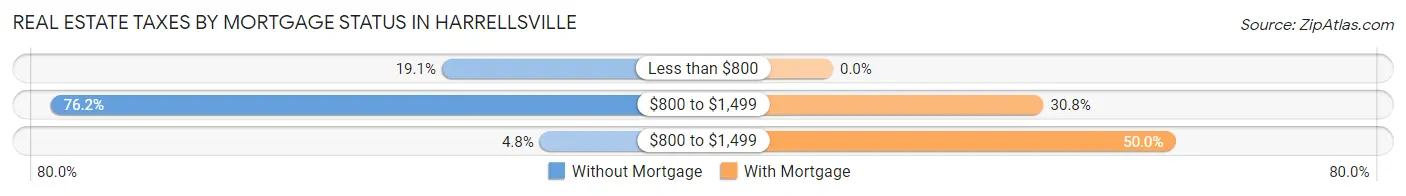
| Property Taxes | Without Mortgage | With Mortgage |
| Less than $800 | 4 (19.1%) | 0 (0.0%) |
| $800 to $1,499 | 16 (76.2%) | 8 (30.8%) |
| $800 to $1,499 | 1 (4.8%) | 13 (50.0%) |
| Total | 21 (100.0%) | 26 (100.0%) |
Health & Disability in Harrellsville
Health Insurance Coverage by Age in Harrellsville
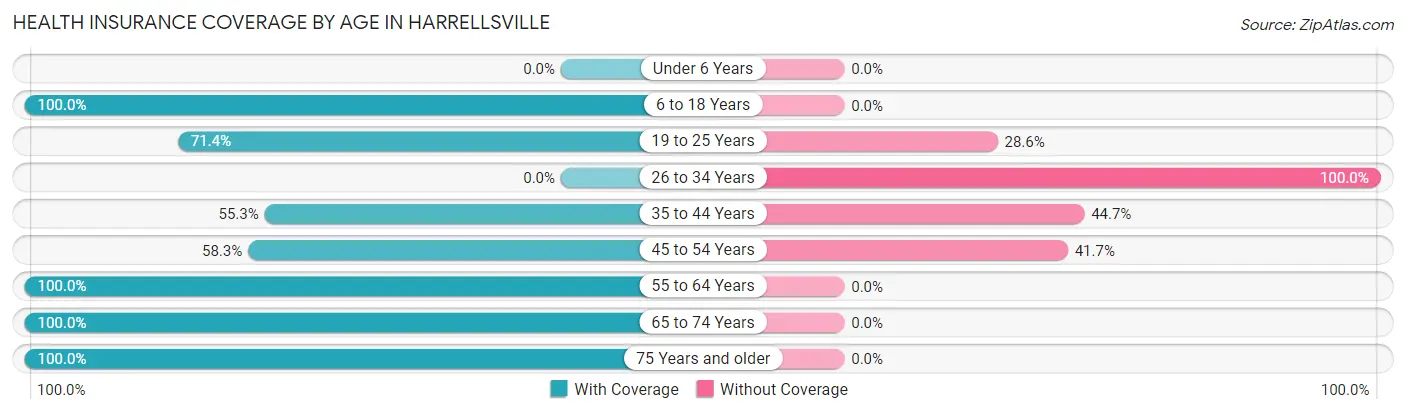
| Age Bracket | With Coverage | Without Coverage |
| Under 6 Years | 0 (0.0%) | 0 (0.0%) |
| 6 to 18 Years | 60 (100.0%) | 0 (0.0%) |
| 19 to 25 Years | 10 (71.4%) | 4 (28.6%) |
| 26 to 34 Years | 0 (0.0%) | 3 (100.0%) |
| 35 to 44 Years | 21 (55.3%) | 17 (44.7%) |
| 45 to 54 Years | 35 (58.3%) | 25 (41.7%) |
| 55 to 64 Years | 9 (100.0%) | 0 (0.0%) |
| 65 to 74 Years | 19 (100.0%) | 0 (0.0%) |
| 75 Years and older | 5 (100.0%) | 0 (0.0%) |
| Total | 159 (76.4%) | 49 (23.6%) |
Health Insurance Coverage by Citizenship Status in Harrellsville
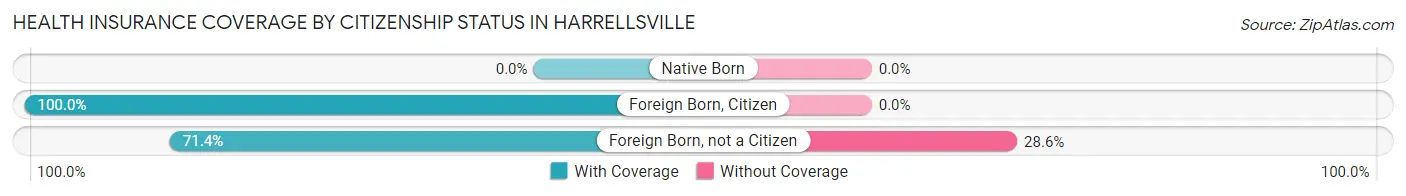
| Citizenship Status | With Coverage | Without Coverage |
| Native Born | 0 (0.0%) | 0 (0.0%) |
| Foreign Born, Citizen | 60 (100.0%) | 0 (0.0%) |
| Foreign Born, not a Citizen | 10 (71.4%) | 4 (28.6%) |
Health Insurance Coverage by Household Income in Harrellsville
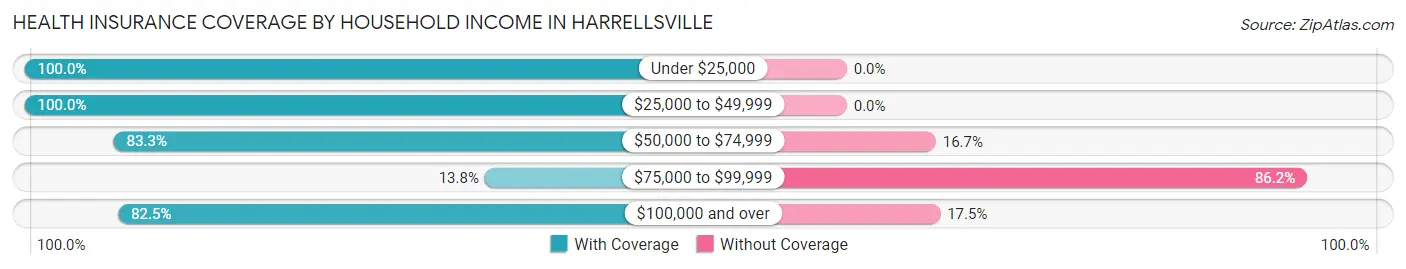
| Household Income | With Coverage | Without Coverage |
| Under $25,000 | 28 (100.0%) | 0 (0.0%) |
| $25,000 to $49,999 | 9 (100.0%) | 0 (0.0%) |
| $50,000 to $74,999 | 85 (83.3%) | 17 (16.7%) |
| $75,000 to $99,999 | 4 (13.8%) | 25 (86.2%) |
| $100,000 and over | 33 (82.5%) | 7 (17.5%) |
Public vs Private Health Insurance Coverage by Age in Harrellsville
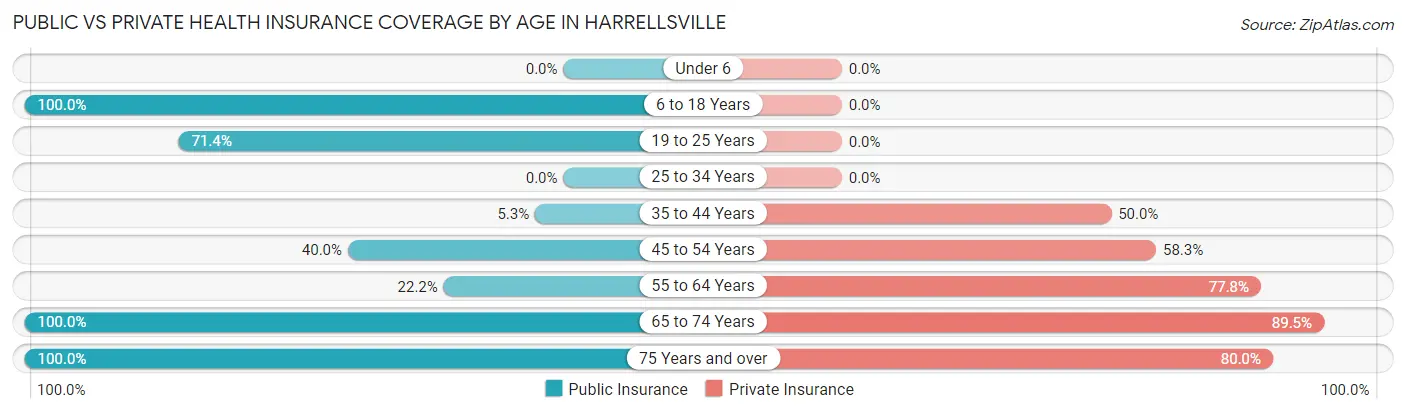
| Age Bracket | Public Insurance | Private Insurance |
| Under 6 | 0 (0.0%) | 0 (0.0%) |
| 6 to 18 Years | 60 (100.0%) | 0 (0.0%) |
| 19 to 25 Years | 10 (71.4%) | 0 (0.0%) |
| 25 to 34 Years | 0 (0.0%) | 0 (0.0%) |
| 35 to 44 Years | 2 (5.3%) | 19 (50.0%) |
| 45 to 54 Years | 24 (40.0%) | 35 (58.3%) |
| 55 to 64 Years | 2 (22.2%) | 7 (77.8%) |
| 65 to 74 Years | 19 (100.0%) | 17 (89.5%) |
| 75 Years and over | 5 (100.0%) | 4 (80.0%) |
| Total | 122 (58.7%) | 82 (39.4%) |
Disability Status by Sex by Age in Harrellsville
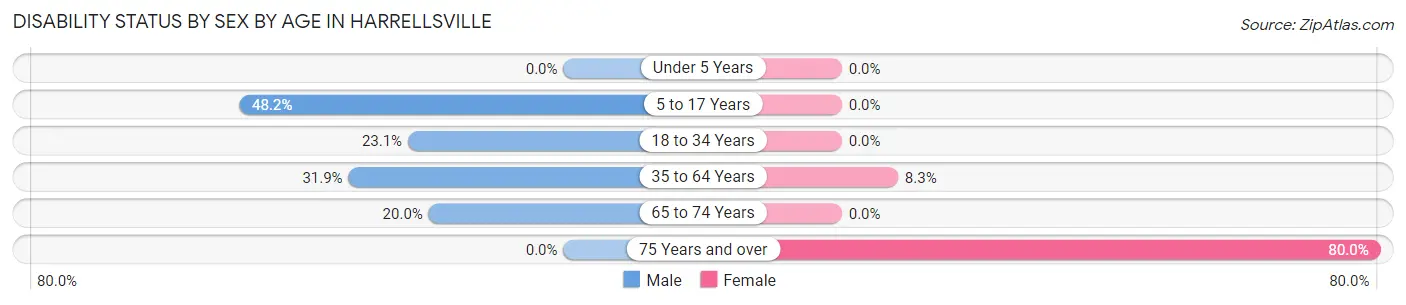
| Age Bracket | Male | Female |
| Under 5 Years | 0 (0.0%) | 0 (0.0%) |
| 5 to 17 Years | 13 (48.1%) | 0 (0.0%) |
| 18 to 34 Years | 3 (23.1%) | 0 (0.0%) |
| 35 to 64 Years | 15 (31.9%) | 5 (8.3%) |
| 65 to 74 Years | 2 (20.0%) | 0 (0.0%) |
| 75 Years and over | 0 (0.0%) | 4 (80.0%) |
Disability Class by Sex by Age in Harrellsville
Disability Class: Hearing Difficulty
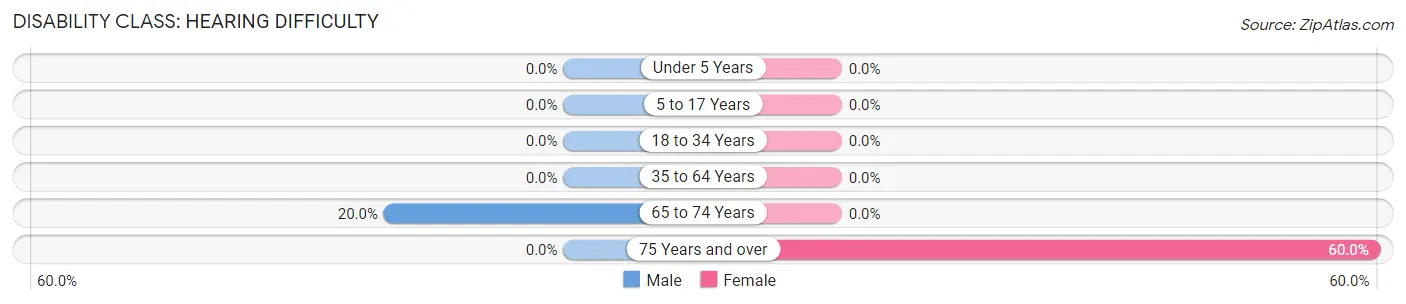
| Age Bracket | Male | Female |
| Under 5 Years | 0 (0.0%) | 0 (0.0%) |
| 5 to 17 Years | 0 (0.0%) | 0 (0.0%) |
| 18 to 34 Years | 0 (0.0%) | 0 (0.0%) |
| 35 to 64 Years | 0 (0.0%) | 0 (0.0%) |
| 65 to 74 Years | 2 (20.0%) | 0 (0.0%) |
| 75 Years and over | 0 (0.0%) | 3 (60.0%) |
Disability Class: Vision Difficulty
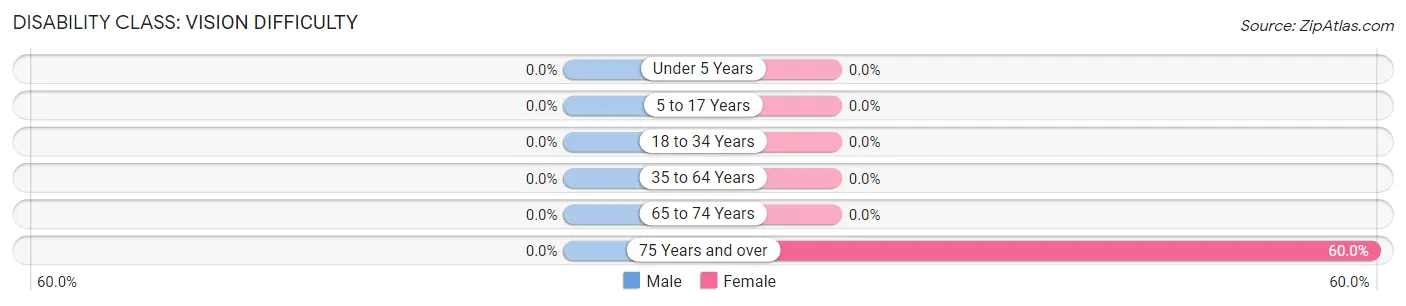
| Age Bracket | Male | Female |
| Under 5 Years | 0 (0.0%) | 0 (0.0%) |
| 5 to 17 Years | 0 (0.0%) | 0 (0.0%) |
| 18 to 34 Years | 0 (0.0%) | 0 (0.0%) |
| 35 to 64 Years | 0 (0.0%) | 0 (0.0%) |
| 65 to 74 Years | 0 (0.0%) | 0 (0.0%) |
| 75 Years and over | 0 (0.0%) | 3 (60.0%) |
Disability Class: Cognitive Difficulty
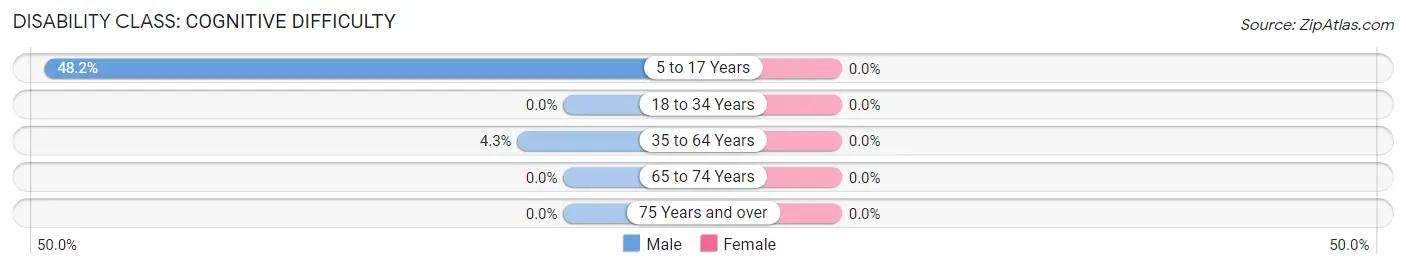
| Age Bracket | Male | Female |
| 5 to 17 Years | 13 (48.1%) | 0 (0.0%) |
| 18 to 34 Years | 0 (0.0%) | 0 (0.0%) |
| 35 to 64 Years | 2 (4.3%) | 0 (0.0%) |
| 65 to 74 Years | 0 (0.0%) | 0 (0.0%) |
| 75 Years and over | 0 (0.0%) | 0 (0.0%) |
Disability Class: Ambulatory Difficulty
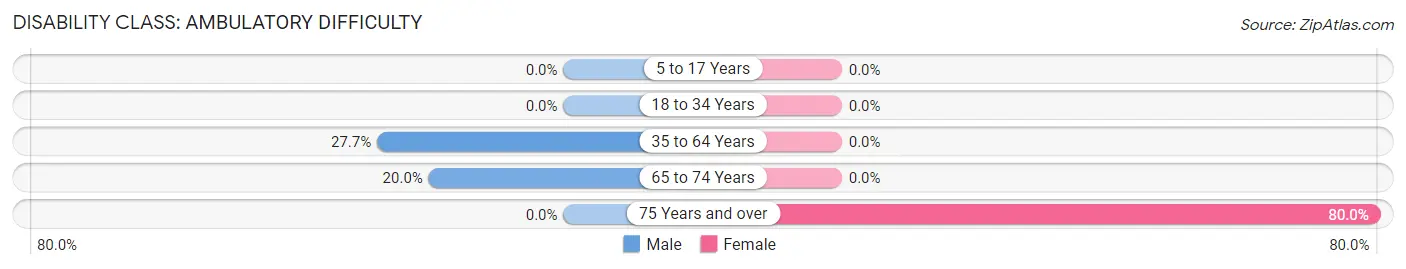
| Age Bracket | Male | Female |
| 5 to 17 Years | 0 (0.0%) | 0 (0.0%) |
| 18 to 34 Years | 0 (0.0%) | 0 (0.0%) |
| 35 to 64 Years | 13 (27.7%) | 0 (0.0%) |
| 65 to 74 Years | 2 (20.0%) | 0 (0.0%) |
| 75 Years and over | 0 (0.0%) | 4 (80.0%) |
Disability Class: Self-Care Difficulty
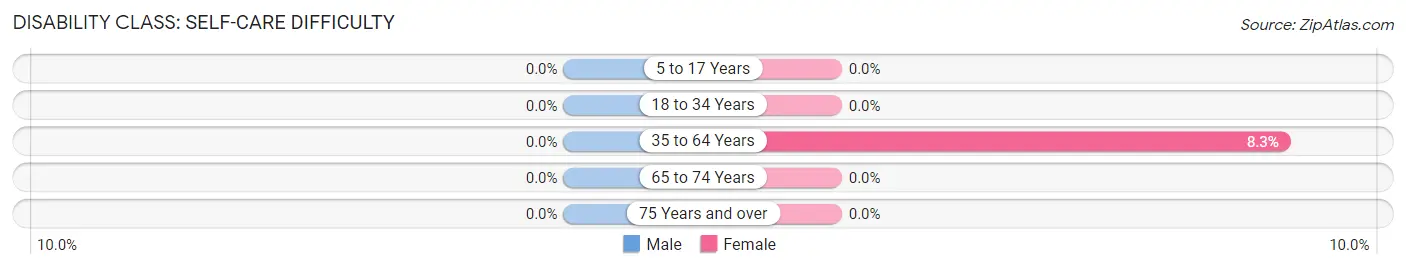
| Age Bracket | Male | Female |
| 5 to 17 Years | 0 (0.0%) | 0 (0.0%) |
| 18 to 34 Years | 0 (0.0%) | 0 (0.0%) |
| 35 to 64 Years | 0 (0.0%) | 5 (8.3%) |
| 65 to 74 Years | 0 (0.0%) | 0 (0.0%) |
| 75 Years and over | 0 (0.0%) | 0 (0.0%) |
Technology Access in Harrellsville
Computing Device Access in Harrellsville
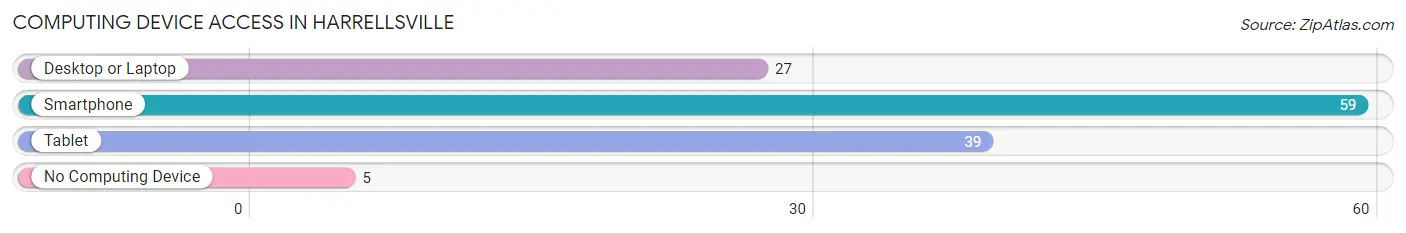
| Device Type | # Households | % Households |
| Desktop or Laptop | 27 | 41.5% |
| Smartphone | 59 | 90.8% |
| Tablet | 39 | 60.0% |
| No Computing Device | 5 | 7.7% |
| Total | 65 | 100.0% |
Internet Access in Harrellsville
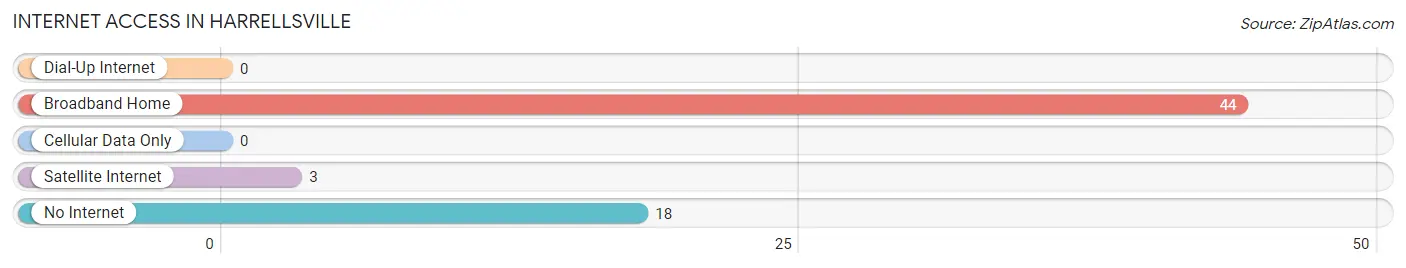
| Internet Type | # Households | % Households |
| Dial-Up Internet | 0 | 0.0% |
| Broadband Home | 44 | 67.7% |
| Cellular Data Only | 0 | 0.0% |
| Satellite Internet | 3 | 4.6% |
| No Internet | 18 | 27.7% |
| Total | 65 | 100.0% |
Harrellsville Summary
Harrellsville is a small town located in North Carolina, United States. It is situated in the northeastern part of the state, in Hertford County. The town has a population of approximately 500 people, and is part of the Ahoskie Micropolitan Statistical Area.
History
Harrellsville was founded in 1820 by William Harrell, a Revolutionary War veteran. The town was originally known as Harrellsville, but the name was changed to Harrellsville in 1883. The town was incorporated in 1887.
Harrellsville was a thriving agricultural community in the late 19th and early 20th centuries. The town was home to several cotton mills, a sawmill, and a gristmill. The town also had a post office, a bank, and a hotel.
Geography
Harrellsville is located in the northeastern part of North Carolina, in Hertford County. The town is situated on the banks of the Chowan River, and is surrounded by the towns of Ahoskie, Murfreesboro, and Winton. The town is located approximately 30 miles from the Virginia border.
The town has a total area of 0.7 square miles, all of which is land. The terrain is mostly flat, with some rolling hills. The climate is humid subtropical, with hot, humid summers and mild winters.
Economy
Harrellsville’s economy is largely based on agriculture. The town is home to several farms, which produce a variety of crops, including corn, soybeans, cotton, and tobacco. The town also has a few small businesses, including a grocery store, a hardware store, and a restaurant.
Demographics
As of the 2010 census, Harrellsville had a population of 500 people. The racial makeup of the town was 95.2% White, 2.2% African American, 0.6% Native American, 0.2% Asian, and 1.8% from other races. The median household income was $30,000, and the median family income was $35,000.
Conclusion
Harrellsville is a small town located in North Carolina, United States. It was founded in 1820 by William Harrell, and was incorporated in 1887. The town has a population of 500 people, and is largely based on agriculture. The town has a humid subtropical climate, and the median household income is $30,000. Harrellsville is a small, rural town with a rich history and a bright future.
Common Questions
What is Per Capita Income in Harrellsville?
Per Capita income in Harrellsville is $31,350.
What is the Median Household income in Harrellsville?
Median Household Income in Harrellsville is $62,292.
What is Income or Wage Gap in Harrellsville?
Income or Wage Gap in Harrellsville is 18.1%.
Women in Harrellsville earn 81.9 cents for every dollar earned by a man.
What is Inequality or Gini Index in Harrellsville?
Inequality or Gini Index in Harrellsville is 0.41.
What is the Total Population of Harrellsville?
Total Population of Harrellsville is 208.
What is the Total Male Population of Harrellsville?
Total Male Population of Harrellsville is 97.
What is the Total Female Population of Harrellsville?
Total Female Population of Harrellsville is 111.
What is the Ratio of Males per 100 Females in Harrellsville?
There are 87.39 Males per 100 Females in Harrellsville.
What is the Ratio of Females per 100 Males in Harrellsville?
There are 114.43 Females per 100 Males in Harrellsville.
What is the Median Population Age in Harrellsville?
Median Population Age in Harrellsville is 44.3 Years.
What is the Average Family Size in Harrellsville
Average Family Size in Harrellsville is 4.0 People.
What is the Average Household Size in Harrellsville
Average Household Size in Harrellsville is 3.2 People.
How Large is the Labor Force in Harrellsville?
There are 101 People in the Labor Forcein in Harrellsville.
What is the Percentage of People in the Labor Force in Harrellsville?
62.3% of People are in the Labor Force in Harrellsville.
What is the Unemployment Rate in Harrellsville?
Unemployment Rate in Harrellsville is 15.8%.