Halifax, NC Map & Demographics
Halifax Map
Halifax Overview
$35,805
PER CAPITA INCOME
$58,778
AVG FAMILY INCOME
$59,031
AVG HOUSEHOLD INCOME
0.16
INEQUALITY / GINI INDEX
227
TOTAL POPULATION
130
MALE POPULATION
97
FEMALE POPULATION
134.02
MALES / 100 FEMALES
74.62
FEMALES / 100 MALES
53.5
MEDIAN AGE
2.4
AVG FAMILY SIZE
1.7
AVG HOUSEHOLD SIZE
183
LABOR FORCE [ PEOPLE ]
89.3%
PERCENT IN LABOR FORCE
Halifax Zip Codes
Halifax Area Codes
Income in Halifax
Income Overview in Halifax
Per Capita Income in Halifax is $35,805, while median incomes of families and households are $58,778 and $59,031 respectively.
| Characteristic | Number | Measure |
| Per Capita Income | 227 | $35,805 |
| Median Family Income | 61 | $58,778 |
| Mean Family Income | 61 | $64,603 |
| Median Household Income | 132 | $59,031 |
| Mean Household Income | 132 | $59,875 |
| Income Deficit | 61 | $0 |
| Wage / Income Gap (%) | 227 | 0.00% |
| Wage / Income Gap ($) | 227 | 100.00¢ per $1 |
| Gini / Inequality Index | 227 | 0.16 |
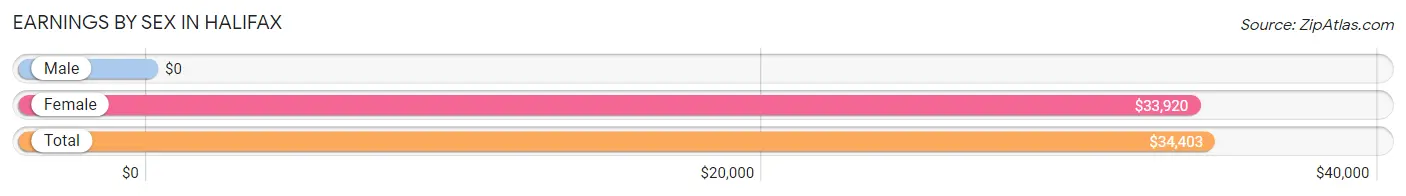
Earnings by Sex in Halifax
| Sex | Number | Average Earnings |
| Male | 109 (59.6%) | $0 |
| Female | 74 (40.4%) | $33,920 |
| Total | 183 (100.0%) | $34,403 |
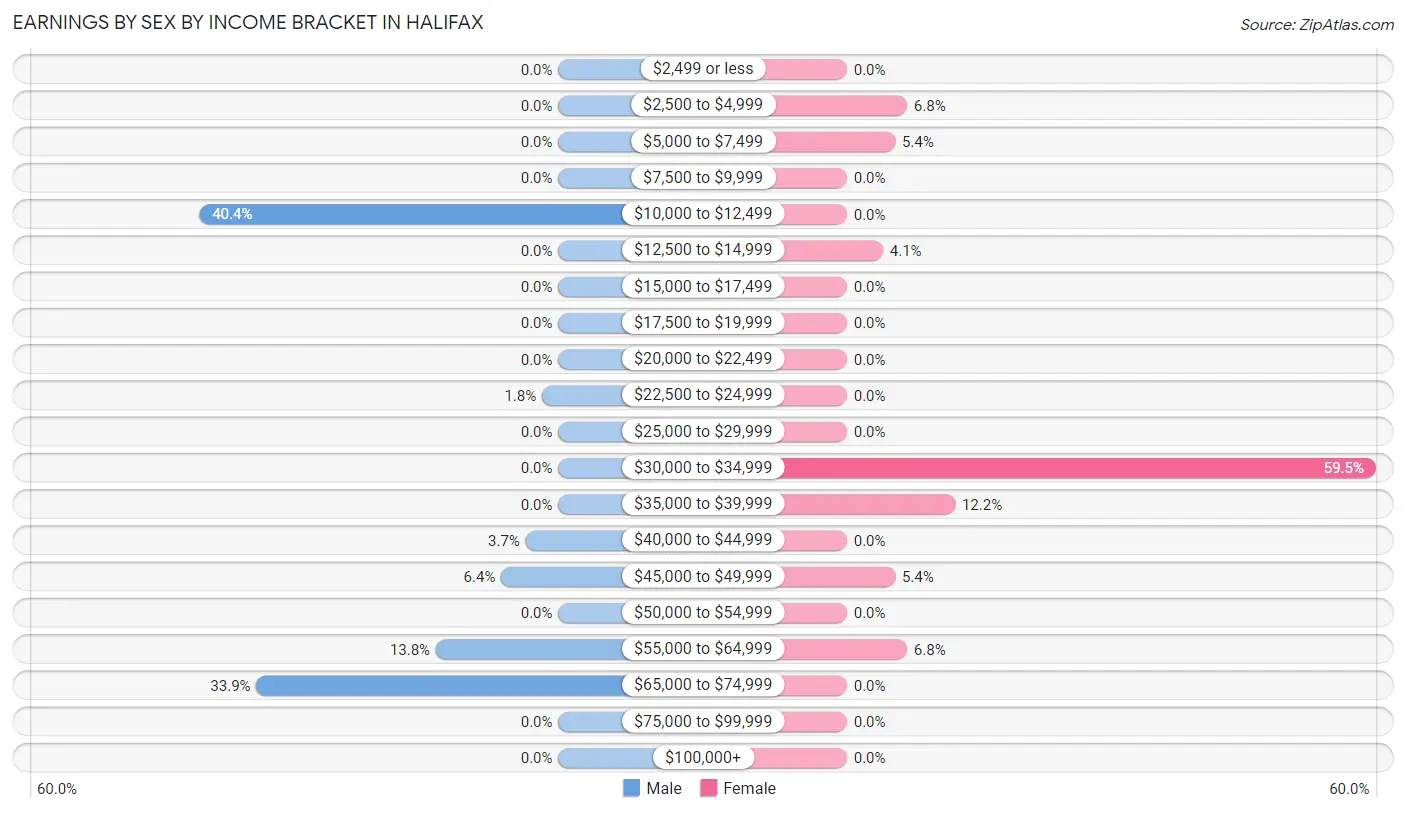
Earnings by Sex by Income Bracket in Halifax
The most common earnings brackets in Halifax are $10,000 to $12,499 for men (44 | 40.4%) and $30,000 to $34,999 for women (44 | 59.5%).
| Income | Male | Female |
| $2,499 or less | 0 (0.0%) | 0 (0.0%) |
| $2,500 to $4,999 | 0 (0.0%) | 5 (6.8%) |
| $5,000 to $7,499 | 0 (0.0%) | 4 (5.4%) |
| $7,500 to $9,999 | 0 (0.0%) | 0 (0.0%) |
| $10,000 to $12,499 | 44 (40.4%) | 0 (0.0%) |
| $12,500 to $14,999 | 0 (0.0%) | 3 (4.1%) |
| $15,000 to $17,499 | 0 (0.0%) | 0 (0.0%) |
| $17,500 to $19,999 | 0 (0.0%) | 0 (0.0%) |
| $20,000 to $22,499 | 0 (0.0%) | 0 (0.0%) |
| $22,500 to $24,999 | 2 (1.8%) | 0 (0.0%) |
| $25,000 to $29,999 | 0 (0.0%) | 0 (0.0%) |
| $30,000 to $34,999 | 0 (0.0%) | 44 (59.5%) |
| $35,000 to $39,999 | 0 (0.0%) | 9 (12.2%) |
| $40,000 to $44,999 | 4 (3.7%) | 0 (0.0%) |
| $45,000 to $49,999 | 7 (6.4%) | 4 (5.4%) |
| $50,000 to $54,999 | 0 (0.0%) | 0 (0.0%) |
| $55,000 to $64,999 | 15 (13.8%) | 5 (6.8%) |
| $65,000 to $74,999 | 37 (33.9%) | 0 (0.0%) |
| $75,000 to $99,999 | 0 (0.0%) | 0 (0.0%) |
| $100,000+ | 0 (0.0%) | 0 (0.0%) |
| Total | 109 (100.0%) | 74 (100.0%) |
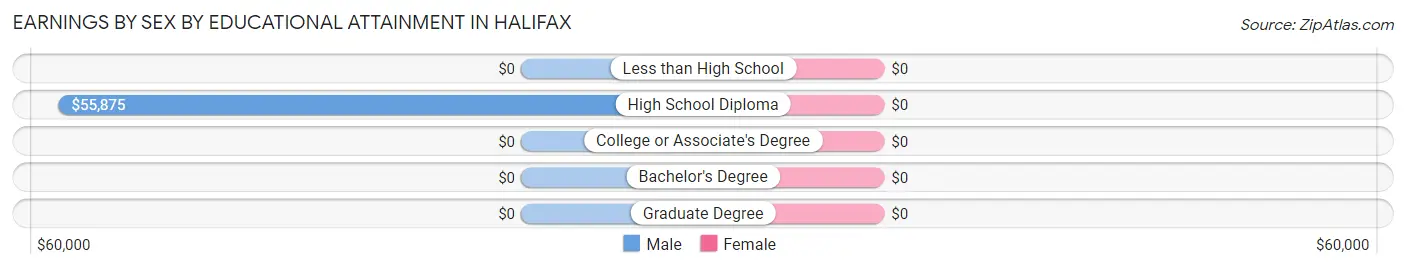
Earnings by Sex by Educational Attainment in Halifax
| Educational Attainment | Male Income | Female Income |
| Less than High School | - | - |
| High School Diploma | $55,875 | $0 |
| College or Associate's Degree | - | - |
| Bachelor's Degree | - | - |
| Graduate Degree | - | - |
| Total | - | - |
Family Income in Halifax
Family Income Brackets in Halifax
According to the Halifax family income data, there are 52 families falling into the $50,000 to $74,999 income range, which is the most common income bracket and makes up 85.3% of all families.
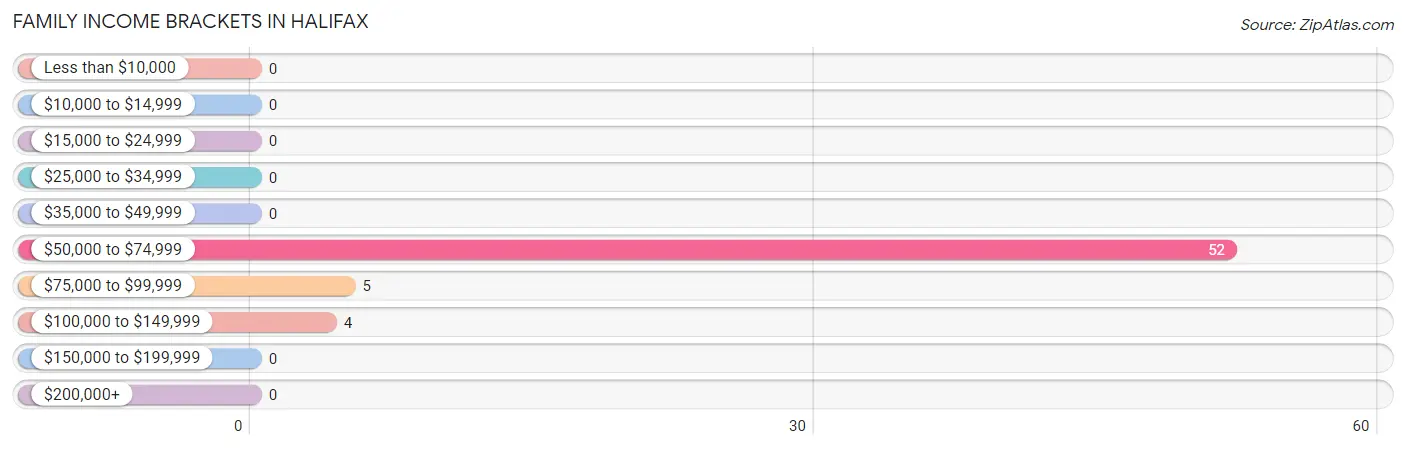
| Income Bracket | # Families | % Families |
| Less than $10,000 | 0 | 0.0% |
| $10,000 to $14,999 | 0 | 0.0% |
| $15,000 to $24,999 | 0 | 0.0% |
| $25,000 to $34,999 | 0 | 0.0% |
| $35,000 to $49,999 | 0 | 0.0% |
| $50,000 to $74,999 | 52 | 85.2% |
| $75,000 to $99,999 | 5 | 8.2% |
| $100,000 to $149,999 | 4 | 6.6% |
| $150,000 to $199,999 | 0 | 0.0% |
| $200,000+ | 0 | 0.0% |
Family Income by Famaliy Size in Halifax
2-person families (53 | 86.9%) account for the highest median family income in Halifax with $58,778 per family, while 2-person families (53 | 86.9%) have the highest median income of $29,389 per family member.
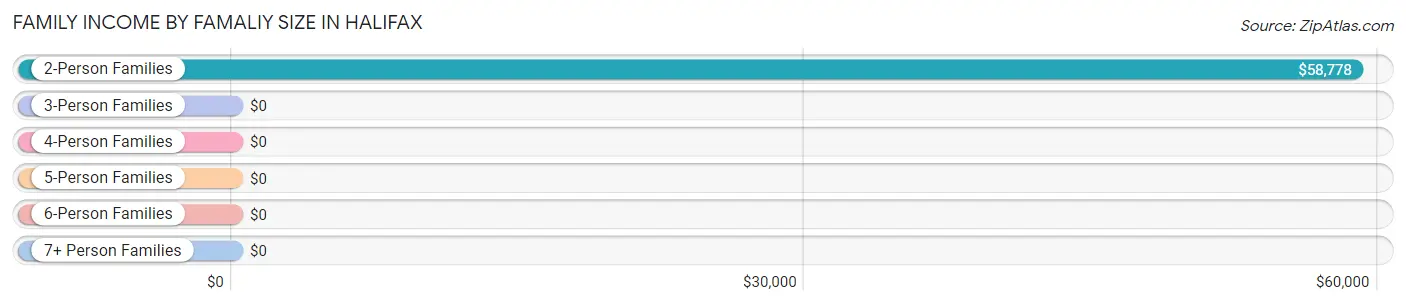
| Income Bracket | # Families | Median Income |
| 2-Person Families | 53 (86.9%) | $58,778 |
| 3-Person Families | 0 (0.0%) | $0 |
| 4-Person Families | 4 (6.6%) | $0 |
| 5-Person Families | 4 (6.6%) | $0 |
| 6-Person Families | 0 (0.0%) | $0 |
| 7+ Person Families | 0 (0.0%) | $0 |
| Total | 61 (100.0%) | $58,778 |
Family Income by Number of Earners in Halifax
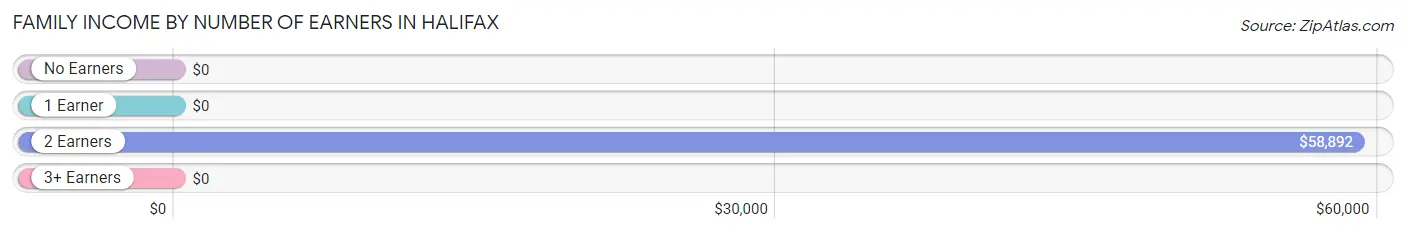
| Number of Earners | # Families | Median Income |
| No Earners | 0 (0.0%) | $0 |
| 1 Earner | 4 (6.6%) | $0 |
| 2 Earners | 57 (93.4%) | $58,892 |
| 3+ Earners | 0 (0.0%) | $0 |
| Total | 61 (100.0%) | $58,778 |
Household Income in Halifax
Household Income Brackets in Halifax
With 104 households falling in the category, the $50,000 to $74,999 income range is the most frequent in Halifax, accounting for 78.8% of all households.
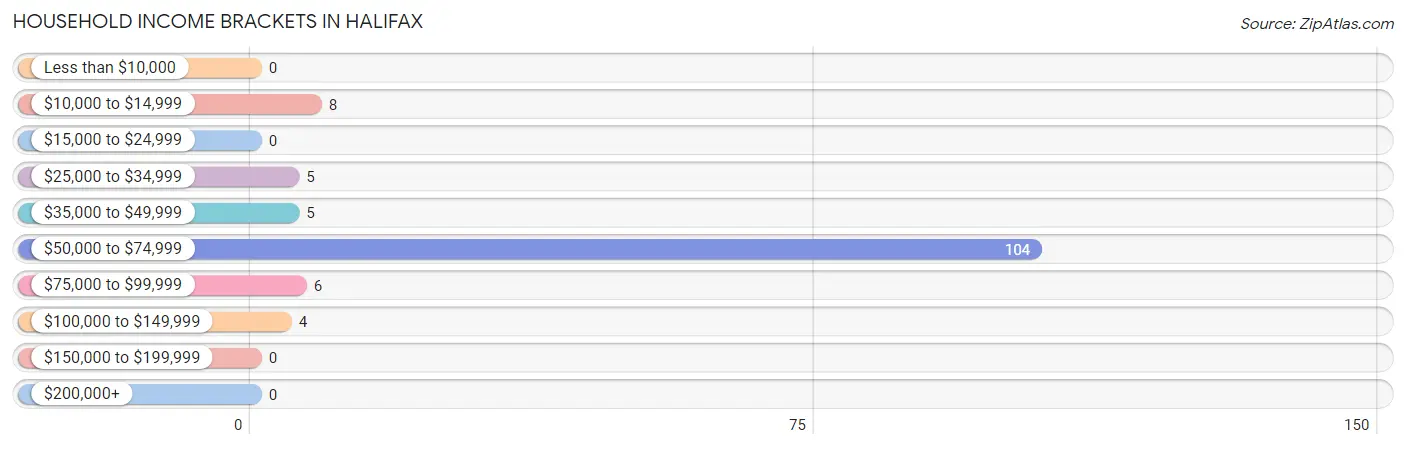
| Income Bracket | # Households | % Households |
| Less than $10,000 | 0 | 0.0% |
| $10,000 to $14,999 | 8 | 6.1% |
| $15,000 to $24,999 | 0 | 0.0% |
| $25,000 to $34,999 | 5 | 3.8% |
| $35,000 to $49,999 | 5 | 3.8% |
| $50,000 to $74,999 | 104 | 78.8% |
| $75,000 to $99,999 | 6 | 4.5% |
| $100,000 to $149,999 | 4 | 3.0% |
| $150,000 to $199,999 | 0 | 0.0% |
| $200,000+ | 0 | 0.0% |
Household Income by Householder Age in Halifax
The median household income in Halifax is $59,031, with the highest median household income of $59,413 found in the 45 to 64 years age bracket for the primary householder. A total of 99 households (75.0%) fall into this category.
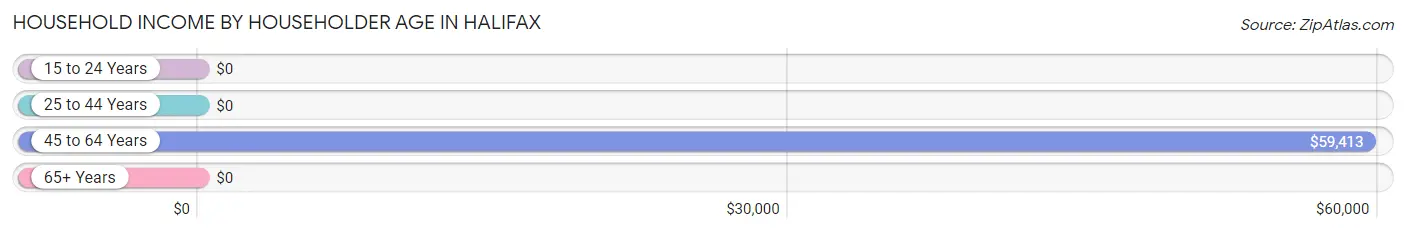
| Income Bracket | # Households | Median Income |
| 15 to 24 Years | 0 (0.0%) | $0 |
| 25 to 44 Years | 23 (17.4%) | $0 |
| 45 to 64 Years | 99 (75.0%) | $59,413 |
| 65+ Years | 10 (7.6%) | $0 |
| Total | 132 (100.0%) | $59,031 |
Poverty in Halifax
Income Below Poverty by Sex and Age in Halifax
With 3.8% poverty level for males and 8.3% for females among the residents of Halifax, 55 to 64 year old males and 35 to 44 year old females are the most vulnerable to poverty, with 5 males (11.1%) and 2 females (33.3%) in their respective age groups living below the poverty level.
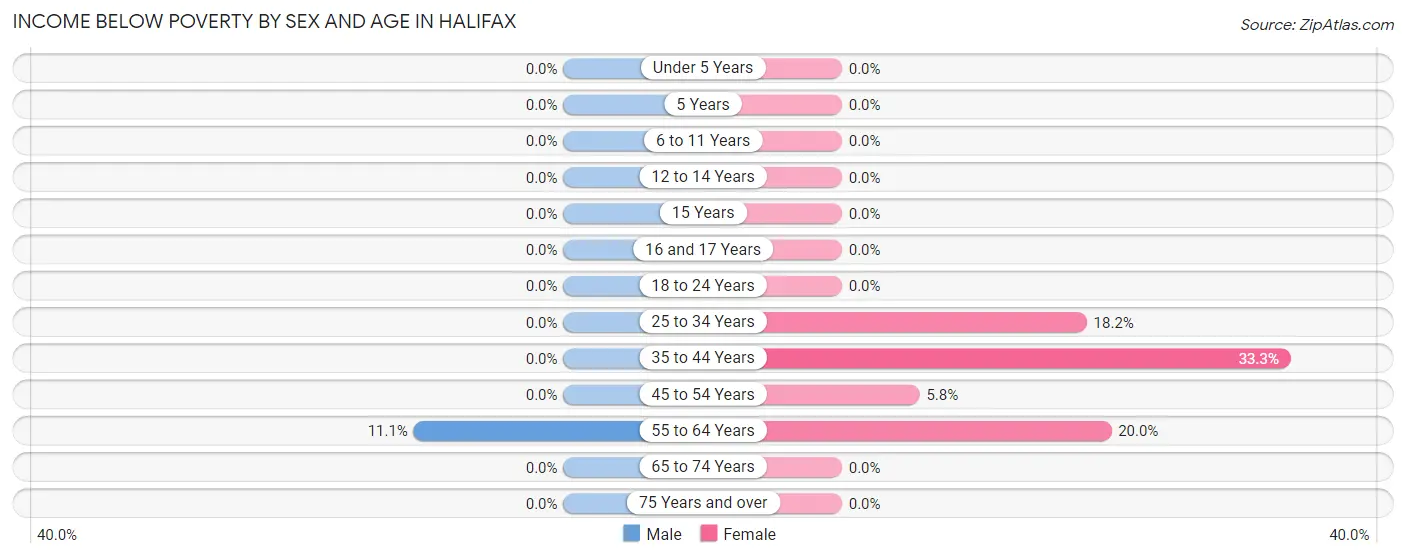
| Age Bracket | Male | Female |
| Under 5 Years | 0 (0.0%) | 0 (0.0%) |
| 5 Years | 0 (0.0%) | 0 (0.0%) |
| 6 to 11 Years | 0 (0.0%) | 0 (0.0%) |
| 12 to 14 Years | 0 (0.0%) | 0 (0.0%) |
| 15 Years | 0 (0.0%) | 0 (0.0%) |
| 16 and 17 Years | 0 (0.0%) | 0 (0.0%) |
| 18 to 24 Years | 0 (0.0%) | 0 (0.0%) |
| 25 to 34 Years | 0 (0.0%) | 2 (18.2%) |
| 35 to 44 Years | 0 (0.0%) | 2 (33.3%) |
| 45 to 54 Years | 0 (0.0%) | 3 (5.8%) |
| 55 to 64 Years | 5 (11.1%) | 1 (20.0%) |
| 65 to 74 Years | 0 (0.0%) | 0 (0.0%) |
| 75 Years and over | 0 (0.0%) | 0 (0.0%) |
| Total | 5 (3.8%) | 8 (8.3%) |
Income Above Poverty by Sex and Age in Halifax
According to the poverty statistics in Halifax, males aged under 5 years and females aged 6 to 11 years are the age groups that are most secure financially, with 100.0% of males and 100.0% of females in these age groups living above the poverty line.
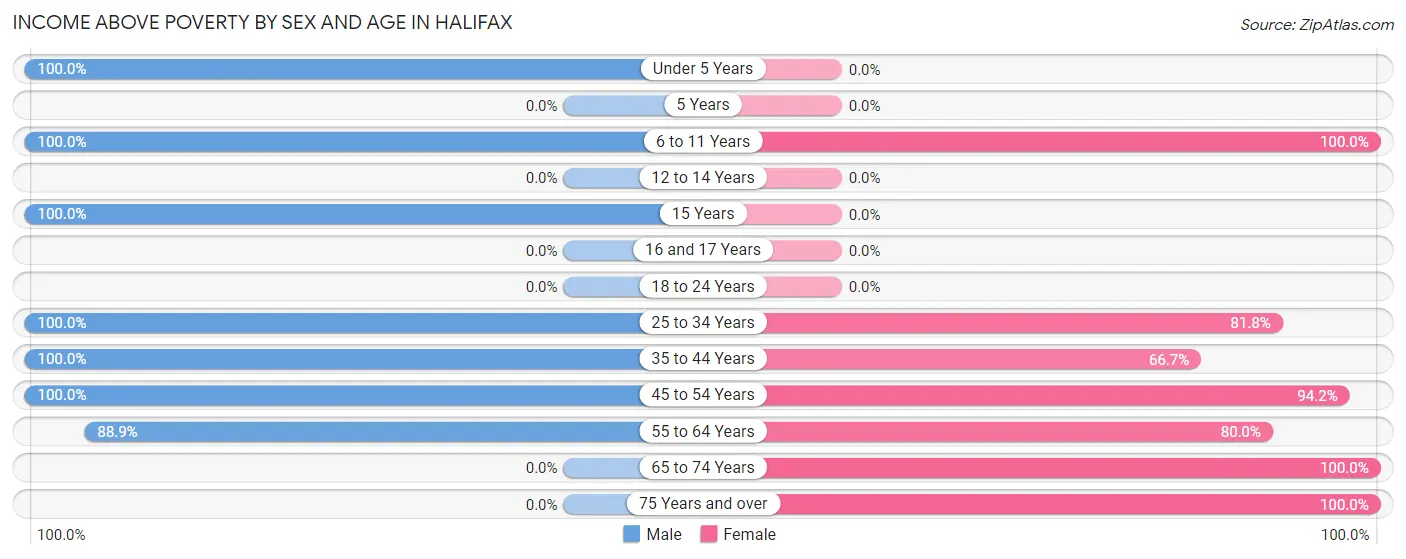
| Age Bracket | Male | Female |
| Under 5 Years | 9 (100.0%) | 0 (0.0%) |
| 5 Years | 0 (0.0%) | 0 (0.0%) |
| 6 to 11 Years | 4 (100.0%) | 6 (100.0%) |
| 12 to 14 Years | 0 (0.0%) | 0 (0.0%) |
| 15 Years | 3 (100.0%) | 0 (0.0%) |
| 16 and 17 Years | 0 (0.0%) | 0 (0.0%) |
| 18 to 24 Years | 0 (0.0%) | 0 (0.0%) |
| 25 to 34 Years | 11 (100.0%) | 9 (81.8%) |
| 35 to 44 Years | 14 (100.0%) | 4 (66.7%) |
| 45 to 54 Years | 44 (100.0%) | 49 (94.2%) |
| 55 to 64 Years | 40 (88.9%) | 4 (80.0%) |
| 65 to 74 Years | 0 (0.0%) | 10 (100.0%) |
| 75 Years and over | 0 (0.0%) | 7 (100.0%) |
| Total | 125 (96.2%) | 89 (91.7%) |
Income Below Poverty Among Married-Couple Families in Halifax
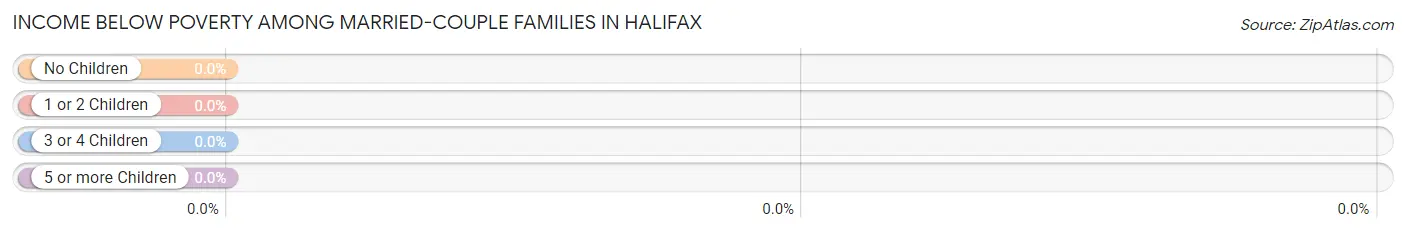
| Children | Above Poverty | Below Poverty |
| No Children | 49 (100.0%) | 0 (0.0%) |
| 1 or 2 Children | 4 (100.0%) | 0 (0.0%) |
| 3 or 4 Children | 4 (100.0%) | 0 (0.0%) |
| 5 or more Children | 0 (0.0%) | 0 (0.0%) |
| Total | 57 (100.0%) | 0 (0.0%) |
Income Below Poverty Among Single-Parent Households in Halifax
| Children | Single Father | Single Mother |
| No Children | 0 (0.0%) | 0 (0.0%) |
| 1 or 2 Children | 0 (0.0%) | 0 (0.0%) |
| 3 or 4 Children | 0 (0.0%) | 0 (0.0%) |
| 5 or more Children | 0 (0.0%) | 0 (0.0%) |
| Total | 0 (0.0%) | 0 (0.0%) |
Income Below Poverty Among Married-Couple vs Single-Parent Households in Halifax
| Children | Married-Couple Families | Single-Parent Households |
| No Children | 0 (0.0%) | 0 (0.0%) |
| 1 or 2 Children | 0 (0.0%) | 0 (0.0%) |
| 3 or 4 Children | 0 (0.0%) | 0 (0.0%) |
| 5 or more Children | 0 (0.0%) | 0 (0.0%) |
| Total | 0 (0.0%) | 0 (0.0%) |
Race in Halifax
The most populous races in Halifax are White / Caucasian (197 | 86.8%), Black / African American (18 | 7.9%), and Two or more Races (10 | 4.4%).
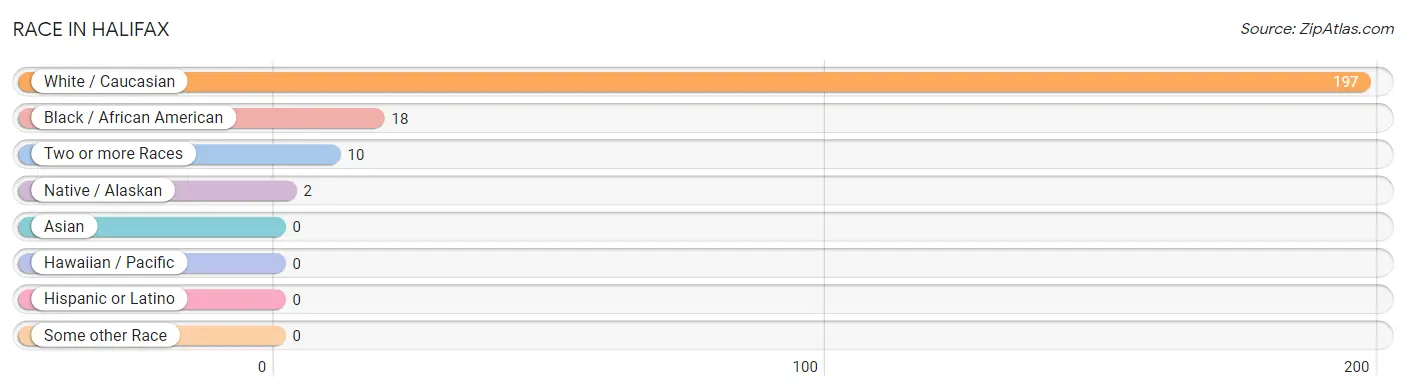
| Race | # Population | % Population |
| Asian | 0 | 0.0% |
| Black / African American | 18 | 7.9% |
| Hawaiian / Pacific | 0 | 0.0% |
| Hispanic or Latino | 0 | 0.0% |
| Native / Alaskan | 2 | 0.9% |
| White / Caucasian | 197 | 86.8% |
| Two or more Races | 10 | 4.4% |
| Some other Race | 0 | 0.0% |
| Total | 227 | 100.0% |
Ancestry in Halifax
The most populous ancestries reported in Halifax are American (59 | 26.0%), Irish (19 | 8.4%), and English (5 | 2.2%), together accounting for 36.6% of all Halifax residents.
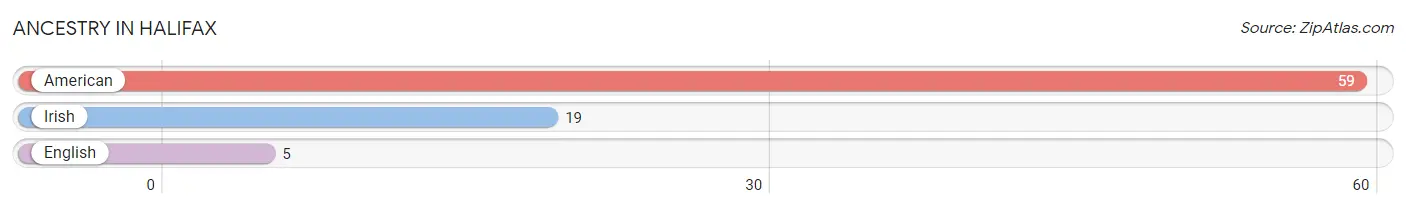
| Ancestry | # Population | % Population |
| American | 59 | 26.0% |
| English | 5 | 2.2% |
| Irish | 19 | 8.4% | View All 3 Rows |
Immigrants in Halifax

| Immigration Origin | # Population | % Population | View All 0 Rows |
Sex and Age in Halifax
Sex and Age in Halifax
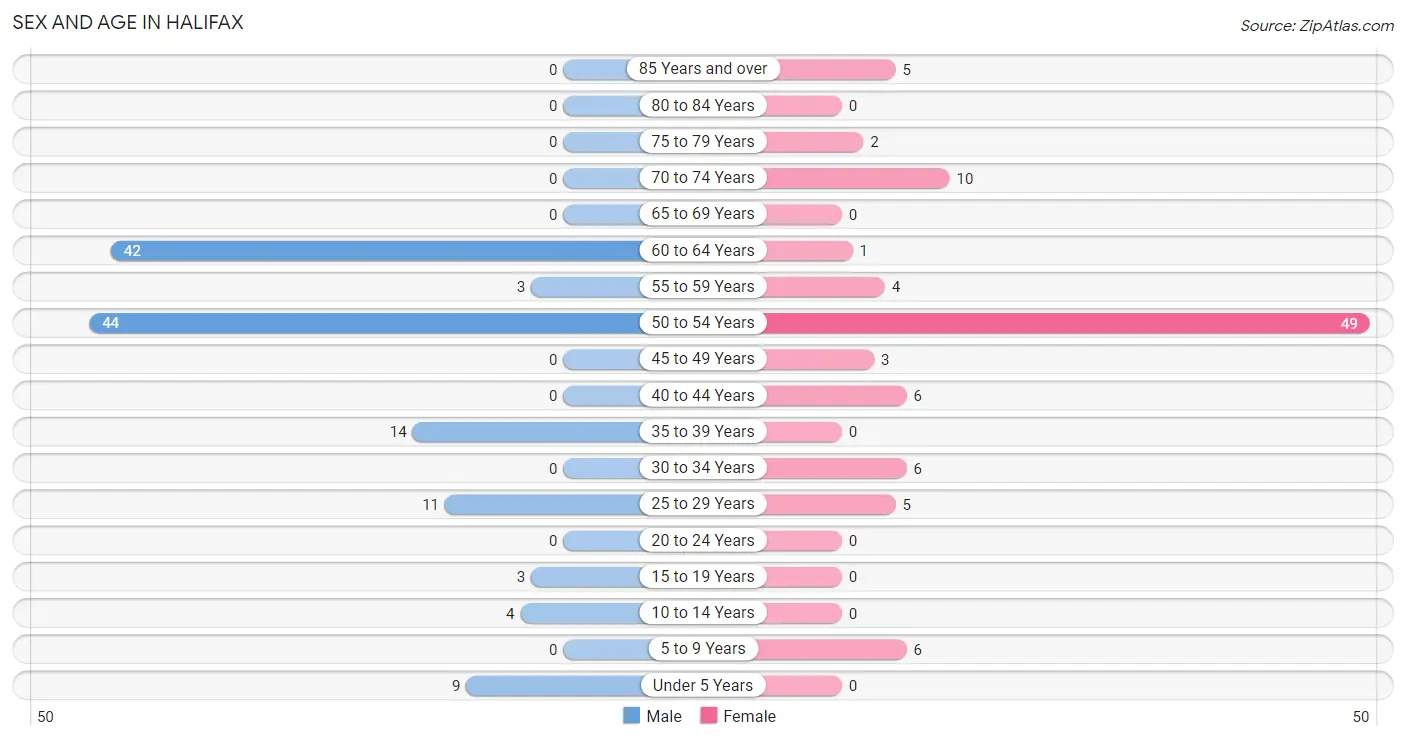
The most populous age groups in Halifax are 50 to 54 Years (44 | 33.9%) for men and 50 to 54 Years (49 | 50.5%) for women.
| Age Bracket | Male | Female |
| Under 5 Years | 9 (6.9%) | 0 (0.0%) |
| 5 to 9 Years | 0 (0.0%) | 6 (6.2%) |
| 10 to 14 Years | 4 (3.1%) | 0 (0.0%) |
| 15 to 19 Years | 3 (2.3%) | 0 (0.0%) |
| 20 to 24 Years | 0 (0.0%) | 0 (0.0%) |
| 25 to 29 Years | 11 (8.5%) | 5 (5.1%) |
| 30 to 34 Years | 0 (0.0%) | 6 (6.2%) |
| 35 to 39 Years | 14 (10.8%) | 0 (0.0%) |
| 40 to 44 Years | 0 (0.0%) | 6 (6.2%) |
| 45 to 49 Years | 0 (0.0%) | 3 (3.1%) |
| 50 to 54 Years | 44 (33.9%) | 49 (50.5%) |
| 55 to 59 Years | 3 (2.3%) | 4 (4.1%) |
| 60 to 64 Years | 42 (32.3%) | 1 (1.0%) |
| 65 to 69 Years | 0 (0.0%) | 0 (0.0%) |
| 70 to 74 Years | 0 (0.0%) | 10 (10.3%) |
| 75 to 79 Years | 0 (0.0%) | 2 (2.1%) |
| 80 to 84 Years | 0 (0.0%) | 0 (0.0%) |
| 85 Years and over | 0 (0.0%) | 5 (5.1%) |
| Total | 130 (100.0%) | 97 (100.0%) |
Families and Households in Halifax
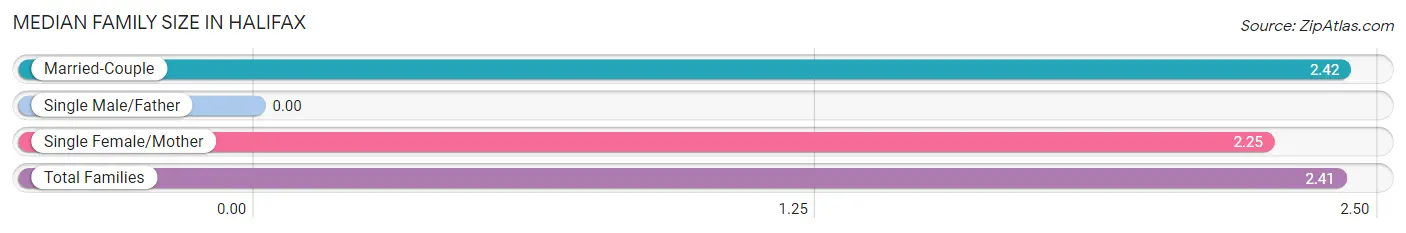
Median Family Size in Halifax
| Family Type | # Families | Family Size |
| Married-Couple | 57 (93.4%) | 2.42 |
| Single Male/Father | 0 (0.0%) | - |
| Single Female/Mother | 4 (6.6%) | 2.25 |
| Total Families | 61 (100.0%) | 2.41 |
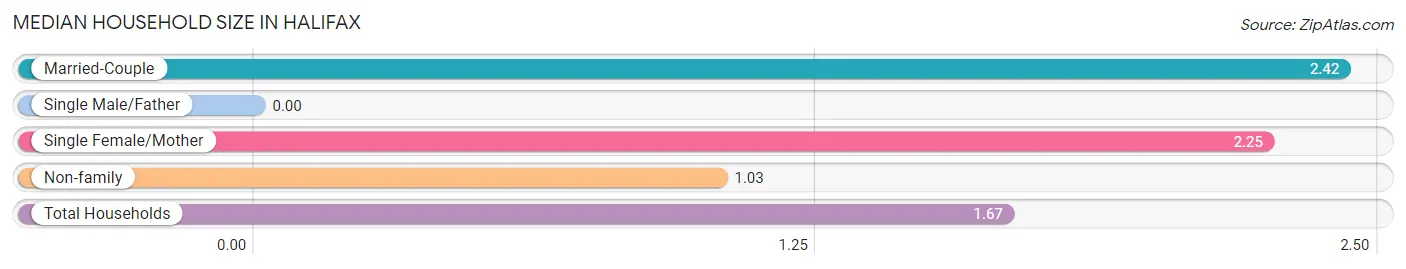
Median Household Size in Halifax
| Household Type | # Households | Household Size |
| Married-Couple | 57 (43.2%) | 2.42 |
| Single Male/Father | 0 (0.0%) | - |
| Single Female/Mother | 4 (3.0%) | 2.25 |
| Non-family | 71 (53.8%) | 1.03 |
| Total Households | 132 (100.0%) | 1.67 |
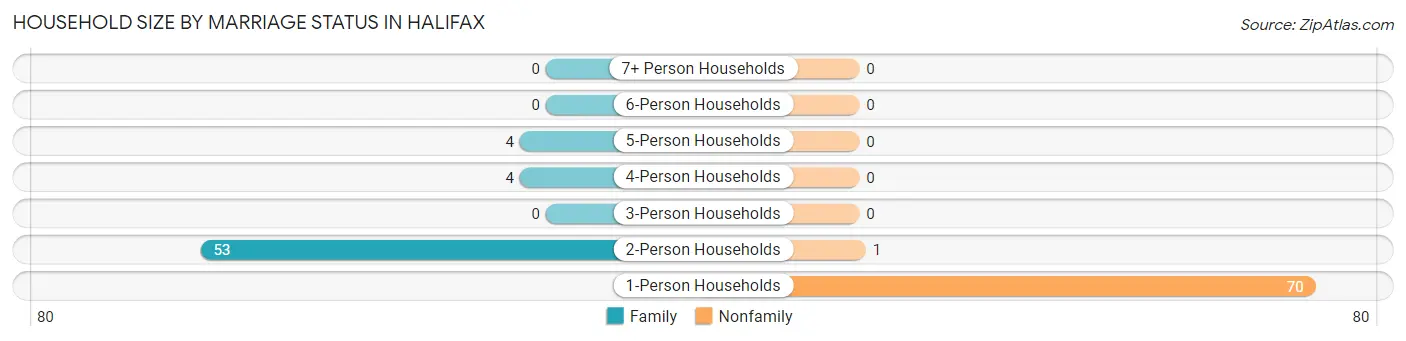
Household Size by Marriage Status in Halifax
Out of a total of 132 households in Halifax, 61 (46.2%) are family households, while 71 (53.8%) are nonfamily households. The most numerous type of family households are 2-person households, comprising 53, and the most common type of nonfamily households are 1-person households, comprising 70.
| Household Size | Family Households | Nonfamily Households |
| 1-Person Households | - | 70 (53.0%) |
| 2-Person Households | 53 (40.2%) | 1 (0.8%) |
| 3-Person Households | 0 (0.0%) | 0 (0.0%) |
| 4-Person Households | 4 (3.0%) | 0 (0.0%) |
| 5-Person Households | 4 (3.0%) | 0 (0.0%) |
| 6-Person Households | 0 (0.0%) | 0 (0.0%) |
| 7+ Person Households | 0 (0.0%) | 0 (0.0%) |
| Total | 61 (46.2%) | 71 (53.8%) |
Female Fertility in Halifax
Fertility by Age in Halifax
| Age Bracket | Women with Births | Births / 1,000 Women |
| 15 to 19 years | 0 (0.0%) | 0.0 |
| 20 to 34 years | 0 (0.0%) | 0.0 |
| 35 to 50 years | 0 (0.0%) | 0.0 |
| Total | 0 (0.0%) | 0.0 |
Fertility by Age by Marriage Status in Halifax
| Age Bracket | Married | Unmarried |
| 15 to 19 years | 0 (0.0%) | 0 (0.0%) |
| 20 to 34 years | 0 (0.0%) | 0 (0.0%) |
| 35 to 50 years | 0 (0.0%) | 0 (0.0%) |
| Total | 0 (0.0%) | 0 (0.0%) |
Fertility by Education in Halifax
| Educational Attainment | Women with Births | Births / 1,000 Women |
| Less than High School | 0 (0.0%) | 0.0 |
| High School Diploma | 0 (0.0%) | 0.0 |
| College or Associate's Degree | 0 (0.0%) | 0.0 |
| Bachelor's Degree | 0 (0.0%) | 0.0 |
| Graduate Degree | 0 (0.0%) | 0.0 |
| Total | 0 (0.0%) | 0.0 |
Fertility by Education by Marriage Status in Halifax
| Educational Attainment | Married | Unmarried |
| Less than High School | 0 (0.0%) | 0 (0.0%) |
| High School Diploma | 0 (0.0%) | 0 (0.0%) |
| College or Associate's Degree | 0 (0.0%) | 0 (0.0%) |
| Bachelor's Degree | 0 (0.0%) | 0 (0.0%) |
| Graduate Degree | 0 (0.0%) | 0 (0.0%) |
| Total | 0 (0.0%) | 0 (0.0%) |
Employment Characteristics in Halifax
Employment by Class of Employer in Halifax
Among the 183 employed individuals in Halifax, private company employees (152 | 83.1%), local government employees (12 | 6.6%), and not-for-profit organizations (10 | 5.5%) make up the most common classes of employment.
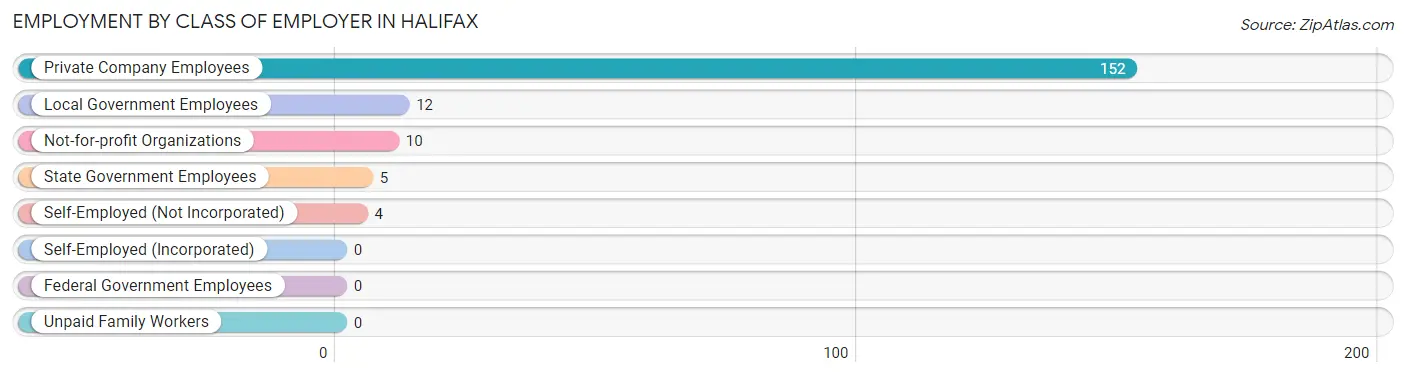
| Employer Class | # Employees | % Employees |
| Private Company Employees | 152 | 83.1% |
| Self-Employed (Incorporated) | 0 | 0.0% |
| Self-Employed (Not Incorporated) | 4 | 2.2% |
| Not-for-profit Organizations | 10 | 5.5% |
| Local Government Employees | 12 | 6.6% |
| State Government Employees | 5 | 2.7% |
| Federal Government Employees | 0 | 0.0% |
| Unpaid Family Workers | 0 | 0.0% |
| Total | 183 | 100.0% |
Employment Status by Age in Halifax
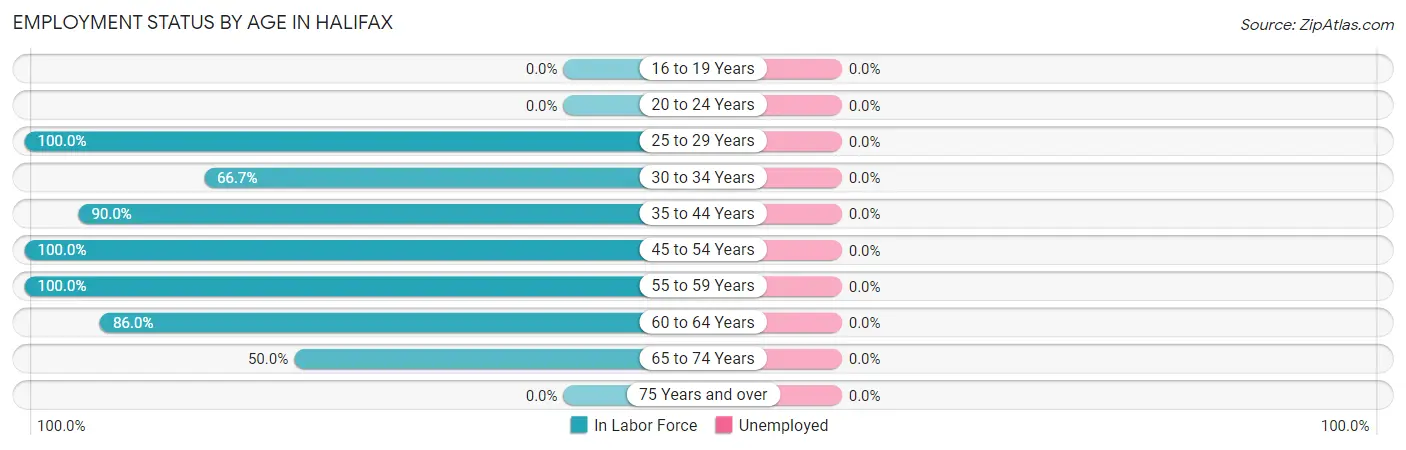
| Age Bracket | In Labor Force | Unemployed |
| 16 to 19 Years | 0 (0.0%) | 0 (0.0%) |
| 20 to 24 Years | 0 (0.0%) | 0 (0.0%) |
| 25 to 29 Years | 16 (100.0%) | 0 (0.0%) |
| 30 to 34 Years | 4 (66.7%) | 0 (0.0%) |
| 35 to 44 Years | 18 (90.0%) | 0 (0.0%) |
| 45 to 54 Years | 96 (100.0%) | 0 (0.0%) |
| 55 to 59 Years | 7 (100.0%) | 0 (0.0%) |
| 60 to 64 Years | 37 (86.0%) | 0 (0.0%) |
| 65 to 74 Years | 5 (50.0%) | 0 (0.0%) |
| 75 Years and over | 0 (0.0%) | 0 (0.0%) |
| Total | 183 (89.3%) | 0 (0.0%) |
Employment Status by Educational Attainment in Halifax
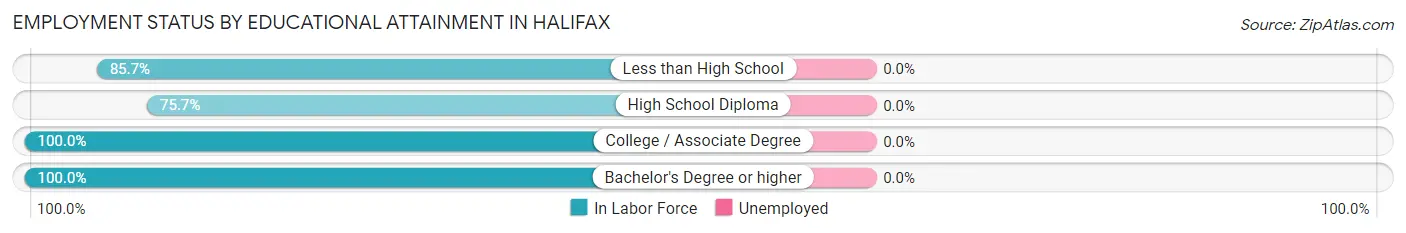
| Educational Attainment | In Labor Force | Unemployed |
| Less than High School | 6 (85.7%) | 0 (0.0%) |
| High School Diploma | 28 (75.7%) | 0 (0.0%) |
| College / Associate Degree | 85 (100.0%) | 0 (0.0%) |
| Bachelor's Degree or higher | 59 (100.0%) | 0 (0.0%) |
| Total | 178 (94.7%) | 0 (0.0%) |
Employment Occupations by Sex in Halifax
Management, Business, Science and Arts Occupations
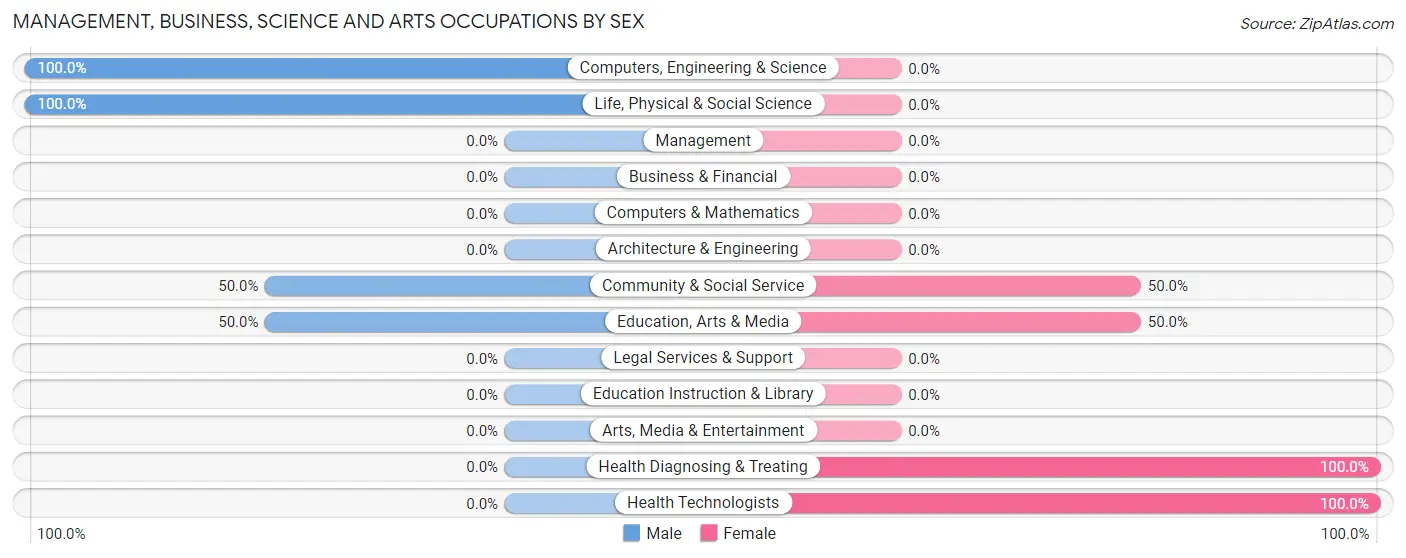
The most common Management, Business, Science and Arts occupations in Halifax are Health Diagnosing & Treating (44 | 24.0%), Health Technologists (44 | 24.0%), Community & Social Service (10 | 5.5%), Education, Arts & Media (10 | 5.5%), and Computers, Engineering & Science (1 | 0.5%).
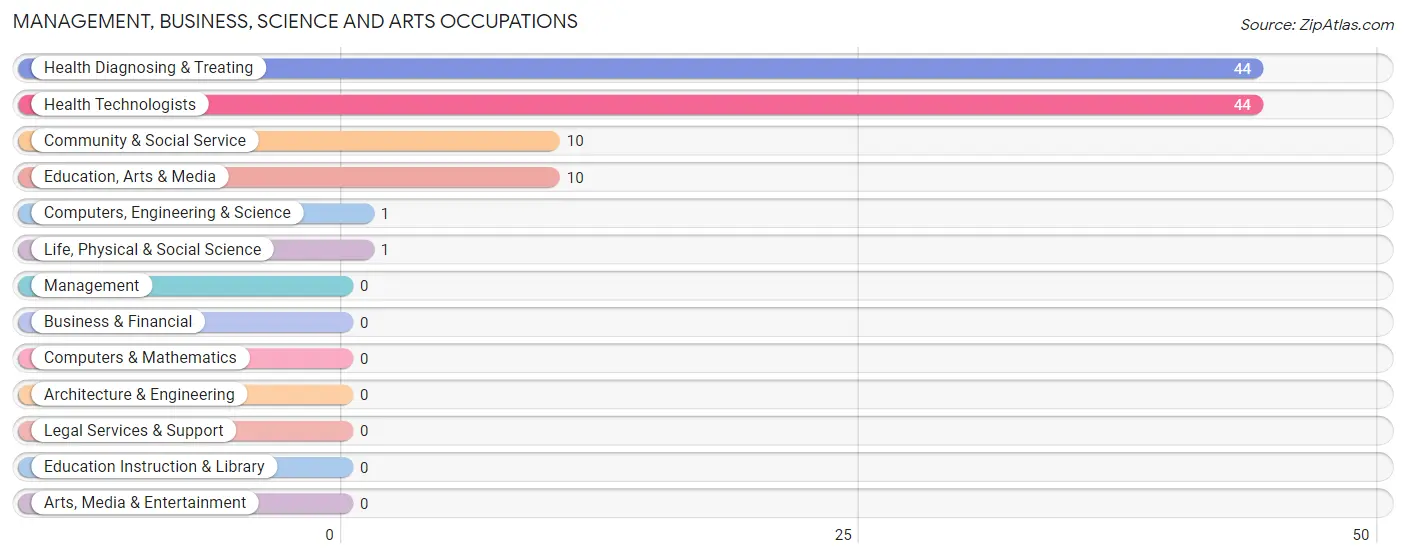
Management, Business, Science and Arts Occupations by Sex
Within the Management, Business, Science and Arts occupations in Halifax, the most male-oriented occupations are Computers, Engineering & Science (100.0%), Life, Physical & Social Science (100.0%), and Community & Social Service (50.0%), while the most female-oriented occupations are Health Diagnosing & Treating (100.0%), Health Technologists (100.0%), and Community & Social Service (50.0%).
| Occupation | Male | Female |
| Management | 0 (0.0%) | 0 (0.0%) |
| Business & Financial | 0 (0.0%) | 0 (0.0%) |
| Computers, Engineering & Science | 1 (100.0%) | 0 (0.0%) |
| Computers & Mathematics | 0 (0.0%) | 0 (0.0%) |
| Architecture & Engineering | 0 (0.0%) | 0 (0.0%) |
| Life, Physical & Social Science | 1 (100.0%) | 0 (0.0%) |
| Community & Social Service | 5 (50.0%) | 5 (50.0%) |
| Education, Arts & Media | 5 (50.0%) | 5 (50.0%) |
| Legal Services & Support | 0 (0.0%) | 0 (0.0%) |
| Education Instruction & Library | 0 (0.0%) | 0 (0.0%) |
| Arts, Media & Entertainment | 0 (0.0%) | 0 (0.0%) |
| Health Diagnosing & Treating | 0 (0.0%) | 44 (100.0%) |
| Health Technologists | 0 (0.0%) | 44 (100.0%) |
| Total (Category) | 6 (10.9%) | 49 (89.1%) |
| Total (Overall) | 109 (59.6%) | 74 (40.4%) |
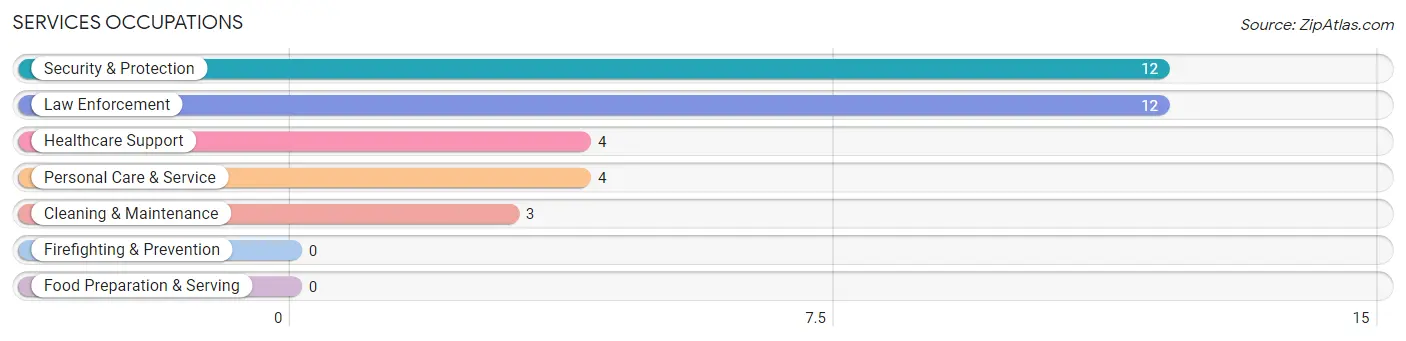
Services Occupations
The most common Services occupations in Halifax are Security & Protection (12 | 6.6%), Law Enforcement (12 | 6.6%), Healthcare Support (4 | 2.2%), Personal Care & Service (4 | 2.2%), and Cleaning & Maintenance (3 | 1.6%).
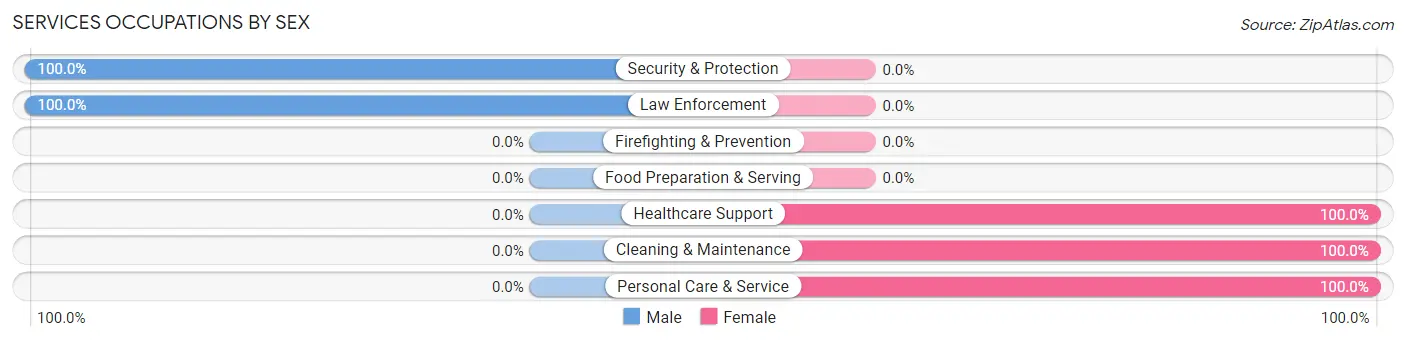
Services Occupations by Sex
Within the Services occupations in Halifax, the most male-oriented occupations are Security & Protection (100.0%), and Law Enforcement (100.0%), while the most female-oriented occupations are Healthcare Support (100.0%), Cleaning & Maintenance (100.0%), and Personal Care & Service (100.0%).
| Occupation | Male | Female |
| Healthcare Support | 0 (0.0%) | 4 (100.0%) |
| Security & Protection | 12 (100.0%) | 0 (0.0%) |
| Firefighting & Prevention | 0 (0.0%) | 0 (0.0%) |
| Law Enforcement | 12 (100.0%) | 0 (0.0%) |
| Food Preparation & Serving | 0 (0.0%) | 0 (0.0%) |
| Cleaning & Maintenance | 0 (0.0%) | 3 (100.0%) |
| Personal Care & Service | 0 (0.0%) | 4 (100.0%) |
| Total (Category) | 12 (52.2%) | 11 (47.8%) |
| Total (Overall) | 109 (59.6%) | 74 (40.4%) |
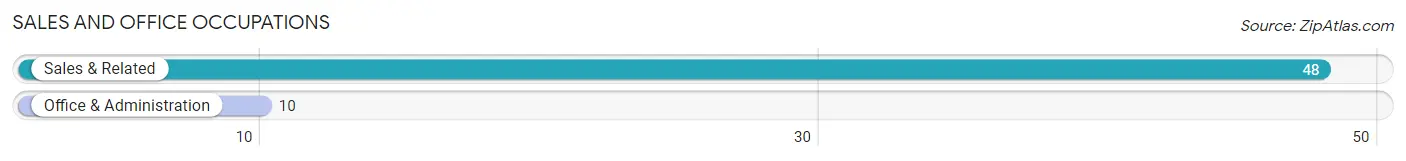
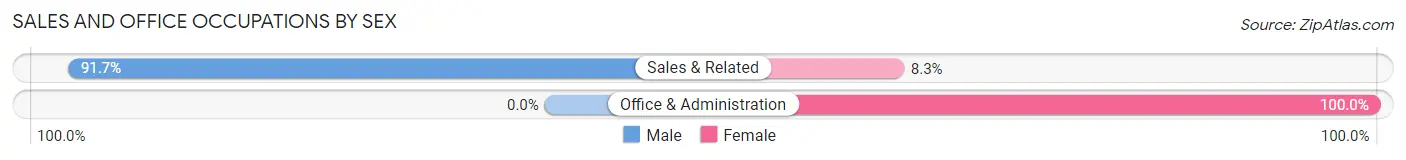
Sales and Office Occupations
The most common Sales and Office occupations in Halifax are Sales & Related (48 | 26.2%), and Office & Administration (10 | 5.5%).
Sales and Office Occupations by Sex
| Occupation | Male | Female |
| Sales & Related | 44 (91.7%) | 4 (8.3%) |
| Office & Administration | 0 (0.0%) | 10 (100.0%) |
| Total (Category) | 44 (75.9%) | 14 (24.1%) |
| Total (Overall) | 109 (59.6%) | 74 (40.4%) |
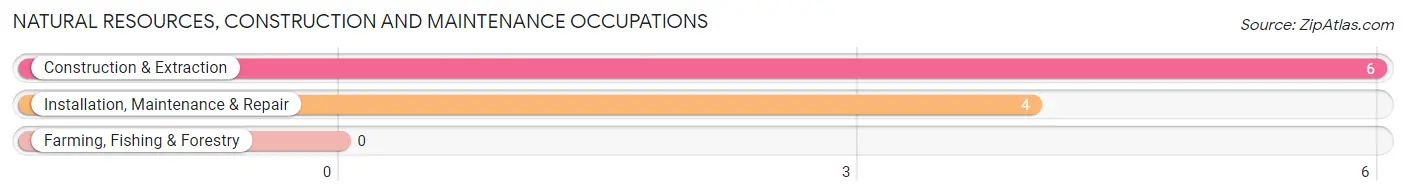
Natural Resources, Construction and Maintenance Occupations
The most common Natural Resources, Construction and Maintenance occupations in Halifax are Construction & Extraction (6 | 3.3%), and Installation, Maintenance & Repair (4 | 2.2%).
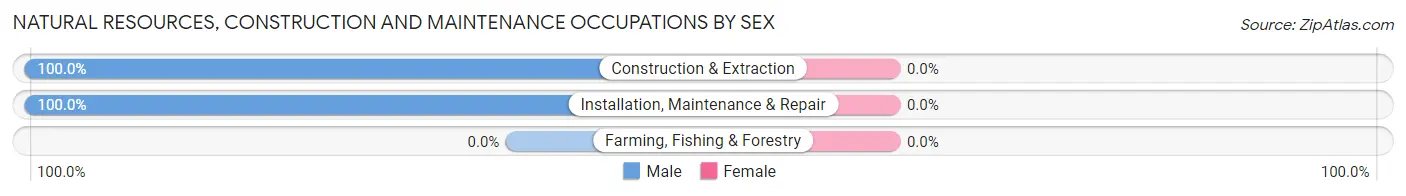
Natural Resources, Construction and Maintenance Occupations by Sex
| Occupation | Male | Female |
| Farming, Fishing & Forestry | 0 (0.0%) | 0 (0.0%) |
| Construction & Extraction | 6 (100.0%) | 0 (0.0%) |
| Installation, Maintenance & Repair | 4 (100.0%) | 0 (0.0%) |
| Total (Category) | 10 (100.0%) | 0 (0.0%) |
| Total (Overall) | 109 (59.6%) | 74 (40.4%) |
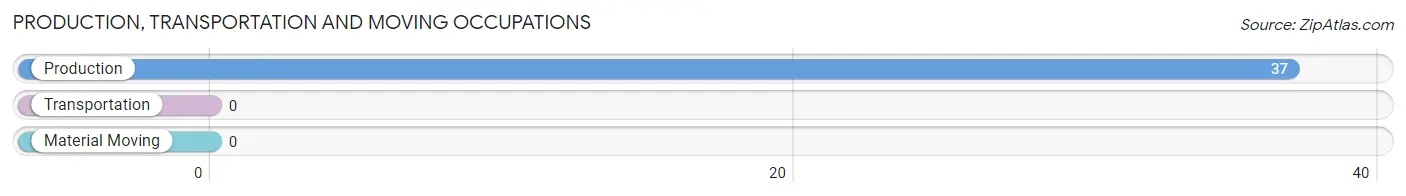
Production, Transportation and Moving Occupations
The most common Production, Transportation and Moving occupations in Halifax are , and Production (37 | 20.2%).
Production, Transportation and Moving Occupations by Sex
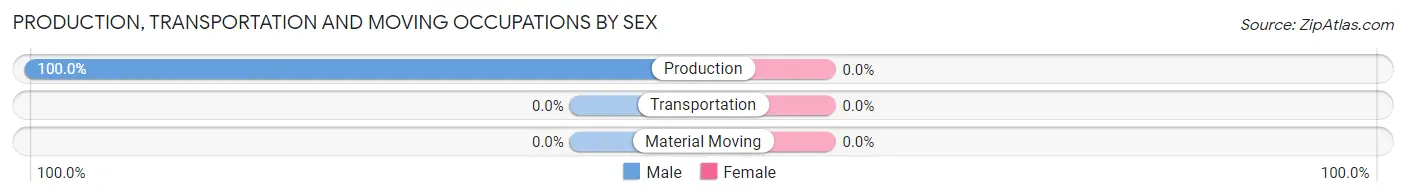
| Occupation | Male | Female |
| Production | 37 (100.0%) | 0 (0.0%) |
| Transportation | 0 (0.0%) | 0 (0.0%) |
| Material Moving | 0 (0.0%) | 0 (0.0%) |
| Total (Category) | 37 (100.0%) | 0 (0.0%) |
| Total (Overall) | 109 (59.6%) | 74 (40.4%) |
Employment Industries by Sex in Halifax
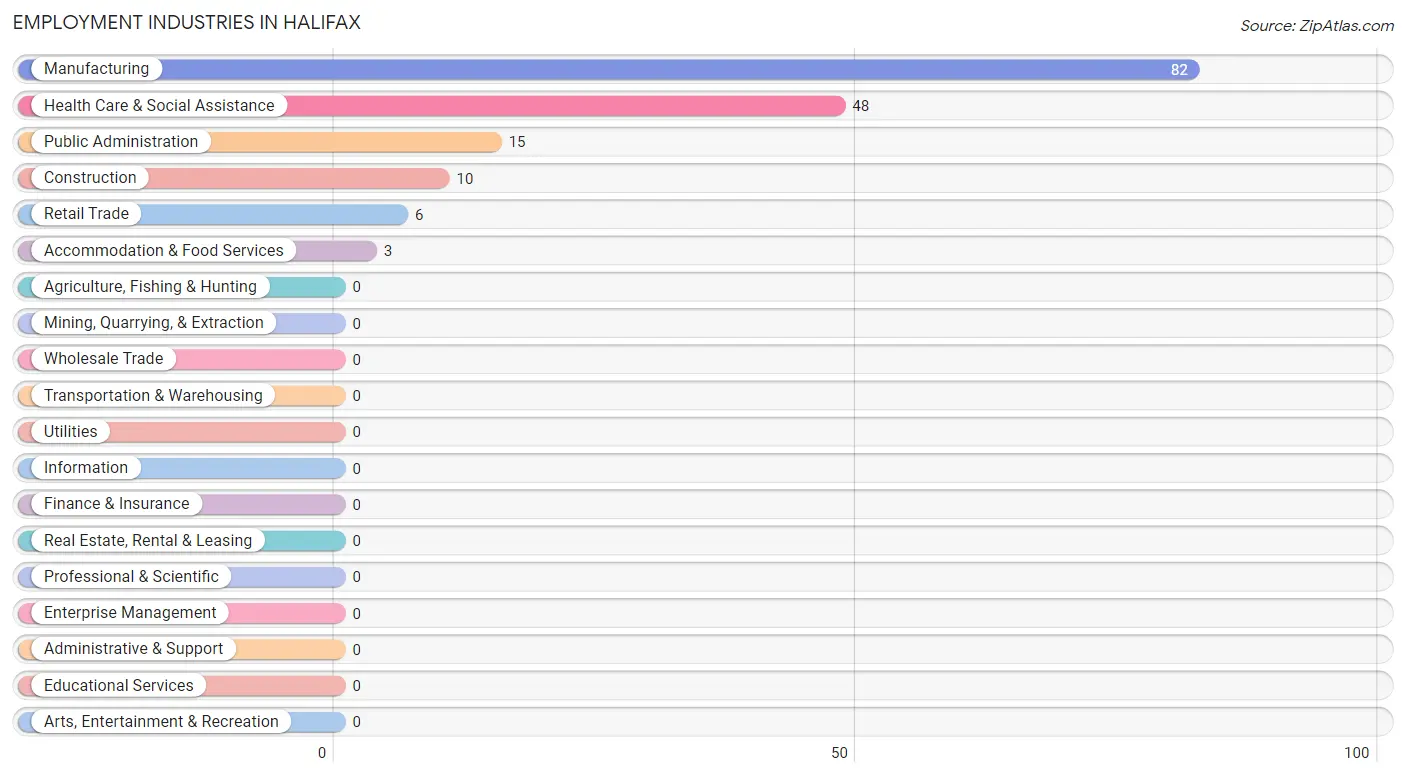
Employment Industries in Halifax
The major employment industries in Halifax include Manufacturing (82 | 44.8%), Health Care & Social Assistance (48 | 26.2%), Public Administration (15 | 8.2%), Construction (10 | 5.5%), and Retail Trade (6 | 3.3%).
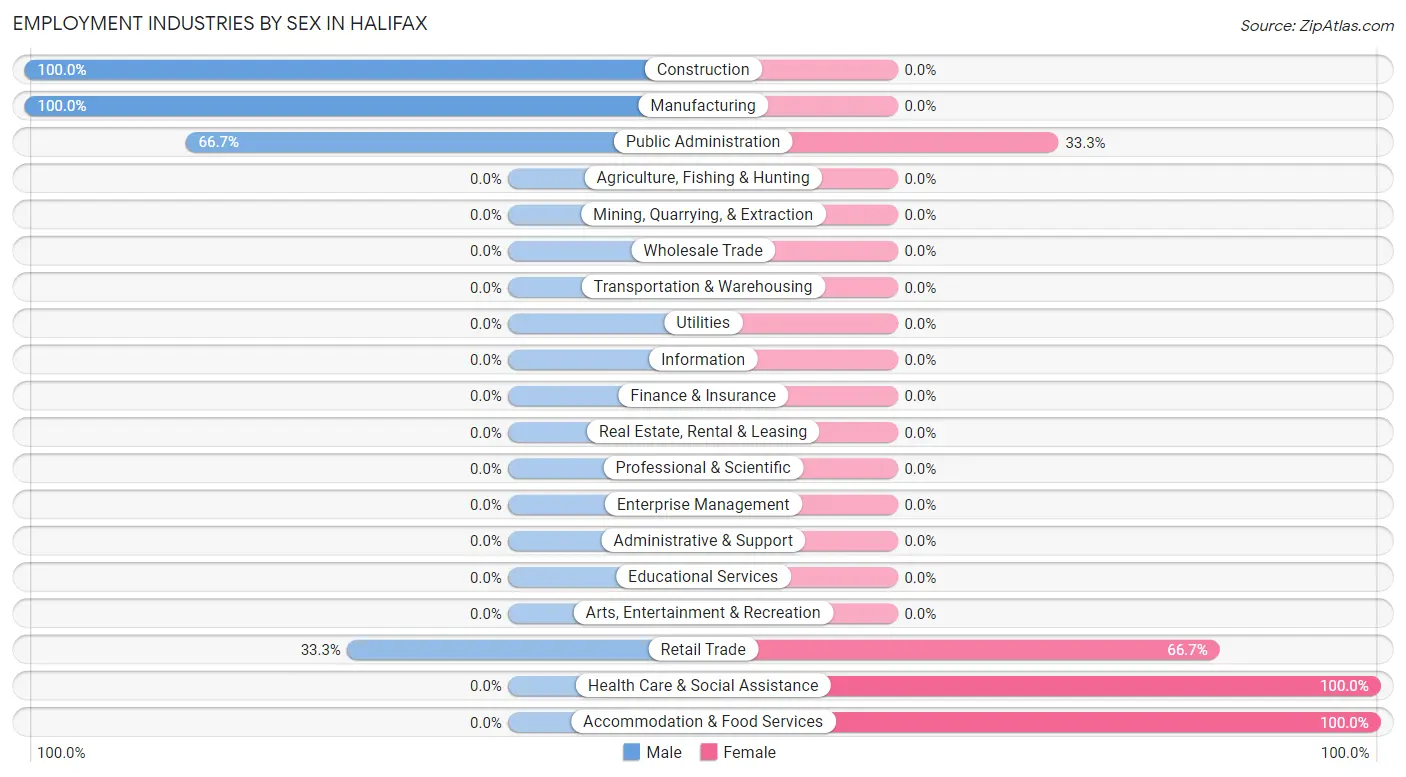
Employment Industries by Sex in Halifax
The Halifax industries that see more men than women are Construction (100.0%), Manufacturing (100.0%), and Public Administration (66.7%), whereas the industries that tend to have a higher number of women are Health Care & Social Assistance (100.0%), Accommodation & Food Services (100.0%), and Retail Trade (66.7%).
| Industry | Male | Female |
| Agriculture, Fishing & Hunting | 0 (0.0%) | 0 (0.0%) |
| Mining, Quarrying, & Extraction | 0 (0.0%) | 0 (0.0%) |
| Construction | 10 (100.0%) | 0 (0.0%) |
| Manufacturing | 82 (100.0%) | 0 (0.0%) |
| Wholesale Trade | 0 (0.0%) | 0 (0.0%) |
| Retail Trade | 2 (33.3%) | 4 (66.7%) |
| Transportation & Warehousing | 0 (0.0%) | 0 (0.0%) |
| Utilities | 0 (0.0%) | 0 (0.0%) |
| Information | 0 (0.0%) | 0 (0.0%) |
| Finance & Insurance | 0 (0.0%) | 0 (0.0%) |
| Real Estate, Rental & Leasing | 0 (0.0%) | 0 (0.0%) |
| Professional & Scientific | 0 (0.0%) | 0 (0.0%) |
| Enterprise Management | 0 (0.0%) | 0 (0.0%) |
| Administrative & Support | 0 (0.0%) | 0 (0.0%) |
| Educational Services | 0 (0.0%) | 0 (0.0%) |
| Health Care & Social Assistance | 0 (0.0%) | 48 (100.0%) |
| Arts, Entertainment & Recreation | 0 (0.0%) | 0 (0.0%) |
| Accommodation & Food Services | 0 (0.0%) | 3 (100.0%) |
| Public Administration | 10 (66.7%) | 5 (33.3%) |
| Total | 109 (59.6%) | 74 (40.4%) |
Education in Halifax
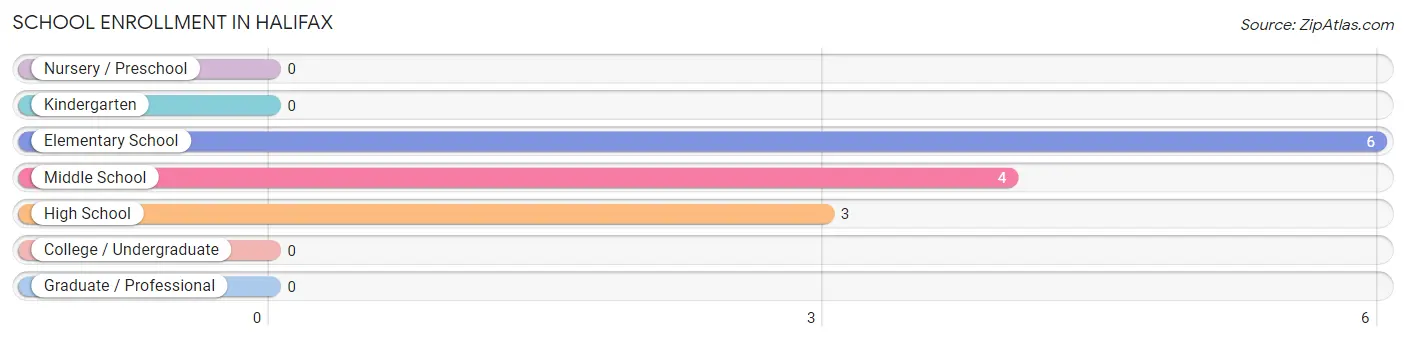
School Enrollment in Halifax
The most common levels of schooling among the 13 students in Halifax are elementary school (6 | 46.2%), middle school (4 | 30.8%), and high school (3 | 23.1%).
| School Level | # Students | % Students |
| Nursery / Preschool | 0 | 0.0% |
| Kindergarten | 0 | 0.0% |
| Elementary School | 6 | 46.2% |
| Middle School | 4 | 30.8% |
| High School | 3 | 23.1% |
| College / Undergraduate | 0 | 0.0% |
| Graduate / Professional | 0 | 0.0% |
| Total | 13 | 100.0% |
School Enrollment by Age by Funding Source in Halifax
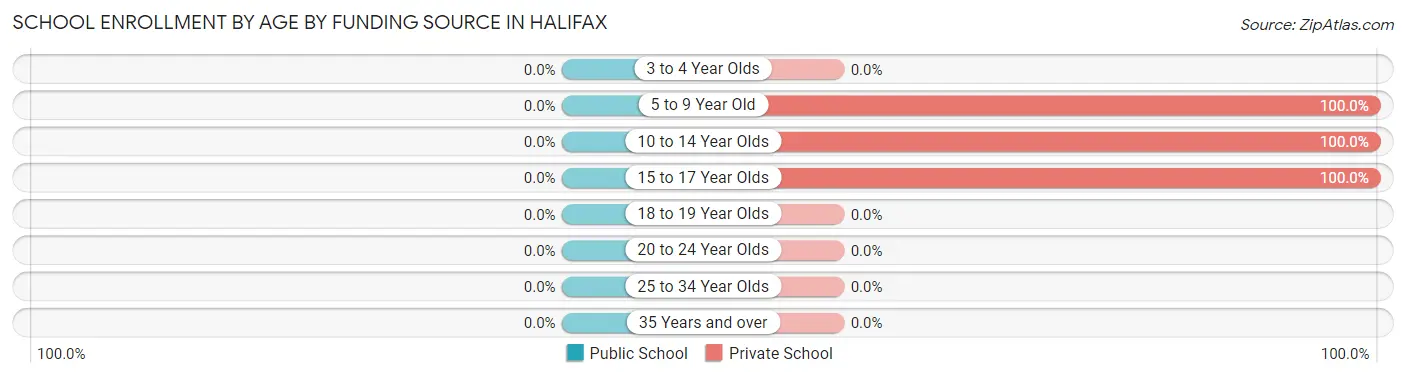
| Age Bracket | Public School | Private School |
| 3 to 4 Year Olds | 0 (0.0%) | 0 (0.0%) |
| 5 to 9 Year Old | 0 (0.0%) | 6 (100.0%) |
| 10 to 14 Year Olds | 0 (0.0%) | 4 (100.0%) |
| 15 to 17 Year Olds | 0 (0.0%) | 3 (100.0%) |
| 18 to 19 Year Olds | 0 (0.0%) | 0 (0.0%) |
| 20 to 24 Year Olds | 0 (0.0%) | 0 (0.0%) |
| 25 to 34 Year Olds | 0 (0.0%) | 0 (0.0%) |
| 35 Years and over | 0 (0.0%) | 0 (0.0%) |
| Total | 0 (0.0%) | 13 (100.0%) |
Educational Attainment by Field of Study in Halifax
Science & technology (44 | 74.6%), liberal arts & history (10 | 17.0%), and arts & humanities (5 | 8.5%) are the most common fields of study among 59 individuals in Halifax who have obtained a bachelor's degree or higher.
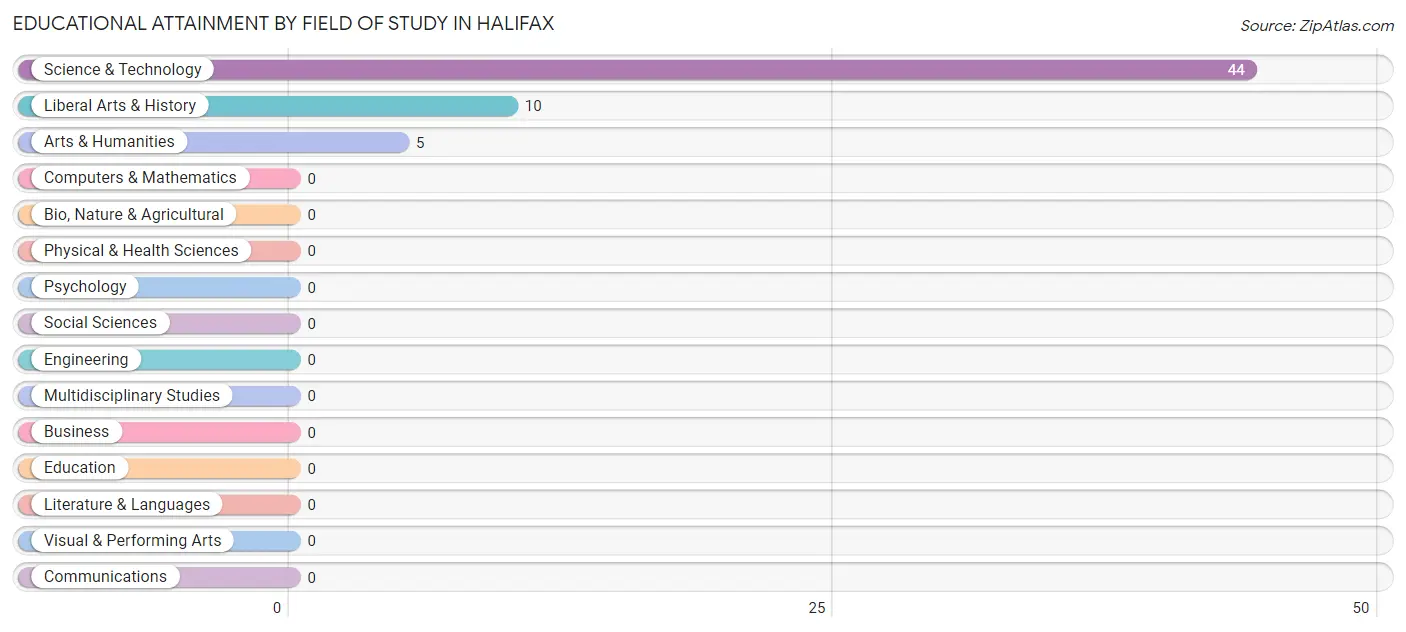
| Field of Study | # Graduates | % Graduates |
| Computers & Mathematics | 0 | 0.0% |
| Bio, Nature & Agricultural | 0 | 0.0% |
| Physical & Health Sciences | 0 | 0.0% |
| Psychology | 0 | 0.0% |
| Social Sciences | 0 | 0.0% |
| Engineering | 0 | 0.0% |
| Multidisciplinary Studies | 0 | 0.0% |
| Science & Technology | 44 | 74.6% |
| Business | 0 | 0.0% |
| Education | 0 | 0.0% |
| Literature & Languages | 0 | 0.0% |
| Liberal Arts & History | 10 | 17.0% |
| Visual & Performing Arts | 0 | 0.0% |
| Communications | 0 | 0.0% |
| Arts & Humanities | 5 | 8.5% |
| Total | 59 | 100.0% |
Transportation & Commute in Halifax
Vehicle Availability by Sex in Halifax
The most prevalent vehicle ownership categories in Halifax are males with 2 vehicles (48, accounting for 44.0%) and females with 2 vehicles (14, making up 64.9%).
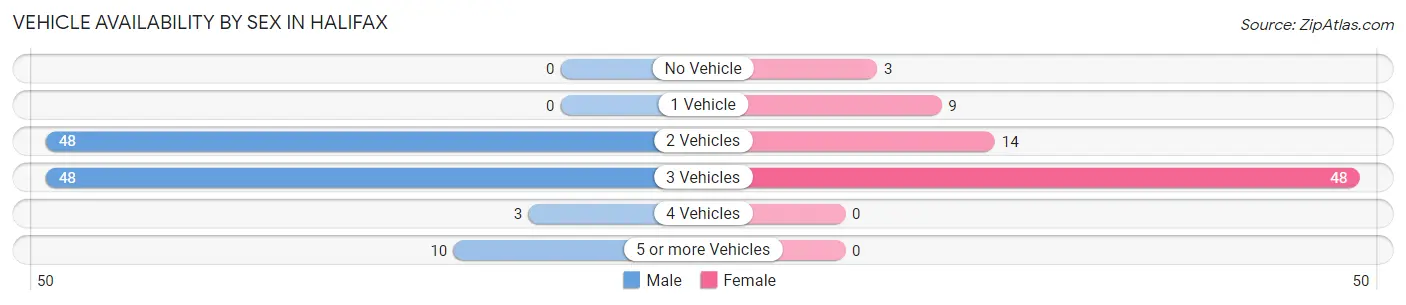
| Vehicles Available | Male | Female |
| No Vehicle | 0 (0.0%) | 3 (4.1%) |
| 1 Vehicle | 0 (0.0%) | 9 (12.2%) |
| 2 Vehicles | 48 (44.0%) | 14 (18.9%) |
| 3 Vehicles | 48 (44.0%) | 48 (64.9%) |
| 4 Vehicles | 3 (2.8%) | 0 (0.0%) |
| 5 or more Vehicles | 10 (9.2%) | 0 (0.0%) |
| Total | 109 (100.0%) | 74 (100.0%) |
Commute Time in Halifax
The most frequently occuring commute durations in Halifax are 30 to 34 minutes (92 commuters, 51.4%), 20 to 24 minutes (38 commuters, 21.2%), and less than 5 minutes (21 commuters, 11.7%).
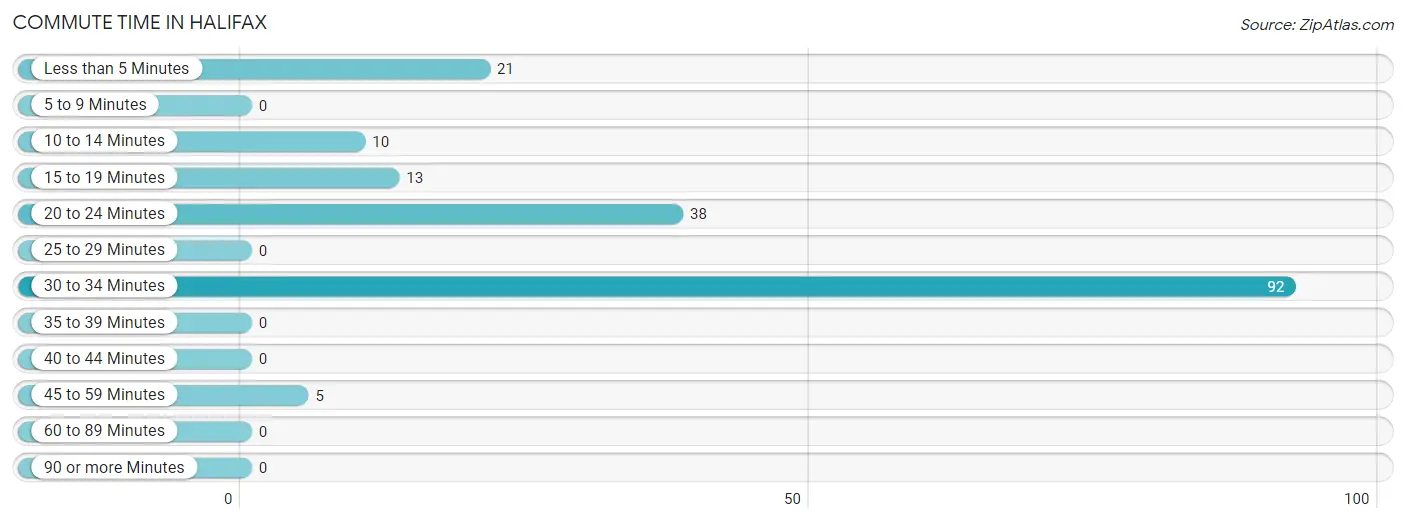
| Commute Time | # Commuters | % Commuters |
| Less than 5 Minutes | 21 | 11.7% |
| 5 to 9 Minutes | 0 | 0.0% |
| 10 to 14 Minutes | 10 | 5.6% |
| 15 to 19 Minutes | 13 | 7.3% |
| 20 to 24 Minutes | 38 | 21.2% |
| 25 to 29 Minutes | 0 | 0.0% |
| 30 to 34 Minutes | 92 | 51.4% |
| 35 to 39 Minutes | 0 | 0.0% |
| 40 to 44 Minutes | 0 | 0.0% |
| 45 to 59 Minutes | 5 | 2.8% |
| 60 to 89 Minutes | 0 | 0.0% |
| 90 or more Minutes | 0 | 0.0% |
Commute Time by Sex in Halifax
The most common commute times in Halifax are 30 to 34 minutes (48 commuters, 44.0%) for males and 30 to 34 minutes (44 commuters, 62.9%) for females.
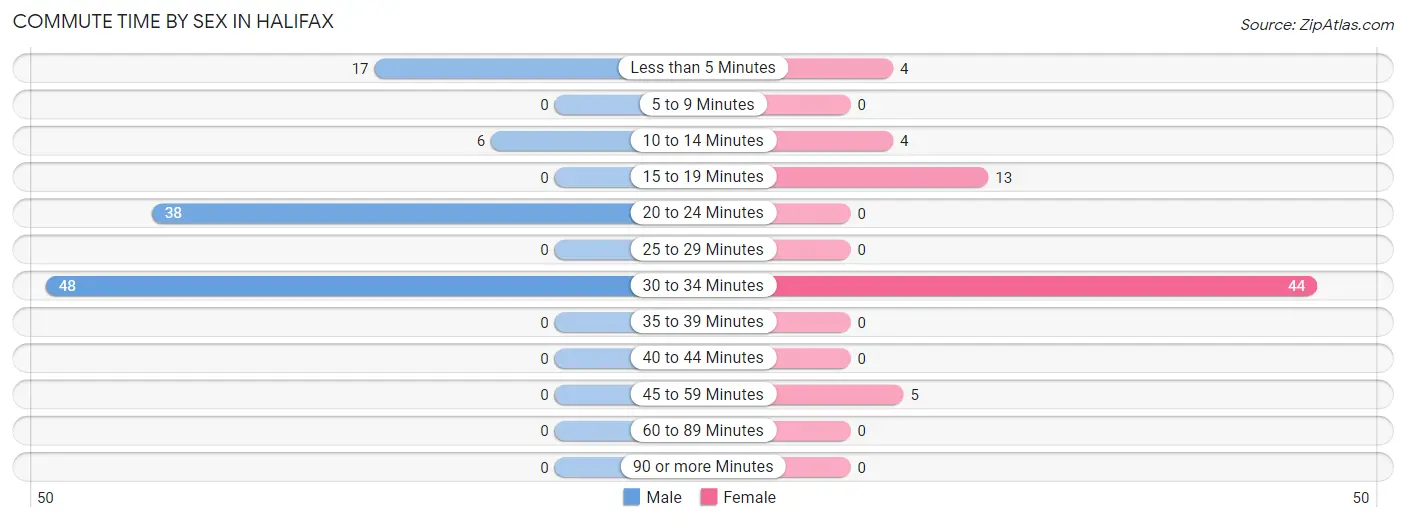
| Commute Time | Male | Female |
| Less than 5 Minutes | 17 (15.6%) | 4 (5.7%) |
| 5 to 9 Minutes | 0 (0.0%) | 0 (0.0%) |
| 10 to 14 Minutes | 6 (5.5%) | 4 (5.7%) |
| 15 to 19 Minutes | 0 (0.0%) | 13 (18.6%) |
| 20 to 24 Minutes | 38 (34.9%) | 0 (0.0%) |
| 25 to 29 Minutes | 0 (0.0%) | 0 (0.0%) |
| 30 to 34 Minutes | 48 (44.0%) | 44 (62.9%) |
| 35 to 39 Minutes | 0 (0.0%) | 0 (0.0%) |
| 40 to 44 Minutes | 0 (0.0%) | 0 (0.0%) |
| 45 to 59 Minutes | 0 (0.0%) | 5 (7.1%) |
| 60 to 89 Minutes | 0 (0.0%) | 0 (0.0%) |
| 90 or more Minutes | 0 (0.0%) | 0 (0.0%) |
Time of Departure to Work by Sex in Halifax
The most frequent times of departure to work in Halifax are 8:00 AM to 8:29 AM (44, 40.4%) for males and 7:00 AM to 7:29 AM (44, 62.9%) for females.
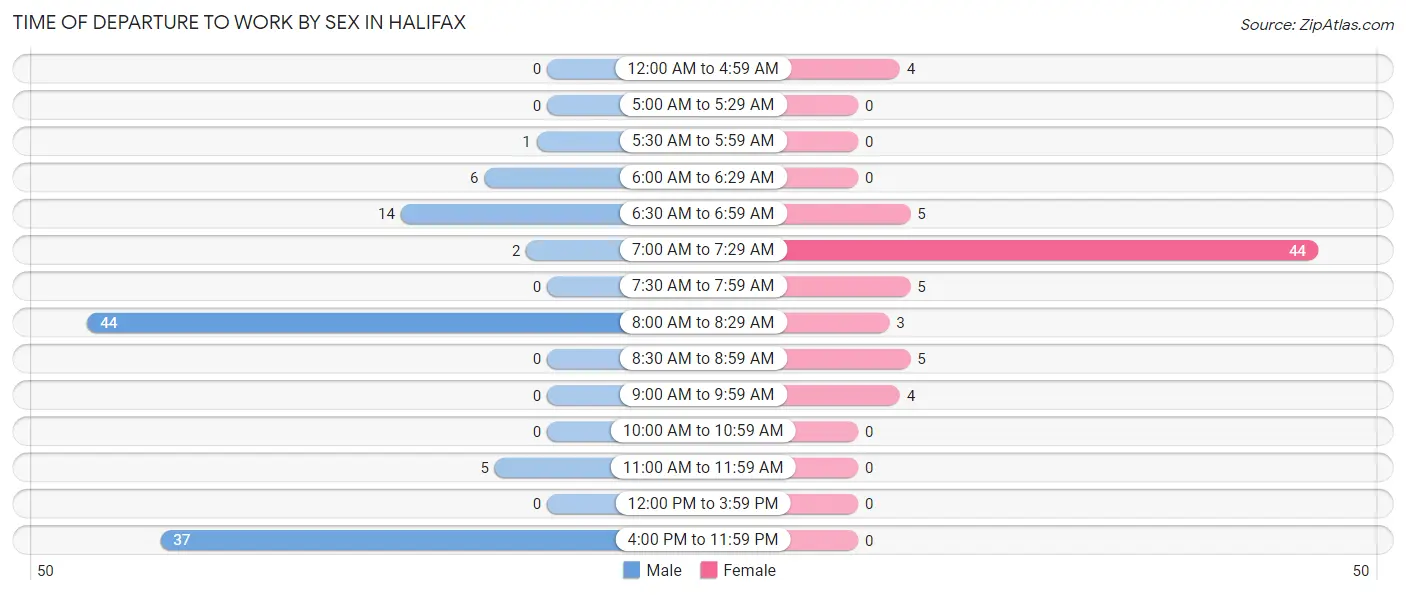
| Time of Departure | Male | Female |
| 12:00 AM to 4:59 AM | 0 (0.0%) | 4 (5.7%) |
| 5:00 AM to 5:29 AM | 0 (0.0%) | 0 (0.0%) |
| 5:30 AM to 5:59 AM | 1 (0.9%) | 0 (0.0%) |
| 6:00 AM to 6:29 AM | 6 (5.5%) | 0 (0.0%) |
| 6:30 AM to 6:59 AM | 14 (12.8%) | 5 (7.1%) |
| 7:00 AM to 7:29 AM | 2 (1.8%) | 44 (62.9%) |
| 7:30 AM to 7:59 AM | 0 (0.0%) | 5 (7.1%) |
| 8:00 AM to 8:29 AM | 44 (40.4%) | 3 (4.3%) |
| 8:30 AM to 8:59 AM | 0 (0.0%) | 5 (7.1%) |
| 9:00 AM to 9:59 AM | 0 (0.0%) | 4 (5.7%) |
| 10:00 AM to 10:59 AM | 0 (0.0%) | 0 (0.0%) |
| 11:00 AM to 11:59 AM | 5 (4.6%) | 0 (0.0%) |
| 12:00 PM to 3:59 PM | 0 (0.0%) | 0 (0.0%) |
| 4:00 PM to 11:59 PM | 37 (33.9%) | 0 (0.0%) |
| Total | 109 (100.0%) | 70 (100.0%) |
Housing Occupancy in Halifax
Occupancy by Ownership in Halifax
Of the total 132 dwellings in Halifax, owner-occupied units account for 114 (86.4%), while renter-occupied units make up 18 (13.6%).
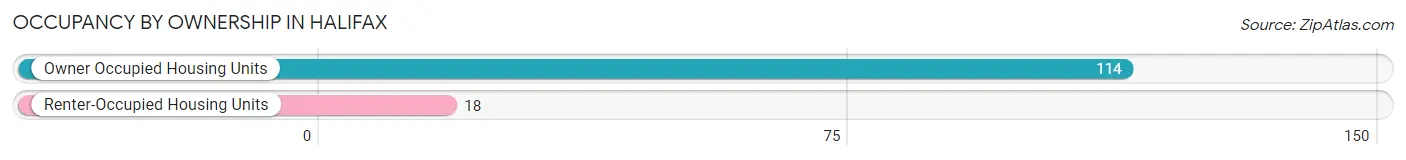
| Occupancy | # Housing Units | % Housing Units |
| Owner Occupied Housing Units | 114 | 86.4% |
| Renter-Occupied Housing Units | 18 | 13.6% |
| Total Occupied Housing Units | 132 | 100.0% |
Occupancy by Household Size in Halifax
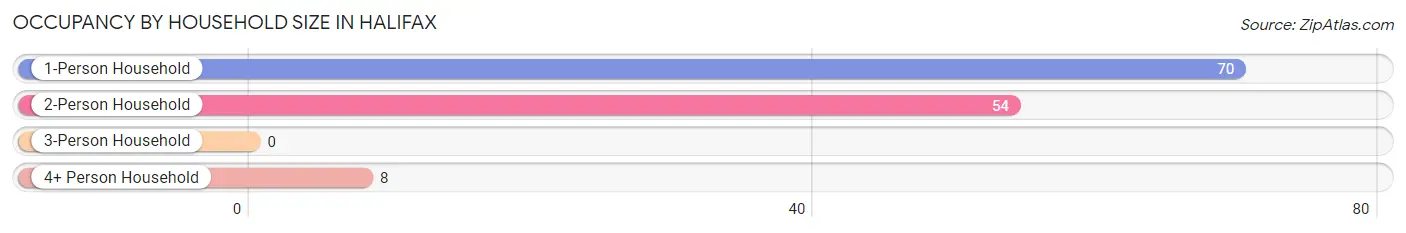
| Household Size | # Housing Units | % Housing Units |
| 1-Person Household | 70 | 53.0% |
| 2-Person Household | 54 | 40.9% |
| 3-Person Household | 0 | 0.0% |
| 4+ Person Household | 8 | 6.1% |
| Total Housing Units | 132 | 100.0% |
Occupancy by Ownership by Household Size in Halifax
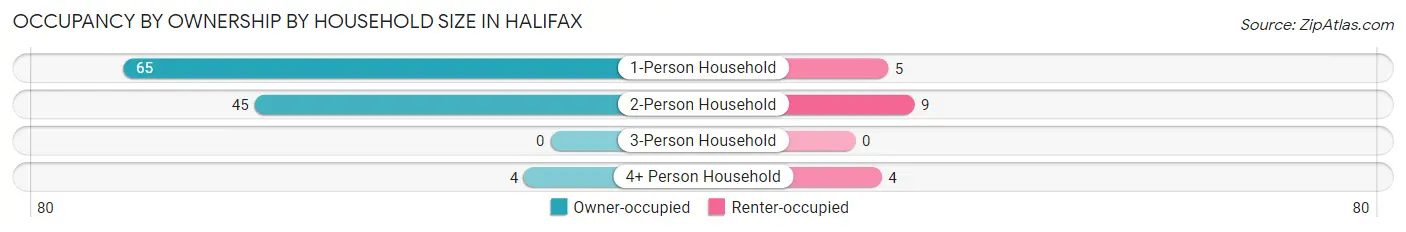
| Household Size | Owner-occupied | Renter-occupied |
| 1-Person Household | 65 (92.9%) | 5 (7.1%) |
| 2-Person Household | 45 (83.3%) | 9 (16.7%) |
| 3-Person Household | 0 (0.0%) | 0 (0.0%) |
| 4+ Person Household | 4 (50.0%) | 4 (50.0%) |
| Total Housing Units | 114 (86.4%) | 18 (13.6%) |
Occupancy by Educational Attainment in Halifax
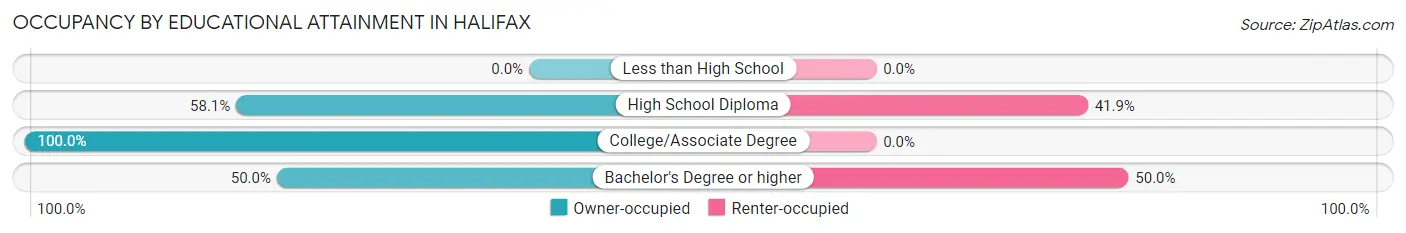
| Household Size | Owner-occupied | Renter-occupied |
| Less than High School | 0 (0.0%) | 0 (0.0%) |
| High School Diploma | 18 (58.1%) | 13 (41.9%) |
| College/Associate Degree | 91 (100.0%) | 0 (0.0%) |
| Bachelor's Degree or higher | 5 (50.0%) | 5 (50.0%) |
Occupancy by Age of Householder in Halifax
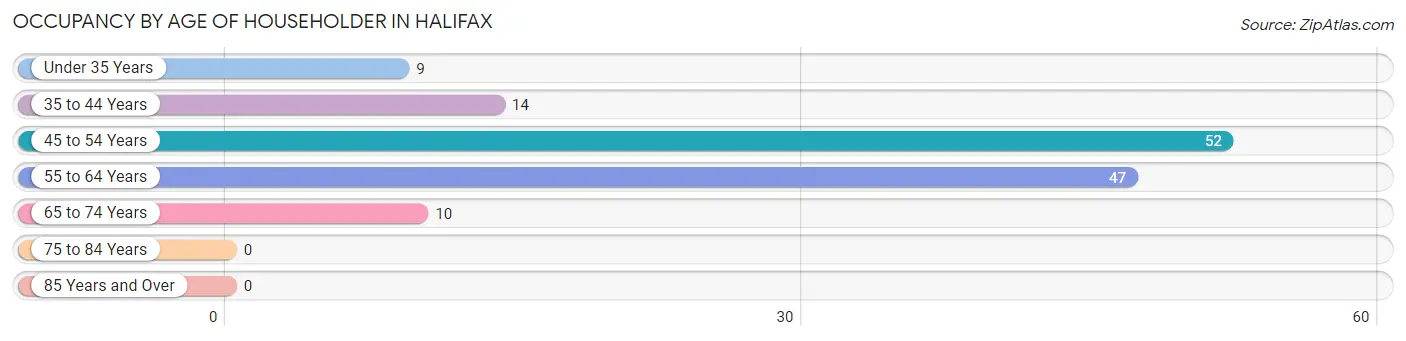
| Age Bracket | # Households | % Households |
| Under 35 Years | 9 | 6.8% |
| 35 to 44 Years | 14 | 10.6% |
| 45 to 54 Years | 52 | 39.4% |
| 55 to 64 Years | 47 | 35.6% |
| 65 to 74 Years | 10 | 7.6% |
| 75 to 84 Years | 0 | 0.0% |
| 85 Years and Over | 0 | 0.0% |
| Total | 132 | 100.0% |
Housing Finances in Halifax
Median Income by Occupancy in Halifax
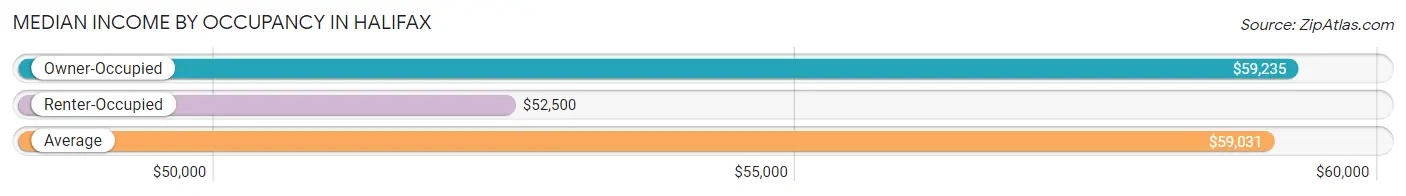
| Occupancy Type | # Households | Median Income |
| Owner-Occupied | 114 (86.4%) | $59,235 |
| Renter-Occupied | 18 (13.6%) | $52,500 |
| Average | 132 (100.0%) | $59,031 |
Occupancy by Householder Income Bracket in Halifax
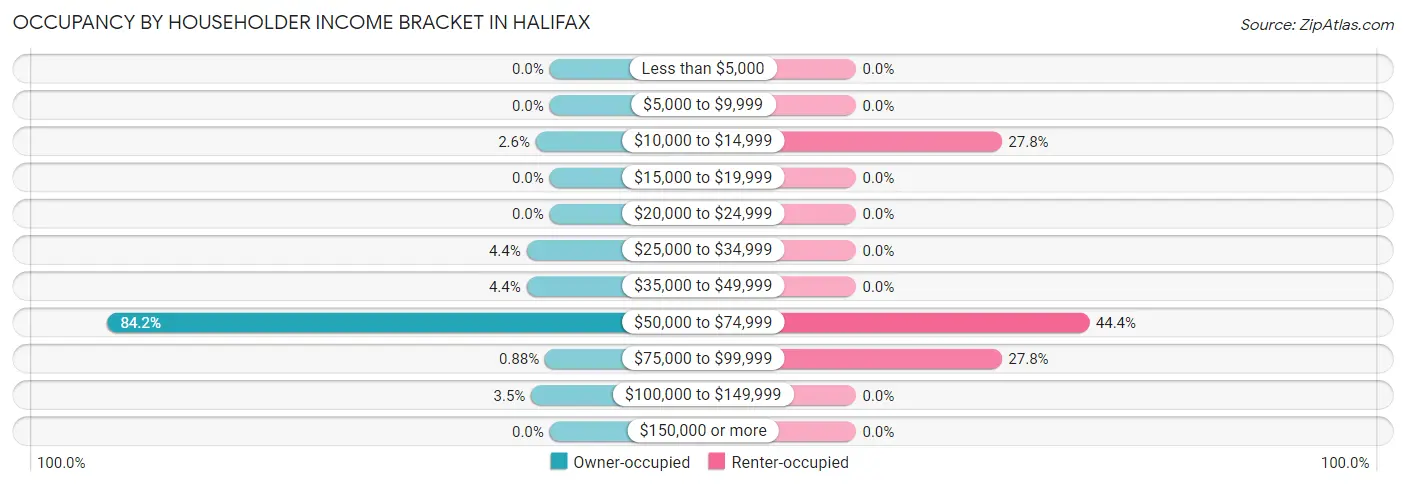
| Income Bracket | Owner-occupied | Renter-occupied |
| Less than $5,000 | 0 (0.0%) | 0 (0.0%) |
| $5,000 to $9,999 | 0 (0.0%) | 0 (0.0%) |
| $10,000 to $14,999 | 3 (2.6%) | 5 (27.8%) |
| $15,000 to $19,999 | 0 (0.0%) | 0 (0.0%) |
| $20,000 to $24,999 | 0 (0.0%) | 0 (0.0%) |
| $25,000 to $34,999 | 5 (4.4%) | 0 (0.0%) |
| $35,000 to $49,999 | 5 (4.4%) | 0 (0.0%) |
| $50,000 to $74,999 | 96 (84.2%) | 8 (44.4%) |
| $75,000 to $99,999 | 1 (0.9%) | 5 (27.8%) |
| $100,000 to $149,999 | 4 (3.5%) | 0 (0.0%) |
| $150,000 or more | 0 (0.0%) | 0 (0.0%) |
| Total | 114 (100.0%) | 18 (100.0%) |
Monthly Housing Cost Tiers in Halifax
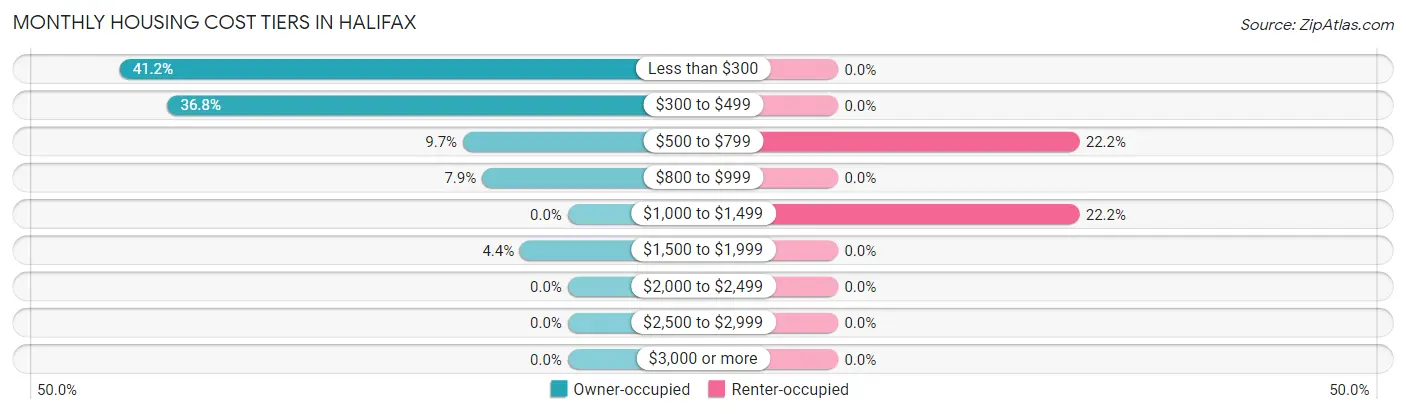
| Monthly Cost | Owner-occupied | Renter-occupied |
| Less than $300 | 47 (41.2%) | 0 (0.0%) |
| $300 to $499 | 42 (36.8%) | 0 (0.0%) |
| $500 to $799 | 11 (9.7%) | 4 (22.2%) |
| $800 to $999 | 9 (7.9%) | 0 (0.0%) |
| $1,000 to $1,499 | 0 (0.0%) | 4 (22.2%) |
| $1,500 to $1,999 | 5 (4.4%) | 0 (0.0%) |
| $2,000 to $2,499 | 0 (0.0%) | 0 (0.0%) |
| $2,500 to $2,999 | 0 (0.0%) | 0 (0.0%) |
| $3,000 or more | 0 (0.0%) | 0 (0.0%) |
| Total | 114 (100.0%) | 18 (100.0%) |
Physical Housing Characteristics in Halifax
Housing Structures in Halifax
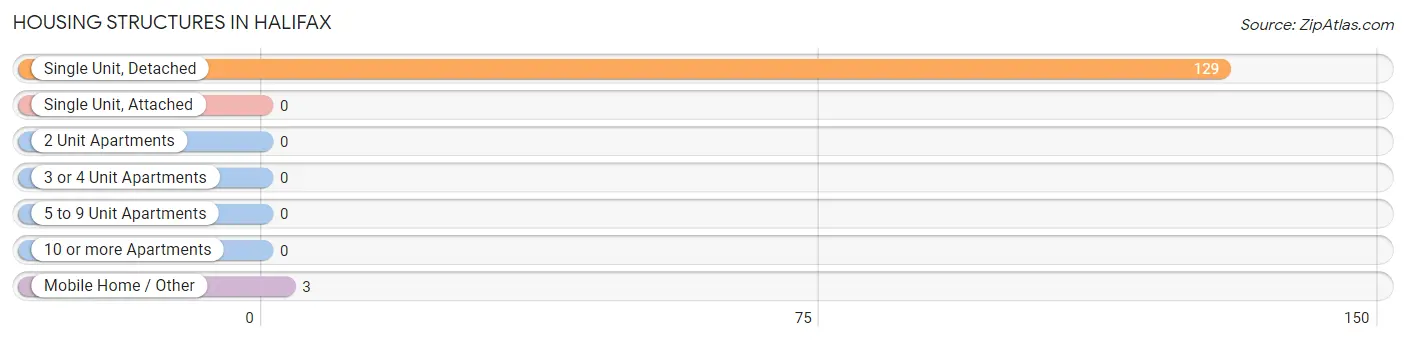
| Structure Type | # Housing Units | % Housing Units |
| Single Unit, Detached | 129 | 97.7% |
| Single Unit, Attached | 0 | 0.0% |
| 2 Unit Apartments | 0 | 0.0% |
| 3 or 4 Unit Apartments | 0 | 0.0% |
| 5 to 9 Unit Apartments | 0 | 0.0% |
| 10 or more Apartments | 0 | 0.0% |
| Mobile Home / Other | 3 | 2.3% |
| Total | 132 | 100.0% |
Housing Structures by Occupancy in Halifax
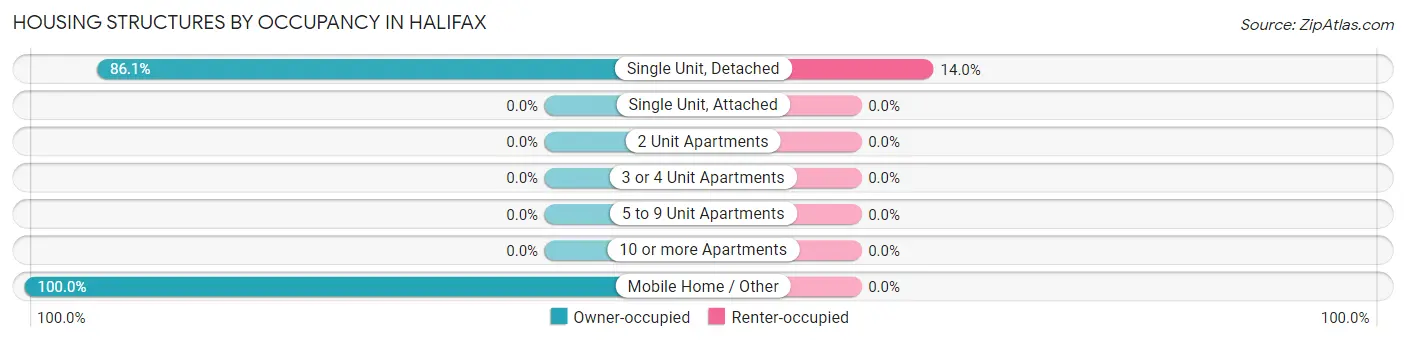
| Structure Type | Owner-occupied | Renter-occupied |
| Single Unit, Detached | 111 (86.1%) | 18 (14.0%) |
| Single Unit, Attached | 0 (0.0%) | 0 (0.0%) |
| 2 Unit Apartments | 0 (0.0%) | 0 (0.0%) |
| 3 or 4 Unit Apartments | 0 (0.0%) | 0 (0.0%) |
| 5 to 9 Unit Apartments | 0 (0.0%) | 0 (0.0%) |
| 10 or more Apartments | 0 (0.0%) | 0 (0.0%) |
| Mobile Home / Other | 3 (100.0%) | 0 (0.0%) |
| Total | 114 (86.4%) | 18 (13.6%) |
Housing Structures by Number of Rooms in Halifax
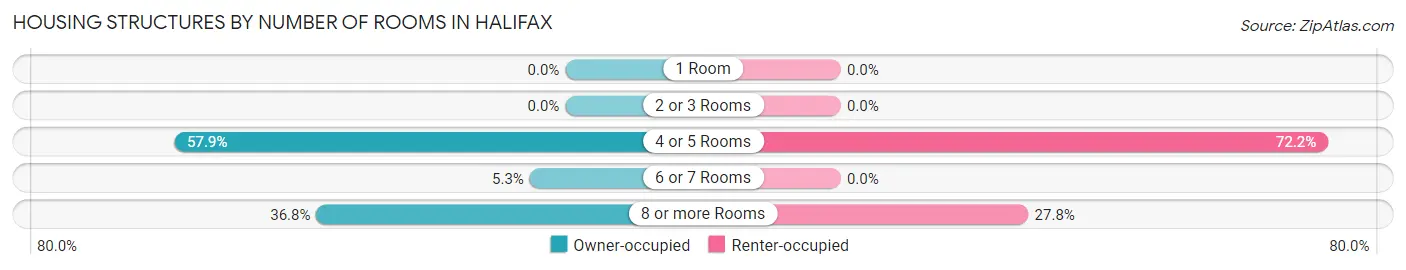
| Number of Rooms | Owner-occupied | Renter-occupied |
| 1 Room | 0 (0.0%) | 0 (0.0%) |
| 2 or 3 Rooms | 0 (0.0%) | 0 (0.0%) |
| 4 or 5 Rooms | 66 (57.9%) | 13 (72.2%) |
| 6 or 7 Rooms | 6 (5.3%) | 0 (0.0%) |
| 8 or more Rooms | 42 (36.8%) | 5 (27.8%) |
| Total | 114 (100.0%) | 18 (100.0%) |
Housing Structure by Heating Type in Halifax
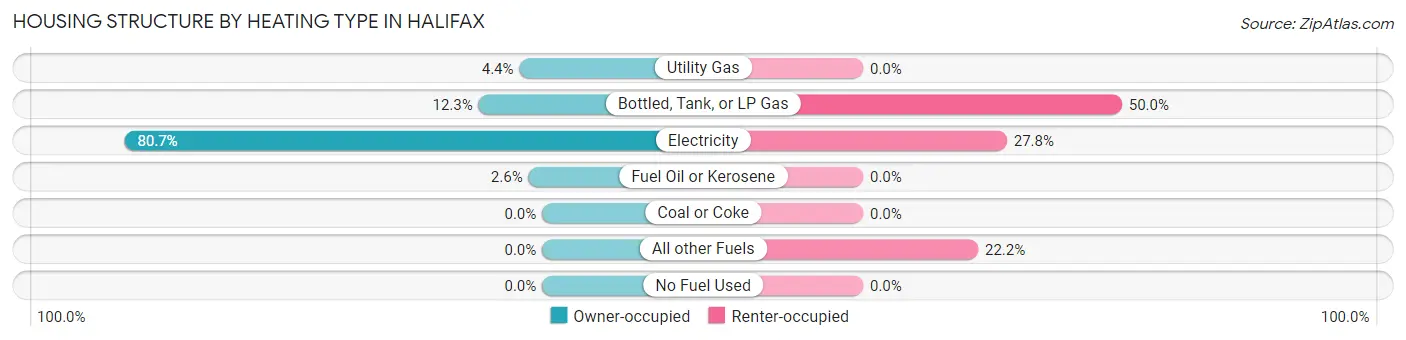
| Heating Type | Owner-occupied | Renter-occupied |
| Utility Gas | 5 (4.4%) | 0 (0.0%) |
| Bottled, Tank, or LP Gas | 14 (12.3%) | 9 (50.0%) |
| Electricity | 92 (80.7%) | 5 (27.8%) |
| Fuel Oil or Kerosene | 3 (2.6%) | 0 (0.0%) |
| Coal or Coke | 0 (0.0%) | 0 (0.0%) |
| All other Fuels | 0 (0.0%) | 4 (22.2%) |
| No Fuel Used | 0 (0.0%) | 0 (0.0%) |
| Total | 114 (100.0%) | 18 (100.0%) |
Household Vehicle Usage in Halifax
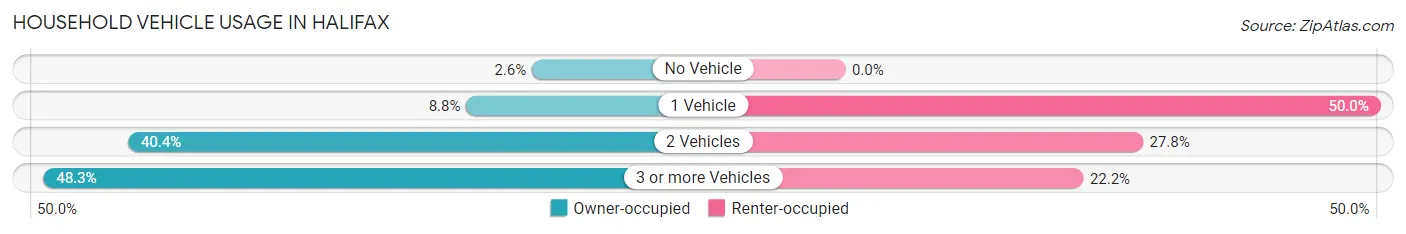
| Vehicles per Household | Owner-occupied | Renter-occupied |
| No Vehicle | 3 (2.6%) | 0 (0.0%) |
| 1 Vehicle | 10 (8.8%) | 9 (50.0%) |
| 2 Vehicles | 46 (40.4%) | 5 (27.8%) |
| 3 or more Vehicles | 55 (48.2%) | 4 (22.2%) |
| Total | 114 (100.0%) | 18 (100.0%) |
Real Estate & Mortgages in Halifax
Real Estate and Mortgage Overview in Halifax
| Characteristic | Without Mortgage | With Mortgage |
| Housing Units | 50 | 64 |
| Median Property Value | $110,400 | $47,300 |
| Median Household Income | $71,149 | $0 |
| Monthly Housing Costs | $380 | $0 |
| Real Estate Taxes | $1,207 | $0 |
Property Value by Mortgage Status in Halifax
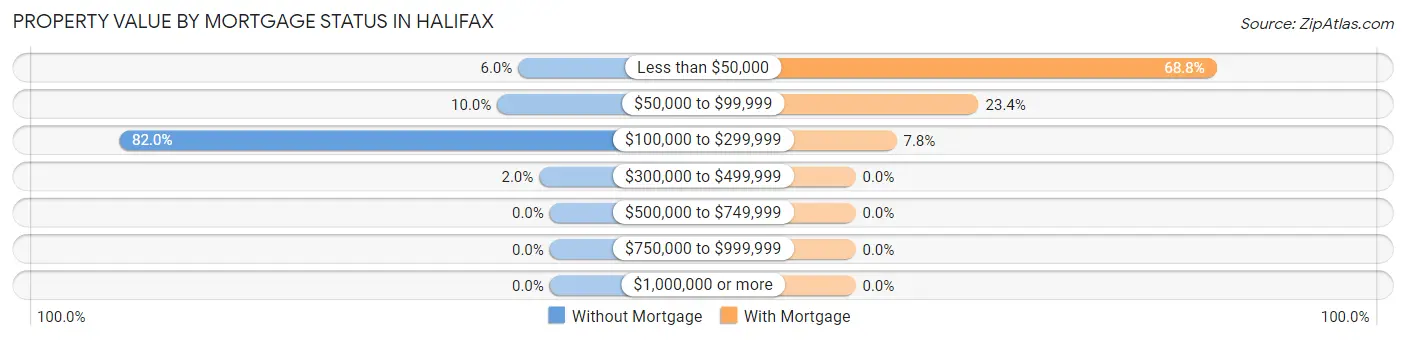
| Property Value | Without Mortgage | With Mortgage |
| Less than $50,000 | 3 (6.0%) | 44 (68.8%) |
| $50,000 to $99,999 | 5 (10.0%) | 15 (23.4%) |
| $100,000 to $299,999 | 41 (82.0%) | 5 (7.8%) |
| $300,000 to $499,999 | 1 (2.0%) | 0 (0.0%) |
| $500,000 to $749,999 | 0 (0.0%) | 0 (0.0%) |
| $750,000 to $999,999 | 0 (0.0%) | 0 (0.0%) |
| $1,000,000 or more | 0 (0.0%) | 0 (0.0%) |
| Total | 50 (100.0%) | 64 (100.0%) |
Household Income by Mortgage Status in Halifax
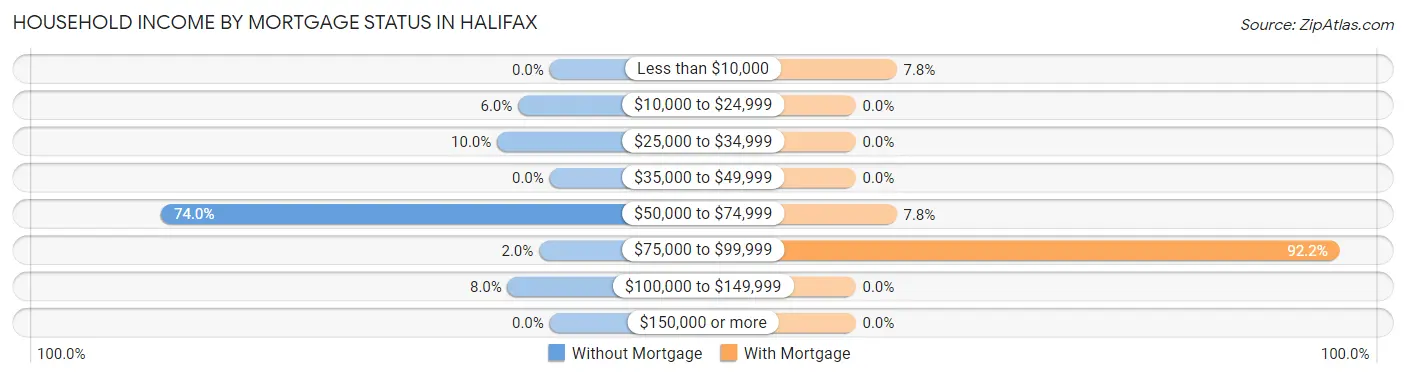
| Household Income | Without Mortgage | With Mortgage |
| Less than $10,000 | 0 (0.0%) | 5 (7.8%) |
| $10,000 to $24,999 | 3 (6.0%) | 0 (0.0%) |
| $25,000 to $34,999 | 5 (10.0%) | 0 (0.0%) |
| $35,000 to $49,999 | 0 (0.0%) | 0 (0.0%) |
| $50,000 to $74,999 | 37 (74.0%) | 5 (7.8%) |
| $75,000 to $99,999 | 1 (2.0%) | 59 (92.2%) |
| $100,000 to $149,999 | 4 (8.0%) | 0 (0.0%) |
| $150,000 or more | 0 (0.0%) | 0 (0.0%) |
| Total | 50 (100.0%) | 64 (100.0%) |
Property Value to Household Income Ratio in Halifax
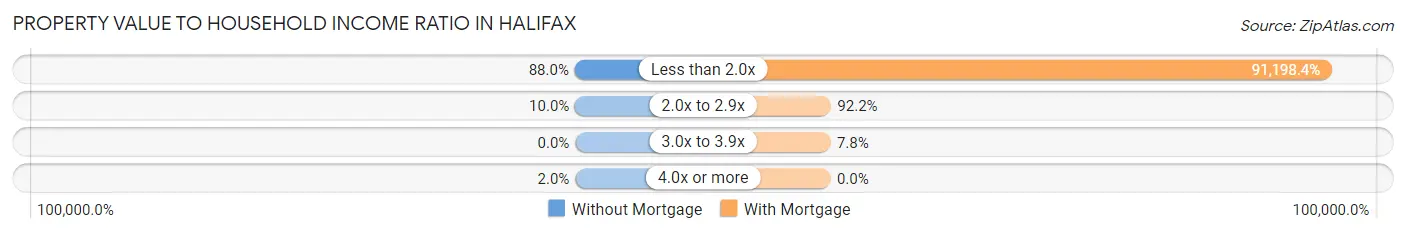
| Value-to-Income Ratio | Without Mortgage | With Mortgage |
| Less than 2.0x | 44 (88.0%) | 58,367 (91,198.4%) |
| 2.0x to 2.9x | 5 (10.0%) | 59 (92.2%) |
| 3.0x to 3.9x | 0 (0.0%) | 5 (7.8%) |
| 4.0x or more | 1 (2.0%) | 0 (0.0%) |
| Total | 50 (100.0%) | 64 (100.0%) |
Real Estate Taxes by Mortgage Status in Halifax
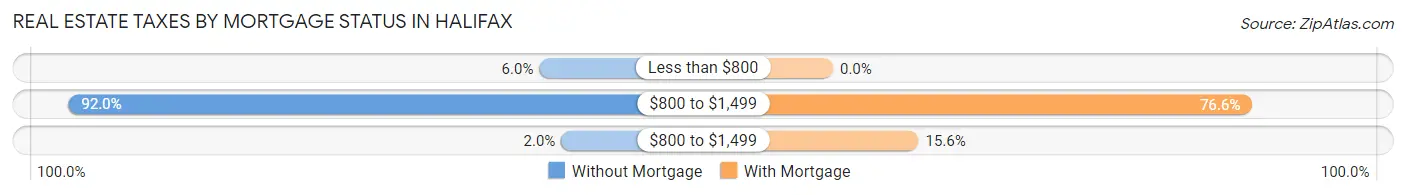
| Property Taxes | Without Mortgage | With Mortgage |
| Less than $800 | 3 (6.0%) | 0 (0.0%) |
| $800 to $1,499 | 46 (92.0%) | 49 (76.6%) |
| $800 to $1,499 | 1 (2.0%) | 10 (15.6%) |
| Total | 50 (100.0%) | 64 (100.0%) |
Health & Disability in Halifax
Health Insurance Coverage by Age in Halifax
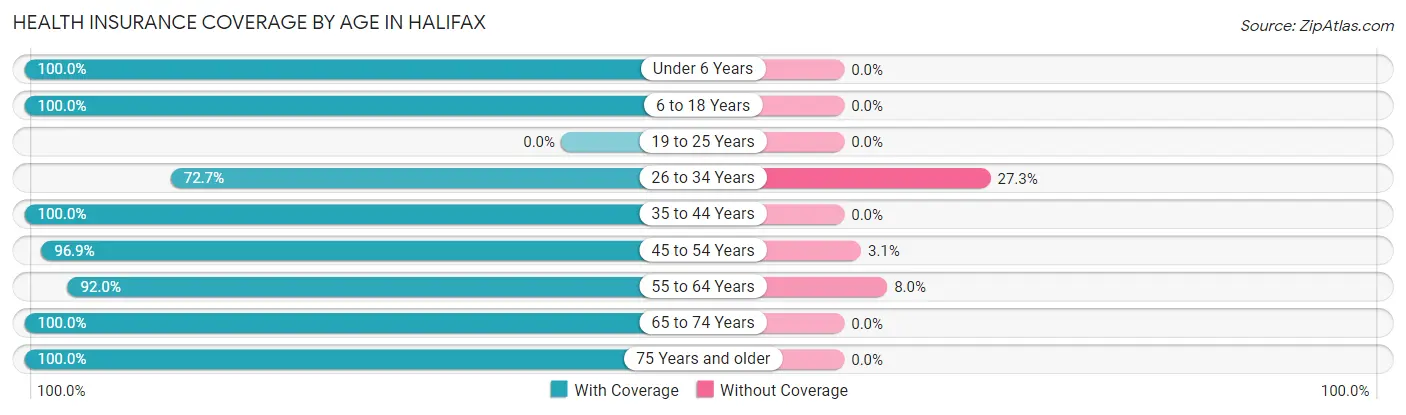
| Age Bracket | With Coverage | Without Coverage |
| Under 6 Years | 9 (100.0%) | 0 (0.0%) |
| 6 to 18 Years | 13 (100.0%) | 0 (0.0%) |
| 19 to 25 Years | 0 (0.0%) | 0 (0.0%) |
| 26 to 34 Years | 16 (72.7%) | 6 (27.3%) |
| 35 to 44 Years | 20 (100.0%) | 0 (0.0%) |
| 45 to 54 Years | 93 (96.9%) | 3 (3.1%) |
| 55 to 64 Years | 46 (92.0%) | 4 (8.0%) |
| 65 to 74 Years | 10 (100.0%) | 0 (0.0%) |
| 75 Years and older | 7 (100.0%) | 0 (0.0%) |
| Total | 214 (94.3%) | 13 (5.7%) |
Health Insurance Coverage by Citizenship Status in Halifax
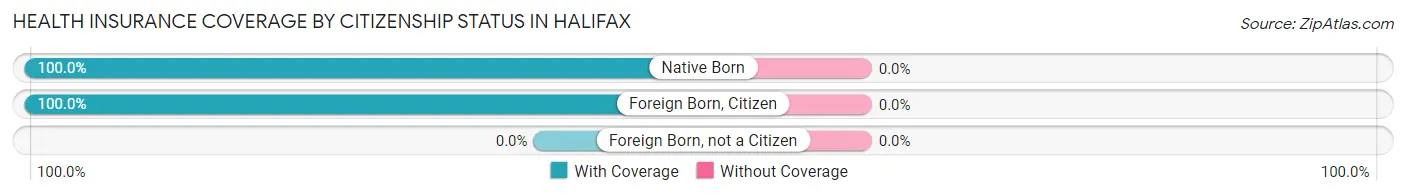
| Citizenship Status | With Coverage | Without Coverage |
| Native Born | 9 (100.0%) | 0 (0.0%) |
| Foreign Born, Citizen | 13 (100.0%) | 0 (0.0%) |
| Foreign Born, not a Citizen | 0 (0.0%) | 0 (0.0%) |
Health Insurance Coverage by Household Income in Halifax
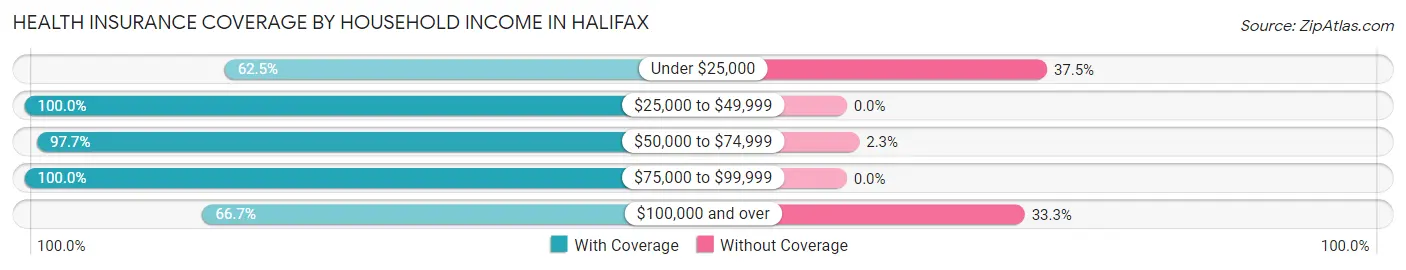
| Household Income | With Coverage | Without Coverage |
| Under $25,000 | 5 (62.5%) | 3 (37.5%) |
| $25,000 to $49,999 | 10 (100.0%) | 0 (0.0%) |
| $50,000 to $74,999 | 167 (97.7%) | 4 (2.3%) |
| $75,000 to $99,999 | 13 (100.0%) | 0 (0.0%) |
| $100,000 and over | 12 (66.7%) | 6 (33.3%) |
Public vs Private Health Insurance Coverage by Age in Halifax
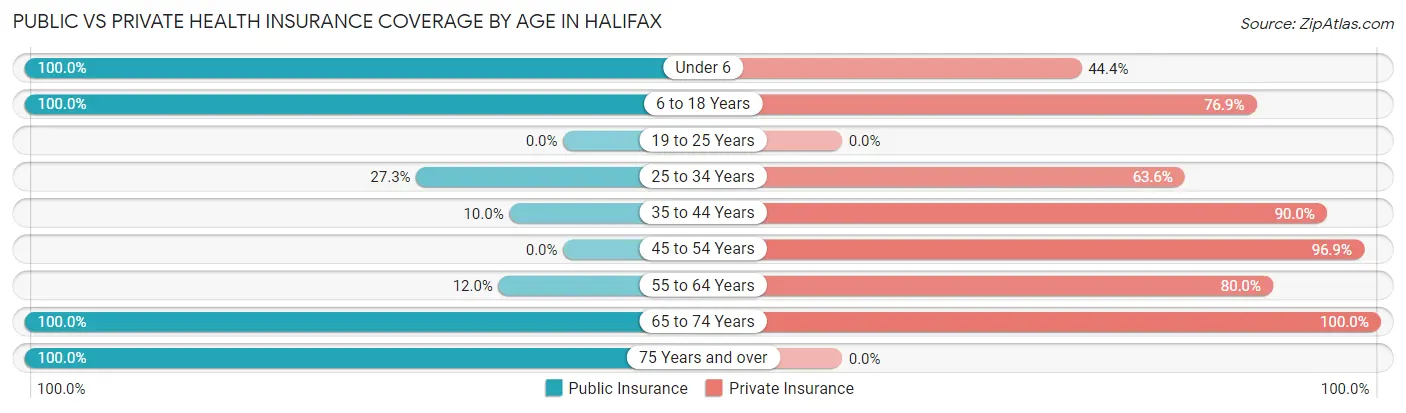
| Age Bracket | Public Insurance | Private Insurance |
| Under 6 | 9 (100.0%) | 4 (44.4%) |
| 6 to 18 Years | 13 (100.0%) | 10 (76.9%) |
| 19 to 25 Years | 0 (0.0%) | 0 (0.0%) |
| 25 to 34 Years | 6 (27.3%) | 14 (63.6%) |
| 35 to 44 Years | 2 (10.0%) | 18 (90.0%) |
| 45 to 54 Years | 0 (0.0%) | 93 (96.9%) |
| 55 to 64 Years | 6 (12.0%) | 40 (80.0%) |
| 65 to 74 Years | 10 (100.0%) | 10 (100.0%) |
| 75 Years and over | 7 (100.0%) | 0 (0.0%) |
| Total | 53 (23.4%) | 189 (83.3%) |
Disability Status by Sex by Age in Halifax
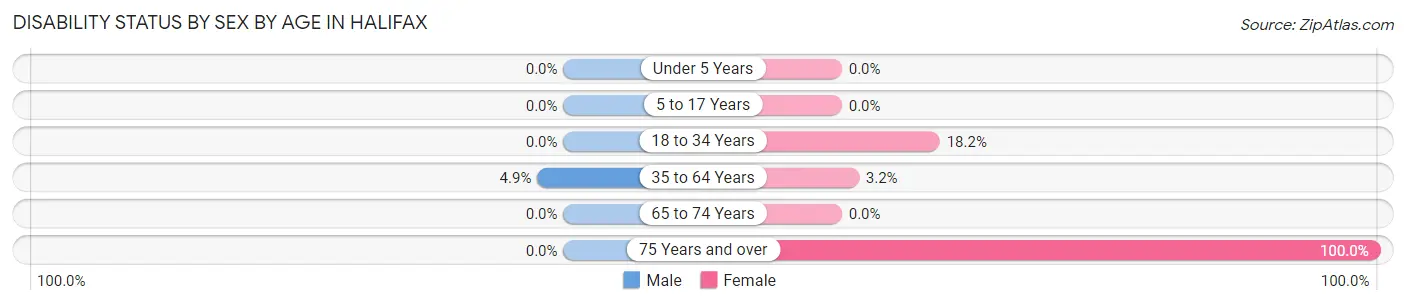
| Age Bracket | Male | Female |
| Under 5 Years | 0 (0.0%) | 0 (0.0%) |
| 5 to 17 Years | 0 (0.0%) | 0 (0.0%) |
| 18 to 34 Years | 0 (0.0%) | 2 (18.2%) |
| 35 to 64 Years | 5 (4.9%) | 2 (3.2%) |
| 65 to 74 Years | 0 (0.0%) | 0 (0.0%) |
| 75 Years and over | 0 (0.0%) | 7 (100.0%) |
Disability Class by Sex by Age in Halifax
Disability Class: Hearing Difficulty
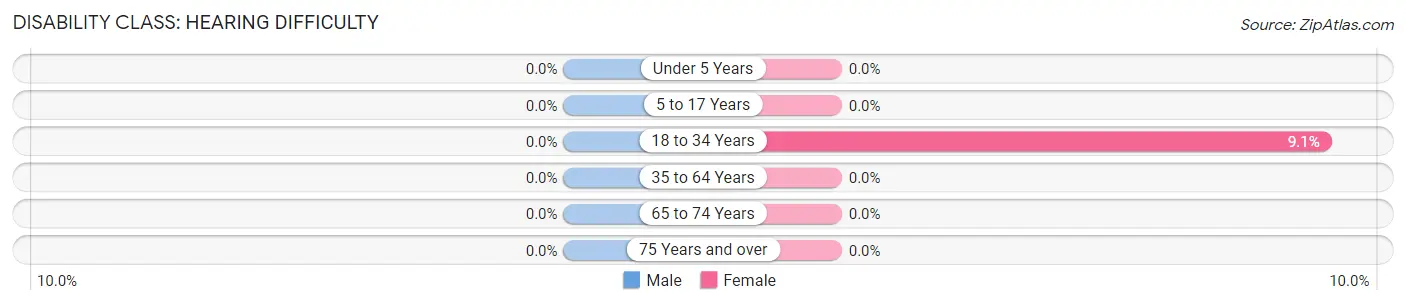
| Age Bracket | Male | Female |
| Under 5 Years | 0 (0.0%) | 0 (0.0%) |
| 5 to 17 Years | 0 (0.0%) | 0 (0.0%) |
| 18 to 34 Years | 0 (0.0%) | 1 (9.1%) |
| 35 to 64 Years | 0 (0.0%) | 0 (0.0%) |
| 65 to 74 Years | 0 (0.0%) | 0 (0.0%) |
| 75 Years and over | 0 (0.0%) | 0 (0.0%) |
Disability Class: Vision Difficulty
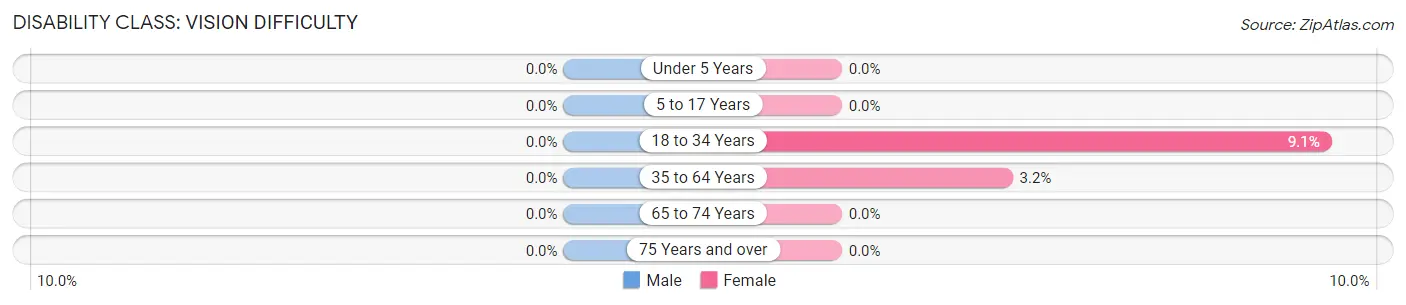
| Age Bracket | Male | Female |
| Under 5 Years | 0 (0.0%) | 0 (0.0%) |
| 5 to 17 Years | 0 (0.0%) | 0 (0.0%) |
| 18 to 34 Years | 0 (0.0%) | 1 (9.1%) |
| 35 to 64 Years | 0 (0.0%) | 2 (3.2%) |
| 65 to 74 Years | 0 (0.0%) | 0 (0.0%) |
| 75 Years and over | 0 (0.0%) | 0 (0.0%) |
Disability Class: Cognitive Difficulty
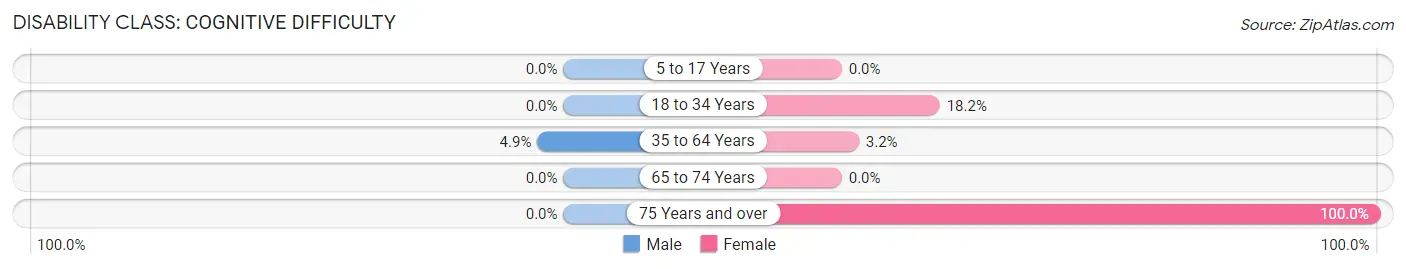
| Age Bracket | Male | Female |
| 5 to 17 Years | 0 (0.0%) | 0 (0.0%) |
| 18 to 34 Years | 0 (0.0%) | 2 (18.2%) |
| 35 to 64 Years | 5 (4.9%) | 2 (3.2%) |
| 65 to 74 Years | 0 (0.0%) | 0 (0.0%) |
| 75 Years and over | 0 (0.0%) | 7 (100.0%) |
Disability Class: Ambulatory Difficulty
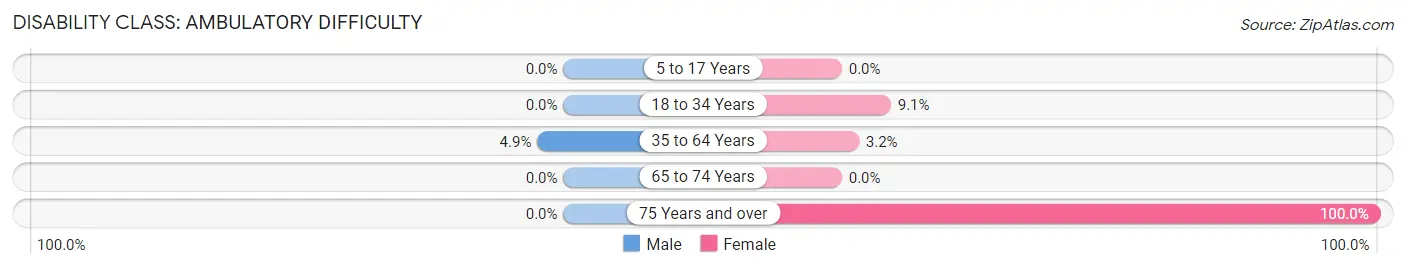
| Age Bracket | Male | Female |
| 5 to 17 Years | 0 (0.0%) | 0 (0.0%) |
| 18 to 34 Years | 0 (0.0%) | 1 (9.1%) |
| 35 to 64 Years | 5 (4.9%) | 2 (3.2%) |
| 65 to 74 Years | 0 (0.0%) | 0 (0.0%) |
| 75 Years and over | 0 (0.0%) | 7 (100.0%) |
Disability Class: Self-Care Difficulty
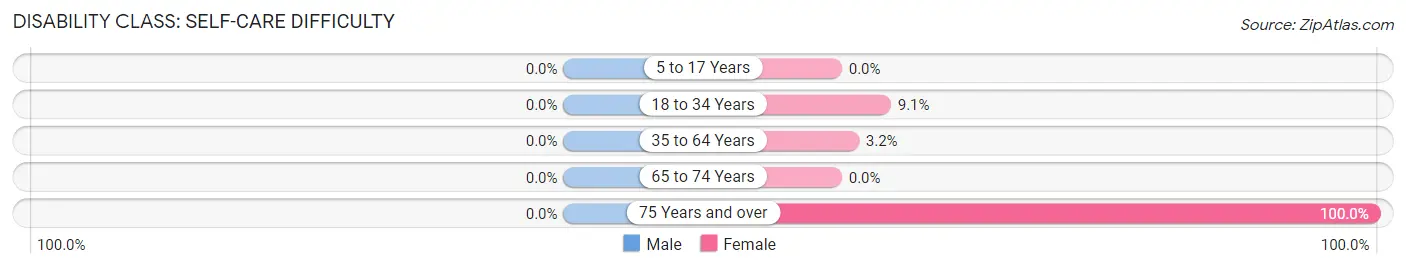
| Age Bracket | Male | Female |
| 5 to 17 Years | 0 (0.0%) | 0 (0.0%) |
| 18 to 34 Years | 0 (0.0%) | 1 (9.1%) |
| 35 to 64 Years | 0 (0.0%) | 2 (3.2%) |
| 65 to 74 Years | 0 (0.0%) | 0 (0.0%) |
| 75 Years and over | 0 (0.0%) | 7 (100.0%) |
Technology Access in Halifax
Computing Device Access in Halifax
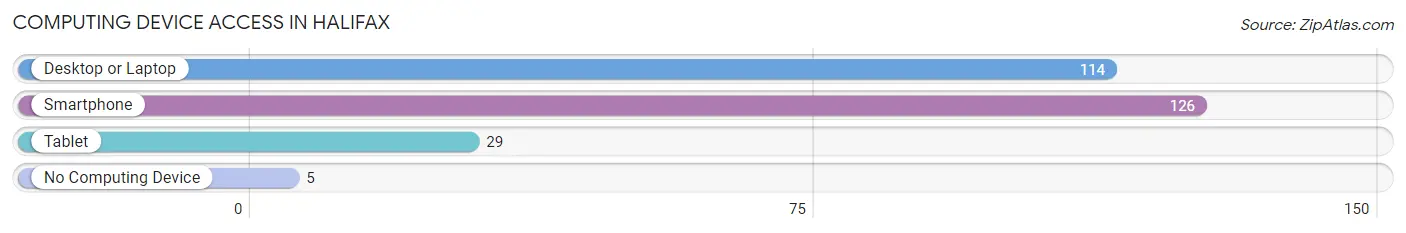
| Device Type | # Households | % Households |
| Desktop or Laptop | 114 | 86.4% |
| Smartphone | 126 | 95.5% |
| Tablet | 29 | 22.0% |
| No Computing Device | 5 | 3.8% |
| Total | 132 | 100.0% |
Internet Access in Halifax
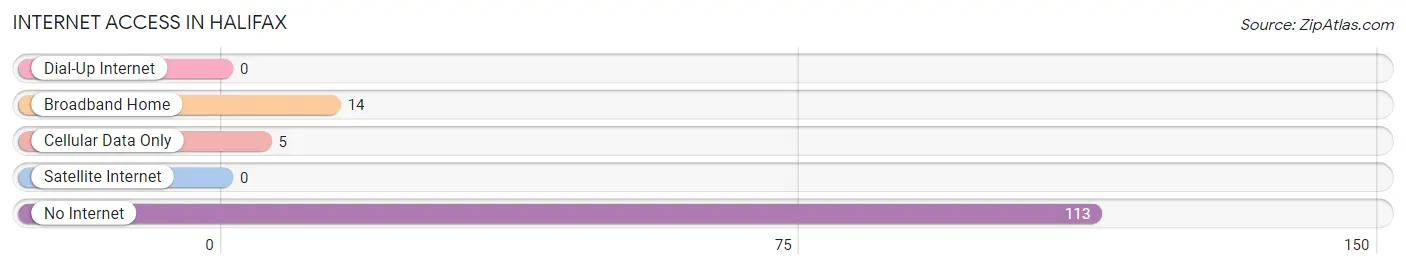
| Internet Type | # Households | % Households |
| Dial-Up Internet | 0 | 0.0% |
| Broadband Home | 14 | 10.6% |
| Cellular Data Only | 5 | 3.8% |
| Satellite Internet | 0 | 0.0% |
| No Internet | 113 | 85.6% |
| Total | 132 | 100.0% |
Halifax Summary
Halifax, North Carolina is a small town located in Halifax County, North Carolina. It is situated on the Roanoke River, approximately 40 miles northeast of Raleigh. The town has a population of approximately 2,000 people and is the county seat of Halifax County.
Geography
Halifax is located in the Coastal Plain region of North Carolina. The town is situated on the Roanoke River, which is a major tributary of the Albemarle Sound. The town is surrounded by rolling hills and is located in a rural area. The town is located approximately 40 miles northeast of Raleigh and is approximately 20 miles from the Virginia border.
Climate
Halifax has a humid subtropical climate, with hot and humid summers and mild winters. The average temperature in the summer is around 80 degrees Fahrenheit, while the average temperature in the winter is around 40 degrees Fahrenheit. The town receives an average of 48 inches of precipitation per year, with most of it occurring in the summer months.
Demographics
As of the 2010 census, the population of Halifax was 2,039. The racial makeup of the town was 57.3% White, 37.2% African American, 0.3% Native American, 0.7% Asian, 0.1% Pacific Islander, and 4.4% from two or more races. The median household income was $30,938, and the median family income was $37,813.
Economy
The economy of Halifax is largely based on agriculture and manufacturing. The town is home to several large farms, which produce a variety of crops, including corn, soybeans, and cotton. The town is also home to several manufacturing companies, which produce a variety of products, including furniture, textiles, and paper products.
History
Halifax was founded in 1757 by a group of settlers from Virginia. The town was named after George Montague-Dunk, the 2nd Earl of Halifax. The town was an important trading center during the Revolutionary War and was the site of several battles. During the Civil War, the town was occupied by Union forces and was the site of several skirmishes.
In the late 19th century, the town experienced a period of growth and prosperity. The town was home to several large mills and factories, which produced a variety of products, including furniture, textiles, and paper products. The town also became a popular tourist destination, with several hotels and resorts being built in the area.
In the early 20th century, the town experienced a period of decline. The mills and factories closed, and the town's population began to decline. In the late 20th century, the town experienced a period of revitalization, with several new businesses opening in the area.
Today, Halifax is a small town with a population of approximately 2,000 people. The town is home to several small businesses, including restaurants, shops, and a few small manufacturing companies. The town is also home to several historic sites, including the Halifax County Courthouse and the Halifax County Museum.
Common Questions
What is Per Capita Income in Halifax?
Per Capita income in Halifax is $35,805.
What is the Median Family Income in Halifax?
Median Family Income in Halifax is $58,778.
What is the Median Household income in Halifax?
Median Household Income in Halifax is $59,031.
What is Inequality or Gini Index in Halifax?
Inequality or Gini Index in Halifax is 0.16.
What is the Total Population of Halifax?
Total Population of Halifax is 227.
What is the Total Male Population of Halifax?
Total Male Population of Halifax is 130.
What is the Total Female Population of Halifax?
Total Female Population of Halifax is 97.
What is the Ratio of Males per 100 Females in Halifax?
There are 134.02 Males per 100 Females in Halifax.
What is the Ratio of Females per 100 Males in Halifax?
There are 74.62 Females per 100 Males in Halifax.
What is the Median Population Age in Halifax?
Median Population Age in Halifax is 53.5 Years.
What is the Average Family Size in Halifax
Average Family Size in Halifax is 2.4 People.
What is the Average Household Size in Halifax
Average Household Size in Halifax is 1.7 People.
How Large is the Labor Force in Halifax?
There are 183 People in the Labor Forcein in Halifax.
What is the Percentage of People in the Labor Force in Halifax?
89.3% of People are in the Labor Force in Halifax.