Gatesville, NC Map & Demographics
Gatesville Map
Gatesville Overview
$32,771
PER CAPITA INCOME
$76,500
AVG FAMILY INCOME
$75,750
AVG HOUSEHOLD INCOME
47.4%
WAGE / INCOME GAP [ % ]
52.6¢/ $1
WAGE / INCOME GAP [ $ ]
0.28
INEQUALITY / GINI INDEX
277
TOTAL POPULATION
149
MALE POPULATION
128
FEMALE POPULATION
116.41
MALES / 100 FEMALES
85.91
FEMALES / 100 MALES
43.8
MEDIAN AGE
3.4
AVG FAMILY SIZE
2.8
AVG HOUSEHOLD SIZE
128
LABOR FORCE [ PEOPLE ]
60.1%
PERCENT IN LABOR FORCE
11.7%
UNEMPLOYMENT RATE
Gatesville Zip Codes
Gatesville Area Codes
Income in Gatesville
Income Overview in Gatesville
Per Capita Income in Gatesville is $32,771, while median incomes of families and households are $76,500 and $75,750 respectively.
| Characteristic | Number | Measure |
| Per Capita Income | 277 | $32,771 |
| Median Family Income | 74 | $76,500 |
| Mean Family Income | 74 | $90,216 |
| Median Household Income | 99 | $75,750 |
| Mean Household Income | 99 | $83,400 |
| Income Deficit | 74 | $0 |
| Wage / Income Gap (%) | 277 | 47.38% |
| Wage / Income Gap ($) | 277 | 52.62¢ per $1 |
| Gini / Inequality Index | 277 | 0.28 |
Earnings by Sex in Gatesville
Average Earnings in Gatesville are $41,875, $56,667 for men and $29,821 for women, a difference of 47.4%.
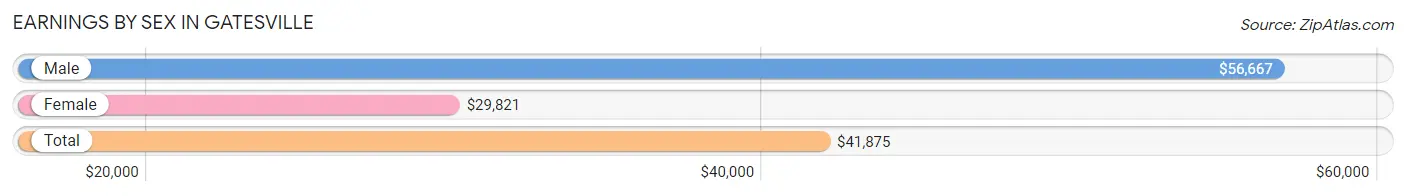
| Sex | Number | Average Earnings |
| Male | 82 (59.0%) | $56,667 |
| Female | 57 (41.0%) | $29,821 |
| Total | 139 (100.0%) | $41,875 |
Earnings by Sex by Income Bracket in Gatesville
The most common earnings brackets in Gatesville are $65,000 to $74,999 for men (16 | 19.5%) and $35,000 to $39,999 for women (10 | 17.5%).
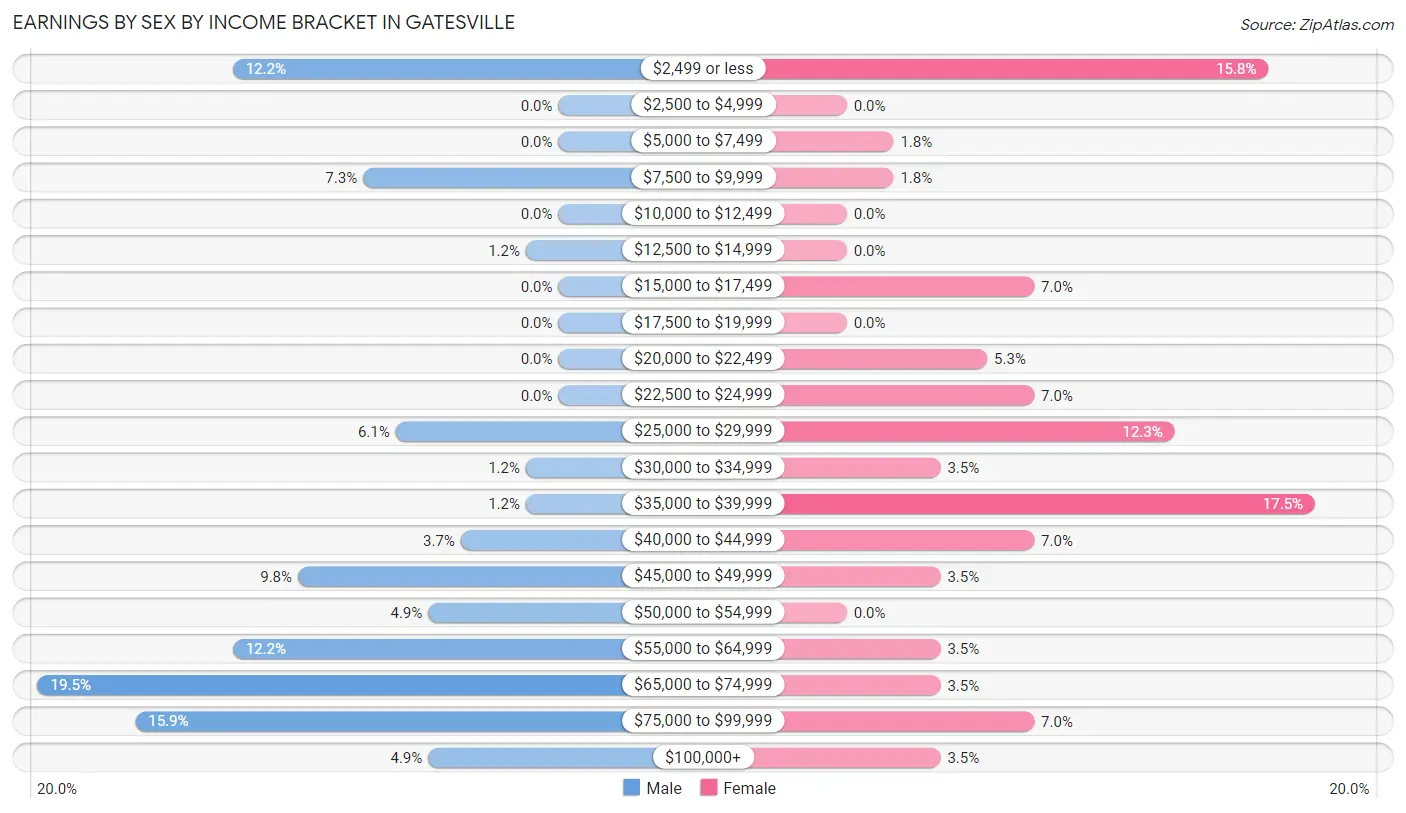
| Income | Male | Female |
| $2,499 or less | 10 (12.2%) | 9 (15.8%) |
| $2,500 to $4,999 | 0 (0.0%) | 0 (0.0%) |
| $5,000 to $7,499 | 0 (0.0%) | 1 (1.8%) |
| $7,500 to $9,999 | 6 (7.3%) | 1 (1.8%) |
| $10,000 to $12,499 | 0 (0.0%) | 0 (0.0%) |
| $12,500 to $14,999 | 1 (1.2%) | 0 (0.0%) |
| $15,000 to $17,499 | 0 (0.0%) | 4 (7.0%) |
| $17,500 to $19,999 | 0 (0.0%) | 0 (0.0%) |
| $20,000 to $22,499 | 0 (0.0%) | 3 (5.3%) |
| $22,500 to $24,999 | 0 (0.0%) | 4 (7.0%) |
| $25,000 to $29,999 | 5 (6.1%) | 7 (12.3%) |
| $30,000 to $34,999 | 1 (1.2%) | 2 (3.5%) |
| $35,000 to $39,999 | 1 (1.2%) | 10 (17.5%) |
| $40,000 to $44,999 | 3 (3.7%) | 4 (7.0%) |
| $45,000 to $49,999 | 8 (9.8%) | 2 (3.5%) |
| $50,000 to $54,999 | 4 (4.9%) | 0 (0.0%) |
| $55,000 to $64,999 | 10 (12.2%) | 2 (3.5%) |
| $65,000 to $74,999 | 16 (19.5%) | 2 (3.5%) |
| $75,000 to $99,999 | 13 (15.9%) | 4 (7.0%) |
| $100,000+ | 4 (4.9%) | 2 (3.5%) |
| Total | 82 (100.0%) | 57 (100.0%) |
Earnings by Sex by Educational Attainment in Gatesville
Average earnings in Gatesville are $59,167 for men and $29,821 for women, a difference of 49.6%. Men with an educational attainment of high school diploma enjoy the highest average annual earnings of $72,614, while those with bachelor's degree education earn the least with $2,499. Women with an educational attainment of high school diploma earn the most with the average annual earnings of $36,250, while those with college or associate's degree education have the smallest earnings of $27,857.
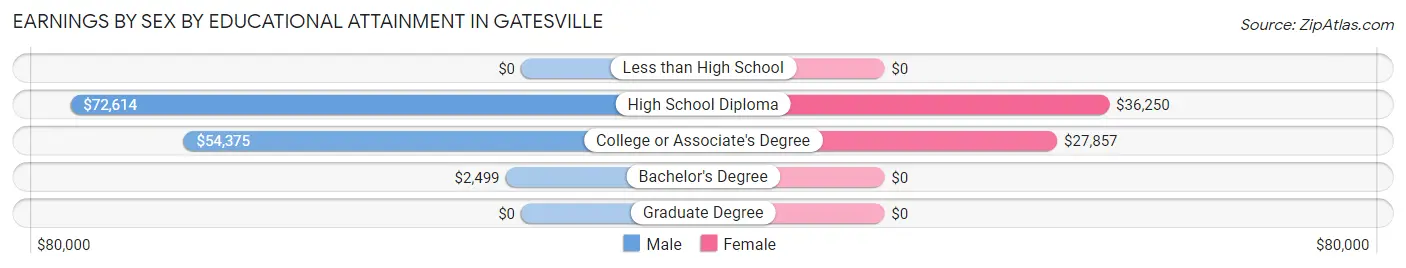
| Educational Attainment | Male Income | Female Income |
| Less than High School | - | - |
| High School Diploma | $72,614 | $36,250 |
| College or Associate's Degree | $54,375 | $27,857 |
| Bachelor's Degree | $2,499 | $0 |
| Graduate Degree | - | - |
| Total | $59,167 | $29,821 |
Family Income in Gatesville
Family Income Brackets in Gatesville
According to the Gatesville family income data, there are 23 families falling into the $100,000 to $149,999 income range, which is the most common income bracket and makes up 31.1% of all families.
| Income Bracket | # Families | % Families |
| Less than $10,000 | 0 | 0.0% |
| $10,000 to $14,999 | 0 | 0.0% |
| $15,000 to $24,999 | 0 | 0.0% |
| $25,000 to $34,999 | 0 | 0.0% |
| $35,000 to $49,999 | 18 | 24.3% |
| $50,000 to $74,999 | 16 | 21.6% |
| $75,000 to $99,999 | 9 | 12.2% |
| $100,000 to $149,999 | 23 | 31.1% |
| $150,000 to $199,999 | 6 | 8.1% |
| $200,000+ | 2 | 2.7% |
Family Income by Famaliy Size in Gatesville
4-person families (5 | 6.8%) account for the highest median family income in Gatesville with $124,375 per family, while 2-person families (47 | 63.5%) have the highest median income of $38,625 per family member.
| Income Bracket | # Families | Median Income |
| 2-Person Families | 47 (63.5%) | $77,250 |
| 3-Person Families | 13 (17.6%) | $0 |
| 4-Person Families | 5 (6.8%) | $124,375 |
| 5-Person Families | 7 (9.5%) | $0 |
| 6-Person Families | 2 (2.7%) | $0 |
| 7+ Person Families | 0 (0.0%) | $0 |
| Total | 74 (100.0%) | $76,500 |
Family Income by Number of Earners in Gatesville
| Number of Earners | # Families | Median Income |
| No Earners | 12 (16.2%) | $75,500 |
| 1 Earner | 27 (36.5%) | $47,375 |
| 2 Earners | 33 (44.6%) | $104,028 |
| 3+ Earners | 2 (2.7%) | $0 |
| Total | 74 (100.0%) | $76,500 |
Household Income in Gatesville
Household Income Brackets in Gatesville
With 24 households falling in the category, the $35,000 to $49,999 income range is the most frequent in Gatesville, accounting for 24.2% of all households.
| Income Bracket | # Households | % Households |
| Less than $10,000 | 0 | 0.0% |
| $10,000 to $14,999 | 0 | 0.0% |
| $15,000 to $24,999 | 3 | 3.0% |
| $25,000 to $34,999 | 1 | 1.0% |
| $35,000 to $49,999 | 24 | 24.2% |
| $50,000 to $74,999 | 20 | 20.2% |
| $75,000 to $99,999 | 20 | 20.2% |
| $100,000 to $149,999 | 23 | 23.2% |
| $150,000 to $199,999 | 6 | 6.1% |
| $200,000+ | 2 | 2.0% |
Household Income by Householder Age in Gatesville
The median household income in Gatesville is $75,750, with the highest median household income of $91,667 found in the 45 to 64 years age bracket for the primary householder. A total of 36 households (36.4%) fall into this category.
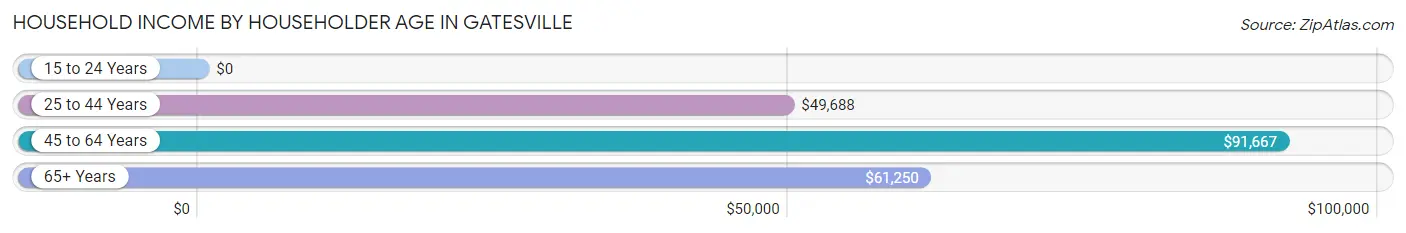
| Income Bracket | # Households | Median Income |
| 15 to 24 Years | 0 (0.0%) | $0 |
| 25 to 44 Years | 33 (33.3%) | $49,688 |
| 45 to 64 Years | 36 (36.4%) | $91,667 |
| 65+ Years | 30 (30.3%) | $61,250 |
| Total | 99 (100.0%) | $75,750 |
Poverty in Gatesville
Income Below Poverty by Sex and Age in Gatesville
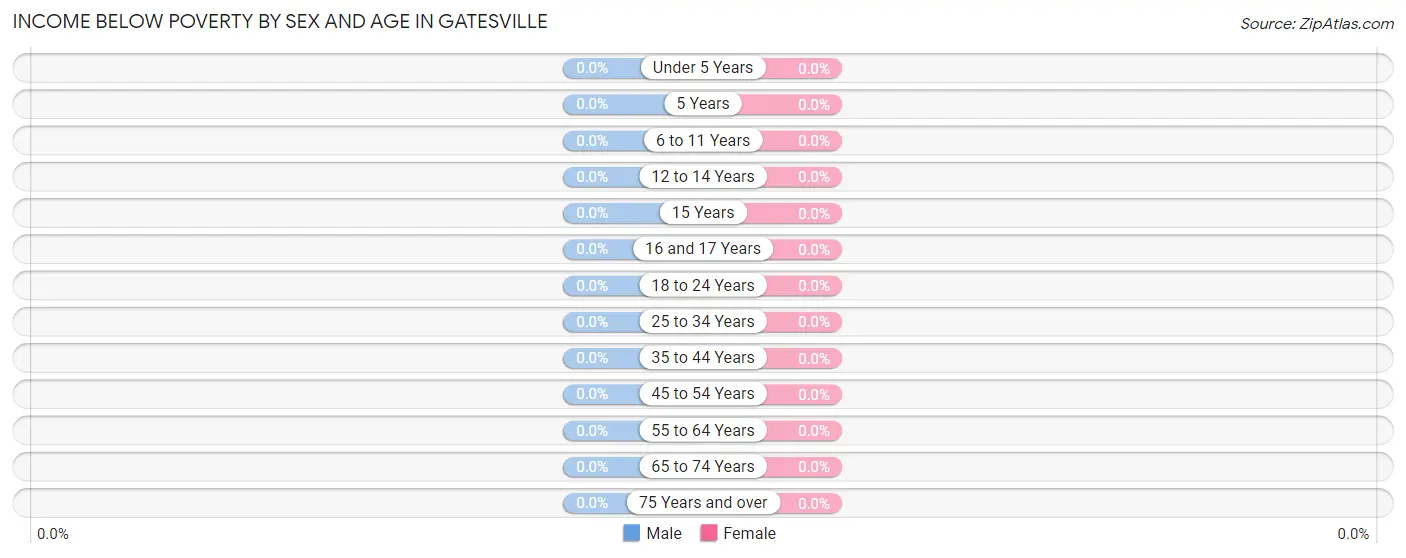
| Age Bracket | Male | Female |
| Under 5 Years | 0 (0.0%) | 0 (0.0%) |
| 5 Years | 0 (0.0%) | 0 (0.0%) |
| 6 to 11 Years | 0 (0.0%) | 0 (0.0%) |
| 12 to 14 Years | 0 (0.0%) | 0 (0.0%) |
| 15 Years | 0 (0.0%) | 0 (0.0%) |
| 16 and 17 Years | 0 (0.0%) | 0 (0.0%) |
| 18 to 24 Years | 0 (0.0%) | 0 (0.0%) |
| 25 to 34 Years | 0 (0.0%) | 0 (0.0%) |
| 35 to 44 Years | 0 (0.0%) | 0 (0.0%) |
| 45 to 54 Years | 0 (0.0%) | 0 (0.0%) |
| 55 to 64 Years | 0 (0.0%) | 0 (0.0%) |
| 65 to 74 Years | 0 (0.0%) | 0 (0.0%) |
| 75 Years and over | 0 (0.0%) | 0 (0.0%) |
| Total | 0 (0.0%) | 0 (0.0%) |
Income Above Poverty by Sex and Age in Gatesville
According to the poverty statistics in Gatesville, males aged under 5 years and females aged 5 years are the age groups that are most secure financially, with 100.0% of males and 100.0% of females in these age groups living above the poverty line.
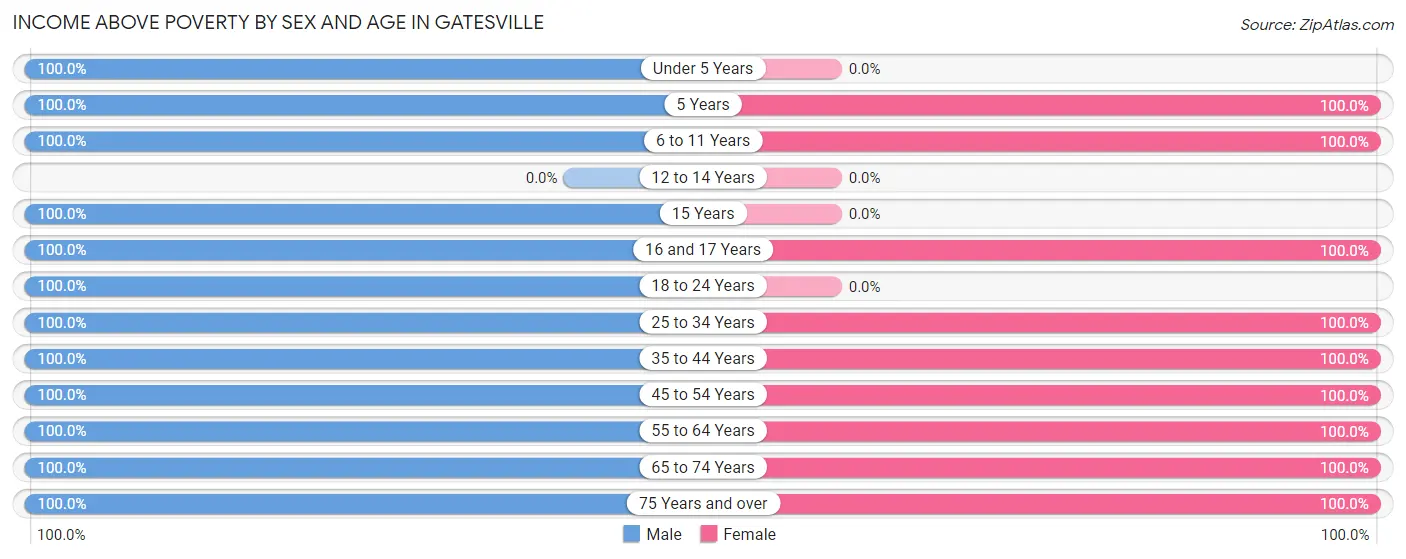
| Age Bracket | Male | Female |
| Under 5 Years | 34 (100.0%) | 0 (0.0%) |
| 5 Years | 3 (100.0%) | 3 (100.0%) |
| 6 to 11 Years | 4 (100.0%) | 19 (100.0%) |
| 12 to 14 Years | 0 (0.0%) | 0 (0.0%) |
| 15 Years | 1 (100.0%) | 0 (0.0%) |
| 16 and 17 Years | 3 (100.0%) | 2 (100.0%) |
| 18 to 24 Years | 8 (100.0%) | 0 (0.0%) |
| 25 to 34 Years | 25 (100.0%) | 10 (100.0%) |
| 35 to 44 Years | 14 (100.0%) | 20 (100.0%) |
| 45 to 54 Years | 25 (100.0%) | 17 (100.0%) |
| 55 to 64 Years | 11 (100.0%) | 21 (100.0%) |
| 65 to 74 Years | 13 (100.0%) | 21 (100.0%) |
| 75 Years and over | 8 (100.0%) | 15 (100.0%) |
| Total | 149 (100.0%) | 128 (100.0%) |
Income Below Poverty Among Married-Couple Families in Gatesville
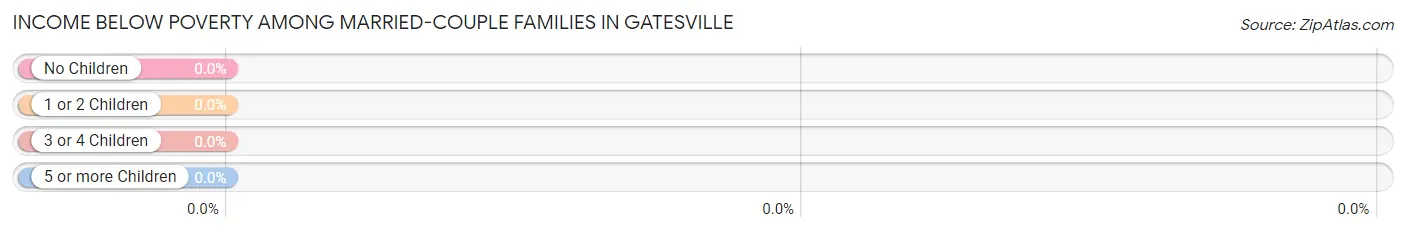
| Children | Above Poverty | Below Poverty |
| No Children | 47 (100.0%) | 0 (0.0%) |
| 1 or 2 Children | 6 (100.0%) | 0 (0.0%) |
| 3 or 4 Children | 6 (100.0%) | 0 (0.0%) |
| 5 or more Children | 0 (0.0%) | 0 (0.0%) |
| Total | 59 (100.0%) | 0 (0.0%) |
Income Below Poverty Among Single-Parent Households in Gatesville
| Children | Single Father | Single Mother |
| No Children | 0 (0.0%) | 0 (0.0%) |
| 1 or 2 Children | 0 (0.0%) | 0 (0.0%) |
| 3 or 4 Children | 0 (0.0%) | 0 (0.0%) |
| 5 or more Children | 0 (0.0%) | 0 (0.0%) |
| Total | 0 (0.0%) | 0 (0.0%) |
Income Below Poverty Among Married-Couple vs Single-Parent Households in Gatesville
| Children | Married-Couple Families | Single-Parent Households |
| No Children | 0 (0.0%) | 0 (0.0%) |
| 1 or 2 Children | 0 (0.0%) | 0 (0.0%) |
| 3 or 4 Children | 0 (0.0%) | 0 (0.0%) |
| 5 or more Children | 0 (0.0%) | 0 (0.0%) |
| Total | 0 (0.0%) | 0 (0.0%) |
Race in Gatesville
The most populous races in Gatesville are White / Caucasian (242 | 87.4%), Hispanic or Latino (20 | 7.2%), and Two or more Races (20 | 7.2%).
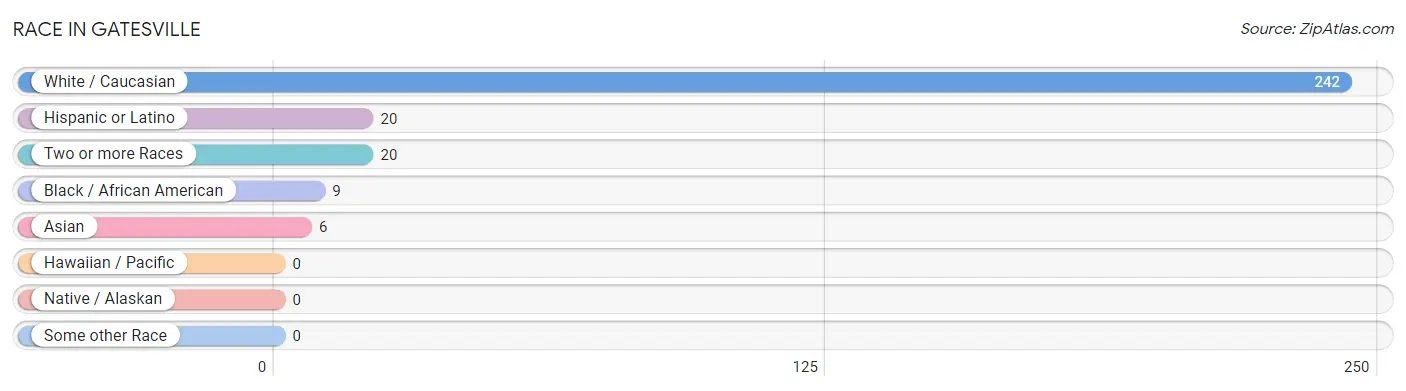
| Race | # Population | % Population |
| Asian | 6 | 2.2% |
| Black / African American | 9 | 3.3% |
| Hawaiian / Pacific | 0 | 0.0% |
| Hispanic or Latino | 20 | 7.2% |
| Native / Alaskan | 0 | 0.0% |
| White / Caucasian | 242 | 87.4% |
| Two or more Races | 20 | 7.2% |
| Some other Race | 0 | 0.0% |
| Total | 277 | 100.0% |
Ancestry in Gatesville
The most populous ancestries reported in Gatesville are Irish (66 | 23.8%), English (59 | 21.3%), Hungarian (36 | 13.0%), German (29 | 10.5%), and Puerto Rican (20 | 7.2%), together accounting for 75.8% of all Gatesville residents.
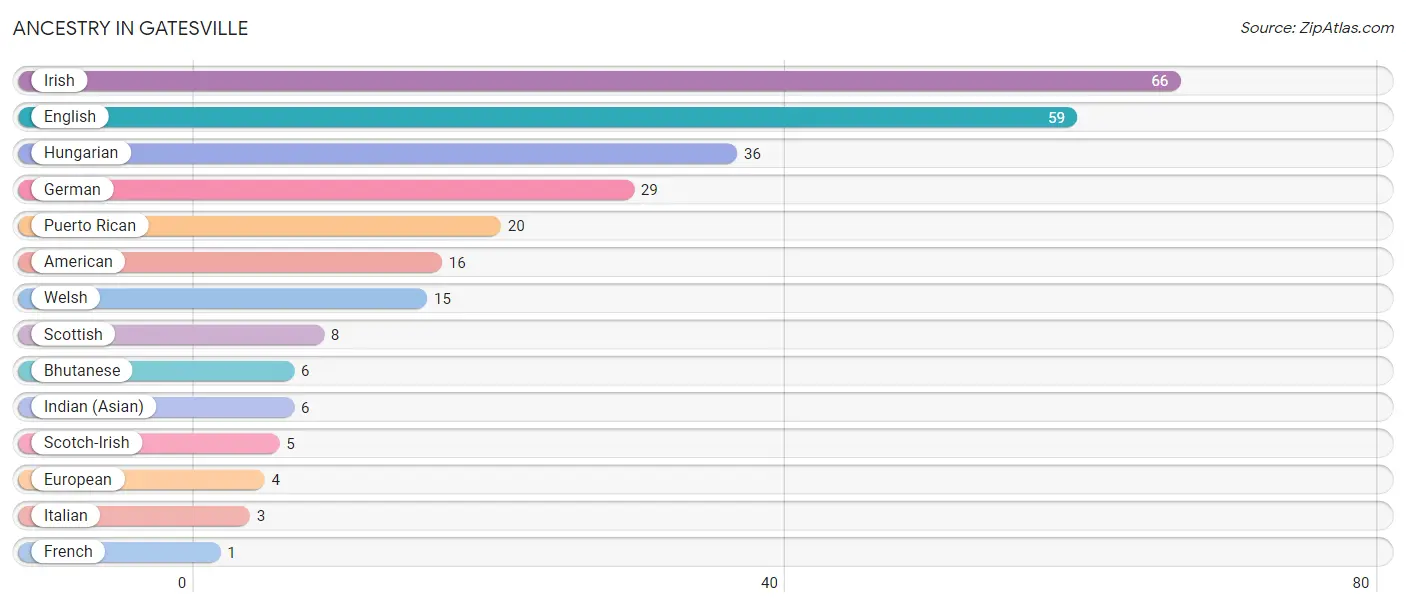
| Ancestry | # Population | % Population |
| American | 16 | 5.8% |
| Bhutanese | 6 | 2.2% |
| English | 59 | 21.3% |
| European | 4 | 1.4% |
| French | 1 | 0.4% |
| German | 29 | 10.5% |
| Hungarian | 36 | 13.0% |
| Indian (Asian) | 6 | 2.2% |
| Irish | 66 | 23.8% |
| Italian | 3 | 1.1% |
| Puerto Rican | 20 | 7.2% |
| Scotch-Irish | 5 | 1.8% |
| Scottish | 8 | 2.9% |
| Welsh | 15 | 5.4% | View All 14 Rows |
Immigrants in Gatesville

| Immigration Origin | # Population | % Population | View All 0 Rows |
Sex and Age in Gatesville
Sex and Age in Gatesville
The most populous age groups in Gatesville are Under 5 Years (34 | 22.8%) for men and 5 to 9 Years (17 | 13.3%) for women.
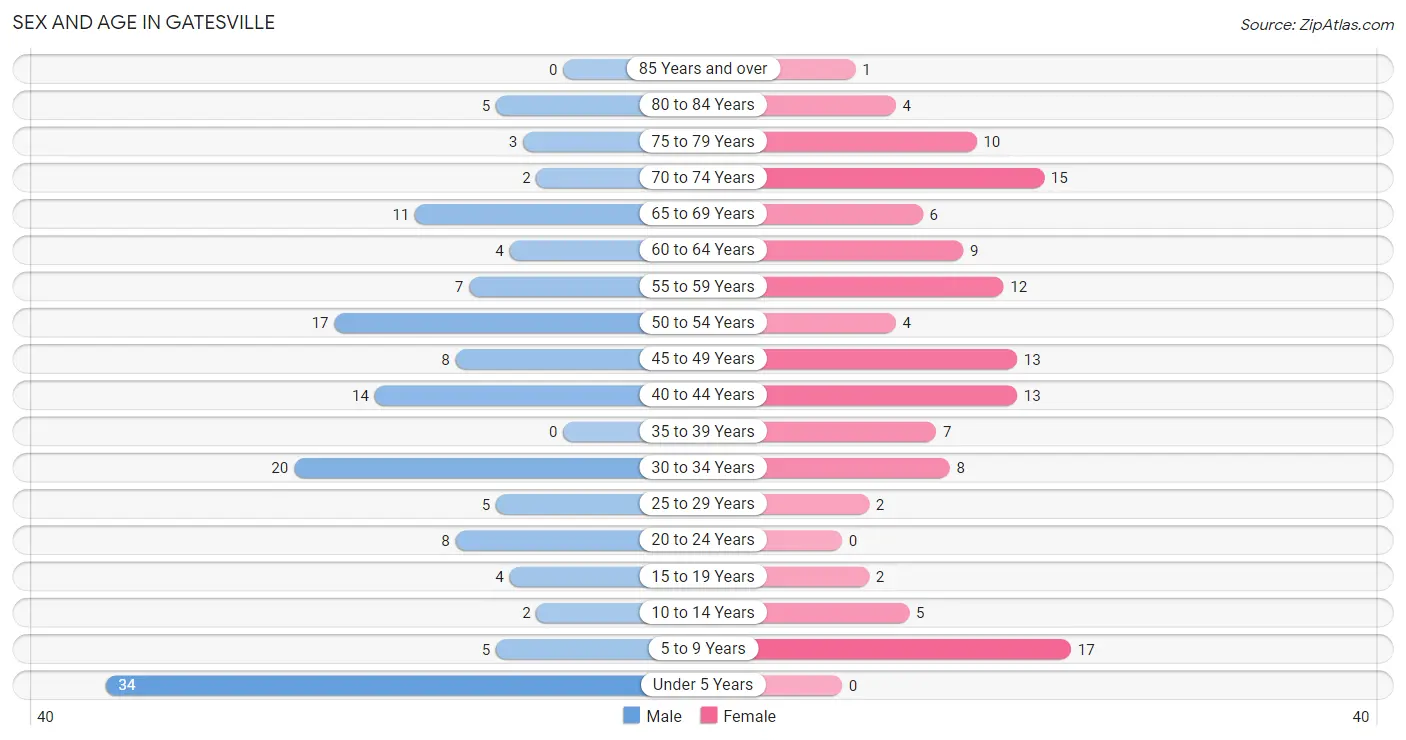
| Age Bracket | Male | Female |
| Under 5 Years | 34 (22.8%) | 0 (0.0%) |
| 5 to 9 Years | 5 (3.4%) | 17 (13.3%) |
| 10 to 14 Years | 2 (1.3%) | 5 (3.9%) |
| 15 to 19 Years | 4 (2.7%) | 2 (1.6%) |
| 20 to 24 Years | 8 (5.4%) | 0 (0.0%) |
| 25 to 29 Years | 5 (3.4%) | 2 (1.6%) |
| 30 to 34 Years | 20 (13.4%) | 8 (6.2%) |
| 35 to 39 Years | 0 (0.0%) | 7 (5.5%) |
| 40 to 44 Years | 14 (9.4%) | 13 (10.2%) |
| 45 to 49 Years | 8 (5.4%) | 13 (10.2%) |
| 50 to 54 Years | 17 (11.4%) | 4 (3.1%) |
| 55 to 59 Years | 7 (4.7%) | 12 (9.4%) |
| 60 to 64 Years | 4 (2.7%) | 9 (7.0%) |
| 65 to 69 Years | 11 (7.4%) | 6 (4.7%) |
| 70 to 74 Years | 2 (1.3%) | 15 (11.7%) |
| 75 to 79 Years | 3 (2.0%) | 10 (7.8%) |
| 80 to 84 Years | 5 (3.4%) | 4 (3.1%) |
| 85 Years and over | 0 (0.0%) | 1 (0.8%) |
| Total | 149 (100.0%) | 128 (100.0%) |
Families and Households in Gatesville
Median Family Size in Gatesville
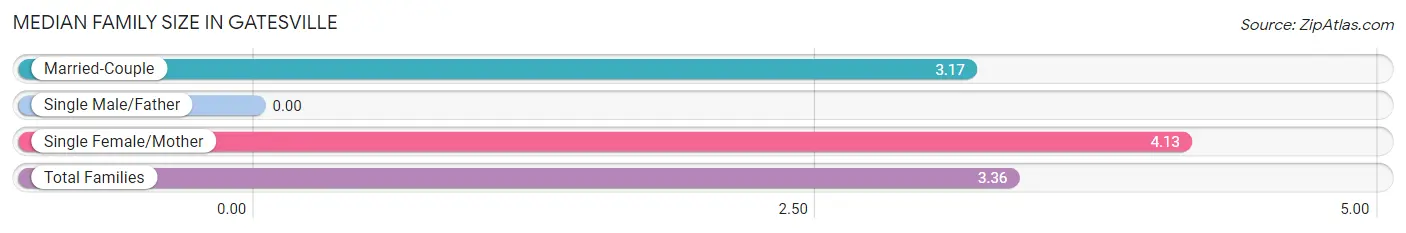
| Family Type | # Families | Family Size |
| Married-Couple | 59 (79.7%) | 3.17 |
| Single Male/Father | 0 (0.0%) | - |
| Single Female/Mother | 15 (20.3%) | 4.13 |
| Total Families | 74 (100.0%) | 3.36 |
Median Household Size in Gatesville
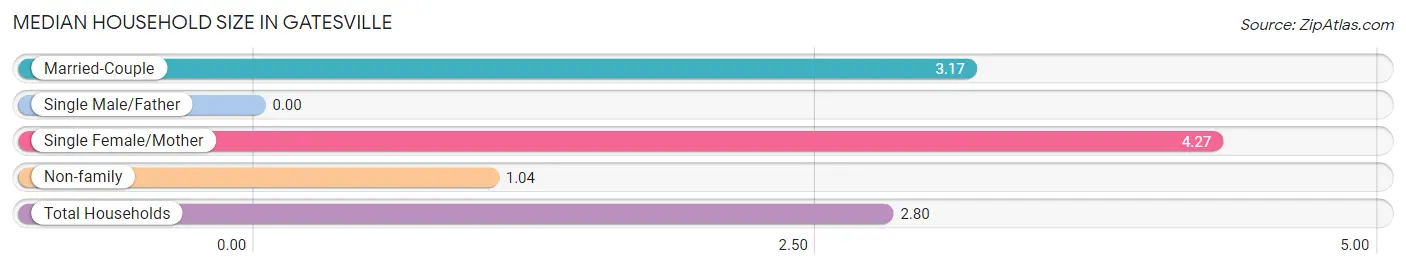
| Household Type | # Households | Household Size |
| Married-Couple | 59 (59.6%) | 3.17 |
| Single Male/Father | 0 (0.0%) | - |
| Single Female/Mother | 15 (15.1%) | 4.27 |
| Non-family | 25 (25.3%) | 1.04 |
| Total Households | 99 (100.0%) | 2.80 |
Household Size by Marriage Status in Gatesville
Out of a total of 99 households in Gatesville, 74 (74.8%) are family households, while 25 (25.3%) are nonfamily households. The most numerous type of family households are 2-person households, comprising 44, and the most common type of nonfamily households are 1-person households, comprising 23.
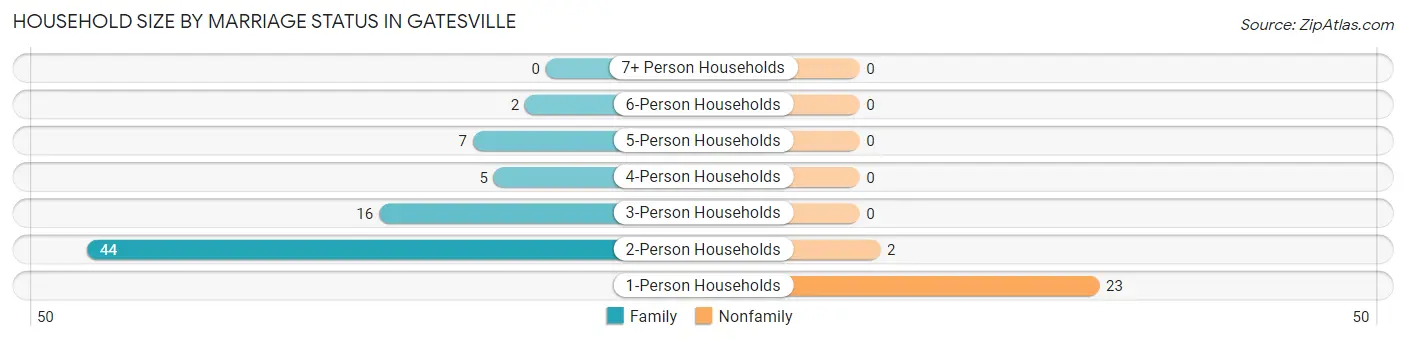
| Household Size | Family Households | Nonfamily Households |
| 1-Person Households | - | 23 (23.2%) |
| 2-Person Households | 44 (44.4%) | 2 (2.0%) |
| 3-Person Households | 16 (16.2%) | 0 (0.0%) |
| 4-Person Households | 5 (5.1%) | 0 (0.0%) |
| 5-Person Households | 7 (7.1%) | 0 (0.0%) |
| 6-Person Households | 2 (2.0%) | 0 (0.0%) |
| 7+ Person Households | 0 (0.0%) | 0 (0.0%) |
| Total | 74 (74.8%) | 25 (25.3%) |
Female Fertility in Gatesville
Fertility by Age in Gatesville
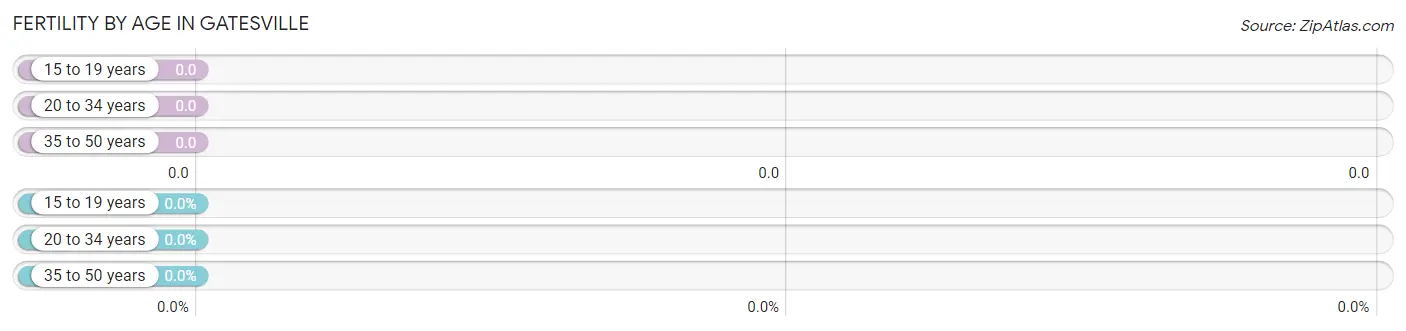
| Age Bracket | Women with Births | Births / 1,000 Women |
| 15 to 19 years | 0 (0.0%) | 0.0 |
| 20 to 34 years | 0 (0.0%) | 0.0 |
| 35 to 50 years | 0 (0.0%) | 0.0 |
| Total | 0 (0.0%) | 0.0 |
Fertility by Age by Marriage Status in Gatesville
| Age Bracket | Married | Unmarried |
| 15 to 19 years | 0 (0.0%) | 0 (0.0%) |
| 20 to 34 years | 0 (0.0%) | 0 (0.0%) |
| 35 to 50 years | 0 (0.0%) | 0 (0.0%) |
| Total | 0 (0.0%) | 0 (0.0%) |
Fertility by Education in Gatesville
| Educational Attainment | Women with Births | Births / 1,000 Women |
| Less than High School | 0 (0.0%) | 0.0 |
| High School Diploma | 0 (0.0%) | 0.0 |
| College or Associate's Degree | 0 (0.0%) | 0.0 |
| Bachelor's Degree | 0 (0.0%) | 0.0 |
| Graduate Degree | 0 (0.0%) | 0.0 |
| Total | 0 (0.0%) | 0.0 |
Fertility by Education by Marriage Status in Gatesville
| Educational Attainment | Married | Unmarried |
| Less than High School | 0 (0.0%) | 0 (0.0%) |
| High School Diploma | 0 (0.0%) | 0 (0.0%) |
| College or Associate's Degree | 0 (0.0%) | 0 (0.0%) |
| Bachelor's Degree | 0 (0.0%) | 0 (0.0%) |
| Graduate Degree | 0 (0.0%) | 0 (0.0%) |
| Total | 0 (0.0%) | 0 (0.0%) |
Employment Characteristics in Gatesville
Employment by Class of Employer in Gatesville
Among the 112 employed individuals in Gatesville, private company employees (80 | 71.4%), local government employees (11 | 9.8%), and state government employees (11 | 9.8%) make up the most common classes of employment.
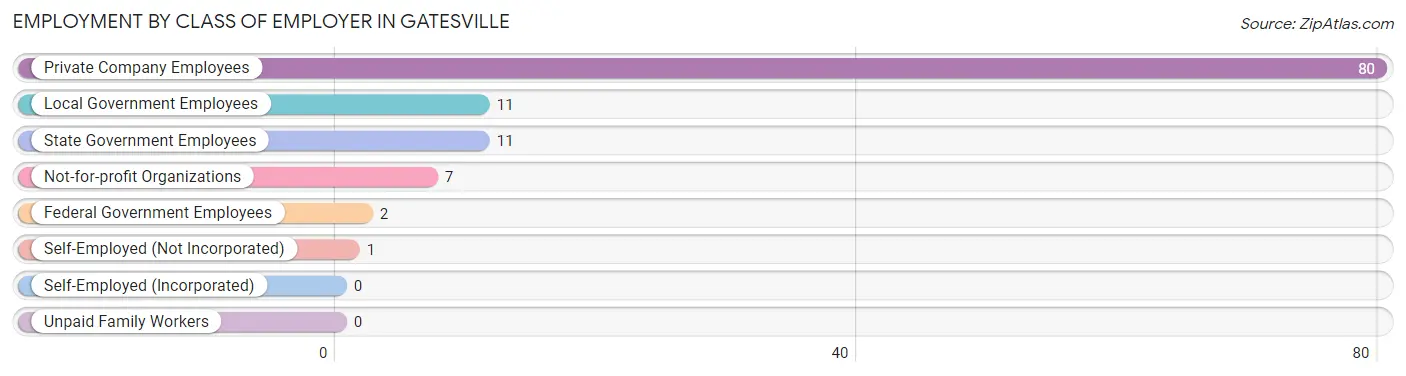
| Employer Class | # Employees | % Employees |
| Private Company Employees | 80 | 71.4% |
| Self-Employed (Incorporated) | 0 | 0.0% |
| Self-Employed (Not Incorporated) | 1 | 0.9% |
| Not-for-profit Organizations | 7 | 6.2% |
| Local Government Employees | 11 | 9.8% |
| State Government Employees | 11 | 9.8% |
| Federal Government Employees | 2 | 1.8% |
| Unpaid Family Workers | 0 | 0.0% |
| Total | 112 | 100.0% |
Employment Status by Age in Gatesville
According to the labor force statistics for Gatesville, out of the total population over 16 years of age (213), 60.1% or 128 individuals are in the labor force, with 11.7% or 15 of them unemployed. The age group with the highest labor force participation rate is 25 to 29 years, with 100.0% or 7 individuals in the labor force. Within the labor force, the 30 to 34 years age range has the highest percentage of unemployed individuals, with 37.0% or 10 of them being unemployed.
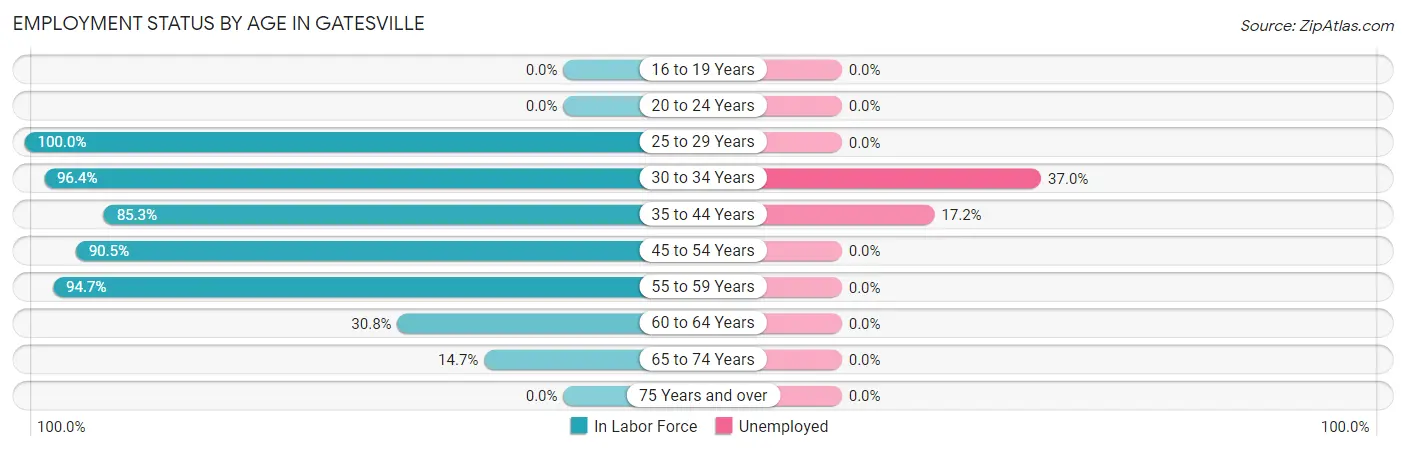
| Age Bracket | In Labor Force | Unemployed |
| 16 to 19 Years | 0 (0.0%) | 0 (0.0%) |
| 20 to 24 Years | 0 (0.0%) | 0 (0.0%) |
| 25 to 29 Years | 7 (100.0%) | 0 (0.0%) |
| 30 to 34 Years | 27 (96.4%) | 10 (37.0%) |
| 35 to 44 Years | 29 (85.3%) | 5 (17.2%) |
| 45 to 54 Years | 38 (90.5%) | 0 (0.0%) |
| 55 to 59 Years | 18 (94.7%) | 0 (0.0%) |
| 60 to 64 Years | 4 (30.8%) | 0 (0.0%) |
| 65 to 74 Years | 5 (14.7%) | 0 (0.0%) |
| 75 Years and over | 0 (0.0%) | 0 (0.0%) |
| Total | 128 (60.1%) | 15 (11.7%) |
Employment Status by Educational Attainment in Gatesville
According to labor force statistics for Gatesville, 86.0% of individuals (123) out of the total population between 25 and 64 years of age (143) are in the labor force, with 12.2% or 15 of them being unemployed. The group with the highest labor force participation rate are those with the educational attainment of high school diploma, with 89.1% or 41 individuals in the labor force. Within the labor force, individuals with bachelor's degree or higher education have the highest percentage of unemployment, with 35.7% or 10 of them being unemployed.
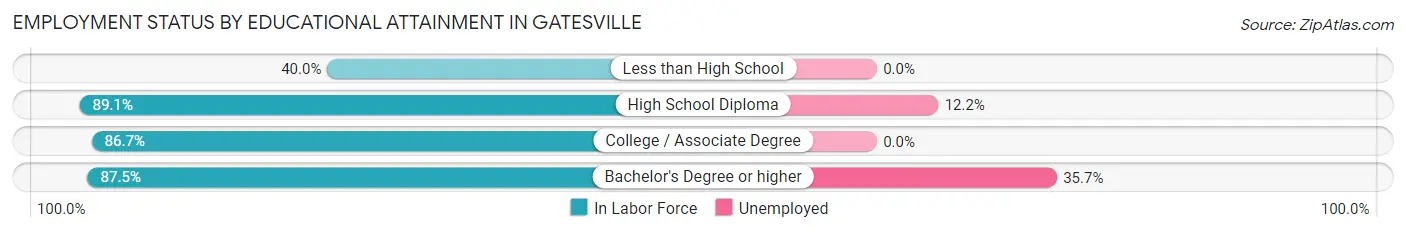
| Educational Attainment | In Labor Force | Unemployed |
| Less than High School | 2 (40.0%) | 0 (0.0%) |
| High School Diploma | 41 (89.1%) | 6 (12.2%) |
| College / Associate Degree | 52 (86.7%) | 0 (0.0%) |
| Bachelor's Degree or higher | 28 (87.5%) | 11 (35.7%) |
| Total | 123 (86.0%) | 17 (12.2%) |
Employment Occupations by Sex in Gatesville
Management, Business, Science and Arts Occupations
The most common Management, Business, Science and Arts occupations in Gatesville are Computers, Engineering & Science (10 | 8.8%), Community & Social Service (10 | 8.8%), Education Instruction & Library (7 | 6.2%), Health Diagnosing & Treating (6 | 5.3%), and Management (5 | 4.4%).

Management, Business, Science and Arts Occupations by Sex
Within the Management, Business, Science and Arts occupations in Gatesville, the most male-oriented occupations are Business & Financial (100.0%), Computers & Mathematics (100.0%), and Architecture & Engineering (75.0%), while the most female-oriented occupations are Life, Physical & Social Science (100.0%), Education, Arts & Media (100.0%), and Health Diagnosing & Treating (100.0%).
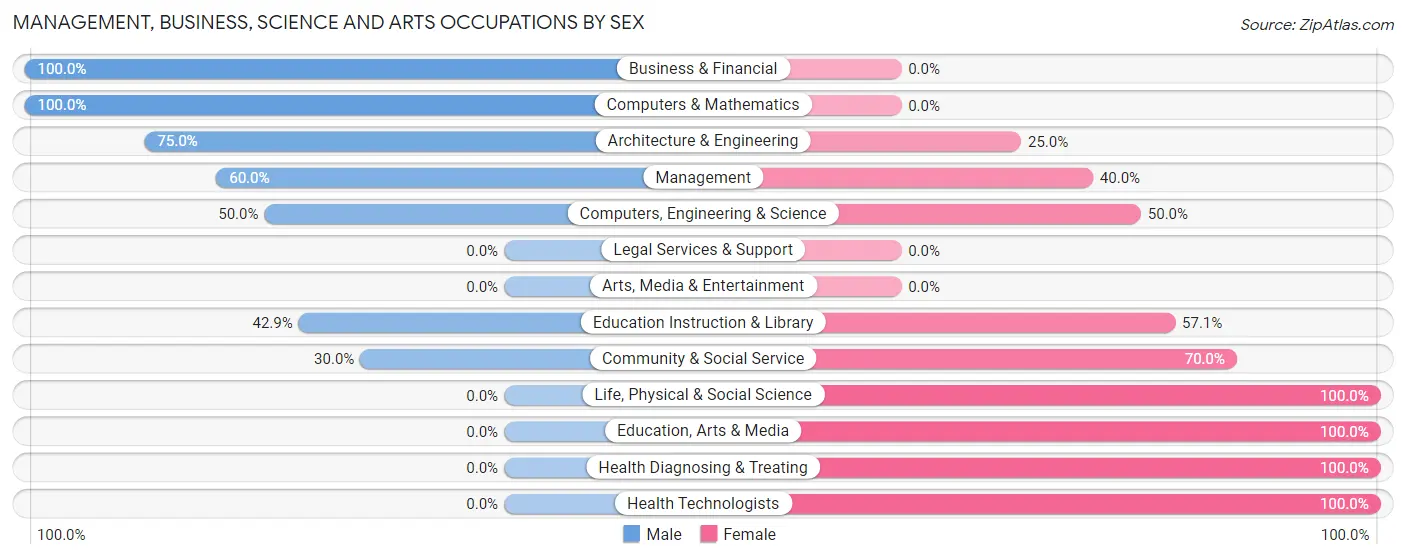
| Occupation | Male | Female |
| Management | 3 (60.0%) | 2 (40.0%) |
| Business & Financial | 1 (100.0%) | 0 (0.0%) |
| Computers, Engineering & Science | 5 (50.0%) | 5 (50.0%) |
| Computers & Mathematics | 2 (100.0%) | 0 (0.0%) |
| Architecture & Engineering | 3 (75.0%) | 1 (25.0%) |
| Life, Physical & Social Science | 0 (0.0%) | 4 (100.0%) |
| Community & Social Service | 3 (30.0%) | 7 (70.0%) |
| Education, Arts & Media | 0 (0.0%) | 3 (100.0%) |
| Legal Services & Support | 0 (0.0%) | 0 (0.0%) |
| Education Instruction & Library | 3 (42.9%) | 4 (57.1%) |
| Arts, Media & Entertainment | 0 (0.0%) | 0 (0.0%) |
| Health Diagnosing & Treating | 0 (0.0%) | 6 (100.0%) |
| Health Technologists | 0 (0.0%) | 4 (100.0%) |
| Total (Category) | 12 (37.5%) | 20 (62.5%) |
| Total (Overall) | 65 (57.5%) | 48 (42.5%) |
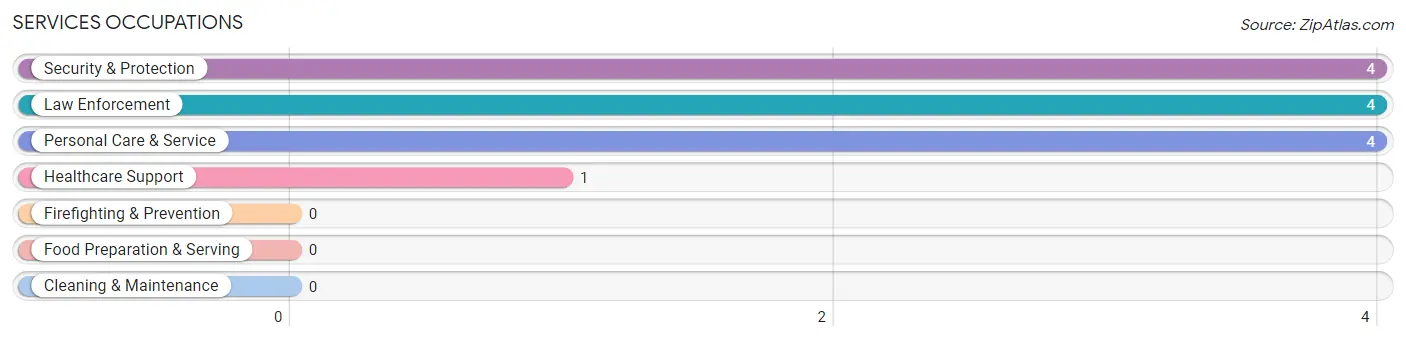
Services Occupations
The most common Services occupations in Gatesville are Security & Protection (4 | 3.5%), Law Enforcement (4 | 3.5%), Personal Care & Service (4 | 3.5%), and Healthcare Support (1 | 0.9%).
Services Occupations by Sex
Within the Services occupations in Gatesville, the most male-oriented occupations are Security & Protection (100.0%), and Law Enforcement (100.0%), while the most female-oriented occupations are Healthcare Support (100.0%), and Personal Care & Service (100.0%).
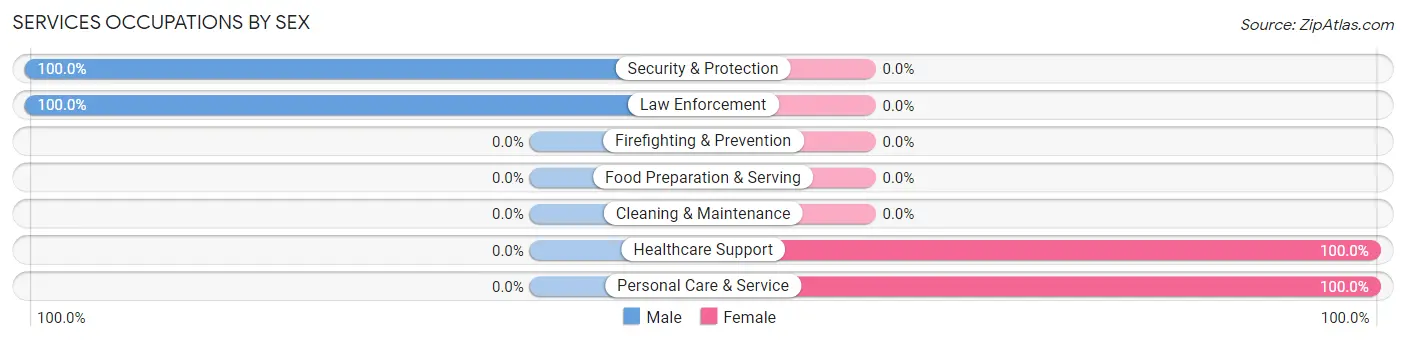
| Occupation | Male | Female |
| Healthcare Support | 0 (0.0%) | 1 (100.0%) |
| Security & Protection | 4 (100.0%) | 0 (0.0%) |
| Firefighting & Prevention | 0 (0.0%) | 0 (0.0%) |
| Law Enforcement | 4 (100.0%) | 0 (0.0%) |
| Food Preparation & Serving | 0 (0.0%) | 0 (0.0%) |
| Cleaning & Maintenance | 0 (0.0%) | 0 (0.0%) |
| Personal Care & Service | 0 (0.0%) | 4 (100.0%) |
| Total (Category) | 4 (44.4%) | 5 (55.6%) |
| Total (Overall) | 65 (57.5%) | 48 (42.5%) |
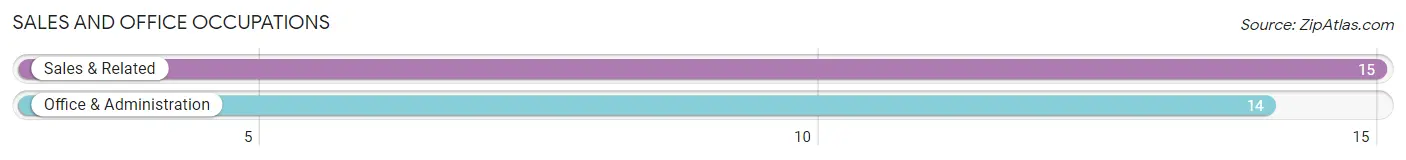
Sales and Office Occupations
The most common Sales and Office occupations in Gatesville are Sales & Related (15 | 13.3%), and Office & Administration (14 | 12.4%).
Sales and Office Occupations by Sex
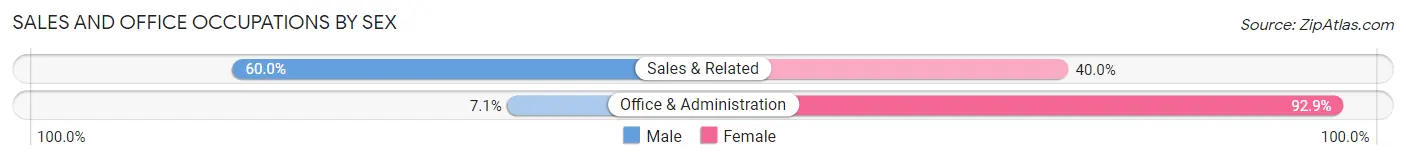
| Occupation | Male | Female |
| Sales & Related | 9 (60.0%) | 6 (40.0%) |
| Office & Administration | 1 (7.1%) | 13 (92.9%) |
| Total (Category) | 10 (34.5%) | 19 (65.5%) |
| Total (Overall) | 65 (57.5%) | 48 (42.5%) |
Natural Resources, Construction and Maintenance Occupations
The most common Natural Resources, Construction and Maintenance occupations in Gatesville are Construction & Extraction (13 | 11.5%), Installation, Maintenance & Repair (6 | 5.3%), and Farming, Fishing & Forestry (2 | 1.8%).

Natural Resources, Construction and Maintenance Occupations by Sex
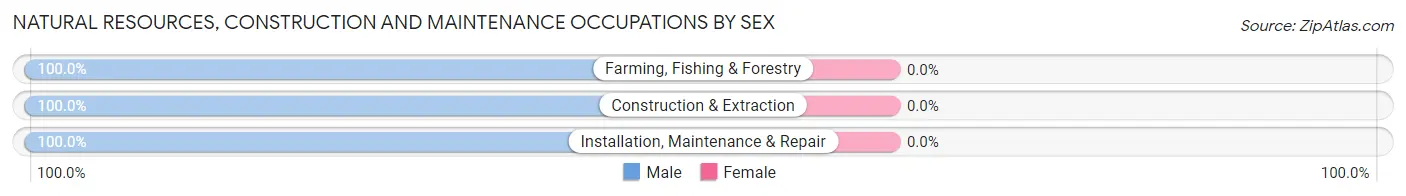
| Occupation | Male | Female |
| Farming, Fishing & Forestry | 2 (100.0%) | 0 (0.0%) |
| Construction & Extraction | 13 (100.0%) | 0 (0.0%) |
| Installation, Maintenance & Repair | 6 (100.0%) | 0 (0.0%) |
| Total (Category) | 21 (100.0%) | 0 (0.0%) |
| Total (Overall) | 65 (57.5%) | 48 (42.5%) |
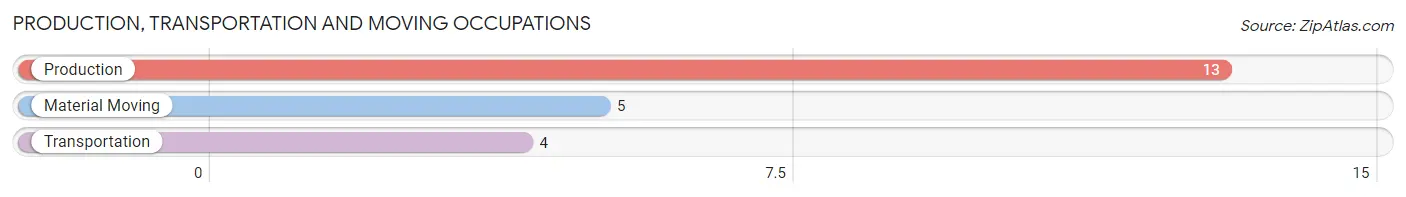
Production, Transportation and Moving Occupations
The most common Production, Transportation and Moving occupations in Gatesville are Production (13 | 11.5%), Material Moving (5 | 4.4%), and Transportation (4 | 3.5%).
Production, Transportation and Moving Occupations by Sex
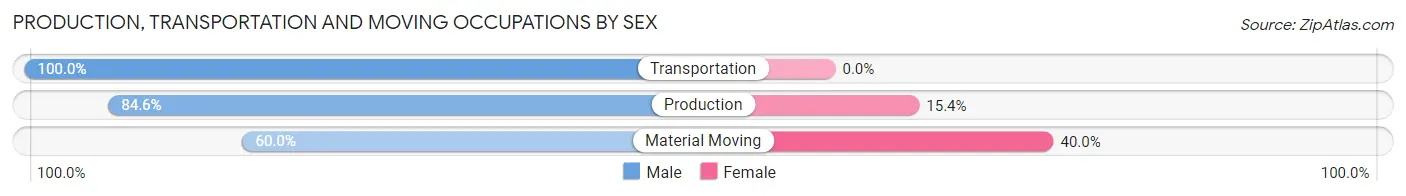
| Occupation | Male | Female |
| Production | 11 (84.6%) | 2 (15.4%) |
| Transportation | 4 (100.0%) | 0 (0.0%) |
| Material Moving | 3 (60.0%) | 2 (40.0%) |
| Total (Category) | 18 (81.8%) | 4 (18.2%) |
| Total (Overall) | 65 (57.5%) | 48 (42.5%) |
Employment Industries by Sex in Gatesville
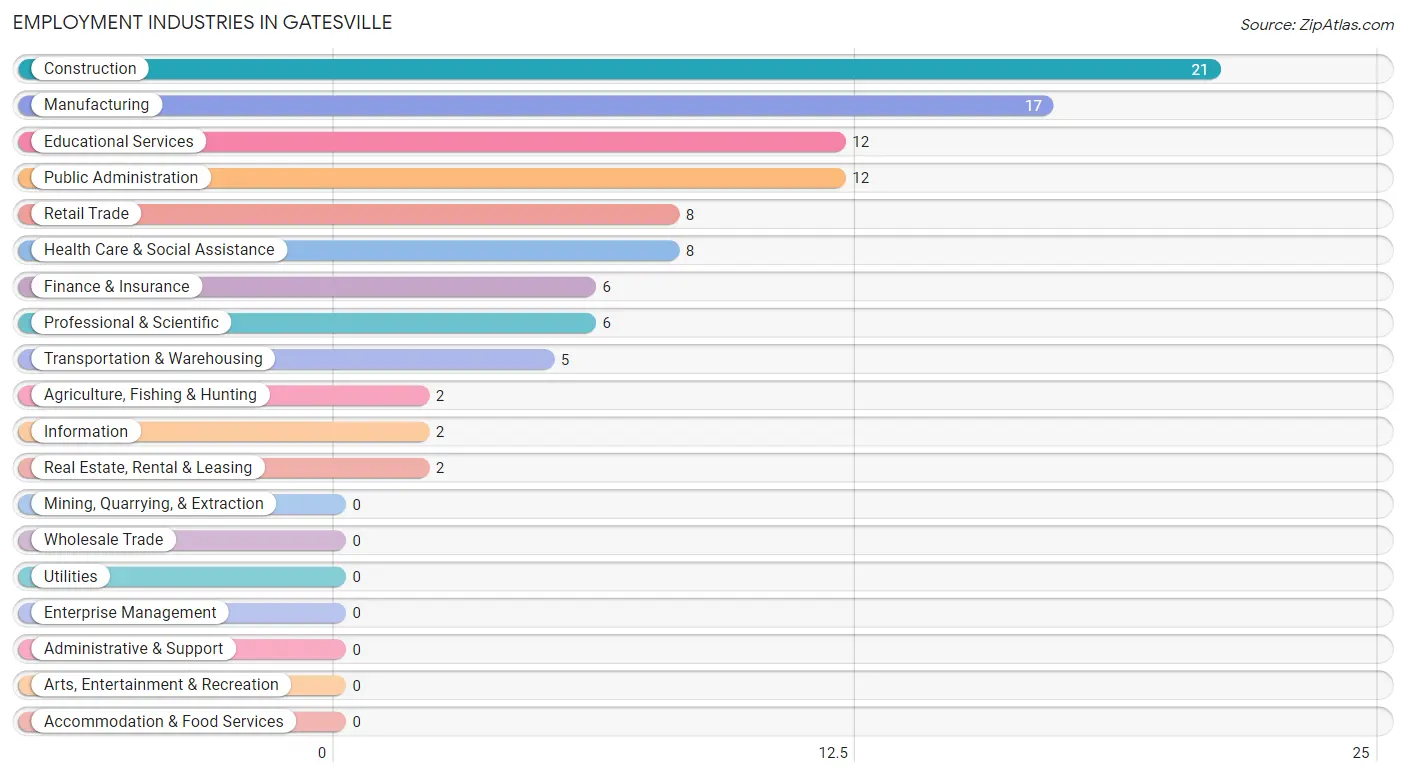
Employment Industries in Gatesville
The major employment industries in Gatesville include Construction (21 | 18.6%), Manufacturing (17 | 15.0%), Educational Services (12 | 10.6%), Public Administration (12 | 10.6%), and Retail Trade (8 | 7.1%).
Employment Industries by Sex in Gatesville
The Gatesville industries that see more men than women are Agriculture, Fishing & Hunting (100.0%), Transportation & Warehousing (100.0%), and Information (100.0%), whereas the industries that tend to have a higher number of women are Finance & Insurance (100.0%), Real Estate, Rental & Leasing (100.0%), and Health Care & Social Assistance (100.0%).
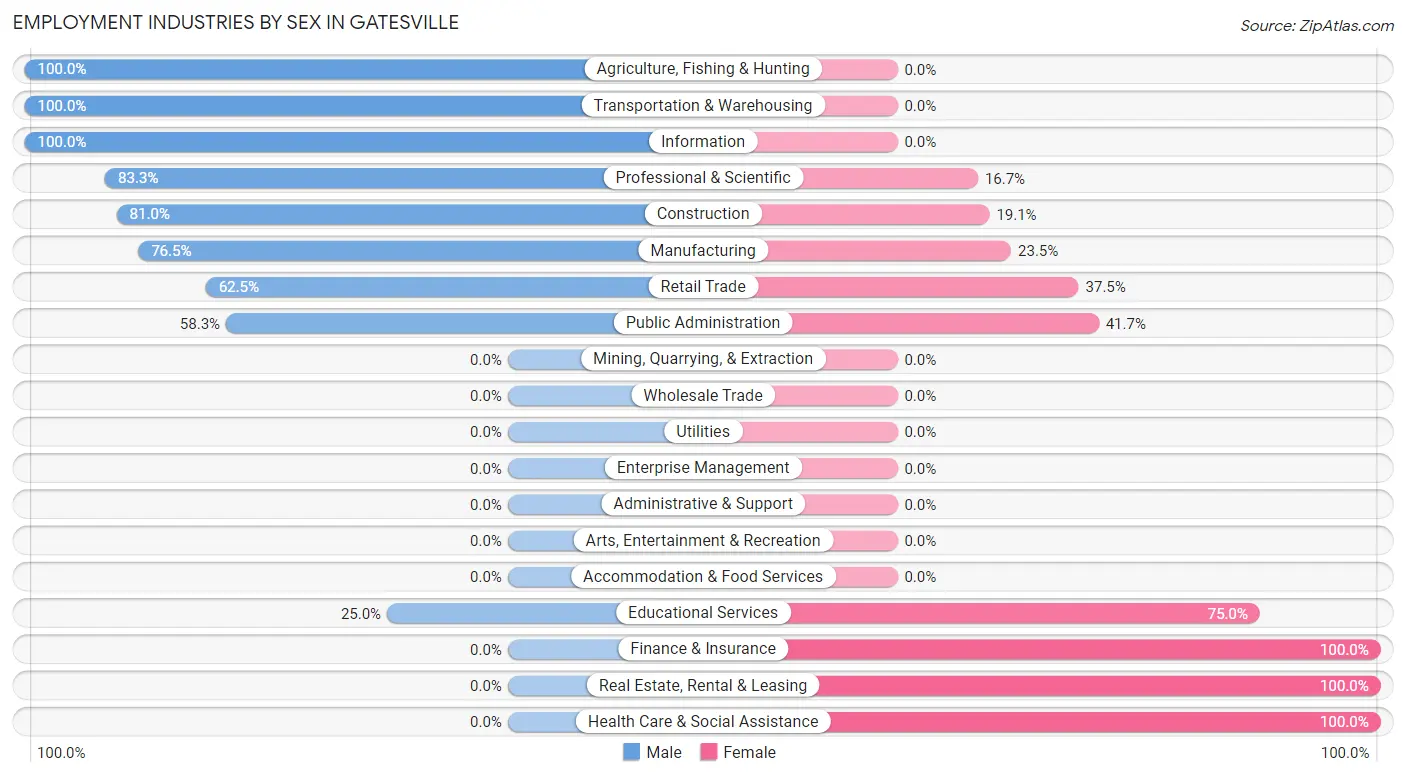
| Industry | Male | Female |
| Agriculture, Fishing & Hunting | 2 (100.0%) | 0 (0.0%) |
| Mining, Quarrying, & Extraction | 0 (0.0%) | 0 (0.0%) |
| Construction | 17 (80.9%) | 4 (19.1%) |
| Manufacturing | 13 (76.5%) | 4 (23.5%) |
| Wholesale Trade | 0 (0.0%) | 0 (0.0%) |
| Retail Trade | 5 (62.5%) | 3 (37.5%) |
| Transportation & Warehousing | 5 (100.0%) | 0 (0.0%) |
| Utilities | 0 (0.0%) | 0 (0.0%) |
| Information | 2 (100.0%) | 0 (0.0%) |
| Finance & Insurance | 0 (0.0%) | 6 (100.0%) |
| Real Estate, Rental & Leasing | 0 (0.0%) | 2 (100.0%) |
| Professional & Scientific | 5 (83.3%) | 1 (16.7%) |
| Enterprise Management | 0 (0.0%) | 0 (0.0%) |
| Administrative & Support | 0 (0.0%) | 0 (0.0%) |
| Educational Services | 3 (25.0%) | 9 (75.0%) |
| Health Care & Social Assistance | 0 (0.0%) | 8 (100.0%) |
| Arts, Entertainment & Recreation | 0 (0.0%) | 0 (0.0%) |
| Accommodation & Food Services | 0 (0.0%) | 0 (0.0%) |
| Public Administration | 7 (58.3%) | 5 (41.7%) |
| Total | 65 (57.5%) | 48 (42.5%) |
Education in Gatesville
School Enrollment in Gatesville
The most common levels of schooling among the 44 students in Gatesville are elementary school (16 | 36.4%), nursery / preschool (10 | 22.7%), and middle school (7 | 15.9%).
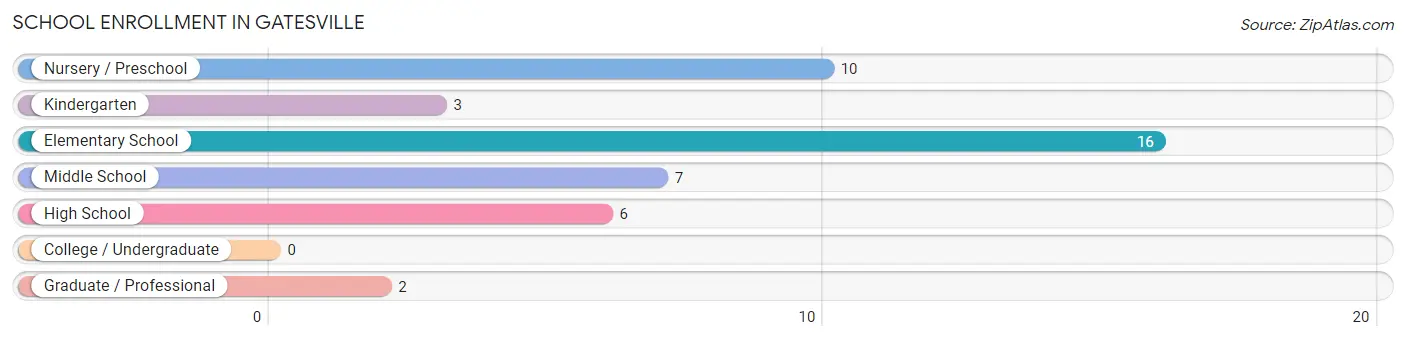
| School Level | # Students | % Students |
| Nursery / Preschool | 10 | 22.7% |
| Kindergarten | 3 | 6.8% |
| Elementary School | 16 | 36.4% |
| Middle School | 7 | 15.9% |
| High School | 6 | 13.6% |
| College / Undergraduate | 0 | 0.0% |
| Graduate / Professional | 2 | 4.5% |
| Total | 44 | 100.0% |
School Enrollment by Age by Funding Source in Gatesville
Out of a total of 44 students who are enrolled in schools in Gatesville, 22 (50.0%) attend a private institution, while the remaining 22 (50.0%) are enrolled in public schools. The age group of 3 to 4 year olds has the highest likelihood of being enrolled in private schools, with 7 (100.0% in the age bracket) enrolled. Conversely, the age group of 35 years and over has the lowest likelihood of being enrolled in a private school, with 2 (100.0% in the age bracket) attending a public institution.
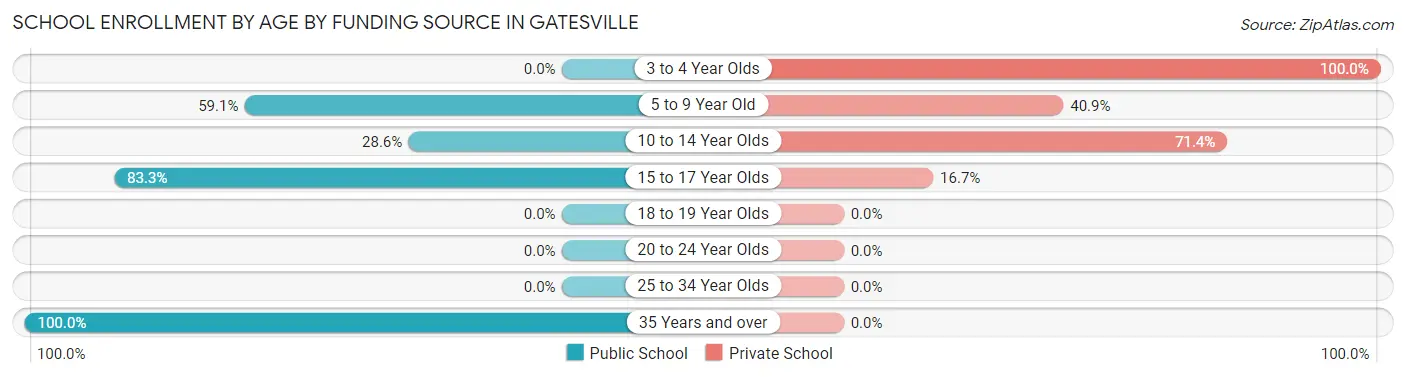
| Age Bracket | Public School | Private School |
| 3 to 4 Year Olds | 0 (0.0%) | 7 (100.0%) |
| 5 to 9 Year Old | 13 (59.1%) | 9 (40.9%) |
| 10 to 14 Year Olds | 2 (28.6%) | 5 (71.4%) |
| 15 to 17 Year Olds | 5 (83.3%) | 1 (16.7%) |
| 18 to 19 Year Olds | 0 (0.0%) | 0 (0.0%) |
| 20 to 24 Year Olds | 0 (0.0%) | 0 (0.0%) |
| 25 to 34 Year Olds | 0 (0.0%) | 0 (0.0%) |
| 35 Years and over | 2 (100.0%) | 0 (0.0%) |
| Total | 22 (50.0%) | 22 (50.0%) |
Educational Attainment by Field of Study in Gatesville
Literature & languages (11 | 28.9%), education (9 | 23.7%), science & technology (6 | 15.8%), arts & humanities (5 | 13.2%), and liberal arts & history (3 | 7.9%) are the most common fields of study among 38 individuals in Gatesville who have obtained a bachelor's degree or higher.
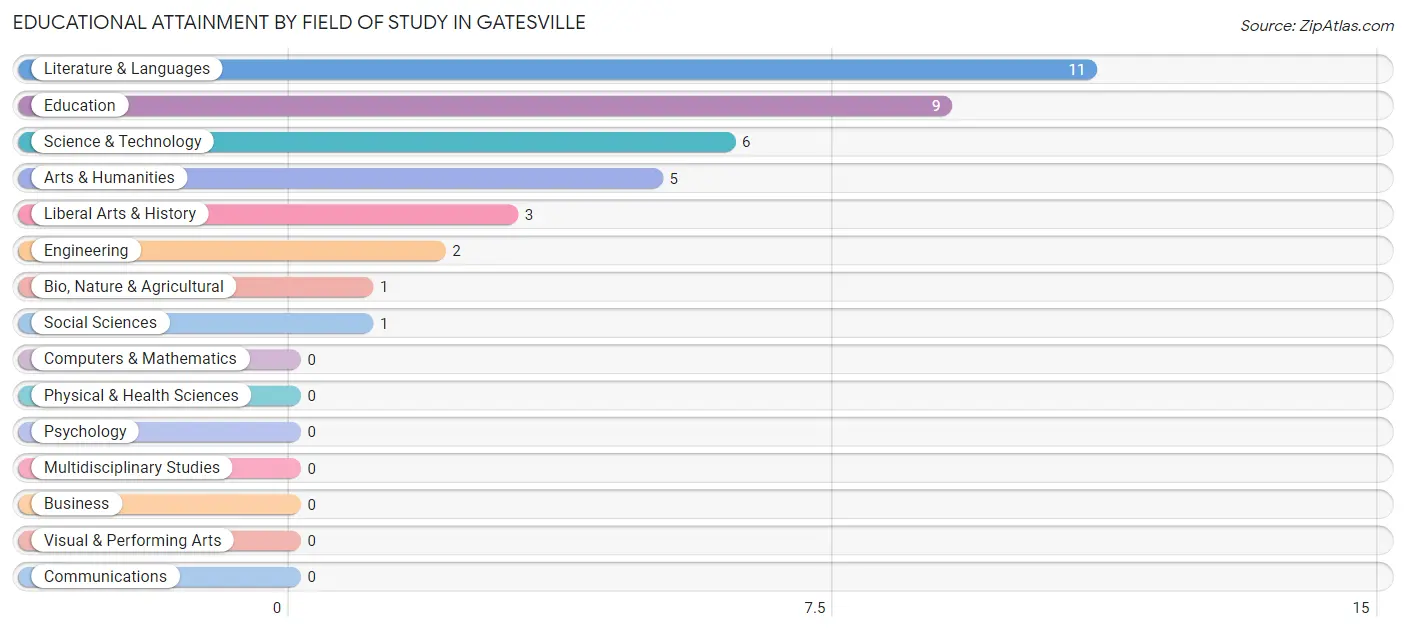
| Field of Study | # Graduates | % Graduates |
| Computers & Mathematics | 0 | 0.0% |
| Bio, Nature & Agricultural | 1 | 2.6% |
| Physical & Health Sciences | 0 | 0.0% |
| Psychology | 0 | 0.0% |
| Social Sciences | 1 | 2.6% |
| Engineering | 2 | 5.3% |
| Multidisciplinary Studies | 0 | 0.0% |
| Science & Technology | 6 | 15.8% |
| Business | 0 | 0.0% |
| Education | 9 | 23.7% |
| Literature & Languages | 11 | 28.9% |
| Liberal Arts & History | 3 | 7.9% |
| Visual & Performing Arts | 0 | 0.0% |
| Communications | 0 | 0.0% |
| Arts & Humanities | 5 | 13.2% |
| Total | 38 | 100.0% |
Transportation & Commute in Gatesville
Vehicle Availability by Sex in Gatesville
The most prevalent vehicle ownership categories in Gatesville are males with 1 vehicle (14, accounting for 21.5%) and females with 1 vehicle (3, making up 29.8%).
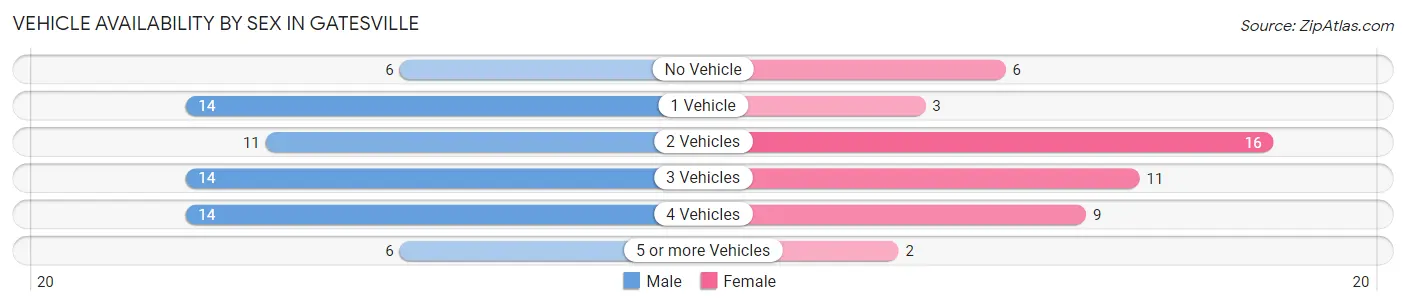
| Vehicles Available | Male | Female |
| No Vehicle | 6 (9.2%) | 6 (12.8%) |
| 1 Vehicle | 14 (21.5%) | 3 (6.4%) |
| 2 Vehicles | 11 (16.9%) | 16 (34.0%) |
| 3 Vehicles | 14 (21.5%) | 11 (23.4%) |
| 4 Vehicles | 14 (21.5%) | 9 (19.2%) |
| 5 or more Vehicles | 6 (9.2%) | 2 (4.3%) |
| Total | 65 (100.0%) | 47 (100.0%) |
Commute Time in Gatesville
The most frequently occuring commute durations in Gatesville are 45 to 59 minutes (22 commuters, 19.8%), 60 to 89 minutes (15 commuters, 13.5%), and 5 to 9 minutes (14 commuters, 12.6%).
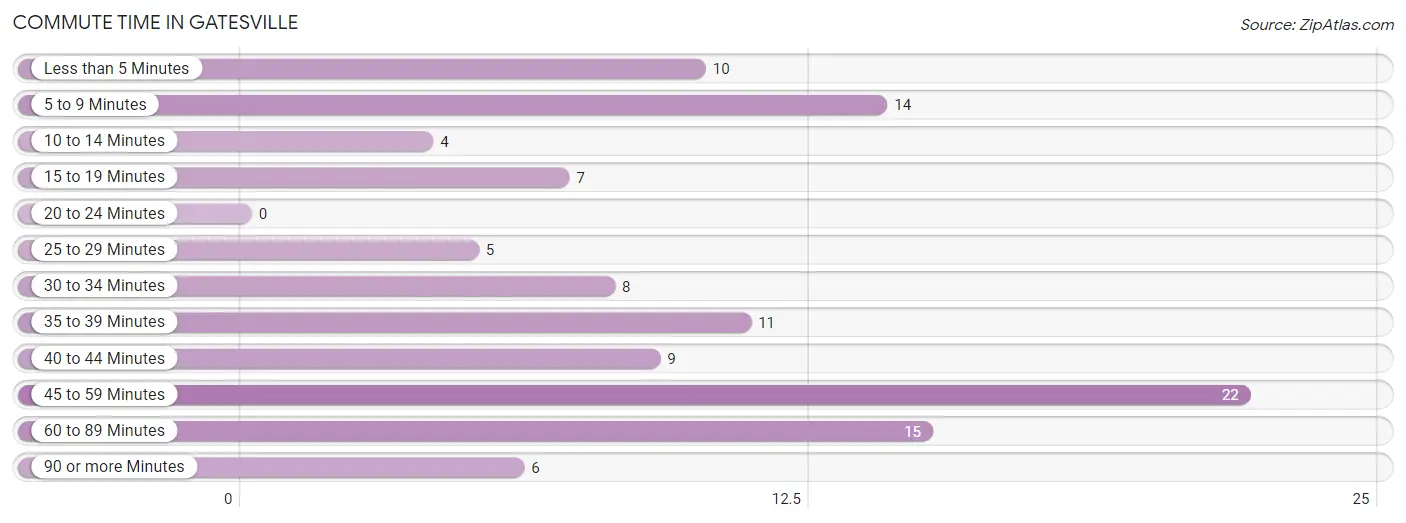
| Commute Time | # Commuters | % Commuters |
| Less than 5 Minutes | 10 | 9.0% |
| 5 to 9 Minutes | 14 | 12.6% |
| 10 to 14 Minutes | 4 | 3.6% |
| 15 to 19 Minutes | 7 | 6.3% |
| 20 to 24 Minutes | 0 | 0.0% |
| 25 to 29 Minutes | 5 | 4.5% |
| 30 to 34 Minutes | 8 | 7.2% |
| 35 to 39 Minutes | 11 | 9.9% |
| 40 to 44 Minutes | 9 | 8.1% |
| 45 to 59 Minutes | 22 | 19.8% |
| 60 to 89 Minutes | 15 | 13.5% |
| 90 or more Minutes | 6 | 5.4% |
Commute Time by Sex in Gatesville
The most common commute times in Gatesville are 45 to 59 minutes (22 commuters, 33.9%) for males and 5 to 9 minutes (9 commuters, 19.6%) for females.
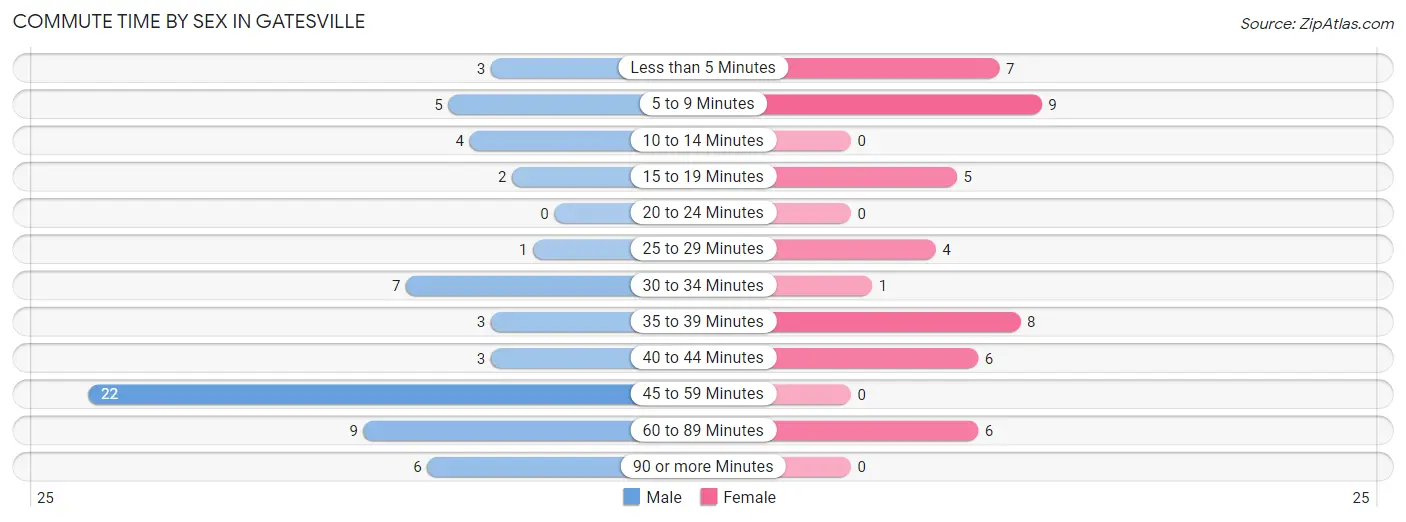
| Commute Time | Male | Female |
| Less than 5 Minutes | 3 (4.6%) | 7 (15.2%) |
| 5 to 9 Minutes | 5 (7.7%) | 9 (19.6%) |
| 10 to 14 Minutes | 4 (6.1%) | 0 (0.0%) |
| 15 to 19 Minutes | 2 (3.1%) | 5 (10.9%) |
| 20 to 24 Minutes | 0 (0.0%) | 0 (0.0%) |
| 25 to 29 Minutes | 1 (1.5%) | 4 (8.7%) |
| 30 to 34 Minutes | 7 (10.8%) | 1 (2.2%) |
| 35 to 39 Minutes | 3 (4.6%) | 8 (17.4%) |
| 40 to 44 Minutes | 3 (4.6%) | 6 (13.0%) |
| 45 to 59 Minutes | 22 (33.9%) | 0 (0.0%) |
| 60 to 89 Minutes | 9 (13.9%) | 6 (13.0%) |
| 90 or more Minutes | 6 (9.2%) | 0 (0.0%) |
Time of Departure to Work by Sex in Gatesville
The most frequent times of departure to work in Gatesville are 12:00 AM to 4:59 AM (23, 35.4%) for males and 7:30 AM to 7:59 AM (10, 21.7%) for females.
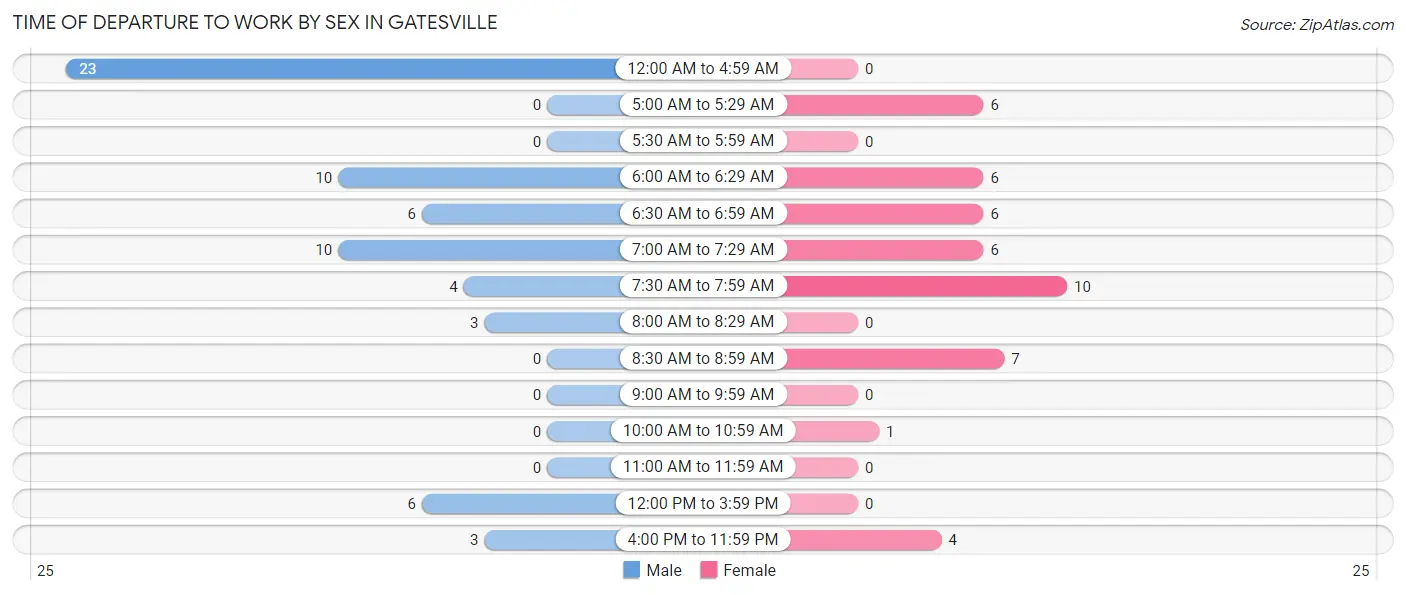
| Time of Departure | Male | Female |
| 12:00 AM to 4:59 AM | 23 (35.4%) | 0 (0.0%) |
| 5:00 AM to 5:29 AM | 0 (0.0%) | 6 (13.0%) |
| 5:30 AM to 5:59 AM | 0 (0.0%) | 0 (0.0%) |
| 6:00 AM to 6:29 AM | 10 (15.4%) | 6 (13.0%) |
| 6:30 AM to 6:59 AM | 6 (9.2%) | 6 (13.0%) |
| 7:00 AM to 7:29 AM | 10 (15.4%) | 6 (13.0%) |
| 7:30 AM to 7:59 AM | 4 (6.1%) | 10 (21.7%) |
| 8:00 AM to 8:29 AM | 3 (4.6%) | 0 (0.0%) |
| 8:30 AM to 8:59 AM | 0 (0.0%) | 7 (15.2%) |
| 9:00 AM to 9:59 AM | 0 (0.0%) | 0 (0.0%) |
| 10:00 AM to 10:59 AM | 0 (0.0%) | 1 (2.2%) |
| 11:00 AM to 11:59 AM | 0 (0.0%) | 0 (0.0%) |
| 12:00 PM to 3:59 PM | 6 (9.2%) | 0 (0.0%) |
| 4:00 PM to 11:59 PM | 3 (4.6%) | 4 (8.7%) |
| Total | 65 (100.0%) | 46 (100.0%) |
Housing Occupancy in Gatesville
Occupancy by Ownership in Gatesville
Of the total 99 dwellings in Gatesville, owner-occupied units account for 76 (76.8%), while renter-occupied units make up 23 (23.2%).
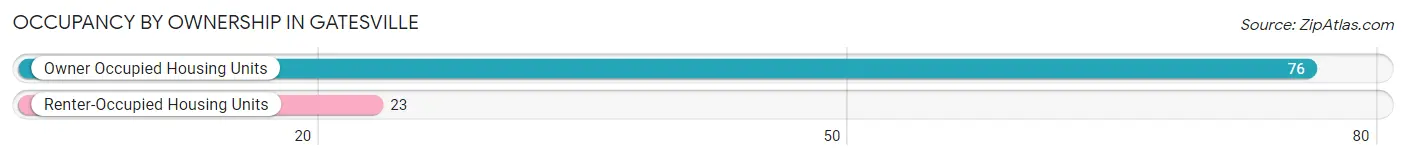
| Occupancy | # Housing Units | % Housing Units |
| Owner Occupied Housing Units | 76 | 76.8% |
| Renter-Occupied Housing Units | 23 | 23.2% |
| Total Occupied Housing Units | 99 | 100.0% |
Occupancy by Household Size in Gatesville
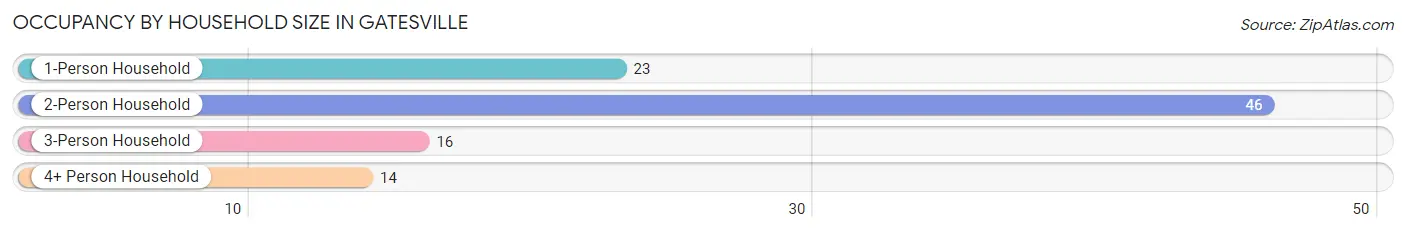
| Household Size | # Housing Units | % Housing Units |
| 1-Person Household | 23 | 23.2% |
| 2-Person Household | 46 | 46.5% |
| 3-Person Household | 16 | 16.2% |
| 4+ Person Household | 14 | 14.1% |
| Total Housing Units | 99 | 100.0% |
Occupancy by Ownership by Household Size in Gatesville
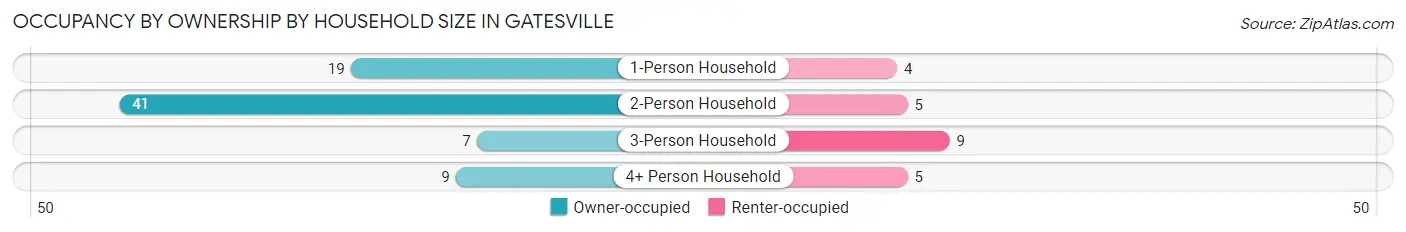
| Household Size | Owner-occupied | Renter-occupied |
| 1-Person Household | 19 (82.6%) | 4 (17.4%) |
| 2-Person Household | 41 (89.1%) | 5 (10.9%) |
| 3-Person Household | 7 (43.8%) | 9 (56.2%) |
| 4+ Person Household | 9 (64.3%) | 5 (35.7%) |
| Total Housing Units | 76 (76.8%) | 23 (23.2%) |
Occupancy by Educational Attainment in Gatesville
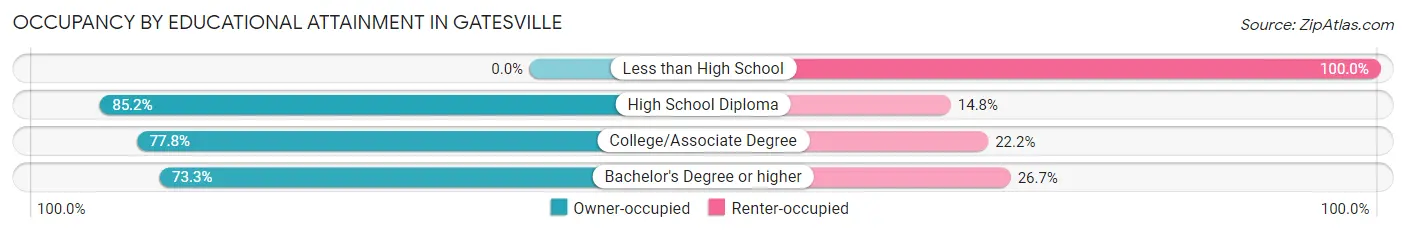
| Household Size | Owner-occupied | Renter-occupied |
| Less than High School | 0 (0.0%) | 3 (100.0%) |
| High School Diploma | 23 (85.2%) | 4 (14.8%) |
| College/Associate Degree | 42 (77.8%) | 12 (22.2%) |
| Bachelor's Degree or higher | 11 (73.3%) | 4 (26.7%) |
Occupancy by Age of Householder in Gatesville
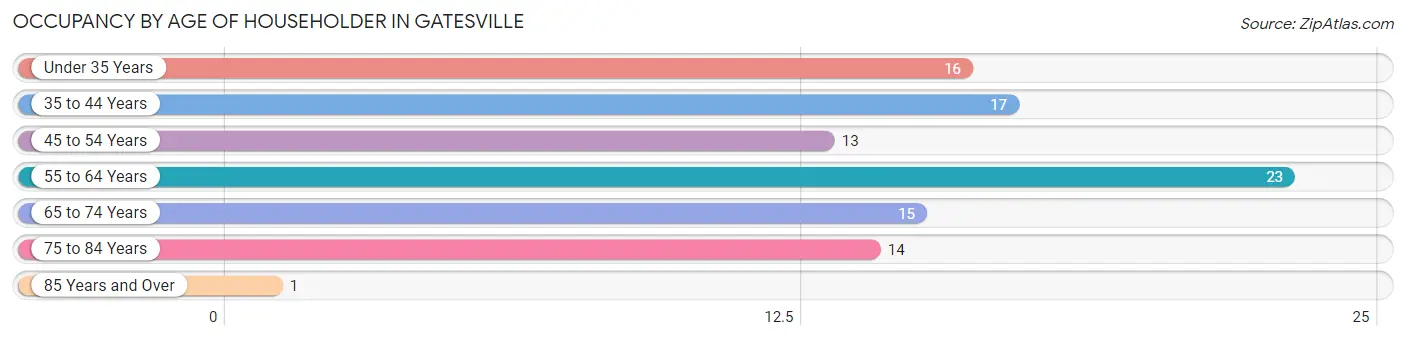
| Age Bracket | # Households | % Households |
| Under 35 Years | 16 | 16.2% |
| 35 to 44 Years | 17 | 17.2% |
| 45 to 54 Years | 13 | 13.1% |
| 55 to 64 Years | 23 | 23.2% |
| 65 to 74 Years | 15 | 15.1% |
| 75 to 84 Years | 14 | 14.1% |
| 85 Years and Over | 1 | 1.0% |
| Total | 99 | 100.0% |
Housing Finances in Gatesville
Median Income by Occupancy in Gatesville
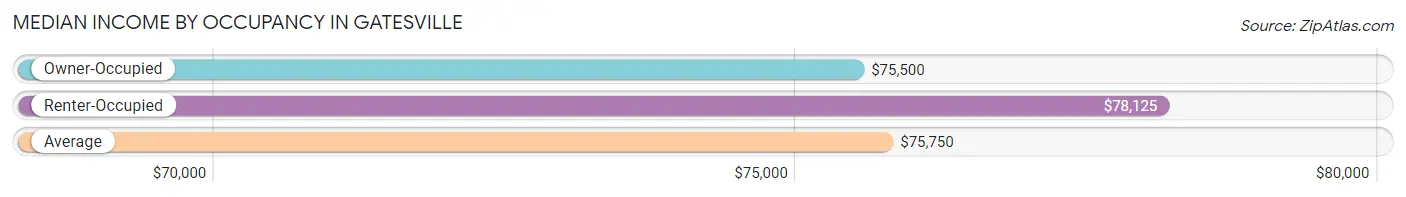
| Occupancy Type | # Households | Median Income |
| Owner-Occupied | 76 (76.8%) | $75,500 |
| Renter-Occupied | 23 (23.2%) | $78,125 |
| Average | 99 (100.0%) | $75,750 |
Occupancy by Householder Income Bracket in Gatesville
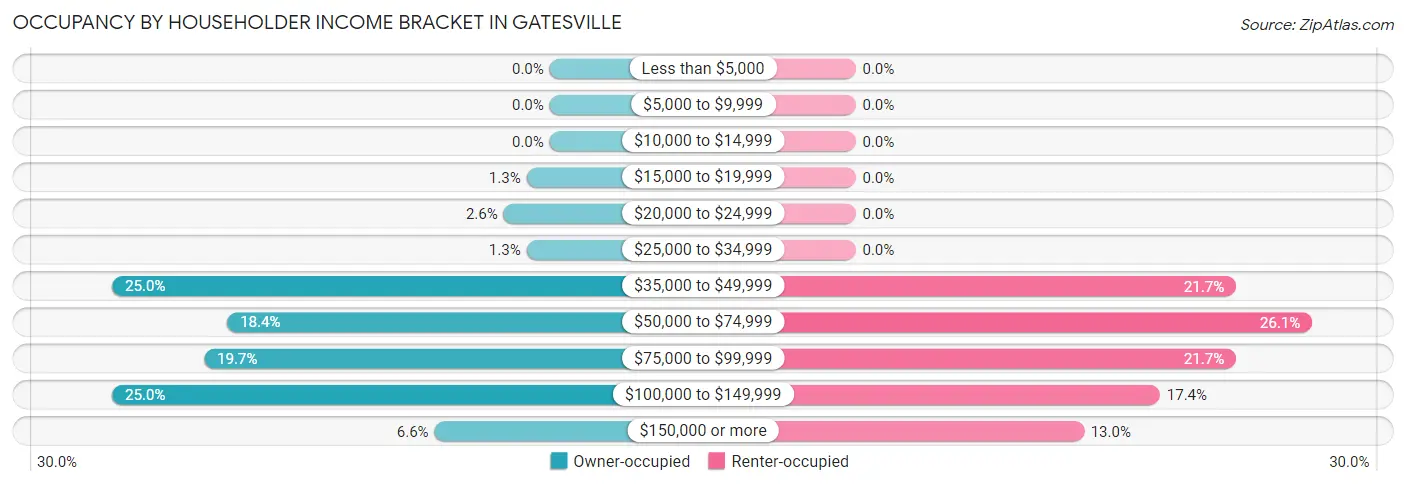
| Income Bracket | Owner-occupied | Renter-occupied |
| Less than $5,000 | 0 (0.0%) | 0 (0.0%) |
| $5,000 to $9,999 | 0 (0.0%) | 0 (0.0%) |
| $10,000 to $14,999 | 0 (0.0%) | 0 (0.0%) |
| $15,000 to $19,999 | 1 (1.3%) | 0 (0.0%) |
| $20,000 to $24,999 | 2 (2.6%) | 0 (0.0%) |
| $25,000 to $34,999 | 1 (1.3%) | 0 (0.0%) |
| $35,000 to $49,999 | 19 (25.0%) | 5 (21.7%) |
| $50,000 to $74,999 | 14 (18.4%) | 6 (26.1%) |
| $75,000 to $99,999 | 15 (19.7%) | 5 (21.7%) |
| $100,000 to $149,999 | 19 (25.0%) | 4 (17.4%) |
| $150,000 or more | 5 (6.6%) | 3 (13.0%) |
| Total | 76 (100.0%) | 23 (100.0%) |
Monthly Housing Cost Tiers in Gatesville
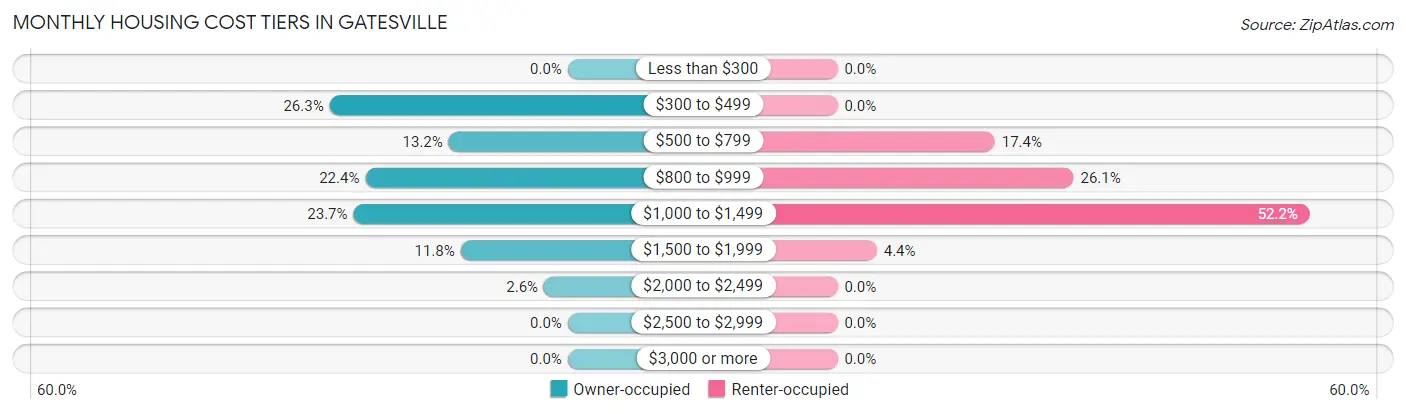
| Monthly Cost | Owner-occupied | Renter-occupied |
| Less than $300 | 0 (0.0%) | 0 (0.0%) |
| $300 to $499 | 20 (26.3%) | 0 (0.0%) |
| $500 to $799 | 10 (13.2%) | 4 (17.4%) |
| $800 to $999 | 17 (22.4%) | 6 (26.1%) |
| $1,000 to $1,499 | 18 (23.7%) | 12 (52.2%) |
| $1,500 to $1,999 | 9 (11.8%) | 1 (4.3%) |
| $2,000 to $2,499 | 2 (2.6%) | 0 (0.0%) |
| $2,500 to $2,999 | 0 (0.0%) | 0 (0.0%) |
| $3,000 or more | 0 (0.0%) | 0 (0.0%) |
| Total | 76 (100.0%) | 23 (100.0%) |
Physical Housing Characteristics in Gatesville
Housing Structures in Gatesville
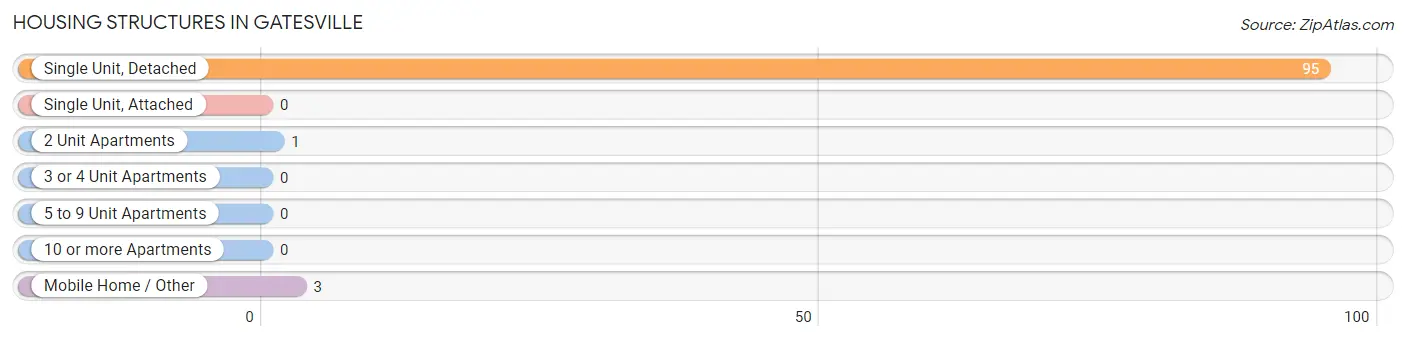
| Structure Type | # Housing Units | % Housing Units |
| Single Unit, Detached | 95 | 96.0% |
| Single Unit, Attached | 0 | 0.0% |
| 2 Unit Apartments | 1 | 1.0% |
| 3 or 4 Unit Apartments | 0 | 0.0% |
| 5 to 9 Unit Apartments | 0 | 0.0% |
| 10 or more Apartments | 0 | 0.0% |
| Mobile Home / Other | 3 | 3.0% |
| Total | 99 | 100.0% |
Housing Structures by Occupancy in Gatesville
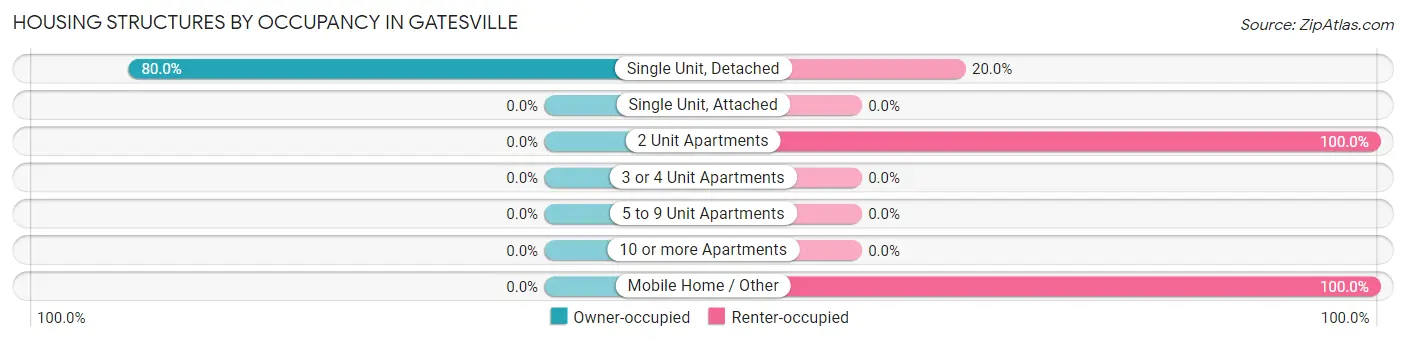
| Structure Type | Owner-occupied | Renter-occupied |
| Single Unit, Detached | 76 (80.0%) | 19 (20.0%) |
| Single Unit, Attached | 0 (0.0%) | 0 (0.0%) |
| 2 Unit Apartments | 0 (0.0%) | 1 (100.0%) |
| 3 or 4 Unit Apartments | 0 (0.0%) | 0 (0.0%) |
| 5 to 9 Unit Apartments | 0 (0.0%) | 0 (0.0%) |
| 10 or more Apartments | 0 (0.0%) | 0 (0.0%) |
| Mobile Home / Other | 0 (0.0%) | 3 (100.0%) |
| Total | 76 (76.8%) | 23 (23.2%) |
Housing Structures by Number of Rooms in Gatesville
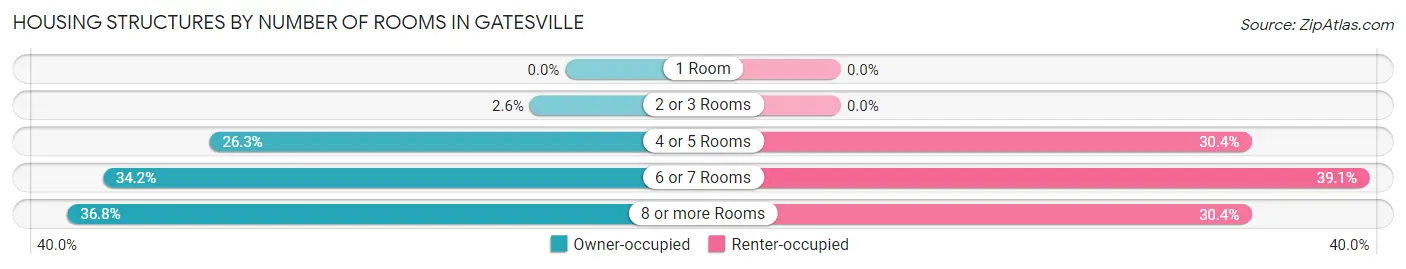
| Number of Rooms | Owner-occupied | Renter-occupied |
| 1 Room | 0 (0.0%) | 0 (0.0%) |
| 2 or 3 Rooms | 2 (2.6%) | 0 (0.0%) |
| 4 or 5 Rooms | 20 (26.3%) | 7 (30.4%) |
| 6 or 7 Rooms | 26 (34.2%) | 9 (39.1%) |
| 8 or more Rooms | 28 (36.8%) | 7 (30.4%) |
| Total | 76 (100.0%) | 23 (100.0%) |
Housing Structure by Heating Type in Gatesville
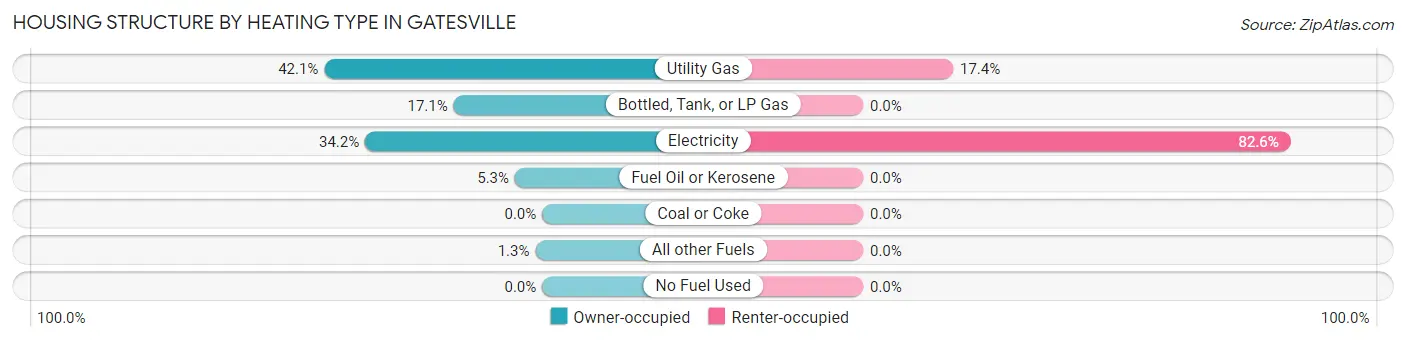
| Heating Type | Owner-occupied | Renter-occupied |
| Utility Gas | 32 (42.1%) | 4 (17.4%) |
| Bottled, Tank, or LP Gas | 13 (17.1%) | 0 (0.0%) |
| Electricity | 26 (34.2%) | 19 (82.6%) |
| Fuel Oil or Kerosene | 4 (5.3%) | 0 (0.0%) |
| Coal or Coke | 0 (0.0%) | 0 (0.0%) |
| All other Fuels | 1 (1.3%) | 0 (0.0%) |
| No Fuel Used | 0 (0.0%) | 0 (0.0%) |
| Total | 76 (100.0%) | 23 (100.0%) |
Household Vehicle Usage in Gatesville
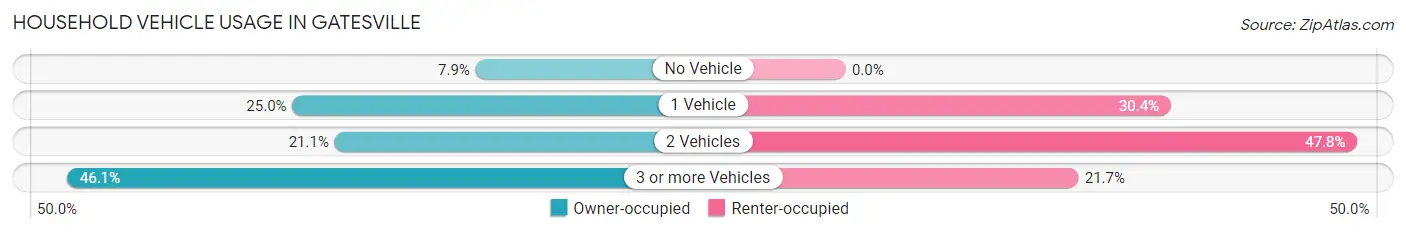
| Vehicles per Household | Owner-occupied | Renter-occupied |
| No Vehicle | 6 (7.9%) | 0 (0.0%) |
| 1 Vehicle | 19 (25.0%) | 7 (30.4%) |
| 2 Vehicles | 16 (21.0%) | 11 (47.8%) |
| 3 or more Vehicles | 35 (46.1%) | 5 (21.7%) |
| Total | 76 (100.0%) | 23 (100.0%) |
Real Estate & Mortgages in Gatesville
Real Estate and Mortgage Overview in Gatesville
| Characteristic | Without Mortgage | With Mortgage |
| Housing Units | 28 | 48 |
| Median Property Value | $187,500 | $176,900 |
| Median Household Income | $73,750 | $2 |
| Monthly Housing Costs | $425 | $0 |
| Real Estate Taxes | $1,850 | $0 |
Property Value by Mortgage Status in Gatesville
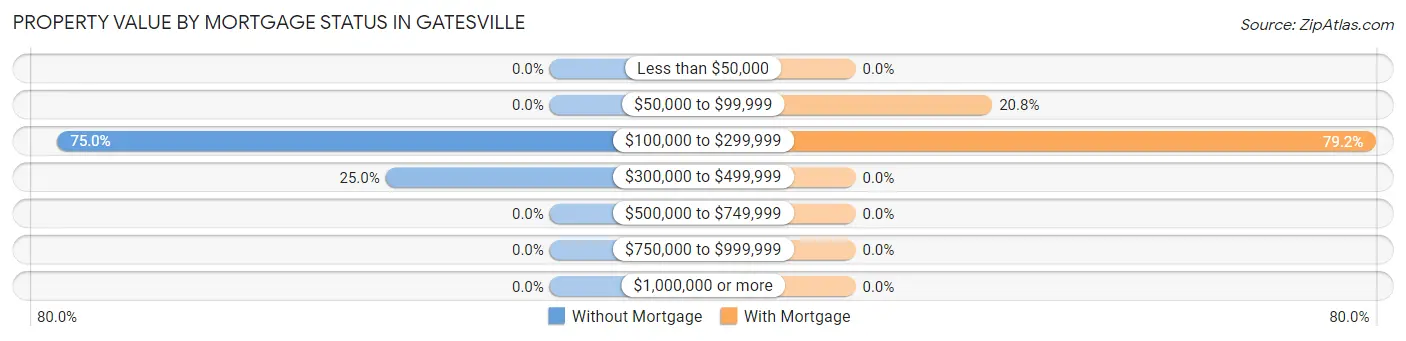
| Property Value | Without Mortgage | With Mortgage |
| Less than $50,000 | 0 (0.0%) | 0 (0.0%) |
| $50,000 to $99,999 | 0 (0.0%) | 10 (20.8%) |
| $100,000 to $299,999 | 21 (75.0%) | 38 (79.2%) |
| $300,000 to $499,999 | 7 (25.0%) | 0 (0.0%) |
| $500,000 to $749,999 | 0 (0.0%) | 0 (0.0%) |
| $750,000 to $999,999 | 0 (0.0%) | 0 (0.0%) |
| $1,000,000 or more | 0 (0.0%) | 0 (0.0%) |
| Total | 28 (100.0%) | 48 (100.0%) |
Household Income by Mortgage Status in Gatesville
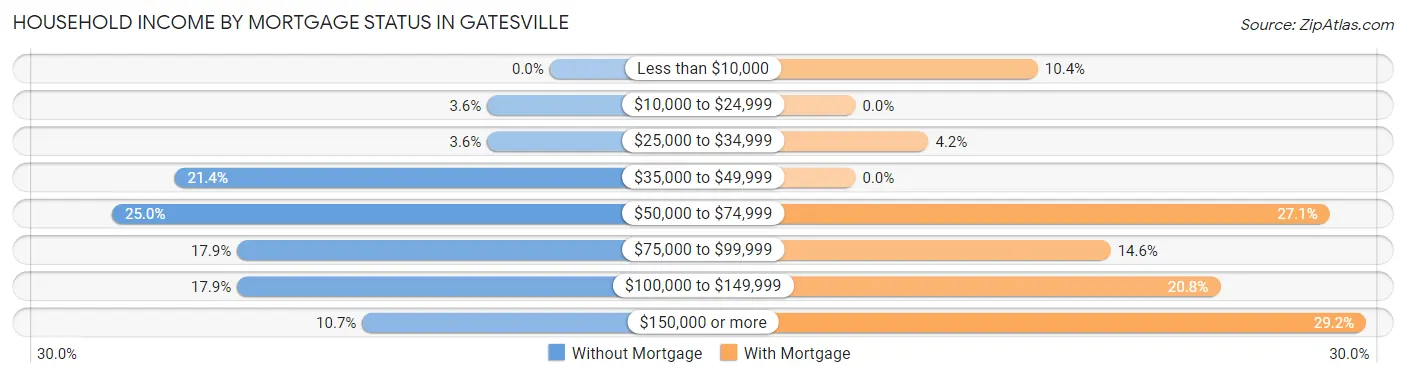
| Household Income | Without Mortgage | With Mortgage |
| Less than $10,000 | 0 (0.0%) | 5 (10.4%) |
| $10,000 to $24,999 | 1 (3.6%) | 0 (0.0%) |
| $25,000 to $34,999 | 1 (3.6%) | 2 (4.2%) |
| $35,000 to $49,999 | 6 (21.4%) | 0 (0.0%) |
| $50,000 to $74,999 | 7 (25.0%) | 13 (27.1%) |
| $75,000 to $99,999 | 5 (17.9%) | 7 (14.6%) |
| $100,000 to $149,999 | 5 (17.9%) | 10 (20.8%) |
| $150,000 or more | 3 (10.7%) | 14 (29.2%) |
| Total | 28 (100.0%) | 48 (100.0%) |
Property Value to Household Income Ratio in Gatesville
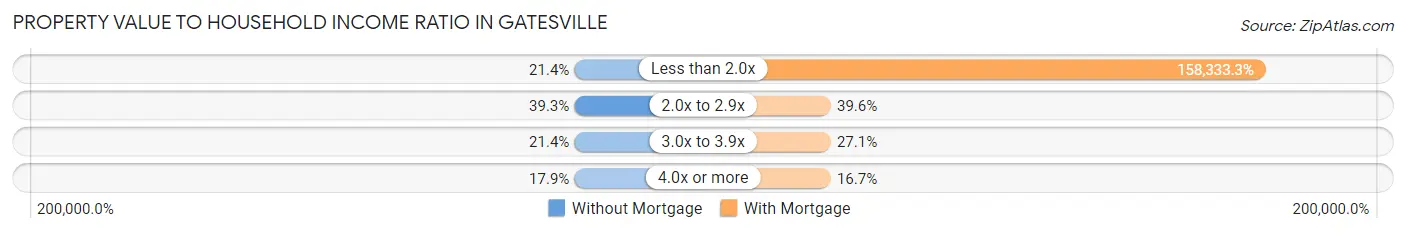
| Value-to-Income Ratio | Without Mortgage | With Mortgage |
| Less than 2.0x | 6 (21.4%) | 76,000 (158,333.3%) |
| 2.0x to 2.9x | 11 (39.3%) | 19 (39.6%) |
| 3.0x to 3.9x | 6 (21.4%) | 13 (27.1%) |
| 4.0x or more | 5 (17.9%) | 8 (16.7%) |
| Total | 28 (100.0%) | 48 (100.0%) |
Real Estate Taxes by Mortgage Status in Gatesville
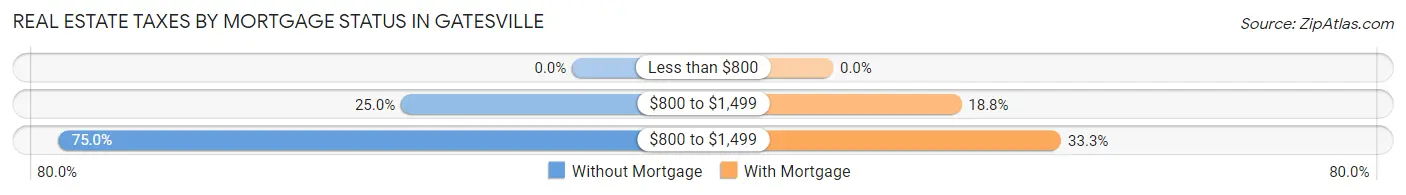
| Property Taxes | Without Mortgage | With Mortgage |
| Less than $800 | 0 (0.0%) | 0 (0.0%) |
| $800 to $1,499 | 7 (25.0%) | 9 (18.8%) |
| $800 to $1,499 | 21 (75.0%) | 16 (33.3%) |
| Total | 28 (100.0%) | 48 (100.0%) |
Health & Disability in Gatesville
Health Insurance Coverage by Age in Gatesville
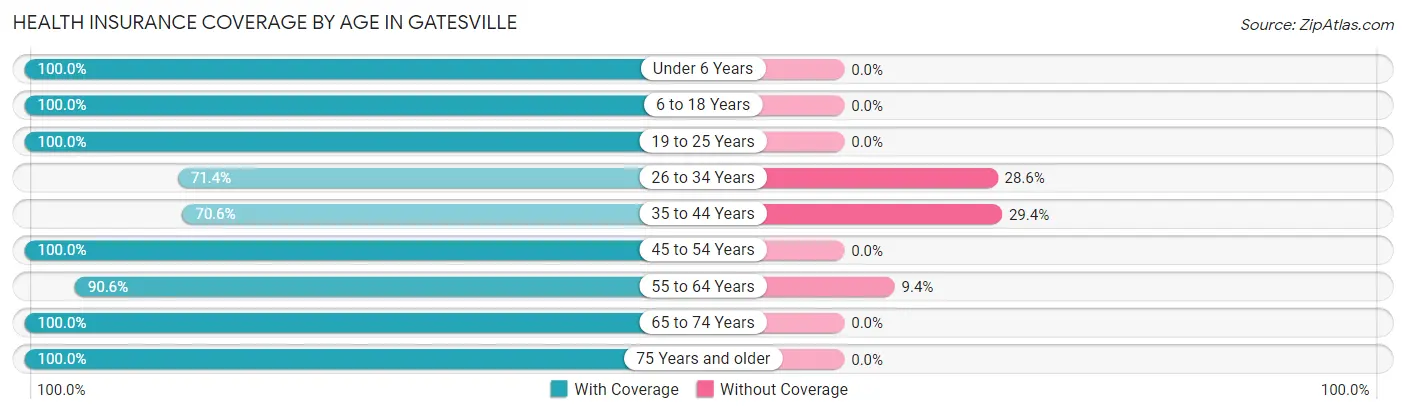
| Age Bracket | With Coverage | Without Coverage |
| Under 6 Years | 40 (100.0%) | 0 (0.0%) |
| 6 to 18 Years | 29 (100.0%) | 0 (0.0%) |
| 19 to 25 Years | 8 (100.0%) | 0 (0.0%) |
| 26 to 34 Years | 25 (71.4%) | 10 (28.6%) |
| 35 to 44 Years | 24 (70.6%) | 10 (29.4%) |
| 45 to 54 Years | 42 (100.0%) | 0 (0.0%) |
| 55 to 64 Years | 29 (90.6%) | 3 (9.4%) |
| 65 to 74 Years | 34 (100.0%) | 0 (0.0%) |
| 75 Years and older | 23 (100.0%) | 0 (0.0%) |
| Total | 254 (91.7%) | 23 (8.3%) |
Health Insurance Coverage by Citizenship Status in Gatesville
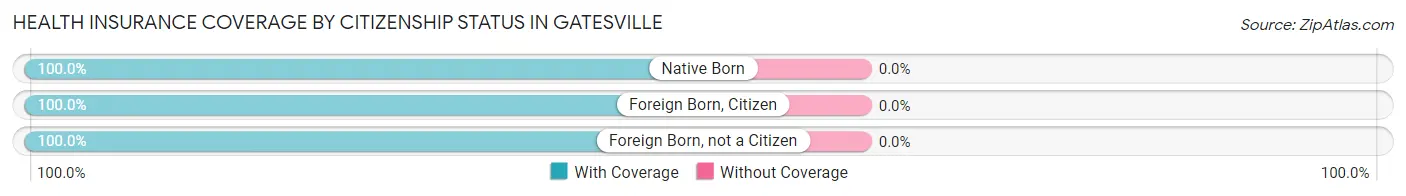
| Citizenship Status | With Coverage | Without Coverage |
| Native Born | 40 (100.0%) | 0 (0.0%) |
| Foreign Born, Citizen | 29 (100.0%) | 0 (0.0%) |
| Foreign Born, not a Citizen | 8 (100.0%) | 0 (0.0%) |
Health Insurance Coverage by Household Income in Gatesville
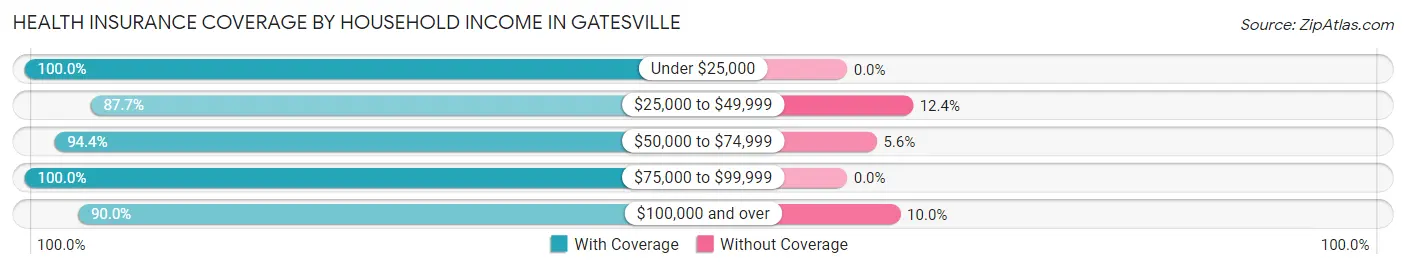
| Household Income | With Coverage | Without Coverage |
| Under $25,000 | 3 (100.0%) | 0 (0.0%) |
| $25,000 to $49,999 | 71 (87.6%) | 10 (12.3%) |
| $50,000 to $74,999 | 51 (94.4%) | 3 (5.6%) |
| $75,000 to $99,999 | 39 (100.0%) | 0 (0.0%) |
| $100,000 and over | 90 (90.0%) | 10 (10.0%) |
Public vs Private Health Insurance Coverage by Age in Gatesville
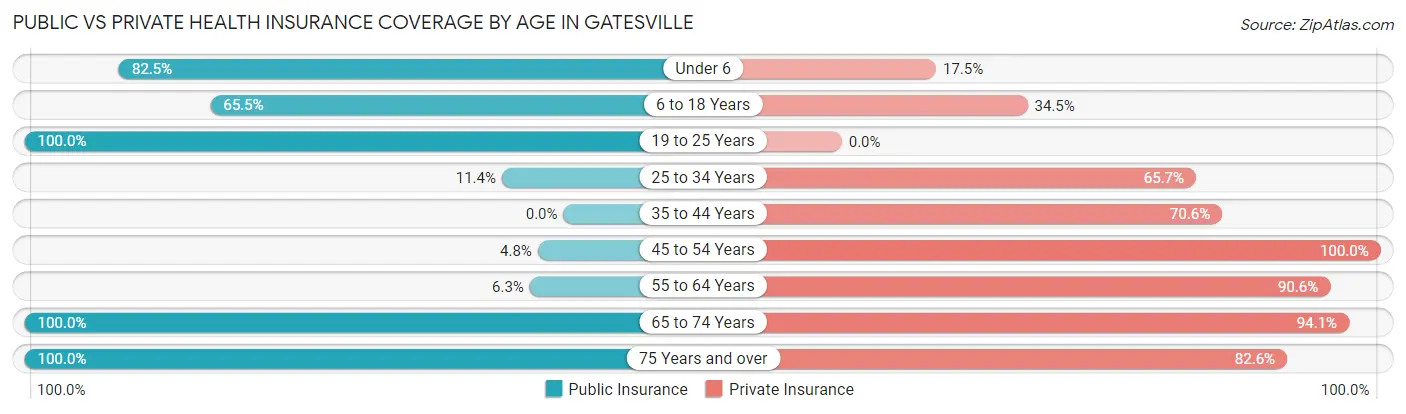
| Age Bracket | Public Insurance | Private Insurance |
| Under 6 | 33 (82.5%) | 7 (17.5%) |
| 6 to 18 Years | 19 (65.5%) | 10 (34.5%) |
| 19 to 25 Years | 8 (100.0%) | 0 (0.0%) |
| 25 to 34 Years | 4 (11.4%) | 23 (65.7%) |
| 35 to 44 Years | 0 (0.0%) | 24 (70.6%) |
| 45 to 54 Years | 2 (4.8%) | 42 (100.0%) |
| 55 to 64 Years | 2 (6.2%) | 29 (90.6%) |
| 65 to 74 Years | 34 (100.0%) | 32 (94.1%) |
| 75 Years and over | 23 (100.0%) | 19 (82.6%) |
| Total | 125 (45.1%) | 186 (67.1%) |
Disability Status by Sex by Age in Gatesville
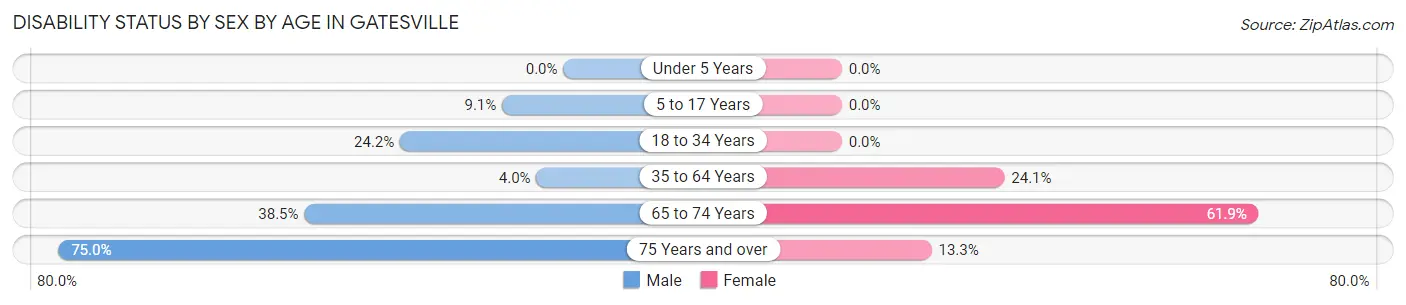
| Age Bracket | Male | Female |
| Under 5 Years | 0 (0.0%) | 0 (0.0%) |
| 5 to 17 Years | 1 (9.1%) | 0 (0.0%) |
| 18 to 34 Years | 8 (24.2%) | 0 (0.0%) |
| 35 to 64 Years | 2 (4.0%) | 14 (24.1%) |
| 65 to 74 Years | 5 (38.5%) | 13 (61.9%) |
| 75 Years and over | 6 (75.0%) | 2 (13.3%) |
Disability Class by Sex by Age in Gatesville
Disability Class: Hearing Difficulty
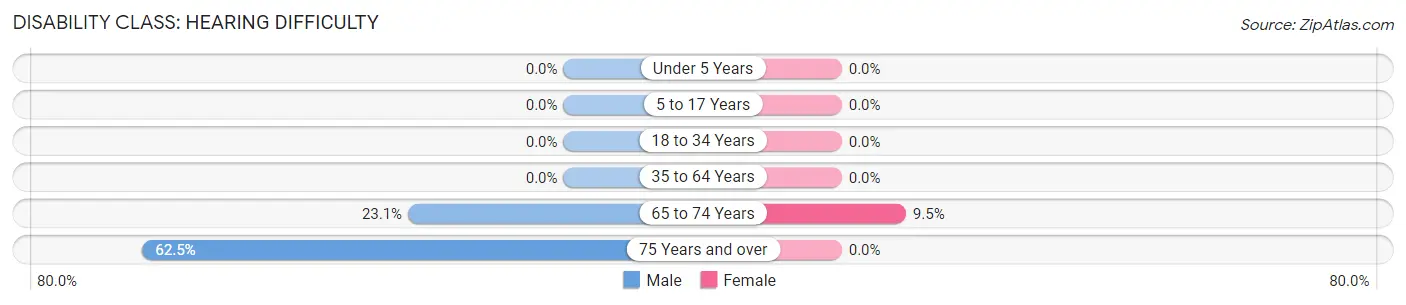
| Age Bracket | Male | Female |
| Under 5 Years | 0 (0.0%) | 0 (0.0%) |
| 5 to 17 Years | 0 (0.0%) | 0 (0.0%) |
| 18 to 34 Years | 0 (0.0%) | 0 (0.0%) |
| 35 to 64 Years | 0 (0.0%) | 0 (0.0%) |
| 65 to 74 Years | 3 (23.1%) | 2 (9.5%) |
| 75 Years and over | 5 (62.5%) | 0 (0.0%) |
Disability Class: Vision Difficulty
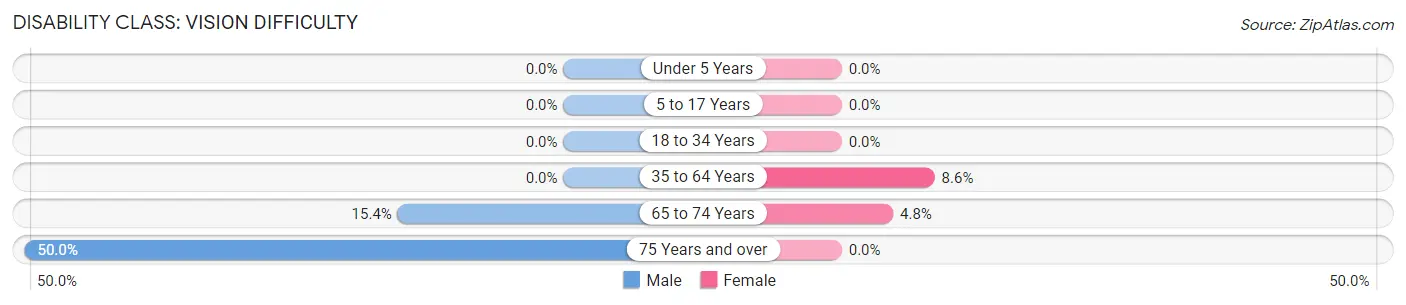
| Age Bracket | Male | Female |
| Under 5 Years | 0 (0.0%) | 0 (0.0%) |
| 5 to 17 Years | 0 (0.0%) | 0 (0.0%) |
| 18 to 34 Years | 0 (0.0%) | 0 (0.0%) |
| 35 to 64 Years | 0 (0.0%) | 5 (8.6%) |
| 65 to 74 Years | 2 (15.4%) | 1 (4.8%) |
| 75 Years and over | 4 (50.0%) | 0 (0.0%) |
Disability Class: Cognitive Difficulty
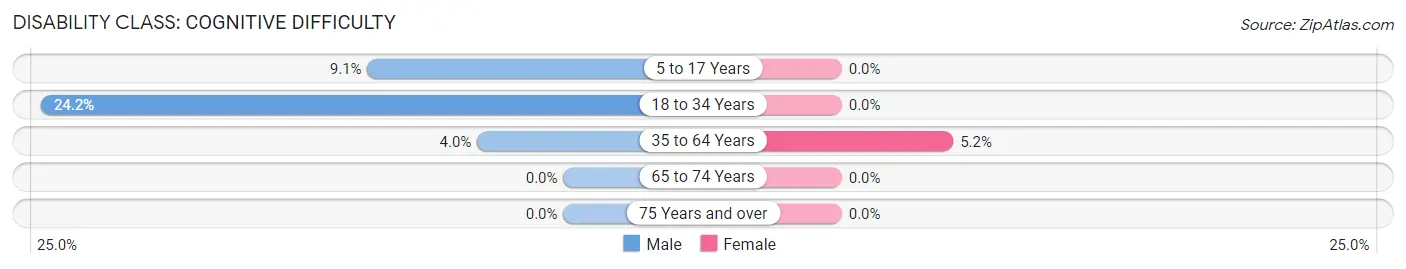
| Age Bracket | Male | Female |
| 5 to 17 Years | 1 (9.1%) | 0 (0.0%) |
| 18 to 34 Years | 8 (24.2%) | 0 (0.0%) |
| 35 to 64 Years | 2 (4.0%) | 3 (5.2%) |
| 65 to 74 Years | 0 (0.0%) | 0 (0.0%) |
| 75 Years and over | 0 (0.0%) | 0 (0.0%) |
Disability Class: Ambulatory Difficulty
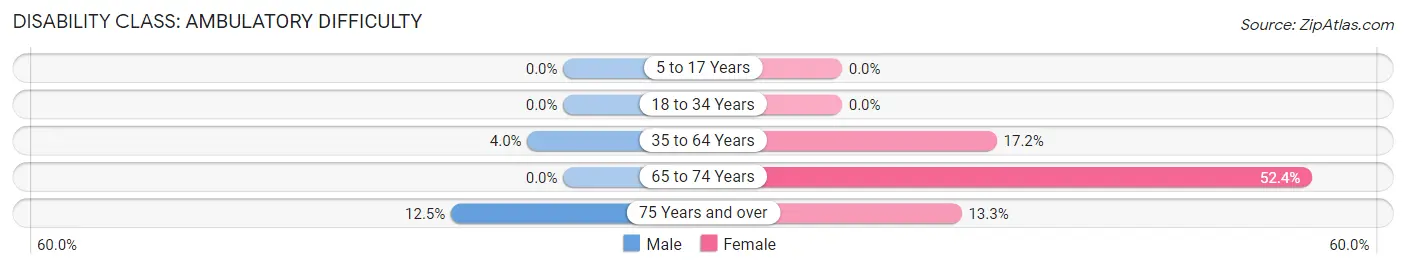
| Age Bracket | Male | Female |
| 5 to 17 Years | 0 (0.0%) | 0 (0.0%) |
| 18 to 34 Years | 0 (0.0%) | 0 (0.0%) |
| 35 to 64 Years | 2 (4.0%) | 10 (17.2%) |
| 65 to 74 Years | 0 (0.0%) | 11 (52.4%) |
| 75 Years and over | 1 (12.5%) | 2 (13.3%) |
Disability Class: Self-Care Difficulty
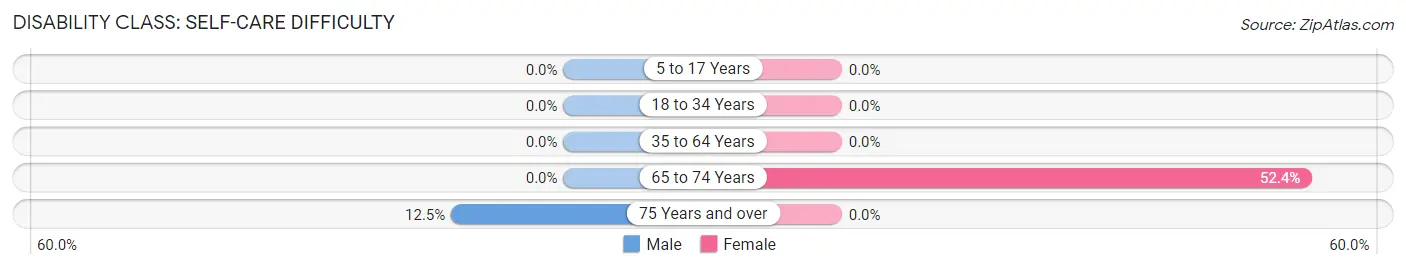
| Age Bracket | Male | Female |
| 5 to 17 Years | 0 (0.0%) | 0 (0.0%) |
| 18 to 34 Years | 0 (0.0%) | 0 (0.0%) |
| 35 to 64 Years | 0 (0.0%) | 0 (0.0%) |
| 65 to 74 Years | 0 (0.0%) | 11 (52.4%) |
| 75 Years and over | 1 (12.5%) | 0 (0.0%) |
Technology Access in Gatesville
Computing Device Access in Gatesville
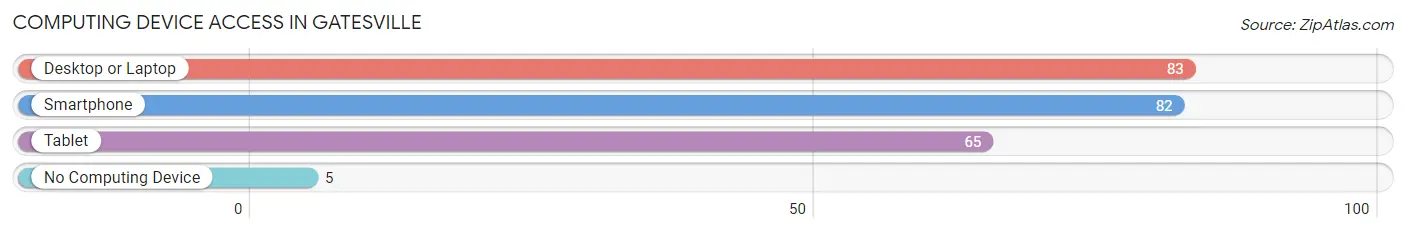
| Device Type | # Households | % Households |
| Desktop or Laptop | 83 | 83.8% |
| Smartphone | 82 | 82.8% |
| Tablet | 65 | 65.7% |
| No Computing Device | 5 | 5.1% |
| Total | 99 | 100.0% |
Internet Access in Gatesville
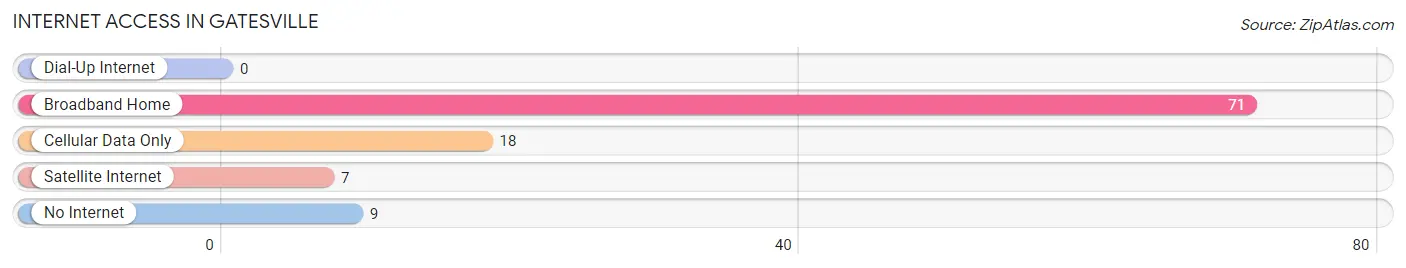
| Internet Type | # Households | % Households |
| Dial-Up Internet | 0 | 0.0% |
| Broadband Home | 71 | 71.7% |
| Cellular Data Only | 18 | 18.2% |
| Satellite Internet | 7 | 7.1% |
| No Internet | 9 | 9.1% |
| Total | 99 | 100.0% |
Gatesville Summary
Gatesville is a small town located in the northeastern part of North Carolina, in the United States. It is situated in the county of Gates, and is the county seat. The town is located on the banks of the Chowan River, and is part of the Albemarle Sound region. The town has a population of approximately 1,500 people, and is the smallest incorporated town in the state.
History
Gatesville was founded in 1790 by Colonel Thomas Gates, who was a Revolutionary War veteran. He named the town after himself, and it was incorporated in 1802. The town was originally a trading post, and it was the first town in the county. In the early 19th century, the town was a major port for the export of cotton, tobacco, and other goods.
In the late 19th century, the town was a major center for the production of naval stores, such as turpentine and rosin. The town was also a major center for the production of lumber, and it was home to several sawmills.
In the early 20th century, the town was a major center for the production of furniture. The town was also home to several textile mills, and it was a major center for the production of cotton and woolen goods.
Geography
Gatesville is located in the northeastern part of North Carolina, in the United States. It is situated in the county of Gates, and is the county seat. The town is located on the banks of the Chowan River, and is part of the Albemarle Sound region. The town is located at an elevation of approximately 30 feet above sea level.
The town is located in a humid subtropical climate zone, and has hot, humid summers and mild winters. The average annual temperature is around 70 degrees Fahrenheit, and the average annual precipitation is around 45 inches.
Economy
Gatesville is a small town, and its economy is largely based on agriculture and tourism. The town is home to several farms, and it is a major center for the production of cotton, tobacco, and other crops. The town is also home to several small businesses, such as restaurants, shops, and other services.
The town is also a major center for the production of furniture, and it is home to several furniture factories. The town is also home to several textile mills, and it is a major center for the production of cotton and woolen goods.
Demographics
Gatesville has a population of approximately 1,500 people, and is the smallest incorporated town in the state. The town has a population that is predominantly white, with a small African American population. The town also has a small Hispanic population, and a small Asian population. The town has a median household income of around $30,000, and the median home value is around $90,000. The town has a poverty rate of around 20%, and the unemployment rate is around 5%.
Common Questions
What is Per Capita Income in Gatesville?
Per Capita income in Gatesville is $32,771.
What is the Median Family Income in Gatesville?
Median Family Income in Gatesville is $76,500.
What is the Median Household income in Gatesville?
Median Household Income in Gatesville is $75,750.
What is Income or Wage Gap in Gatesville?
Income or Wage Gap in Gatesville is 47.4%.
Women in Gatesville earn 52.6 cents for every dollar earned by a man.
What is Inequality or Gini Index in Gatesville?
Inequality or Gini Index in Gatesville is 0.28.
What is the Total Population of Gatesville?
Total Population of Gatesville is 277.
What is the Total Male Population of Gatesville?
Total Male Population of Gatesville is 149.
What is the Total Female Population of Gatesville?
Total Female Population of Gatesville is 128.
What is the Ratio of Males per 100 Females in Gatesville?
There are 116.41 Males per 100 Females in Gatesville.
What is the Ratio of Females per 100 Males in Gatesville?
There are 85.91 Females per 100 Males in Gatesville.
What is the Median Population Age in Gatesville?
Median Population Age in Gatesville is 43.8 Years.
What is the Average Family Size in Gatesville
Average Family Size in Gatesville is 3.4 People.
What is the Average Household Size in Gatesville
Average Household Size in Gatesville is 2.8 People.
How Large is the Labor Force in Gatesville?
There are 128 People in the Labor Forcein in Gatesville.
What is the Percentage of People in the Labor Force in Gatesville?
60.1% of People are in the Labor Force in Gatesville.
What is the Unemployment Rate in Gatesville?
Unemployment Rate in Gatesville is 11.7%.