Camden, NC Map & Demographics
Camden Map
Camden Overview
$41,405
PER CAPITA INCOME
$84,069
AVG FAMILY INCOME
$82,794
AVG HOUSEHOLD INCOME
0.40
INEQUALITY / GINI INDEX
960
TOTAL POPULATION
555
MALE POPULATION
405
FEMALE POPULATION
137.04
MALES / 100 FEMALES
72.97
FEMALES / 100 MALES
41.2
MEDIAN AGE
2.7
AVG FAMILY SIZE
2.5
AVG HOUSEHOLD SIZE
594
LABOR FORCE [ PEOPLE ]
76.0%
PERCENT IN LABOR FORCE
6.9%
UNEMPLOYMENT RATE
Camden Zip Codes
Camden Area Codes
Income in Camden
Income Overview in Camden
Per Capita Income in Camden is $41,405, while median incomes of families and households are $84,069 and $82,794 respectively.
| Characteristic | Number | Measure |
| Per Capita Income | 960 | $41,405 |
| Median Family Income | 322 | $84,069 |
| Mean Family Income | 322 | $112,103 |
| Median Household Income | 388 | $82,794 |
| Mean Household Income | 388 | $101,949 |
| Income Deficit | 322 | $0 |
| Wage / Income Gap (%) | 960 | 0.00% |
| Wage / Income Gap ($) | 960 | 100.00¢ per $1 |
| Gini / Inequality Index | 960 | 0.40 |
Earnings by Sex in Camden
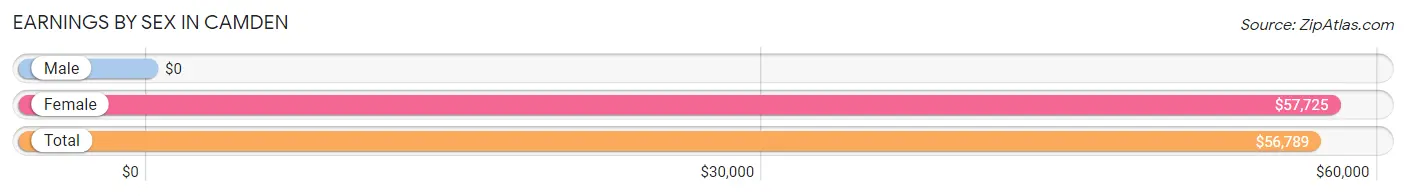
| Sex | Number | Average Earnings |
| Male | 335 (55.7%) | $0 |
| Female | 266 (44.3%) | $57,725 |
| Total | 601 (100.0%) | $56,789 |
Earnings by Sex by Income Bracket in Camden
The most common earnings brackets in Camden are $75,000 to $99,999 for men (105 | 31.3%) and $55,000 to $64,999 for women (151 | 56.8%).
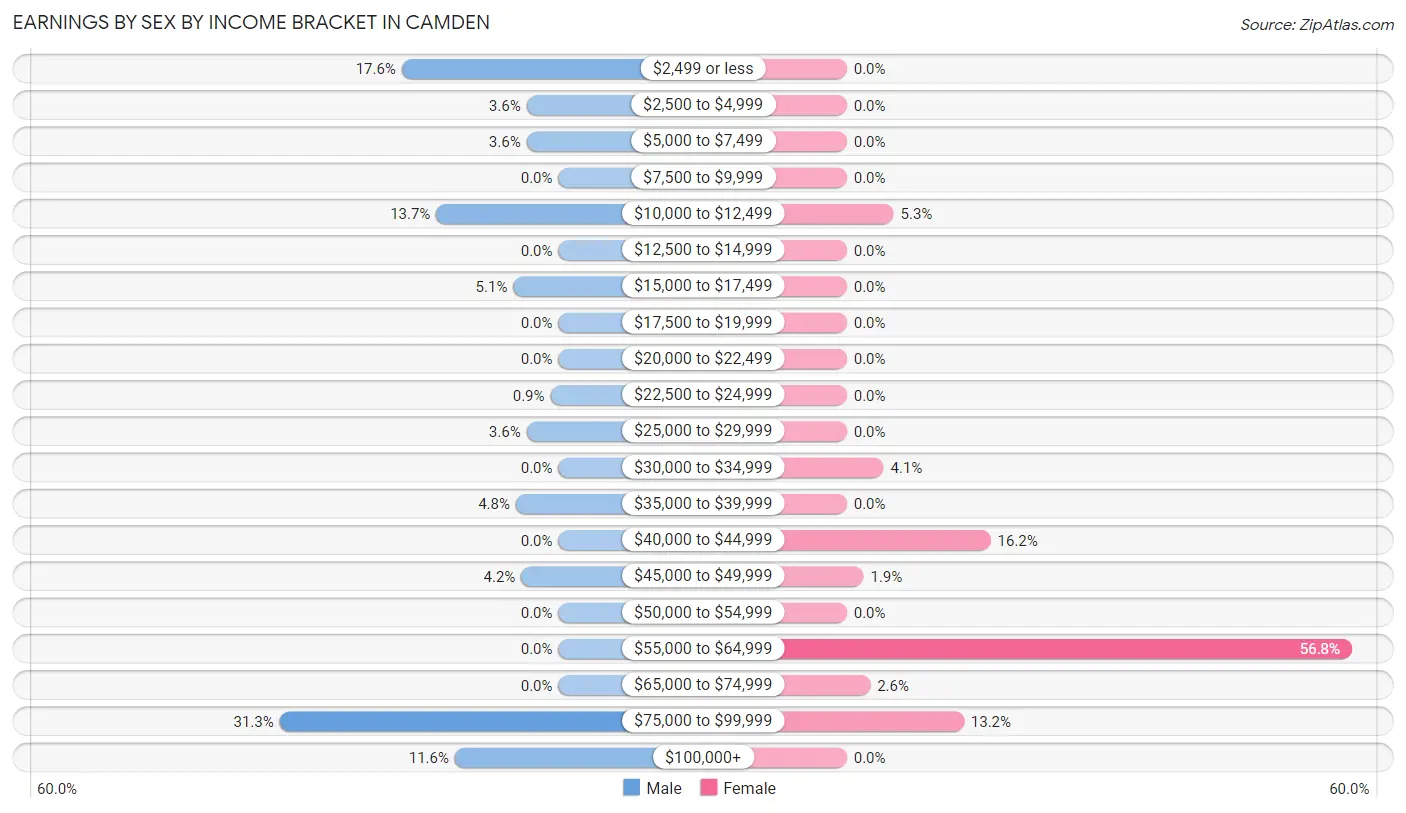
| Income | Male | Female |
| $2,499 or less | 59 (17.6%) | 0 (0.0%) |
| $2,500 to $4,999 | 12 (3.6%) | 0 (0.0%) |
| $5,000 to $7,499 | 12 (3.6%) | 0 (0.0%) |
| $7,500 to $9,999 | 0 (0.0%) | 0 (0.0%) |
| $10,000 to $12,499 | 46 (13.7%) | 14 (5.3%) |
| $12,500 to $14,999 | 0 (0.0%) | 0 (0.0%) |
| $15,000 to $17,499 | 17 (5.1%) | 0 (0.0%) |
| $17,500 to $19,999 | 0 (0.0%) | 0 (0.0%) |
| $20,000 to $22,499 | 0 (0.0%) | 0 (0.0%) |
| $22,500 to $24,999 | 3 (0.9%) | 0 (0.0%) |
| $25,000 to $29,999 | 12 (3.6%) | 0 (0.0%) |
| $30,000 to $34,999 | 0 (0.0%) | 11 (4.1%) |
| $35,000 to $39,999 | 16 (4.8%) | 0 (0.0%) |
| $40,000 to $44,999 | 0 (0.0%) | 43 (16.2%) |
| $45,000 to $49,999 | 14 (4.2%) | 5 (1.9%) |
| $50,000 to $54,999 | 0 (0.0%) | 0 (0.0%) |
| $55,000 to $64,999 | 0 (0.0%) | 151 (56.8%) |
| $65,000 to $74,999 | 0 (0.0%) | 7 (2.6%) |
| $75,000 to $99,999 | 105 (31.3%) | 35 (13.2%) |
| $100,000+ | 39 (11.6%) | 0 (0.0%) |
| Total | 335 (100.0%) | 266 (100.0%) |
Earnings by Sex by Educational Attainment in Camden
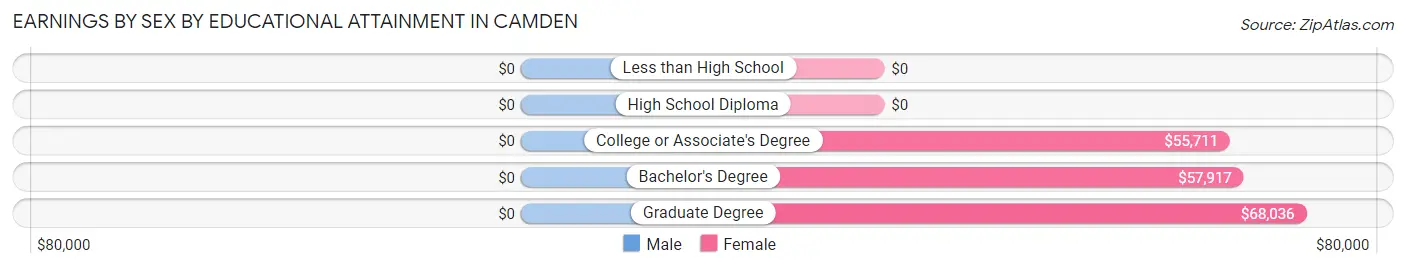
| Educational Attainment | Male Income | Female Income |
| Less than High School | - | - |
| High School Diploma | - | - |
| College or Associate's Degree | - | - |
| Bachelor's Degree | - | - |
| Graduate Degree | - | - |
| Total | $78,816 | $57,725 |
Family Income in Camden
Family Income Brackets in Camden
According to the Camden family income data, there are 96 families falling into the $75,000 to $99,999 income range, which is the most common income bracket and makes up 29.8% of all families.
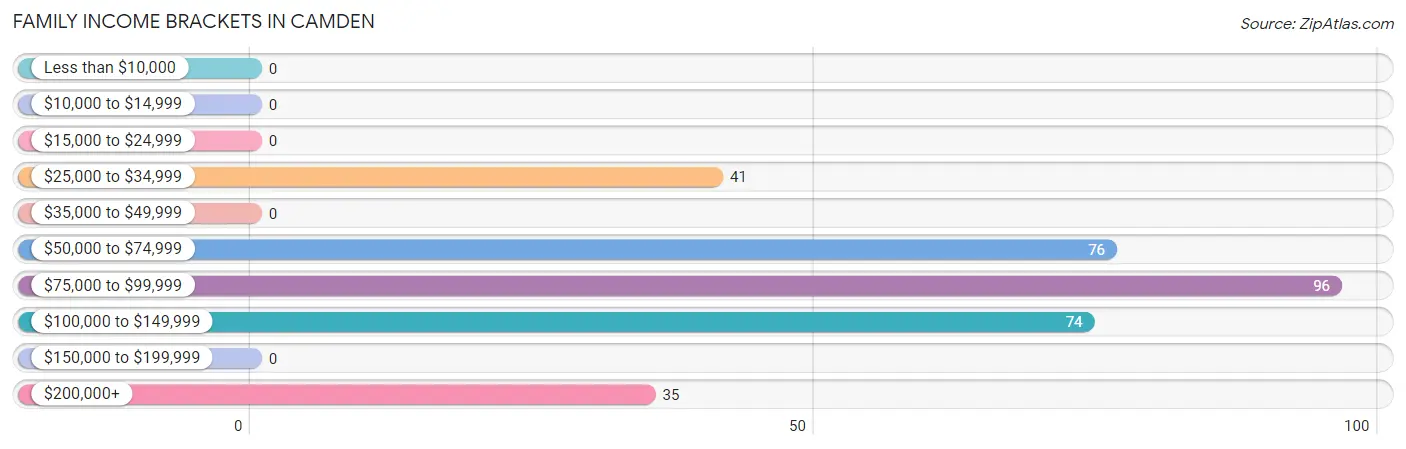
| Income Bracket | # Families | % Families |
| Less than $10,000 | 0 | 0.0% |
| $10,000 to $14,999 | 0 | 0.0% |
| $15,000 to $24,999 | 0 | 0.0% |
| $25,000 to $34,999 | 41 | 12.7% |
| $35,000 to $49,999 | 0 | 0.0% |
| $50,000 to $74,999 | 76 | 23.6% |
| $75,000 to $99,999 | 96 | 29.8% |
| $100,000 to $149,999 | 74 | 23.0% |
| $150,000 to $199,999 | 0 | 0.0% |
| $200,000+ | 35 | 10.9% |
Family Income by Famaliy Size in Camden
3-person families (132 | 41.0%) account for the highest median family income in Camden with $87,803 per family, while 2-person families (125 | 38.8%) have the highest median income of $35,446 per family member.
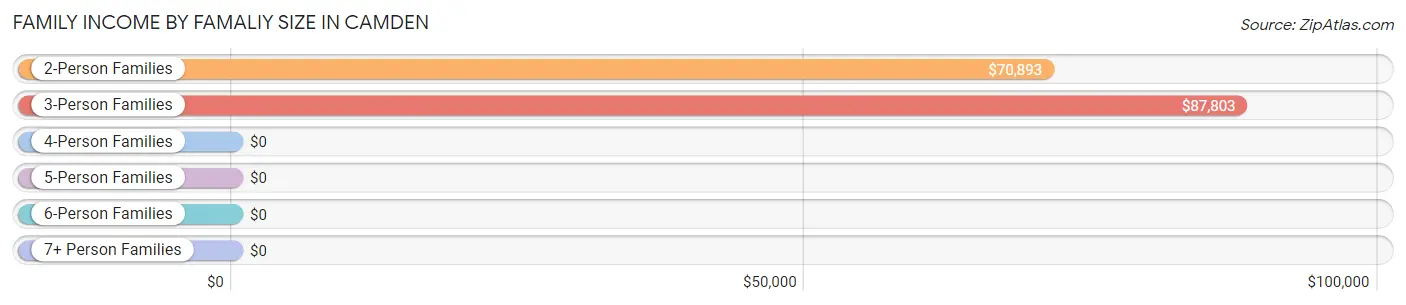
| Income Bracket | # Families | Median Income |
| 2-Person Families | 125 (38.8%) | $70,893 |
| 3-Person Families | 132 (41.0%) | $87,803 |
| 4-Person Families | 37 (11.5%) | $0 |
| 5-Person Families | 28 (8.7%) | $0 |
| 6-Person Families | 0 (0.0%) | $0 |
| 7+ Person Families | 0 (0.0%) | $0 |
| Total | 322 (100.0%) | $84,069 |
Family Income by Number of Earners in Camden
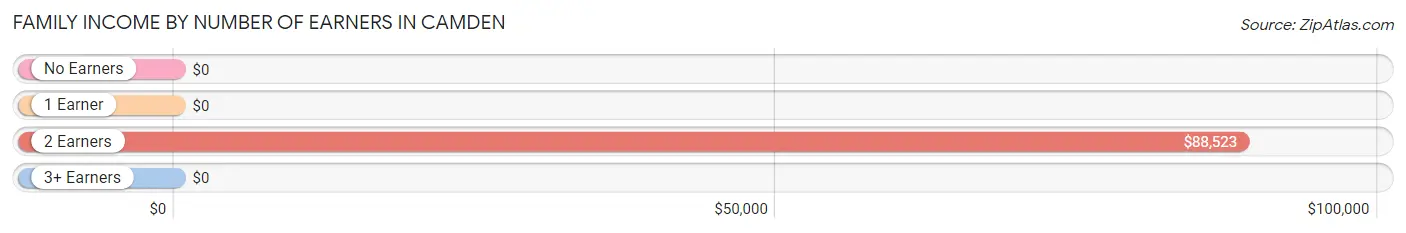
| Number of Earners | # Families | Median Income |
| No Earners | 24 (7.4%) | $0 |
| 1 Earner | 101 (31.4%) | $0 |
| 2 Earners | 169 (52.5%) | $88,523 |
| 3+ Earners | 28 (8.7%) | $0 |
| Total | 322 (100.0%) | $84,069 |
Household Income in Camden
Household Income Brackets in Camden
With 96 households falling in the category, the $75,000 to $99,999 income range is the most frequent in Camden, accounting for 24.7% of all households.
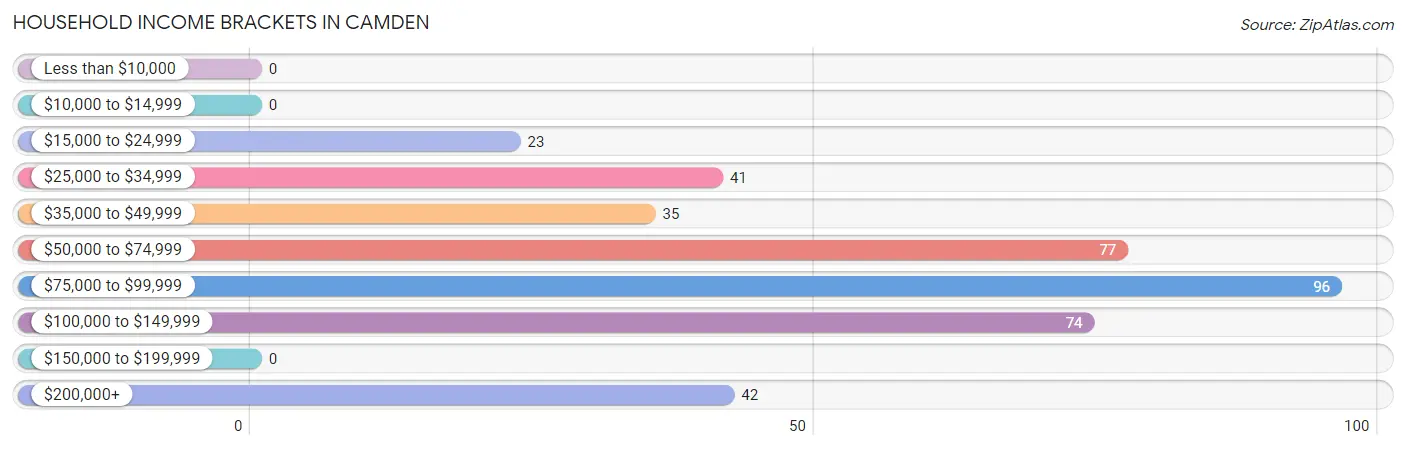
| Income Bracket | # Households | % Households |
| Less than $10,000 | 0 | 0.0% |
| $10,000 to $14,999 | 0 | 0.0% |
| $15,000 to $24,999 | 23 | 5.9% |
| $25,000 to $34,999 | 41 | 10.6% |
| $35,000 to $49,999 | 35 | 9.0% |
| $50,000 to $74,999 | 77 | 19.8% |
| $75,000 to $99,999 | 96 | 24.7% |
| $100,000 to $149,999 | 74 | 19.1% |
| $150,000 to $199,999 | 0 | 0.0% |
| $200,000+ | 42 | 10.8% |
Household Income by Householder Age in Camden
The median household income in Camden is $82,794, with the highest median household income of $86,250 found in the 45 to 64 years age bracket for the primary householder. A total of 242 households (62.4%) fall into this category.
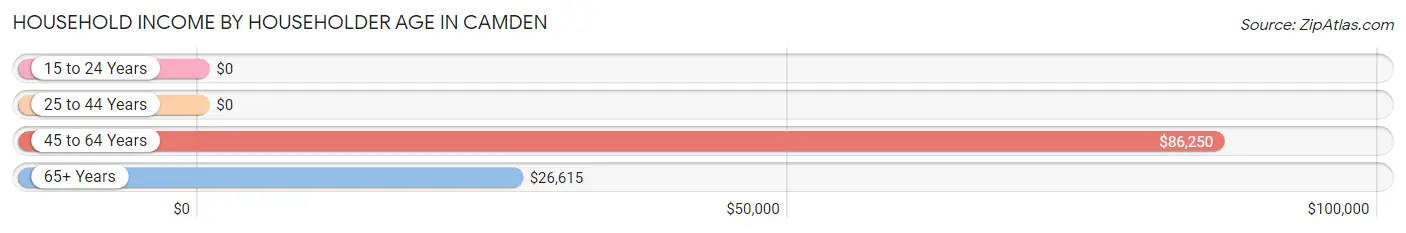
| Income Bracket | # Households | Median Income |
| 15 to 24 Years | 0 (0.0%) | $0 |
| 25 to 44 Years | 113 (29.1%) | $0 |
| 45 to 64 Years | 242 (62.4%) | $86,250 |
| 65+ Years | 33 (8.5%) | $26,615 |
| Total | 388 (100.0%) | $82,794 |
Poverty in Camden
Income Below Poverty by Sex and Age in Camden
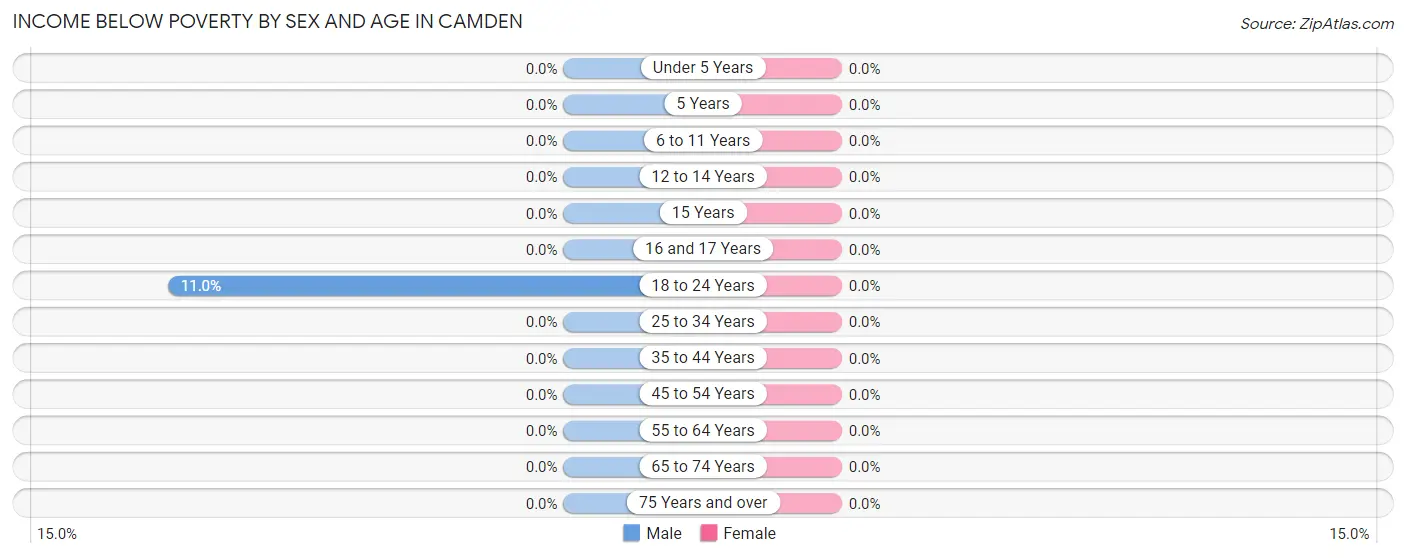
| Age Bracket | Male | Female |
| Under 5 Years | 0 (0.0%) | 0 (0.0%) |
| 5 Years | 0 (0.0%) | 0 (0.0%) |
| 6 to 11 Years | 0 (0.0%) | 0 (0.0%) |
| 12 to 14 Years | 0 (0.0%) | 0 (0.0%) |
| 15 Years | 0 (0.0%) | 0 (0.0%) |
| 16 and 17 Years | 0 (0.0%) | 0 (0.0%) |
| 18 to 24 Years | 12 (11.0%) | 0 (0.0%) |
| 25 to 34 Years | 0 (0.0%) | 0 (0.0%) |
| 35 to 44 Years | 0 (0.0%) | 0 (0.0%) |
| 45 to 54 Years | 0 (0.0%) | 0 (0.0%) |
| 55 to 64 Years | 0 (0.0%) | 0 (0.0%) |
| 65 to 74 Years | 0 (0.0%) | 0 (0.0%) |
| 75 Years and over | 0 (0.0%) | 0 (0.0%) |
| Total | 12 (2.2%) | 0 (0.0%) |
Income Above Poverty by Sex and Age in Camden
According to the poverty statistics in Camden, males aged under 5 years and females aged 5 years are the age groups that are most secure financially, with 100.0% of males and 100.0% of females in these age groups living above the poverty line.
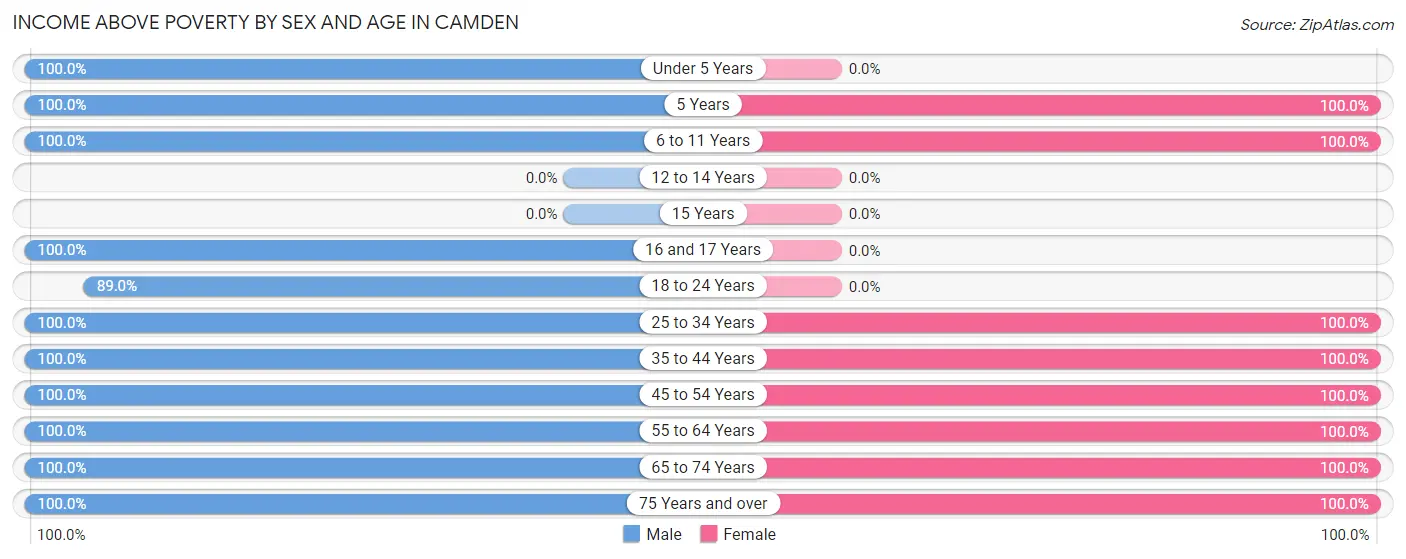
| Age Bracket | Male | Female |
| Under 5 Years | 5 (100.0%) | 0 (0.0%) |
| 5 Years | 16 (100.0%) | 33 (100.0%) |
| 6 to 11 Years | 83 (100.0%) | 41 (100.0%) |
| 12 to 14 Years | 0 (0.0%) | 0 (0.0%) |
| 15 Years | 0 (0.0%) | 0 (0.0%) |
| 16 and 17 Years | 28 (100.0%) | 0 (0.0%) |
| 18 to 24 Years | 97 (89.0%) | 0 (0.0%) |
| 25 to 34 Years | 41 (100.0%) | 35 (100.0%) |
| 35 to 44 Years | 65 (100.0%) | 78 (100.0%) |
| 45 to 54 Years | 99 (100.0%) | 141 (100.0%) |
| 55 to 64 Years | 77 (100.0%) | 44 (100.0%) |
| 65 to 74 Years | 8 (100.0%) | 24 (100.0%) |
| 75 Years and over | 24 (100.0%) | 9 (100.0%) |
| Total | 543 (97.8%) | 405 (100.0%) |
Income Below Poverty Among Married-Couple Families in Camden
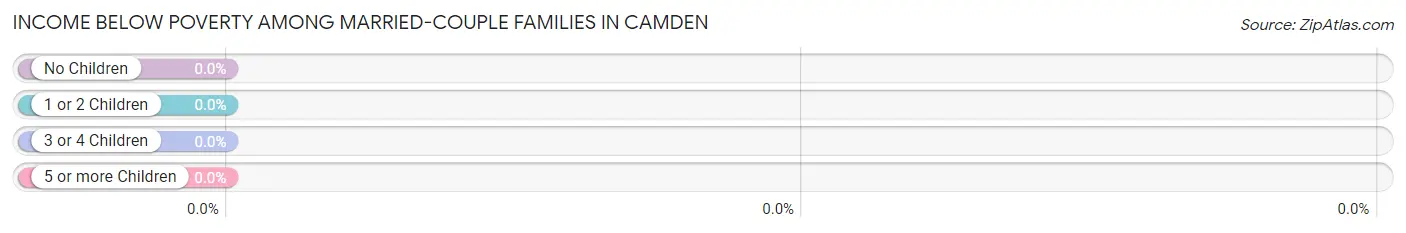
| Children | Above Poverty | Below Poverty |
| No Children | 132 (100.0%) | 0 (0.0%) |
| 1 or 2 Children | 108 (100.0%) | 0 (0.0%) |
| 3 or 4 Children | 28 (100.0%) | 0 (0.0%) |
| 5 or more Children | 0 (0.0%) | 0 (0.0%) |
| Total | 268 (100.0%) | 0 (0.0%) |
Income Below Poverty Among Single-Parent Households in Camden
| Children | Single Father | Single Mother |
| No Children | 0 (0.0%) | 0 (0.0%) |
| 1 or 2 Children | 0 (0.0%) | 0 (0.0%) |
| 3 or 4 Children | 0 (0.0%) | 0 (0.0%) |
| 5 or more Children | 0 (0.0%) | 0 (0.0%) |
| Total | 0 (0.0%) | 0 (0.0%) |
Income Below Poverty Among Married-Couple vs Single-Parent Households in Camden
| Children | Married-Couple Families | Single-Parent Households |
| No Children | 0 (0.0%) | 0 (0.0%) |
| 1 or 2 Children | 0 (0.0%) | 0 (0.0%) |
| 3 or 4 Children | 0 (0.0%) | 0 (0.0%) |
| 5 or more Children | 0 (0.0%) | 0 (0.0%) |
| Total | 0 (0.0%) | 0 (0.0%) |
Race in Camden
The most populous races in Camden are White / Caucasian (772 | 80.4%), Black / African American (132 | 13.8%), and Asian (44 | 4.6%).
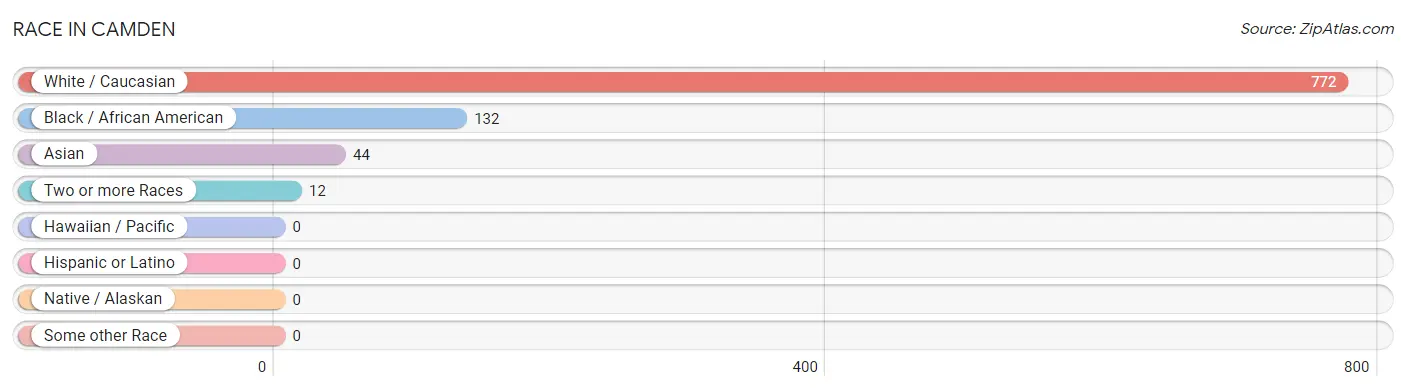
| Race | # Population | % Population |
| Asian | 44 | 4.6% |
| Black / African American | 132 | 13.8% |
| Hawaiian / Pacific | 0 | 0.0% |
| Hispanic or Latino | 0 | 0.0% |
| Native / Alaskan | 0 | 0.0% |
| White / Caucasian | 772 | 80.4% |
| Two or more Races | 12 | 1.3% |
| Some other Race | 0 | 0.0% |
| Total | 960 | 100.0% |
Ancestry in Camden
The most populous ancestries reported in Camden are German (240 | 25.0%), English (168 | 17.5%), Irish (121 | 12.6%), Scotch-Irish (115 | 12.0%), and American (48 | 5.0%), together accounting for 72.1% of all Camden residents.
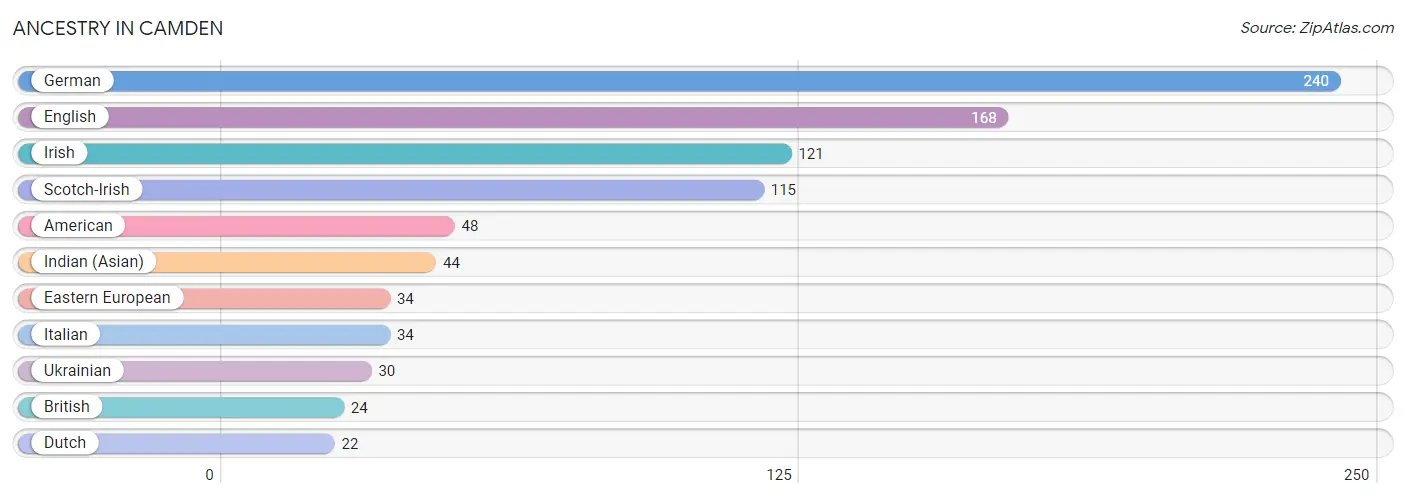
| Ancestry | # Population | % Population |
| American | 48 | 5.0% |
| British | 24 | 2.5% |
| Dutch | 22 | 2.3% |
| Eastern European | 34 | 3.5% |
| English | 168 | 17.5% |
| German | 240 | 25.0% |
| Indian (Asian) | 44 | 4.6% |
| Irish | 121 | 12.6% |
| Italian | 34 | 3.5% |
| Scotch-Irish | 115 | 12.0% |
| Ukrainian | 30 | 3.1% | View All 11 Rows |
Immigrants in Camden
The most numerous immigrant groups reported in Camden came from Asia (23 | 2.4%), India (16 | 1.7%), South Central Asia (16 | 1.7%), Philippines (7 | 0.7%), and South Eastern Asia (7 | 0.7%), together accounting for 7.2% of all Camden residents.
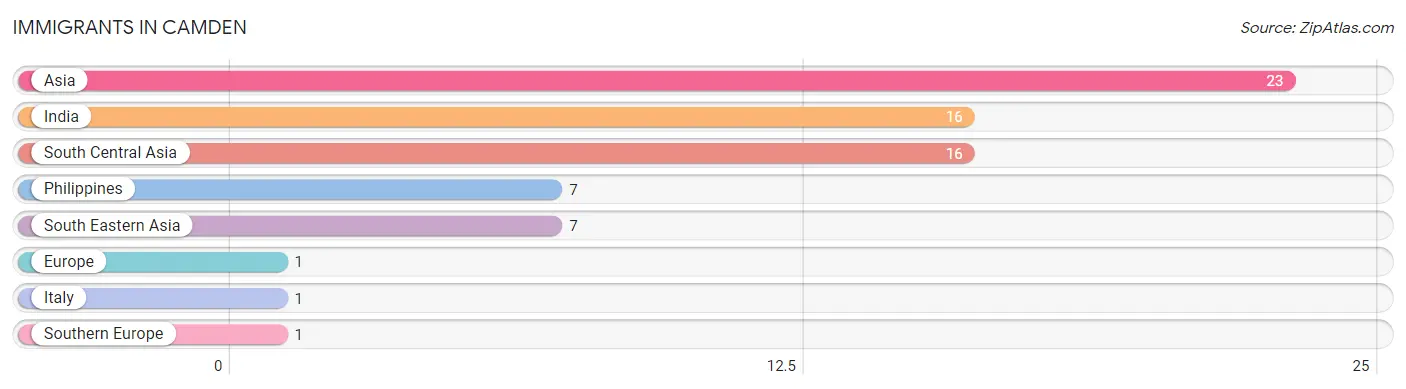
| Immigration Origin | # Population | % Population |
| Asia | 23 | 2.4% |
| Europe | 1 | 0.1% |
| India | 16 | 1.7% |
| Italy | 1 | 0.1% |
| Philippines | 7 | 0.7% |
| South Central Asia | 16 | 1.7% |
| South Eastern Asia | 7 | 0.7% |
| Southern Europe | 1 | 0.1% | View All 8 Rows |
Sex and Age in Camden
Sex and Age in Camden
The most populous age groups in Camden are 15 to 19 Years (98 | 17.7%) for men and 45 to 49 Years (90 | 22.2%) for women.
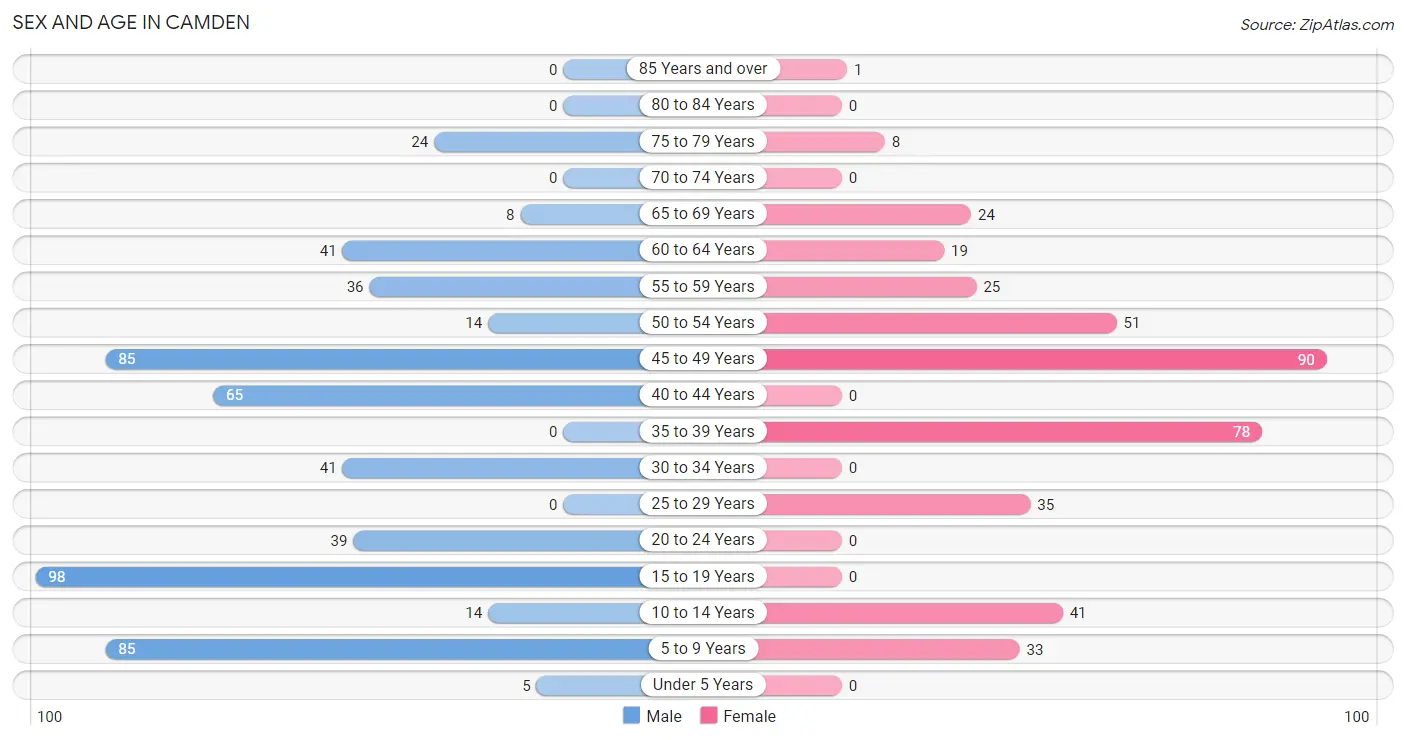
| Age Bracket | Male | Female |
| Under 5 Years | 5 (0.9%) | 0 (0.0%) |
| 5 to 9 Years | 85 (15.3%) | 33 (8.2%) |
| 10 to 14 Years | 14 (2.5%) | 41 (10.1%) |
| 15 to 19 Years | 98 (17.7%) | 0 (0.0%) |
| 20 to 24 Years | 39 (7.0%) | 0 (0.0%) |
| 25 to 29 Years | 0 (0.0%) | 35 (8.6%) |
| 30 to 34 Years | 41 (7.4%) | 0 (0.0%) |
| 35 to 39 Years | 0 (0.0%) | 78 (19.3%) |
| 40 to 44 Years | 65 (11.7%) | 0 (0.0%) |
| 45 to 49 Years | 85 (15.3%) | 90 (22.2%) |
| 50 to 54 Years | 14 (2.5%) | 51 (12.6%) |
| 55 to 59 Years | 36 (6.5%) | 25 (6.2%) |
| 60 to 64 Years | 41 (7.4%) | 19 (4.7%) |
| 65 to 69 Years | 8 (1.4%) | 24 (5.9%) |
| 70 to 74 Years | 0 (0.0%) | 0 (0.0%) |
| 75 to 79 Years | 24 (4.3%) | 8 (2.0%) |
| 80 to 84 Years | 0 (0.0%) | 0 (0.0%) |
| 85 Years and over | 0 (0.0%) | 1 (0.3%) |
| Total | 555 (100.0%) | 405 (100.0%) |
Families and Households in Camden
Median Family Size in Camden
The median family size in Camden is 2.71 persons per family, with single female/mother families (40 | 12.4%) accounting for the largest median family size of 2.9 persons per family. On the other hand, single male/father families (14 | 4.3%) represent the smallest median family size with 1.71 persons per family.
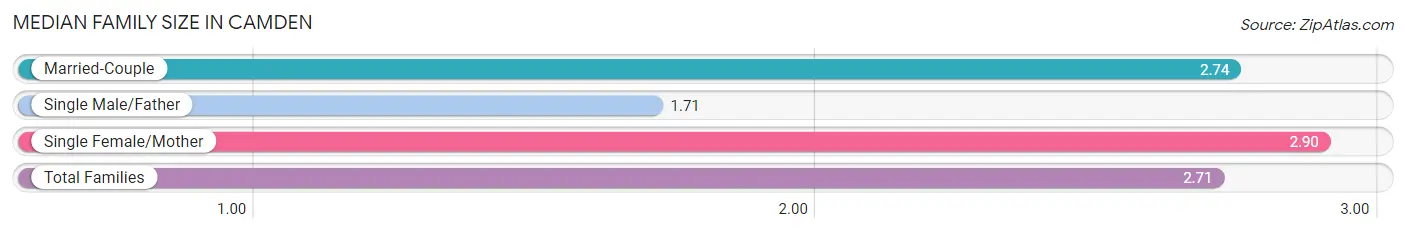
| Family Type | # Families | Family Size |
| Married-Couple | 268 (83.2%) | 2.74 |
| Single Male/Father | 14 (4.3%) | 1.71 |
| Single Female/Mother | 40 (12.4%) | 2.90 |
| Total Families | 322 (100.0%) | 2.71 |
Median Household Size in Camden
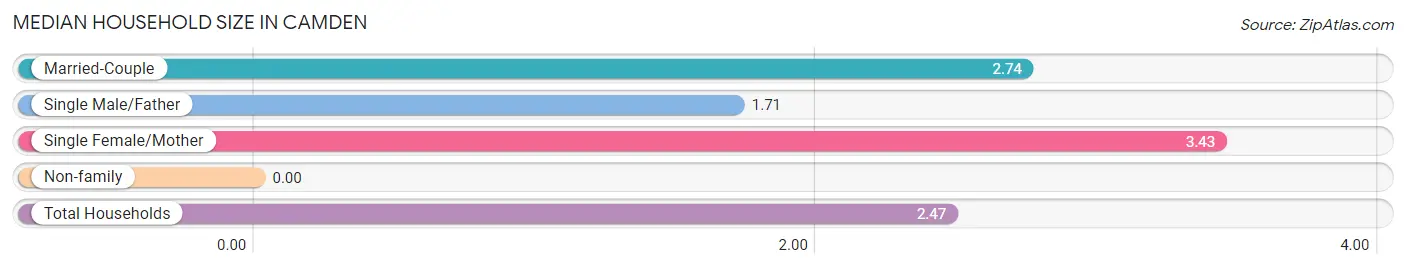
| Household Type | # Households | Household Size |
| Married-Couple | 268 (69.1%) | 2.74 |
| Single Male/Father | 14 (3.6%) | 1.71 |
| Single Female/Mother | 40 (10.3%) | 3.43 |
| Non-family | 66 (17.0%) | - |
| Total Households | 388 (100.0%) | 2.47 |
Household Size by Marriage Status in Camden
Out of a total of 388 households in Camden, 322 (83.0%) are family households, while 66 (17.0%) are nonfamily households. The most numerous type of family households are 3-person households, comprising 132, and the most common type of nonfamily households are 1-person households, comprising 66.
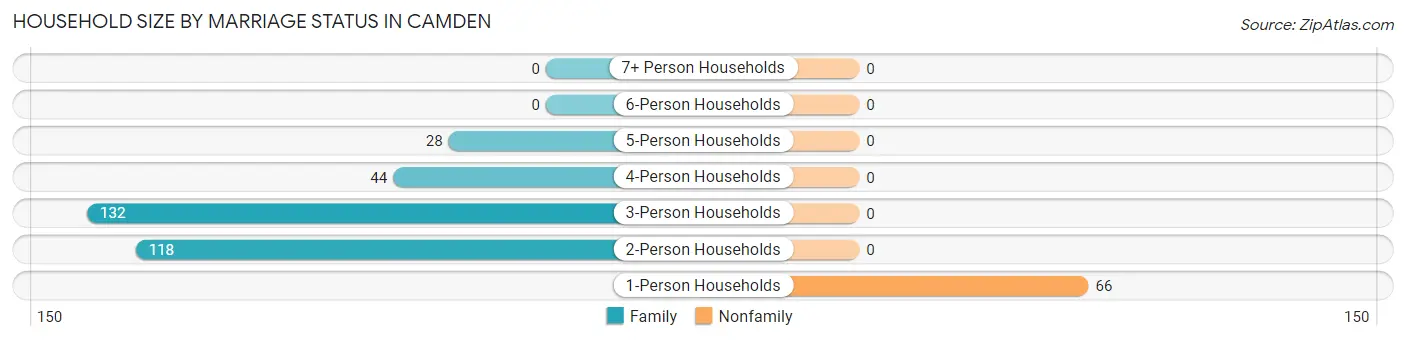
| Household Size | Family Households | Nonfamily Households |
| 1-Person Households | - | 66 (17.0%) |
| 2-Person Households | 118 (30.4%) | 0 (0.0%) |
| 3-Person Households | 132 (34.0%) | 0 (0.0%) |
| 4-Person Households | 44 (11.3%) | 0 (0.0%) |
| 5-Person Households | 28 (7.2%) | 0 (0.0%) |
| 6-Person Households | 0 (0.0%) | 0 (0.0%) |
| 7+ Person Households | 0 (0.0%) | 0 (0.0%) |
| Total | 322 (83.0%) | 66 (17.0%) |
Female Fertility in Camden
Fertility by Age in Camden
| Age Bracket | Women with Births | Births / 1,000 Women |
| 15 to 19 years | 0 (0.0%) | 0.0 |
| 20 to 34 years | 0 (0.0%) | 0.0 |
| 35 to 50 years | 0 (0.0%) | 0.0 |
| Total | 0 (0.0%) | 0.0 |
Fertility by Age by Marriage Status in Camden
| Age Bracket | Married | Unmarried |
| 15 to 19 years | 0 (0.0%) | 0 (0.0%) |
| 20 to 34 years | 0 (0.0%) | 0 (0.0%) |
| 35 to 50 years | 0 (0.0%) | 0 (0.0%) |
| Total | 0 (0.0%) | 0 (0.0%) |
Fertility by Education in Camden
| Educational Attainment | Women with Births | Births / 1,000 Women |
| Less than High School | 0 (0.0%) | 0.0 |
| High School Diploma | 0 (0.0%) | 0.0 |
| College or Associate's Degree | 0 (0.0%) | 0.0 |
| Bachelor's Degree | 0 (0.0%) | 0.0 |
| Graduate Degree | 0 (0.0%) | 0.0 |
| Total | 0 (0.0%) | 0.0 |
Fertility by Education by Marriage Status in Camden
| Educational Attainment | Married | Unmarried |
| Less than High School | 0 (0.0%) | 0 (0.0%) |
| High School Diploma | 0 (0.0%) | 0 (0.0%) |
| College or Associate's Degree | 0 (0.0%) | 0 (0.0%) |
| Bachelor's Degree | 0 (0.0%) | 0 (0.0%) |
| Graduate Degree | 0 (0.0%) | 0 (0.0%) |
| Total | 0 (0.0%) | 0 (0.0%) |
Employment Characteristics in Camden
Employment by Class of Employer in Camden
Among the 553 employed individuals in Camden, private company employees (212 | 38.3%), state government employees (154 | 27.9%), and self-employed (incorporated) (88 | 15.9%) make up the most common classes of employment.
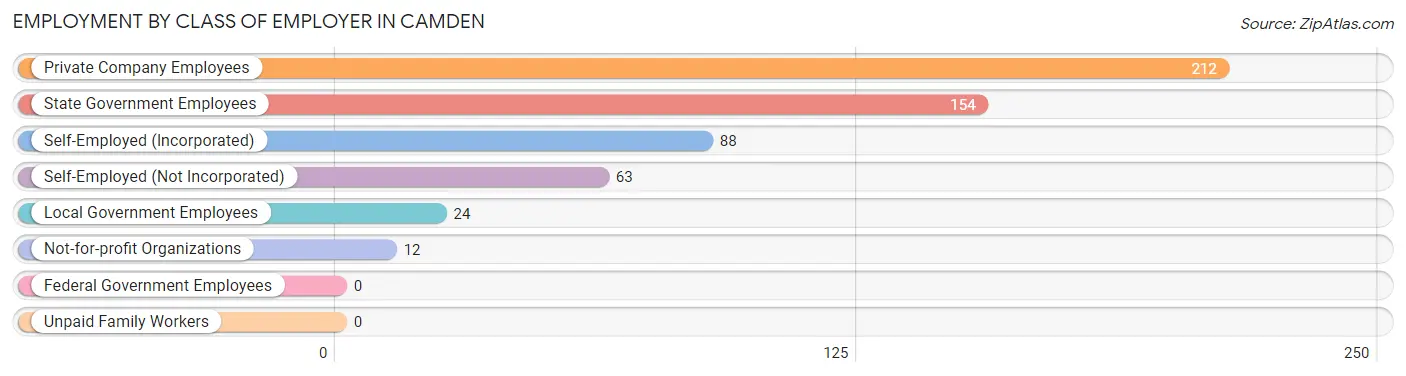
| Employer Class | # Employees | % Employees |
| Private Company Employees | 212 | 38.3% |
| Self-Employed (Incorporated) | 88 | 15.9% |
| Self-Employed (Not Incorporated) | 63 | 11.4% |
| Not-for-profit Organizations | 12 | 2.2% |
| Local Government Employees | 24 | 4.3% |
| State Government Employees | 154 | 27.9% |
| Federal Government Employees | 0 | 0.0% |
| Unpaid Family Workers | 0 | 0.0% |
| Total | 553 | 100.0% |
Employment Status by Age in Camden
According to the labor force statistics for Camden, out of the total population over 16 years of age (782), 76.0% or 594 individuals are in the labor force, with 6.9% or 41 of them unemployed. The age group with the highest labor force participation rate is 20 to 24 years, with 100.0% or 39 individuals in the labor force. Within the labor force, the 30 to 34 years age range has the highest percentage of unemployed individuals, with 100.0% or 41 of them being unemployed.
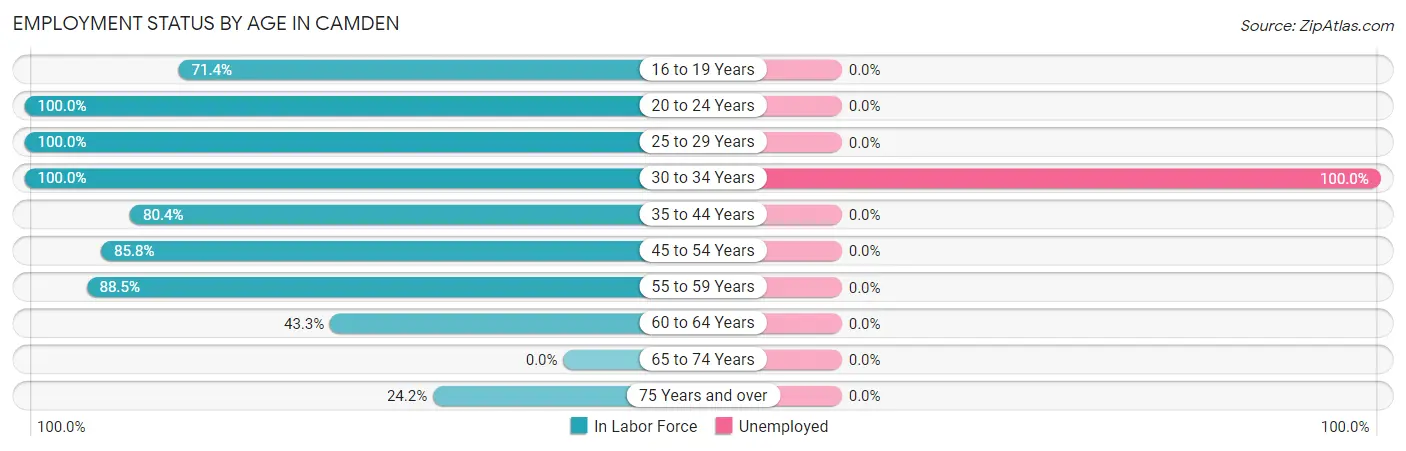
| Age Bracket | In Labor Force | Unemployed |
| 16 to 19 Years | 70 (71.4%) | 0 (0.0%) |
| 20 to 24 Years | 39 (100.0%) | 0 (0.0%) |
| 25 to 29 Years | 35 (100.0%) | 0 (0.0%) |
| 30 to 34 Years | 41 (100.0%) | 41 (100.0%) |
| 35 to 44 Years | 115 (80.4%) | 0 (0.0%) |
| 45 to 54 Years | 206 (85.8%) | 0 (0.0%) |
| 55 to 59 Years | 54 (88.5%) | 0 (0.0%) |
| 60 to 64 Years | 26 (43.3%) | 0 (0.0%) |
| 65 to 74 Years | 0 (0.0%) | 0 (0.0%) |
| 75 Years and over | 8 (24.2%) | 0 (0.0%) |
| Total | 594 (76.0%) | 41 (6.9%) |
Employment Status by Educational Attainment in Camden
According to labor force statistics for Camden, 82.2% of individuals (477) out of the total population between 25 and 64 years of age (580) are in the labor force, with 8.6% or 41 of them being unemployed. The group with the highest labor force participation rate are those with the educational attainment of bachelor's degree or higher, with 100.0% or 270 individuals in the labor force. Within the labor force, individuals with college / associate degree education have the highest percentage of unemployment, with 26.1% or 41 of them being unemployed.
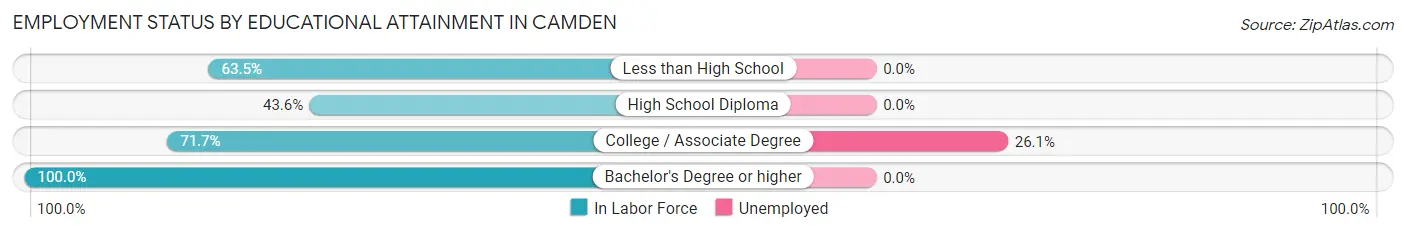
| Educational Attainment | In Labor Force | Unemployed |
| Less than High School | 33 (63.5%) | 0 (0.0%) |
| High School Diploma | 17 (43.6%) | 0 (0.0%) |
| College / Associate Degree | 157 (71.7%) | 57 (26.1%) |
| Bachelor's Degree or higher | 270 (100.0%) | 0 (0.0%) |
| Total | 477 (82.2%) | 50 (8.6%) |
Employment Occupations by Sex in Camden
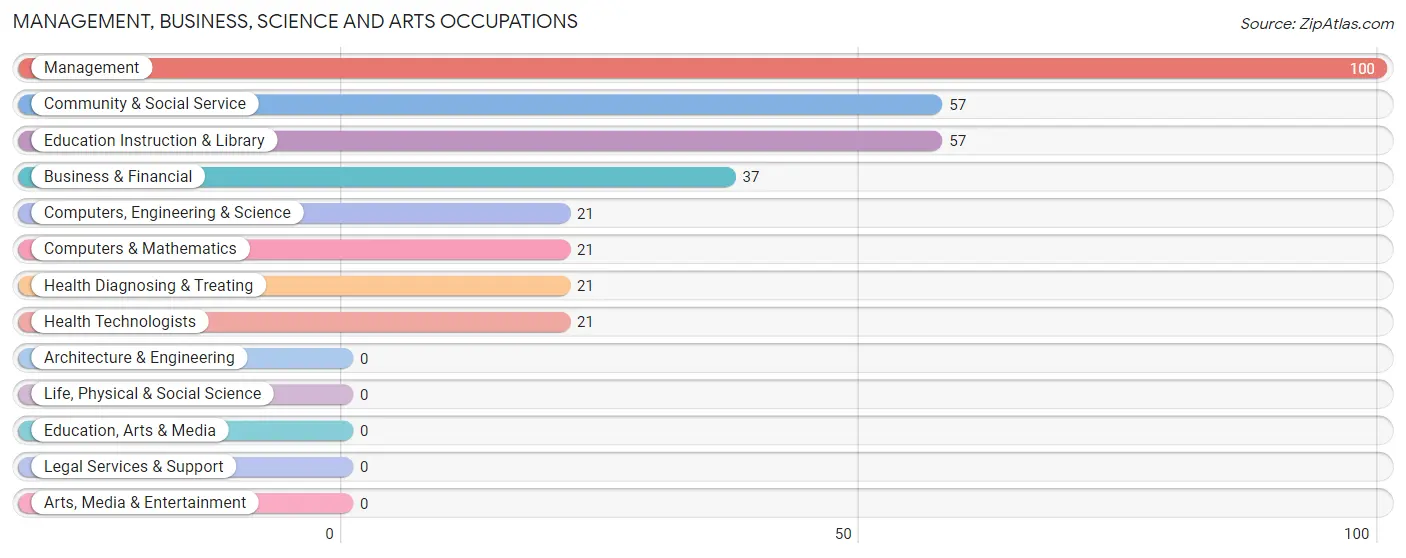
Management, Business, Science and Arts Occupations
The most common Management, Business, Science and Arts occupations in Camden are Management (100 | 18.1%), Community & Social Service (57 | 10.3%), Education Instruction & Library (57 | 10.3%), Business & Financial (37 | 6.7%), and Computers, Engineering & Science (21 | 3.8%).
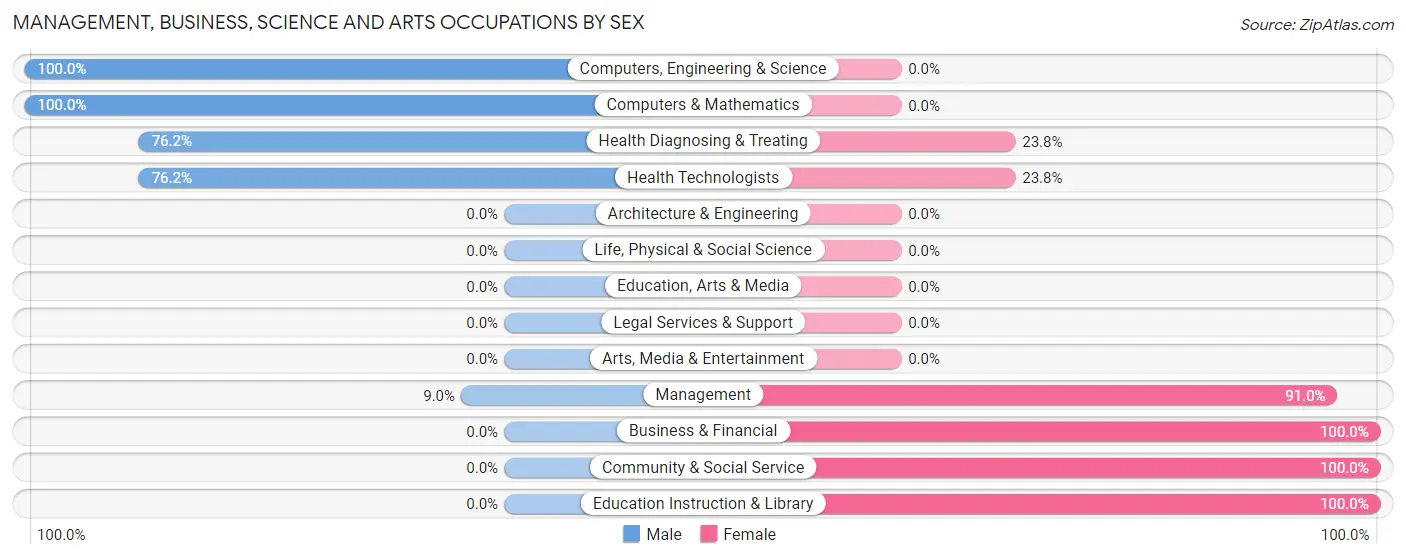
Management, Business, Science and Arts Occupations by Sex
Within the Management, Business, Science and Arts occupations in Camden, the most male-oriented occupations are Computers, Engineering & Science (100.0%), Computers & Mathematics (100.0%), and Health Diagnosing & Treating (76.2%), while the most female-oriented occupations are Business & Financial (100.0%), Community & Social Service (100.0%), and Education Instruction & Library (100.0%).
| Occupation | Male | Female |
| Management | 9 (9.0%) | 91 (91.0%) |
| Business & Financial | 0 (0.0%) | 37 (100.0%) |
| Computers, Engineering & Science | 21 (100.0%) | 0 (0.0%) |
| Computers & Mathematics | 21 (100.0%) | 0 (0.0%) |
| Architecture & Engineering | 0 (0.0%) | 0 (0.0%) |
| Life, Physical & Social Science | 0 (0.0%) | 0 (0.0%) |
| Community & Social Service | 0 (0.0%) | 57 (100.0%) |
| Education, Arts & Media | 0 (0.0%) | 0 (0.0%) |
| Legal Services & Support | 0 (0.0%) | 0 (0.0%) |
| Education Instruction & Library | 0 (0.0%) | 57 (100.0%) |
| Arts, Media & Entertainment | 0 (0.0%) | 0 (0.0%) |
| Health Diagnosing & Treating | 16 (76.2%) | 5 (23.8%) |
| Health Technologists | 16 (76.2%) | 5 (23.8%) |
| Total (Category) | 46 (19.5%) | 190 (80.5%) |
| Total (Overall) | 294 (53.2%) | 259 (46.8%) |
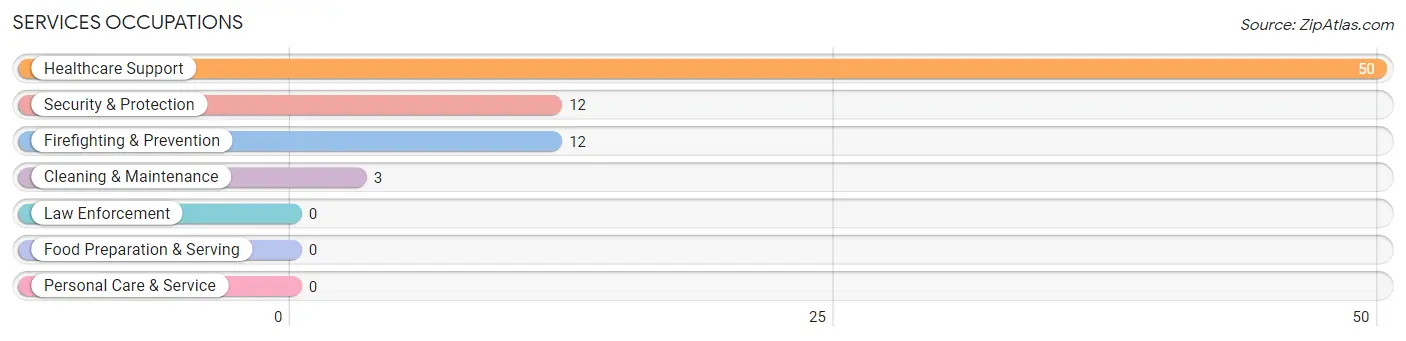
Services Occupations
The most common Services occupations in Camden are Healthcare Support (50 | 9.0%), Security & Protection (12 | 2.2%), Firefighting & Prevention (12 | 2.2%), and Cleaning & Maintenance (3 | 0.5%).
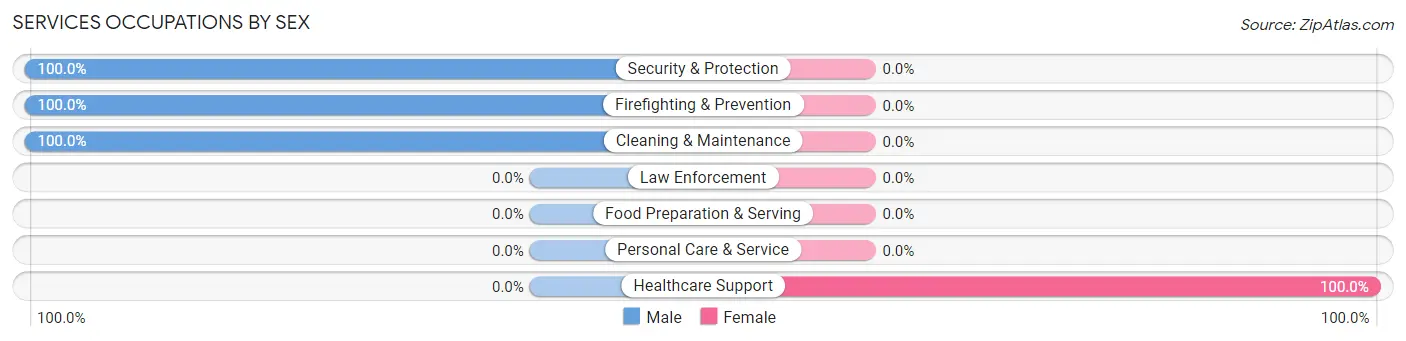
Services Occupations by Sex
| Occupation | Male | Female |
| Healthcare Support | 0 (0.0%) | 50 (100.0%) |
| Security & Protection | 12 (100.0%) | 0 (0.0%) |
| Firefighting & Prevention | 12 (100.0%) | 0 (0.0%) |
| Law Enforcement | 0 (0.0%) | 0 (0.0%) |
| Food Preparation & Serving | 0 (0.0%) | 0 (0.0%) |
| Cleaning & Maintenance | 3 (100.0%) | 0 (0.0%) |
| Personal Care & Service | 0 (0.0%) | 0 (0.0%) |
| Total (Category) | 15 (23.1%) | 50 (76.9%) |
| Total (Overall) | 294 (53.2%) | 259 (46.8%) |
Sales and Office Occupations
The most common Sales and Office occupations in Camden are Sales & Related (111 | 20.1%), and Office & Administration (19 | 3.4%).
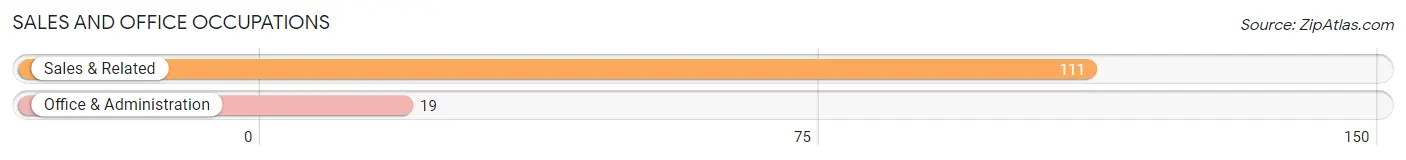
Sales and Office Occupations by Sex

| Occupation | Male | Female |
| Sales & Related | 111 (100.0%) | 0 (0.0%) |
| Office & Administration | 0 (0.0%) | 19 (100.0%) |
| Total (Category) | 111 (85.4%) | 19 (14.6%) |
| Total (Overall) | 294 (53.2%) | 259 (46.8%) |
Natural Resources, Construction and Maintenance Occupations
The most common Natural Resources, Construction and Maintenance occupations in Camden are , and Construction & Extraction (30 | 5.4%).
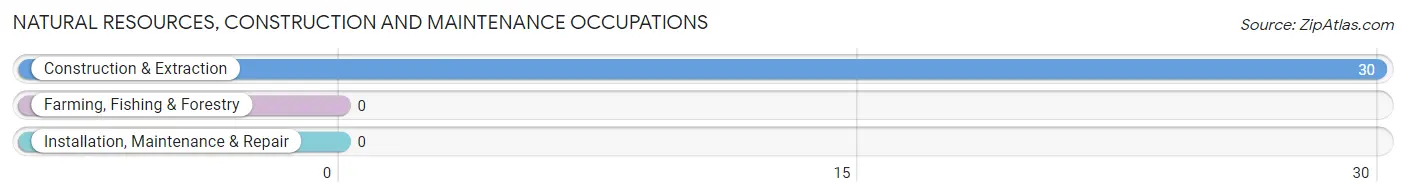
Natural Resources, Construction and Maintenance Occupations by Sex
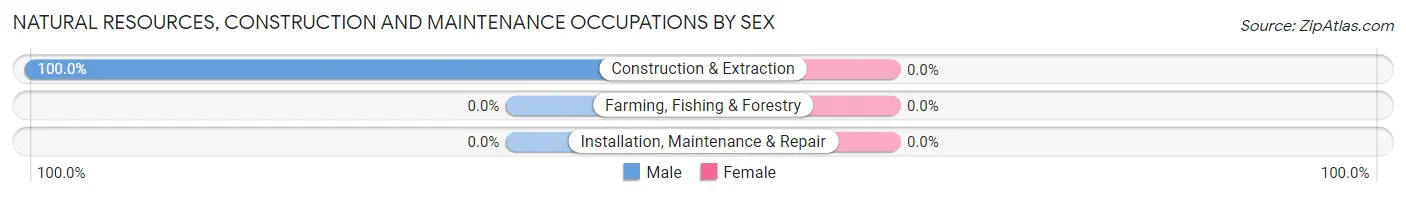
| Occupation | Male | Female |
| Farming, Fishing & Forestry | 0 (0.0%) | 0 (0.0%) |
| Construction & Extraction | 30 (100.0%) | 0 (0.0%) |
| Installation, Maintenance & Repair | 0 (0.0%) | 0 (0.0%) |
| Total (Category) | 30 (100.0%) | 0 (0.0%) |
| Total (Overall) | 294 (53.2%) | 259 (46.8%) |
Production, Transportation and Moving Occupations
The most common Production, Transportation and Moving occupations in Camden are Transportation (49 | 8.9%), Production (26 | 4.7%), and Material Moving (17 | 3.1%).
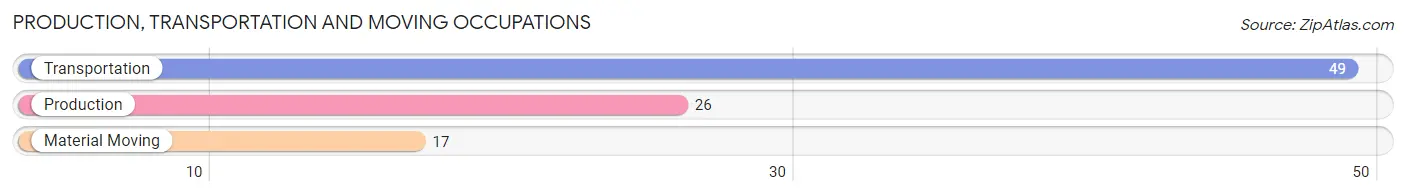
Production, Transportation and Moving Occupations by Sex
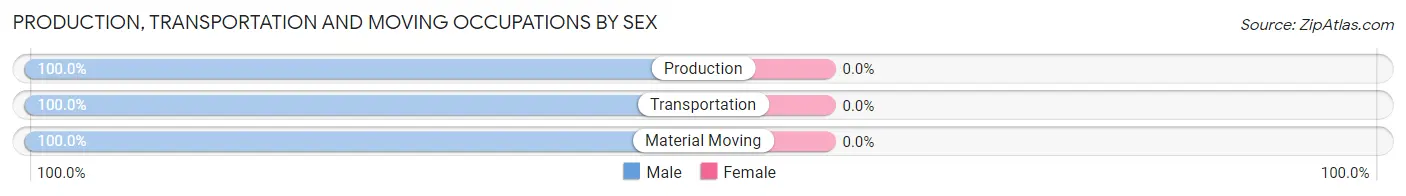
| Occupation | Male | Female |
| Production | 26 (100.0%) | 0 (0.0%) |
| Transportation | 49 (100.0%) | 0 (0.0%) |
| Material Moving | 17 (100.0%) | 0 (0.0%) |
| Total (Category) | 92 (100.0%) | 0 (0.0%) |
| Total (Overall) | 294 (53.2%) | 259 (46.8%) |
Employment Industries by Sex in Camden
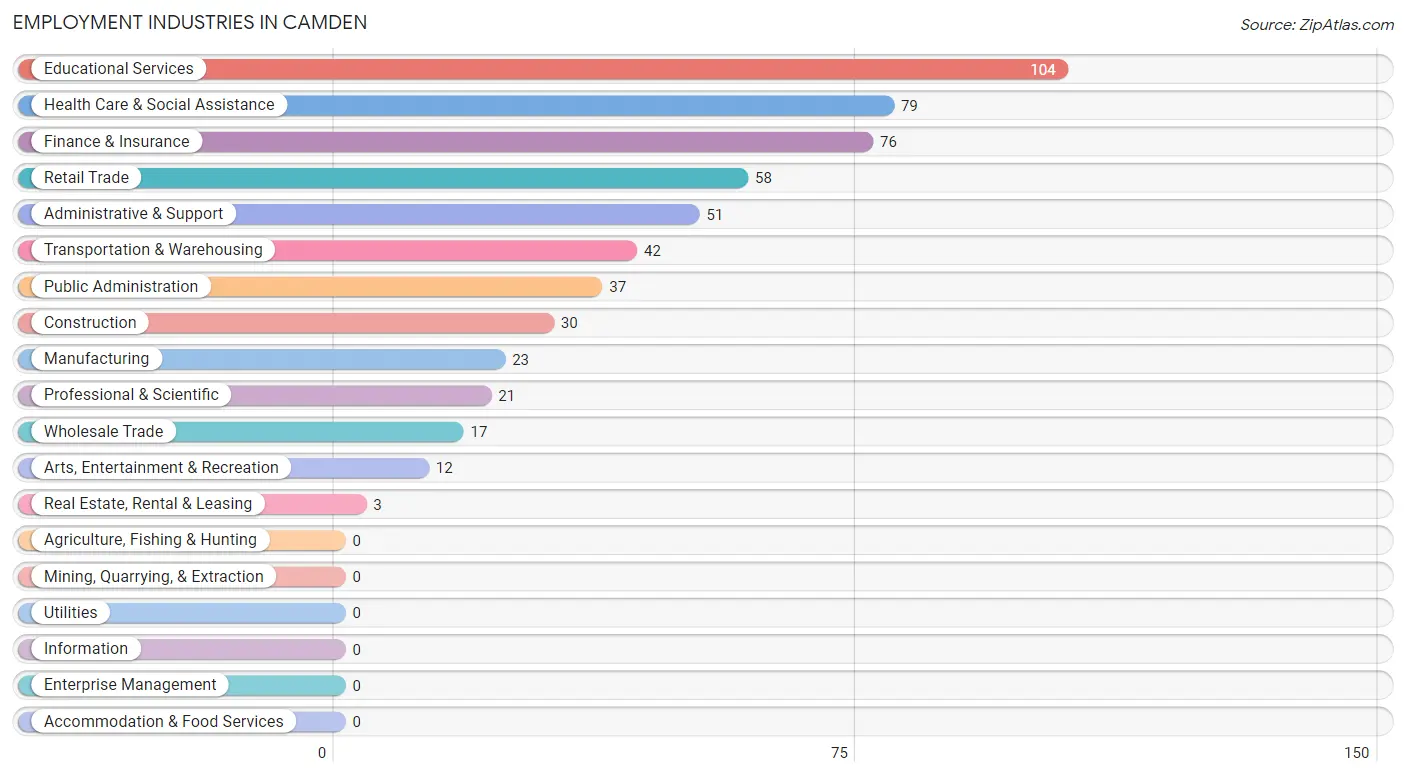
Employment Industries in Camden
The major employment industries in Camden include Educational Services (104 | 18.8%), Health Care & Social Assistance (79 | 14.3%), Finance & Insurance (76 | 13.7%), Retail Trade (58 | 10.5%), and Administrative & Support (51 | 9.2%).
Employment Industries by Sex in Camden
The Camden industries that see more men than women are Construction (100.0%), Manufacturing (100.0%), and Wholesale Trade (100.0%), whereas the industries that tend to have a higher number of women are Administrative & Support (100.0%), Public Administration (100.0%), and Educational Services (93.3%).
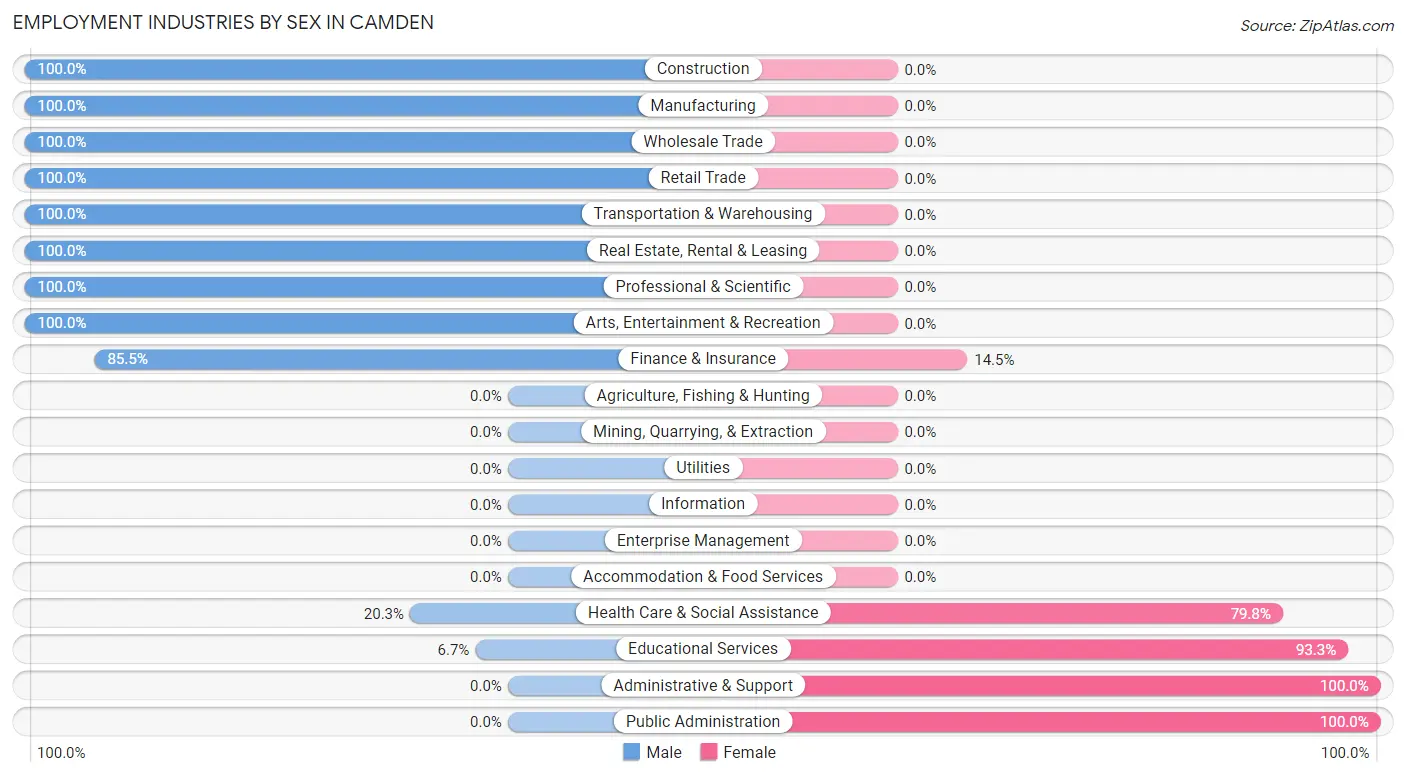
| Industry | Male | Female |
| Agriculture, Fishing & Hunting | 0 (0.0%) | 0 (0.0%) |
| Mining, Quarrying, & Extraction | 0 (0.0%) | 0 (0.0%) |
| Construction | 30 (100.0%) | 0 (0.0%) |
| Manufacturing | 23 (100.0%) | 0 (0.0%) |
| Wholesale Trade | 17 (100.0%) | 0 (0.0%) |
| Retail Trade | 58 (100.0%) | 0 (0.0%) |
| Transportation & Warehousing | 42 (100.0%) | 0 (0.0%) |
| Utilities | 0 (0.0%) | 0 (0.0%) |
| Information | 0 (0.0%) | 0 (0.0%) |
| Finance & Insurance | 65 (85.5%) | 11 (14.5%) |
| Real Estate, Rental & Leasing | 3 (100.0%) | 0 (0.0%) |
| Professional & Scientific | 21 (100.0%) | 0 (0.0%) |
| Enterprise Management | 0 (0.0%) | 0 (0.0%) |
| Administrative & Support | 0 (0.0%) | 51 (100.0%) |
| Educational Services | 7 (6.7%) | 97 (93.3%) |
| Health Care & Social Assistance | 16 (20.3%) | 63 (79.7%) |
| Arts, Entertainment & Recreation | 12 (100.0%) | 0 (0.0%) |
| Accommodation & Food Services | 0 (0.0%) | 0 (0.0%) |
| Public Administration | 0 (0.0%) | 37 (100.0%) |
| Total | 294 (53.2%) | 259 (46.8%) |
Education in Camden
School Enrollment in Camden
The most common levels of schooling among the 294 students in Camden are high school (86 | 29.2%), elementary school (69 | 23.5%), and middle school (55 | 18.7%).
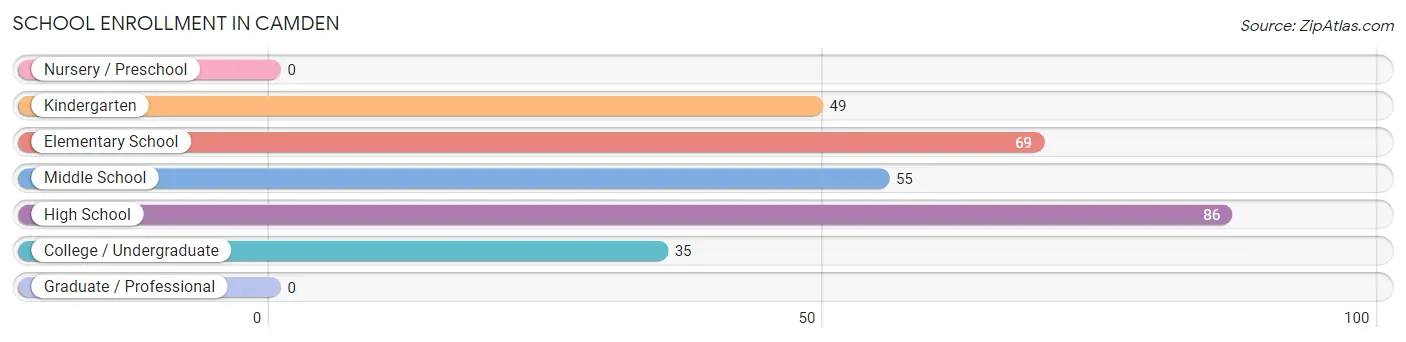
| School Level | # Students | % Students |
| Nursery / Preschool | 0 | 0.0% |
| Kindergarten | 49 | 16.7% |
| Elementary School | 69 | 23.5% |
| Middle School | 55 | 18.7% |
| High School | 86 | 29.2% |
| College / Undergraduate | 35 | 11.9% |
| Graduate / Professional | 0 | 0.0% |
| Total | 294 | 100.0% |
School Enrollment by Age by Funding Source in Camden
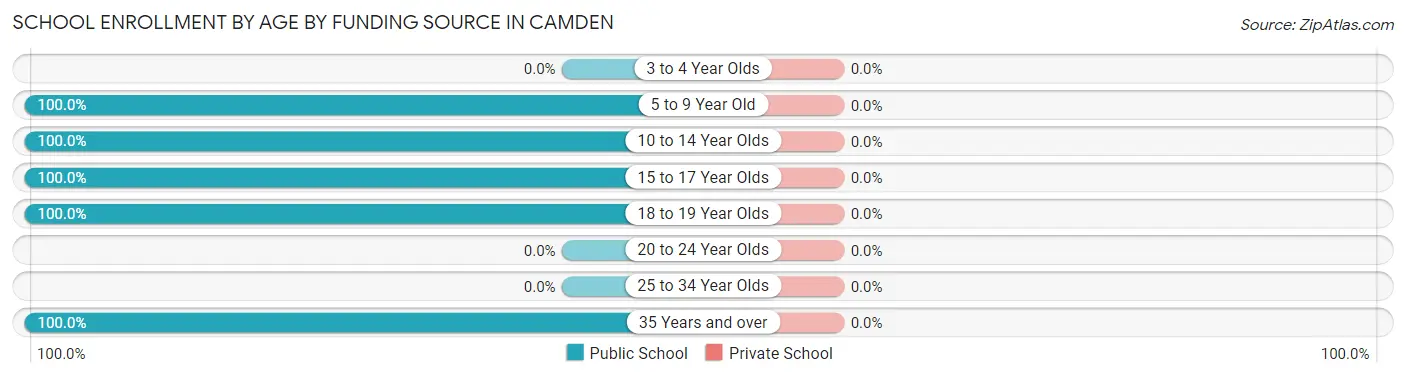
| Age Bracket | Public School | Private School |
| 3 to 4 Year Olds | 0 (0.0%) | 0 (0.0%) |
| 5 to 9 Year Old | 118 (100.0%) | 0 (0.0%) |
| 10 to 14 Year Olds | 55 (100.0%) | 0 (0.0%) |
| 15 to 17 Year Olds | 28 (100.0%) | 0 (0.0%) |
| 18 to 19 Year Olds | 58 (100.0%) | 0 (0.0%) |
| 20 to 24 Year Olds | 0 (0.0%) | 0 (0.0%) |
| 25 to 34 Year Olds | 0 (0.0%) | 0 (0.0%) |
| 35 Years and over | 35 (100.0%) | 0 (0.0%) |
| Total | 294 (100.0%) | 0 (0.0%) |
Educational Attainment by Field of Study in Camden
Education (99 | 36.7%), business (65 | 24.1%), literature & languages (50 | 18.5%), arts & humanities (33 | 12.2%), and bio, nature & agricultural (23 | 8.5%) are the most common fields of study among 270 individuals in Camden who have obtained a bachelor's degree or higher.
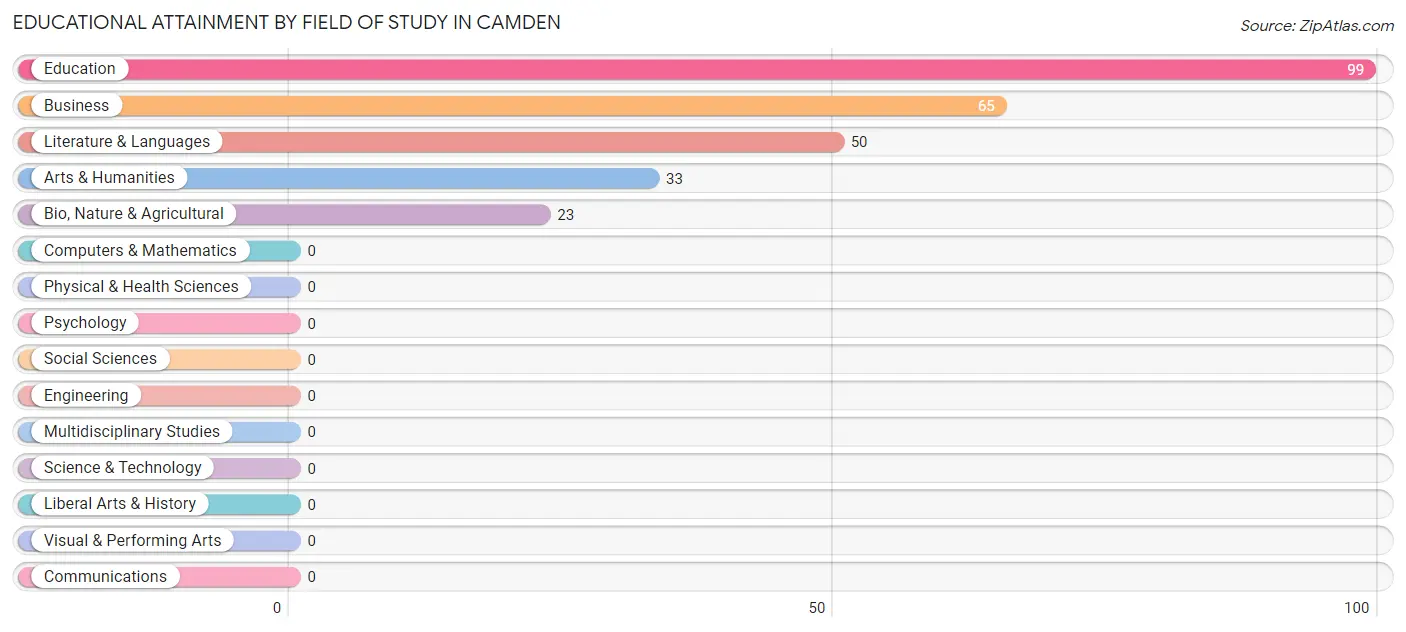
| Field of Study | # Graduates | % Graduates |
| Computers & Mathematics | 0 | 0.0% |
| Bio, Nature & Agricultural | 23 | 8.5% |
| Physical & Health Sciences | 0 | 0.0% |
| Psychology | 0 | 0.0% |
| Social Sciences | 0 | 0.0% |
| Engineering | 0 | 0.0% |
| Multidisciplinary Studies | 0 | 0.0% |
| Science & Technology | 0 | 0.0% |
| Business | 65 | 24.1% |
| Education | 99 | 36.7% |
| Literature & Languages | 50 | 18.5% |
| Liberal Arts & History | 0 | 0.0% |
| Visual & Performing Arts | 0 | 0.0% |
| Communications | 0 | 0.0% |
| Arts & Humanities | 33 | 12.2% |
| Total | 270 | 100.0% |
Transportation & Commute in Camden
Vehicle Availability by Sex in Camden
The most prevalent vehicle ownership categories in Camden are males with 2 vehicles (204, accounting for 69.4%) and females with 2 vehicles (88, making up 78.8%).
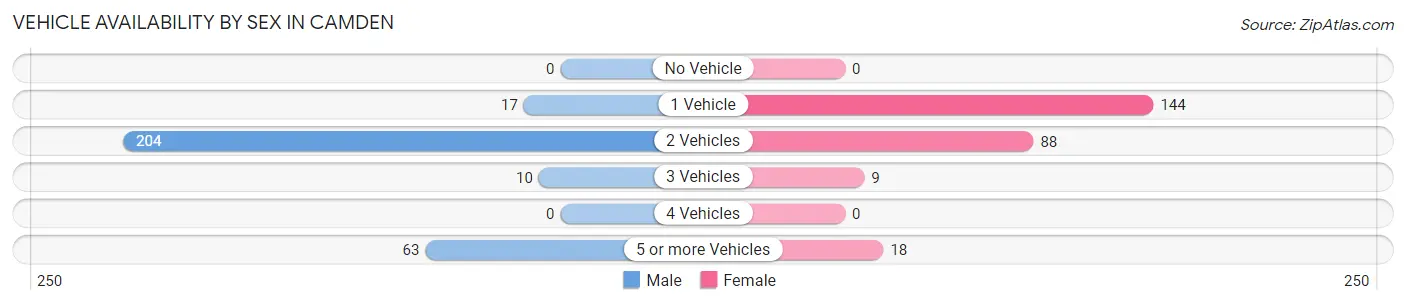
| Vehicles Available | Male | Female |
| No Vehicle | 0 (0.0%) | 0 (0.0%) |
| 1 Vehicle | 17 (5.8%) | 144 (55.6%) |
| 2 Vehicles | 204 (69.4%) | 88 (34.0%) |
| 3 Vehicles | 10 (3.4%) | 9 (3.5%) |
| 4 Vehicles | 0 (0.0%) | 0 (0.0%) |
| 5 or more Vehicles | 63 (21.4%) | 18 (7.0%) |
| Total | 294 (100.0%) | 259 (100.0%) |
Commute Time in Camden
The most frequently occuring commute durations in Camden are 10 to 14 minutes (106 commuters, 24.0%), 5 to 9 minutes (98 commuters, 22.2%), and 30 to 34 minutes (80 commuters, 18.1%).
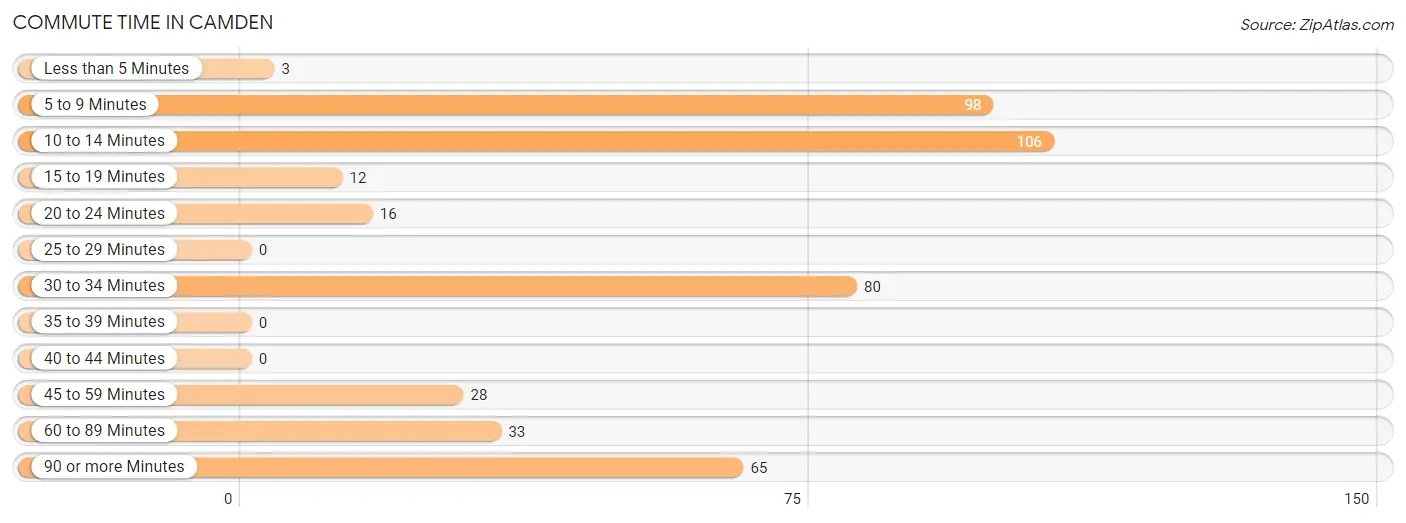
| Commute Time | # Commuters | % Commuters |
| Less than 5 Minutes | 3 | 0.7% |
| 5 to 9 Minutes | 98 | 22.2% |
| 10 to 14 Minutes | 106 | 24.0% |
| 15 to 19 Minutes | 12 | 2.7% |
| 20 to 24 Minutes | 16 | 3.6% |
| 25 to 29 Minutes | 0 | 0.0% |
| 30 to 34 Minutes | 80 | 18.1% |
| 35 to 39 Minutes | 0 | 0.0% |
| 40 to 44 Minutes | 0 | 0.0% |
| 45 to 59 Minutes | 28 | 6.4% |
| 60 to 89 Minutes | 33 | 7.5% |
| 90 or more Minutes | 65 | 14.7% |
Commute Time by Sex in Camden
The most common commute times in Camden are 90 or more minutes (65 commuters, 27.9%) for males and 5 to 9 minutes (88 commuters, 42.3%) for females.
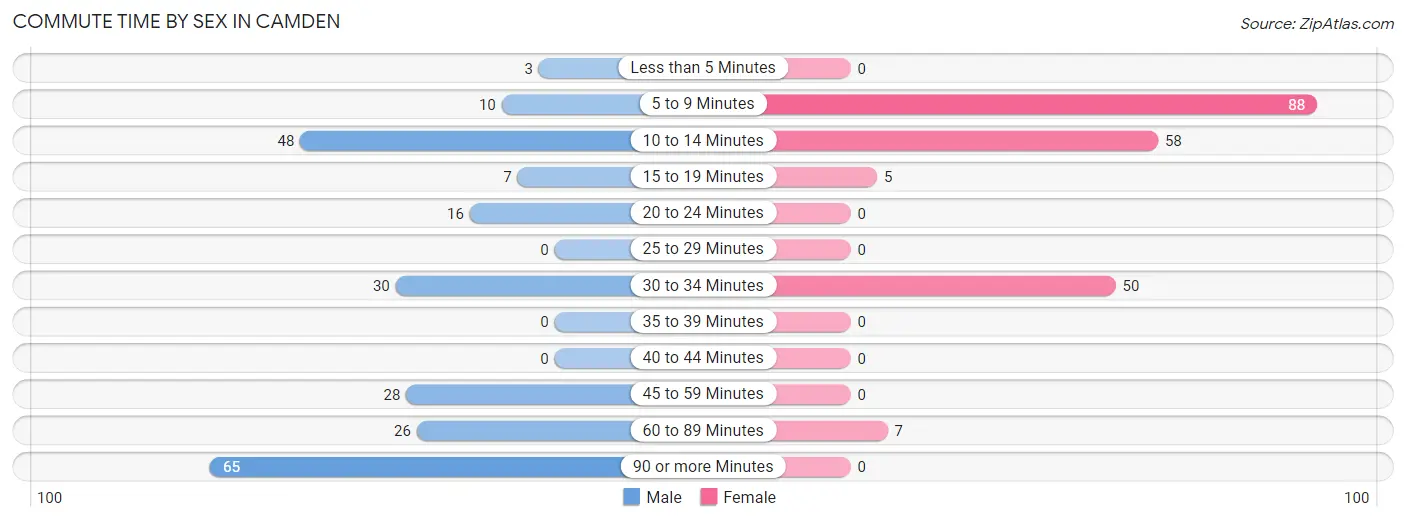
| Commute Time | Male | Female |
| Less than 5 Minutes | 3 (1.3%) | 0 (0.0%) |
| 5 to 9 Minutes | 10 (4.3%) | 88 (42.3%) |
| 10 to 14 Minutes | 48 (20.6%) | 58 (27.9%) |
| 15 to 19 Minutes | 7 (3.0%) | 5 (2.4%) |
| 20 to 24 Minutes | 16 (6.9%) | 0 (0.0%) |
| 25 to 29 Minutes | 0 (0.0%) | 0 (0.0%) |
| 30 to 34 Minutes | 30 (12.9%) | 50 (24.0%) |
| 35 to 39 Minutes | 0 (0.0%) | 0 (0.0%) |
| 40 to 44 Minutes | 0 (0.0%) | 0 (0.0%) |
| 45 to 59 Minutes | 28 (12.0%) | 0 (0.0%) |
| 60 to 89 Minutes | 26 (11.2%) | 7 (3.4%) |
| 90 or more Minutes | 65 (27.9%) | 0 (0.0%) |
Time of Departure to Work by Sex in Camden
The most frequent times of departure to work in Camden are 12:00 AM to 4:59 AM (65, 27.9%) for males and 6:30 AM to 6:59 AM (63, 30.3%) for females.
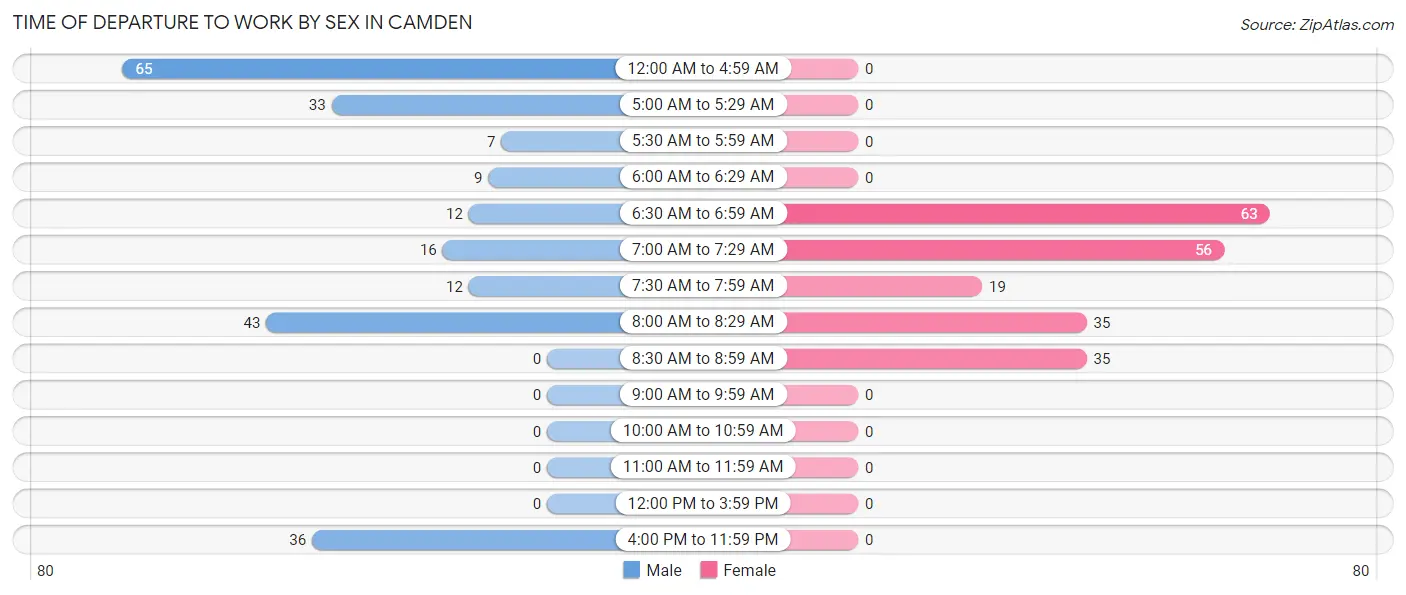
| Time of Departure | Male | Female |
| 12:00 AM to 4:59 AM | 65 (27.9%) | 0 (0.0%) |
| 5:00 AM to 5:29 AM | 33 (14.2%) | 0 (0.0%) |
| 5:30 AM to 5:59 AM | 7 (3.0%) | 0 (0.0%) |
| 6:00 AM to 6:29 AM | 9 (3.9%) | 0 (0.0%) |
| 6:30 AM to 6:59 AM | 12 (5.1%) | 63 (30.3%) |
| 7:00 AM to 7:29 AM | 16 (6.9%) | 56 (26.9%) |
| 7:30 AM to 7:59 AM | 12 (5.1%) | 19 (9.1%) |
| 8:00 AM to 8:29 AM | 43 (18.4%) | 35 (16.8%) |
| 8:30 AM to 8:59 AM | 0 (0.0%) | 35 (16.8%) |
| 9:00 AM to 9:59 AM | 0 (0.0%) | 0 (0.0%) |
| 10:00 AM to 10:59 AM | 0 (0.0%) | 0 (0.0%) |
| 11:00 AM to 11:59 AM | 0 (0.0%) | 0 (0.0%) |
| 12:00 PM to 3:59 PM | 0 (0.0%) | 0 (0.0%) |
| 4:00 PM to 11:59 PM | 36 (15.4%) | 0 (0.0%) |
| Total | 233 (100.0%) | 208 (100.0%) |
Housing Occupancy in Camden
Occupancy by Ownership in Camden
Of the total 388 dwellings in Camden, owner-occupied units account for 173 (44.6%), while renter-occupied units make up 215 (55.4%).
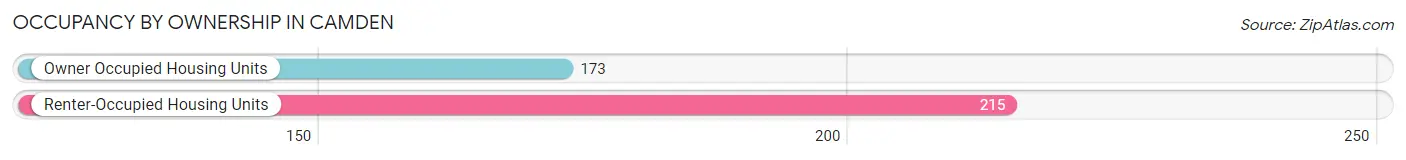
| Occupancy | # Housing Units | % Housing Units |
| Owner Occupied Housing Units | 173 | 44.6% |
| Renter-Occupied Housing Units | 215 | 55.4% |
| Total Occupied Housing Units | 388 | 100.0% |
Occupancy by Household Size in Camden
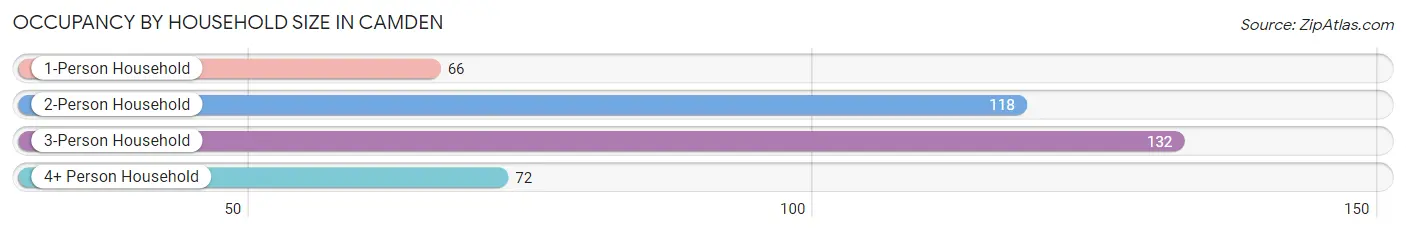
| Household Size | # Housing Units | % Housing Units |
| 1-Person Household | 66 | 17.0% |
| 2-Person Household | 118 | 30.4% |
| 3-Person Household | 132 | 34.0% |
| 4+ Person Household | 72 | 18.6% |
| Total Housing Units | 388 | 100.0% |
Occupancy by Ownership by Household Size in Camden
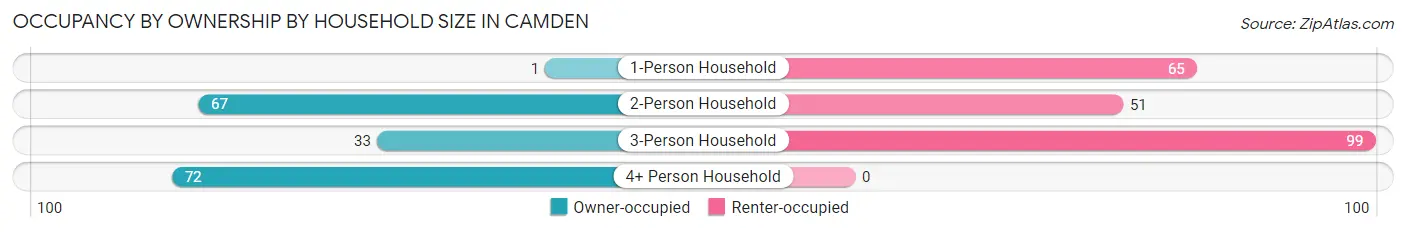
| Household Size | Owner-occupied | Renter-occupied |
| 1-Person Household | 1 (1.5%) | 65 (98.5%) |
| 2-Person Household | 67 (56.8%) | 51 (43.2%) |
| 3-Person Household | 33 (25.0%) | 99 (75.0%) |
| 4+ Person Household | 72 (100.0%) | 0 (0.0%) |
| Total Housing Units | 173 (44.6%) | 215 (55.4%) |
Occupancy by Educational Attainment in Camden
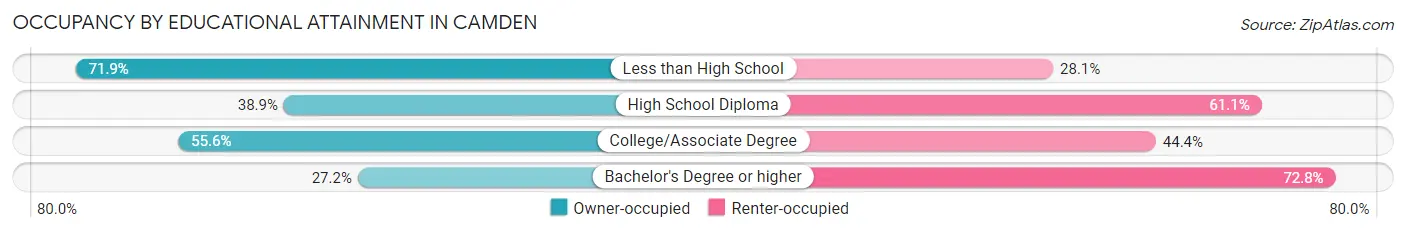
| Household Size | Owner-occupied | Renter-occupied |
| Less than High School | 41 (71.9%) | 16 (28.1%) |
| High School Diploma | 14 (38.9%) | 22 (61.1%) |
| College/Associate Degree | 74 (55.6%) | 59 (44.4%) |
| Bachelor's Degree or higher | 44 (27.2%) | 118 (72.8%) |
Occupancy by Age of Householder in Camden
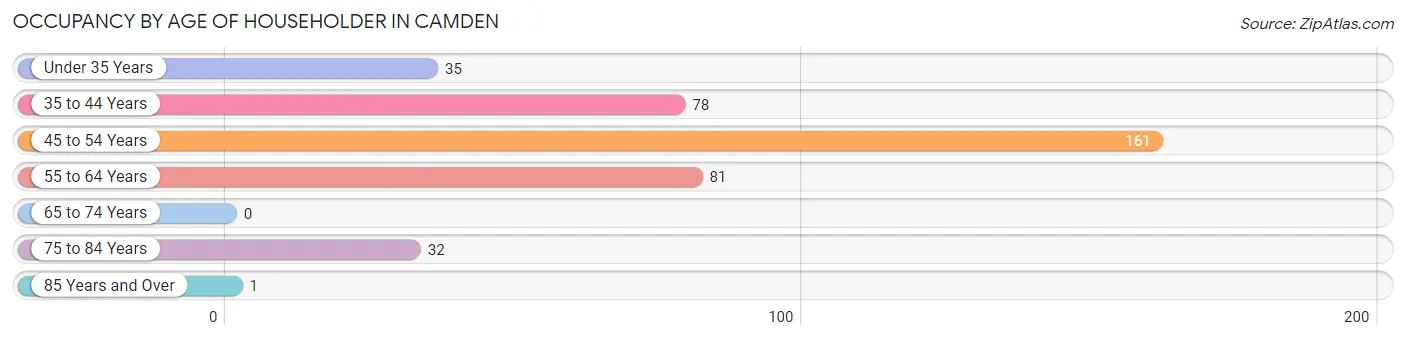
| Age Bracket | # Households | % Households |
| Under 35 Years | 35 | 9.0% |
| 35 to 44 Years | 78 | 20.1% |
| 45 to 54 Years | 161 | 41.5% |
| 55 to 64 Years | 81 | 20.9% |
| 65 to 74 Years | 0 | 0.0% |
| 75 to 84 Years | 32 | 8.3% |
| 85 Years and Over | 1 | 0.3% |
| Total | 388 | 100.0% |
Housing Finances in Camden
Median Income by Occupancy in Camden
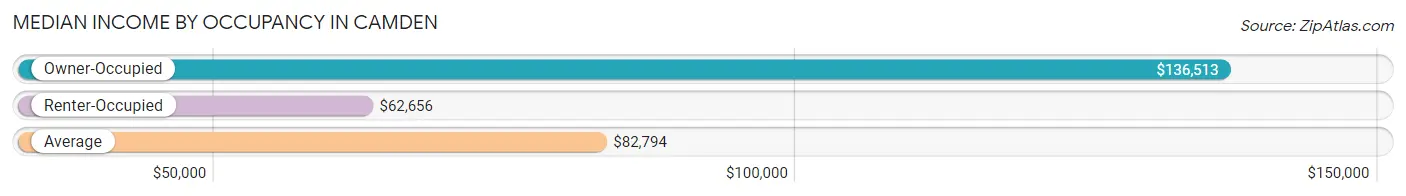
| Occupancy Type | # Households | Median Income |
| Owner-Occupied | 173 (44.6%) | $136,513 |
| Renter-Occupied | 215 (55.4%) | $62,656 |
| Average | 388 (100.0%) | $82,794 |
Occupancy by Householder Income Bracket in Camden
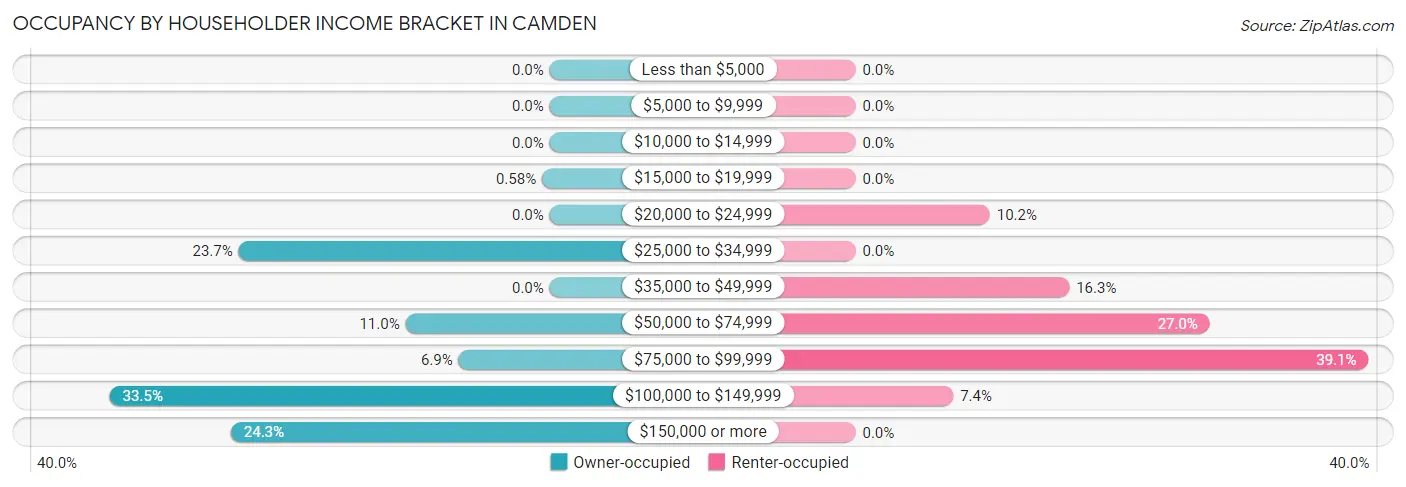
| Income Bracket | Owner-occupied | Renter-occupied |
| Less than $5,000 | 0 (0.0%) | 0 (0.0%) |
| $5,000 to $9,999 | 0 (0.0%) | 0 (0.0%) |
| $10,000 to $14,999 | 0 (0.0%) | 0 (0.0%) |
| $15,000 to $19,999 | 1 (0.6%) | 0 (0.0%) |
| $20,000 to $24,999 | 0 (0.0%) | 22 (10.2%) |
| $25,000 to $34,999 | 41 (23.7%) | 0 (0.0%) |
| $35,000 to $49,999 | 0 (0.0%) | 35 (16.3%) |
| $50,000 to $74,999 | 19 (11.0%) | 58 (27.0%) |
| $75,000 to $99,999 | 12 (6.9%) | 84 (39.1%) |
| $100,000 to $149,999 | 58 (33.5%) | 16 (7.4%) |
| $150,000 or more | 42 (24.3%) | 0 (0.0%) |
| Total | 173 (100.0%) | 215 (100.0%) |
Monthly Housing Cost Tiers in Camden
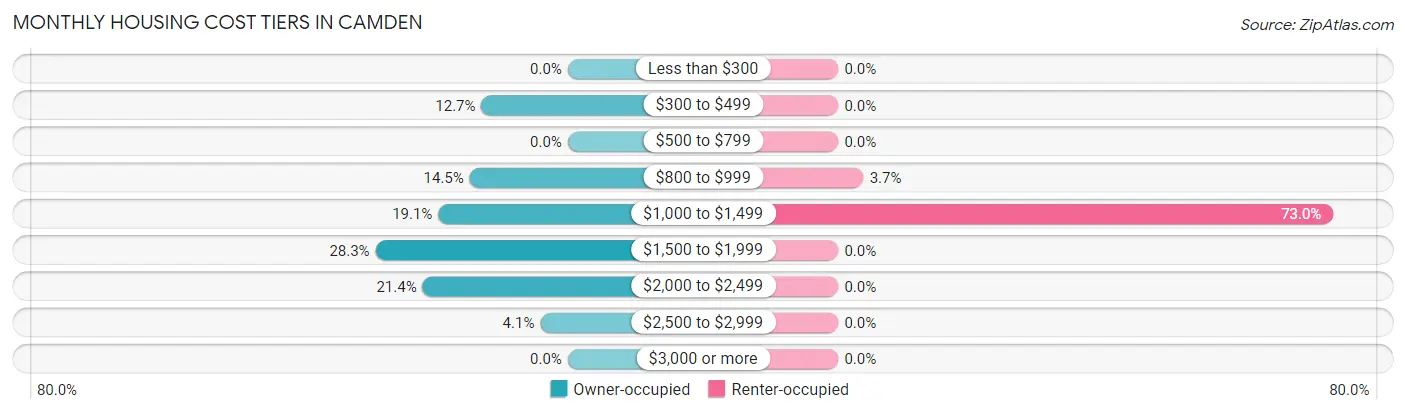
| Monthly Cost | Owner-occupied | Renter-occupied |
| Less than $300 | 0 (0.0%) | 0 (0.0%) |
| $300 to $499 | 22 (12.7%) | 0 (0.0%) |
| $500 to $799 | 0 (0.0%) | 0 (0.0%) |
| $800 to $999 | 25 (14.4%) | 8 (3.7%) |
| $1,000 to $1,499 | 33 (19.1%) | 157 (73.0%) |
| $1,500 to $1,999 | 49 (28.3%) | 0 (0.0%) |
| $2,000 to $2,499 | 37 (21.4%) | 0 (0.0%) |
| $2,500 to $2,999 | 7 (4.1%) | 0 (0.0%) |
| $3,000 or more | 0 (0.0%) | 0 (0.0%) |
| Total | 173 (100.0%) | 215 (100.0%) |
Physical Housing Characteristics in Camden
Housing Structures in Camden
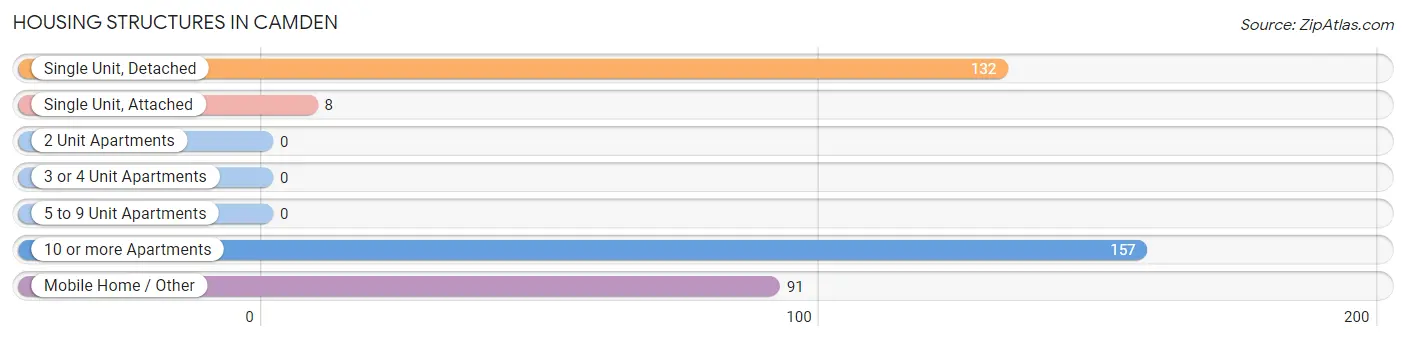
| Structure Type | # Housing Units | % Housing Units |
| Single Unit, Detached | 132 | 34.0% |
| Single Unit, Attached | 8 | 2.1% |
| 2 Unit Apartments | 0 | 0.0% |
| 3 or 4 Unit Apartments | 0 | 0.0% |
| 5 to 9 Unit Apartments | 0 | 0.0% |
| 10 or more Apartments | 157 | 40.5% |
| Mobile Home / Other | 91 | 23.4% |
| Total | 388 | 100.0% |
Housing Structures by Occupancy in Camden
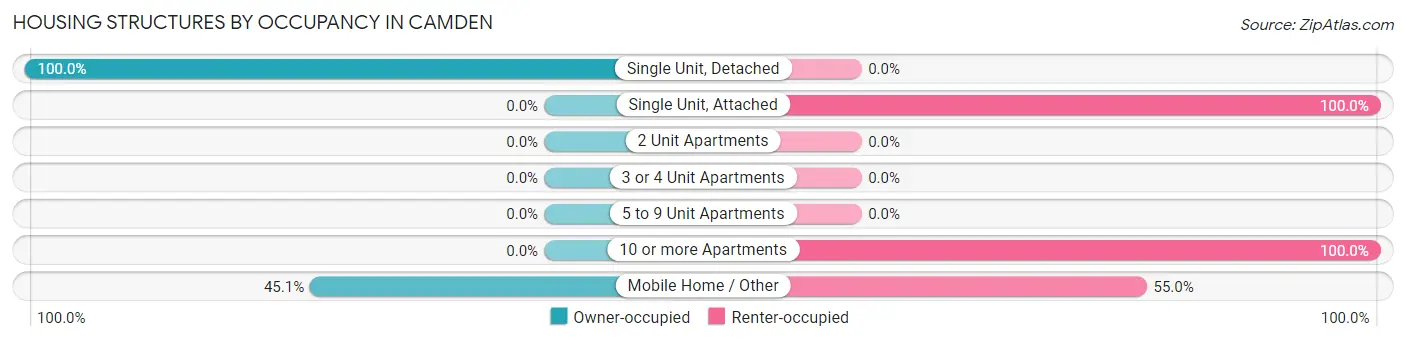
| Structure Type | Owner-occupied | Renter-occupied |
| Single Unit, Detached | 132 (100.0%) | 0 (0.0%) |
| Single Unit, Attached | 0 (0.0%) | 8 (100.0%) |
| 2 Unit Apartments | 0 (0.0%) | 0 (0.0%) |
| 3 or 4 Unit Apartments | 0 (0.0%) | 0 (0.0%) |
| 5 to 9 Unit Apartments | 0 (0.0%) | 0 (0.0%) |
| 10 or more Apartments | 0 (0.0%) | 157 (100.0%) |
| Mobile Home / Other | 41 (45.1%) | 50 (54.9%) |
| Total | 173 (44.6%) | 215 (55.4%) |
Housing Structures by Number of Rooms in Camden
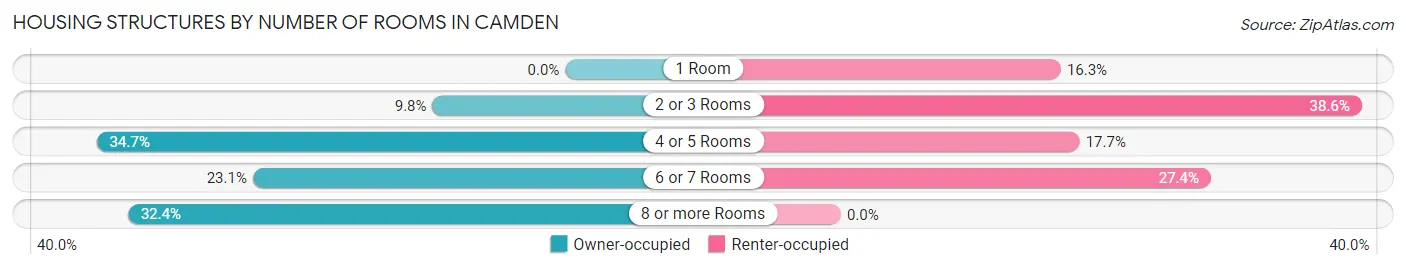
| Number of Rooms | Owner-occupied | Renter-occupied |
| 1 Room | 0 (0.0%) | 35 (16.3%) |
| 2 or 3 Rooms | 17 (9.8%) | 83 (38.6%) |
| 4 or 5 Rooms | 60 (34.7%) | 38 (17.7%) |
| 6 or 7 Rooms | 40 (23.1%) | 59 (27.4%) |
| 8 or more Rooms | 56 (32.4%) | 0 (0.0%) |
| Total | 173 (100.0%) | 215 (100.0%) |
Housing Structure by Heating Type in Camden
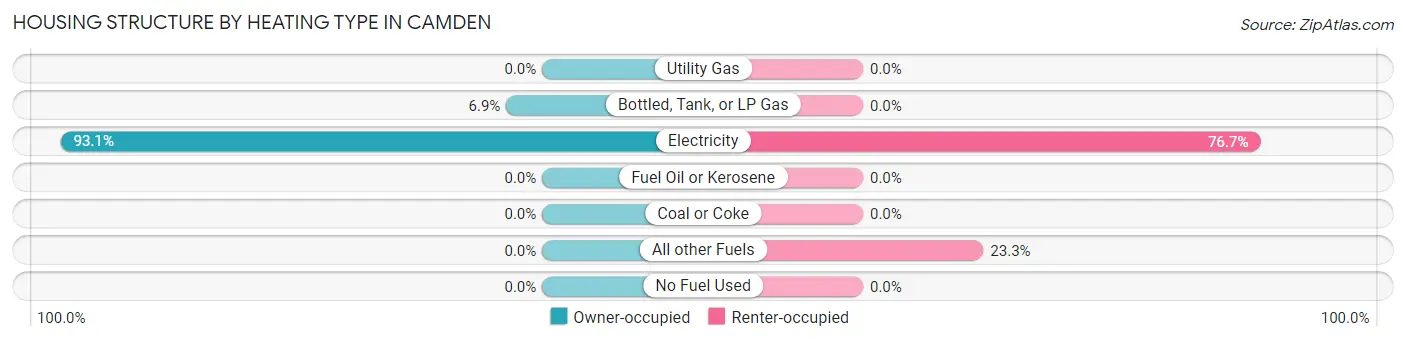
| Heating Type | Owner-occupied | Renter-occupied |
| Utility Gas | 0 (0.0%) | 0 (0.0%) |
| Bottled, Tank, or LP Gas | 12 (6.9%) | 0 (0.0%) |
| Electricity | 161 (93.1%) | 165 (76.7%) |
| Fuel Oil or Kerosene | 0 (0.0%) | 0 (0.0%) |
| Coal or Coke | 0 (0.0%) | 0 (0.0%) |
| All other Fuels | 0 (0.0%) | 50 (23.3%) |
| No Fuel Used | 0 (0.0%) | 0 (0.0%) |
| Total | 173 (100.0%) | 215 (100.0%) |
Household Vehicle Usage in Camden
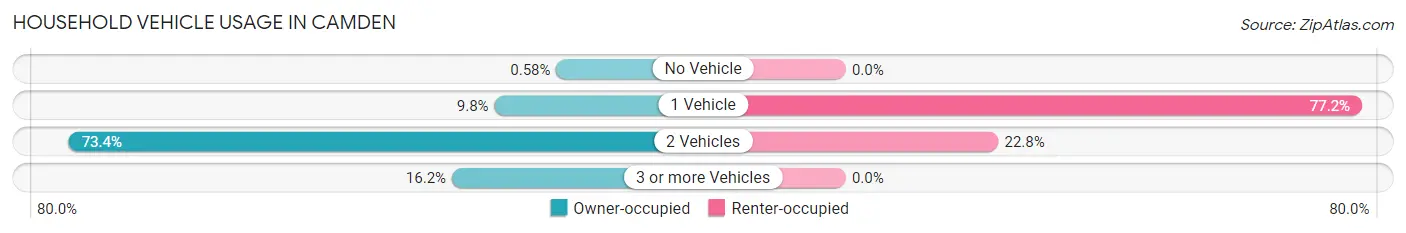
| Vehicles per Household | Owner-occupied | Renter-occupied |
| No Vehicle | 1 (0.6%) | 0 (0.0%) |
| 1 Vehicle | 17 (9.8%) | 166 (77.2%) |
| 2 Vehicles | 127 (73.4%) | 49 (22.8%) |
| 3 or more Vehicles | 28 (16.2%) | 0 (0.0%) |
| Total | 173 (100.0%) | 215 (100.0%) |
Real Estate & Mortgages in Camden
Real Estate and Mortgage Overview in Camden
| Characteristic | Without Mortgage | With Mortgage |
| Housing Units | 23 | 150 |
| Median Property Value | $86,800 | $278,600 |
| Median Household Income | $26,544 | $42 |
| Monthly Housing Costs | $334 | $0 |
| Real Estate Taxes | $199 | $0 |
Property Value by Mortgage Status in Camden
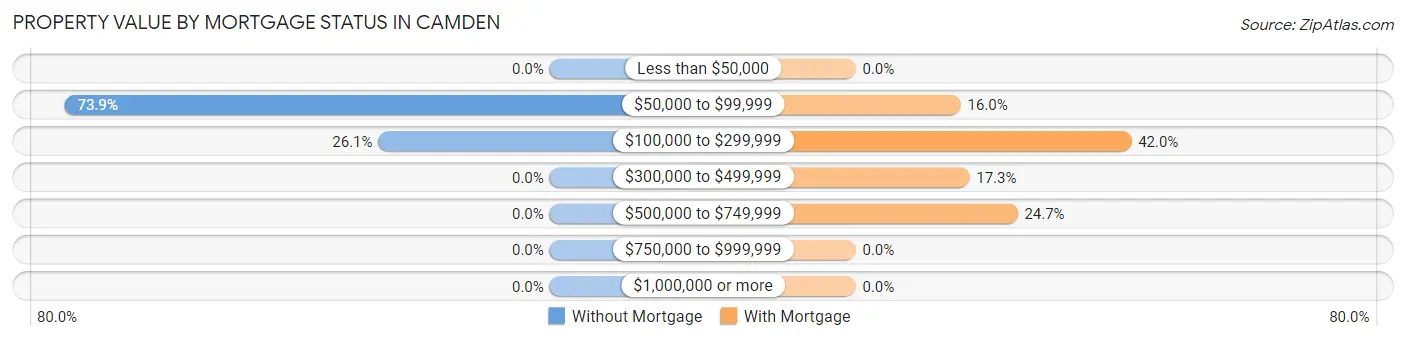
| Property Value | Without Mortgage | With Mortgage |
| Less than $50,000 | 0 (0.0%) | 0 (0.0%) |
| $50,000 to $99,999 | 17 (73.9%) | 24 (16.0%) |
| $100,000 to $299,999 | 6 (26.1%) | 63 (42.0%) |
| $300,000 to $499,999 | 0 (0.0%) | 26 (17.3%) |
| $500,000 to $749,999 | 0 (0.0%) | 37 (24.7%) |
| $750,000 to $999,999 | 0 (0.0%) | 0 (0.0%) |
| $1,000,000 or more | 0 (0.0%) | 0 (0.0%) |
| Total | 23 (100.0%) | 150 (100.0%) |
Household Income by Mortgage Status in Camden
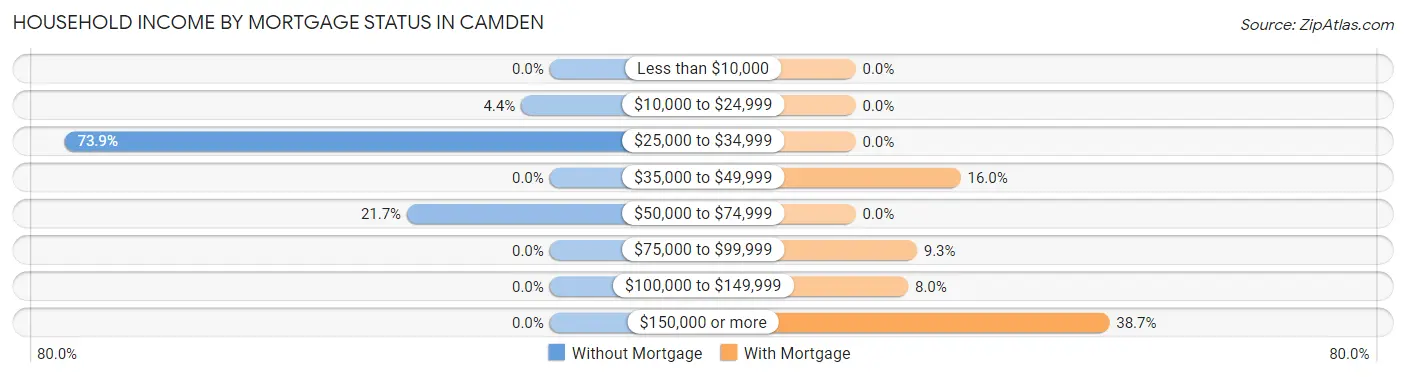
| Household Income | Without Mortgage | With Mortgage |
| Less than $10,000 | 0 (0.0%) | 0 (0.0%) |
| $10,000 to $24,999 | 1 (4.3%) | 0 (0.0%) |
| $25,000 to $34,999 | 17 (73.9%) | 0 (0.0%) |
| $35,000 to $49,999 | 0 (0.0%) | 24 (16.0%) |
| $50,000 to $74,999 | 5 (21.7%) | 0 (0.0%) |
| $75,000 to $99,999 | 0 (0.0%) | 14 (9.3%) |
| $100,000 to $149,999 | 0 (0.0%) | 12 (8.0%) |
| $150,000 or more | 0 (0.0%) | 58 (38.7%) |
| Total | 23 (100.0%) | 150 (100.0%) |
Property Value to Household Income Ratio in Camden
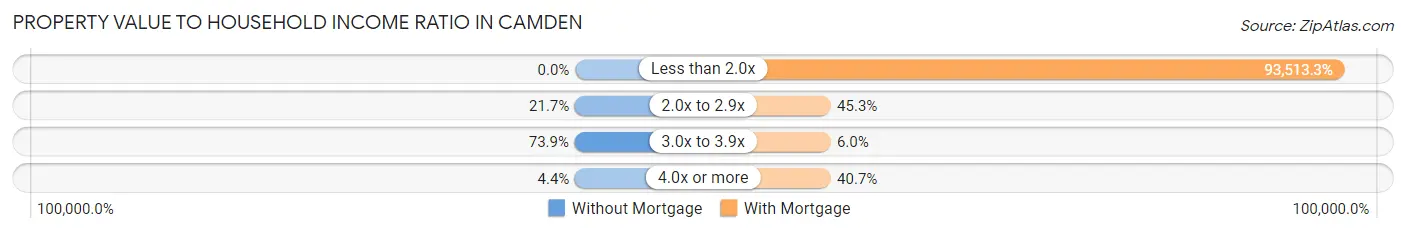
| Value-to-Income Ratio | Without Mortgage | With Mortgage |
| Less than 2.0x | 0 (0.0%) | 140,270 (93,513.3%) |
| 2.0x to 2.9x | 5 (21.7%) | 68 (45.3%) |
| 3.0x to 3.9x | 17 (73.9%) | 9 (6.0%) |
| 4.0x or more | 1 (4.3%) | 61 (40.7%) |
| Total | 23 (100.0%) | 150 (100.0%) |
Real Estate Taxes by Mortgage Status in Camden
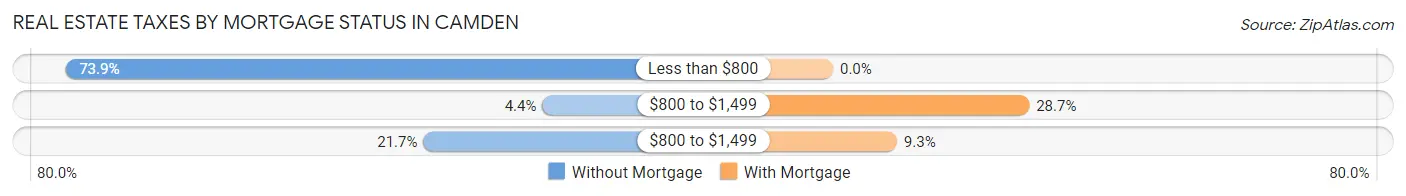
| Property Taxes | Without Mortgage | With Mortgage |
| Less than $800 | 17 (73.9%) | 0 (0.0%) |
| $800 to $1,499 | 1 (4.3%) | 43 (28.7%) |
| $800 to $1,499 | 5 (21.7%) | 14 (9.3%) |
| Total | 23 (100.0%) | 150 (100.0%) |
Health & Disability in Camden
Health Insurance Coverage by Age in Camden
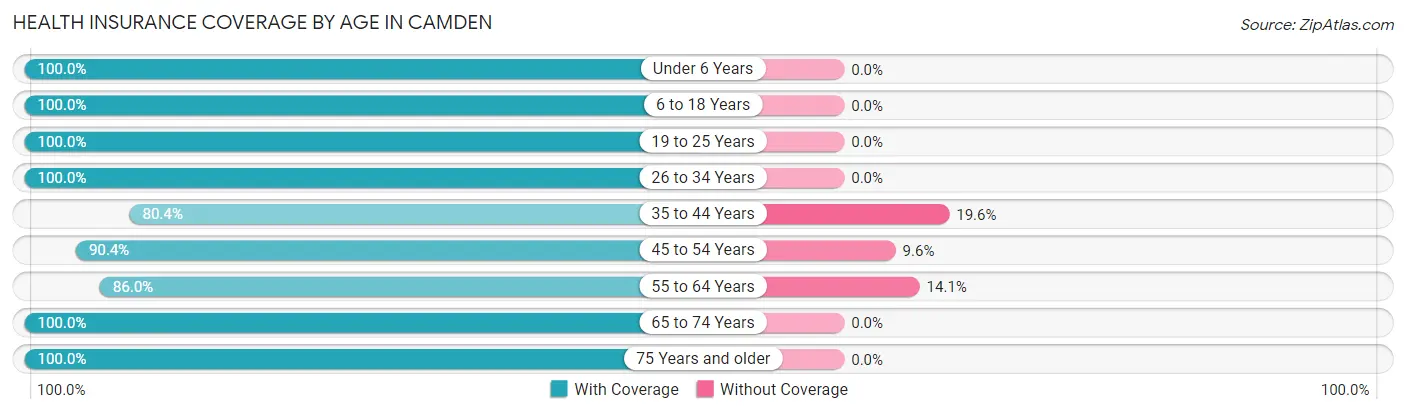
| Age Bracket | With Coverage | Without Coverage |
| Under 6 Years | 54 (100.0%) | 0 (0.0%) |
| 6 to 18 Years | 222 (100.0%) | 0 (0.0%) |
| 19 to 25 Years | 74 (100.0%) | 0 (0.0%) |
| 26 to 34 Years | 41 (100.0%) | 0 (0.0%) |
| 35 to 44 Years | 115 (80.4%) | 28 (19.6%) |
| 45 to 54 Years | 217 (90.4%) | 23 (9.6%) |
| 55 to 64 Years | 104 (86.0%) | 17 (14.1%) |
| 65 to 74 Years | 32 (100.0%) | 0 (0.0%) |
| 75 Years and older | 33 (100.0%) | 0 (0.0%) |
| Total | 892 (92.9%) | 68 (7.1%) |
Health Insurance Coverage by Citizenship Status in Camden
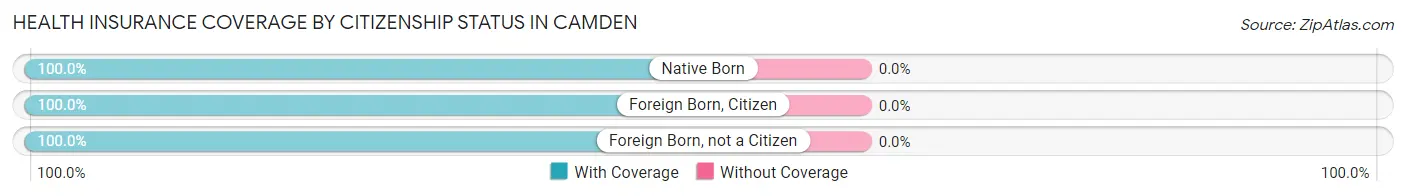
| Citizenship Status | With Coverage | Without Coverage |
| Native Born | 54 (100.0%) | 0 (0.0%) |
| Foreign Born, Citizen | 222 (100.0%) | 0 (0.0%) |
| Foreign Born, not a Citizen | 74 (100.0%) | 0 (0.0%) |
Health Insurance Coverage by Household Income in Camden
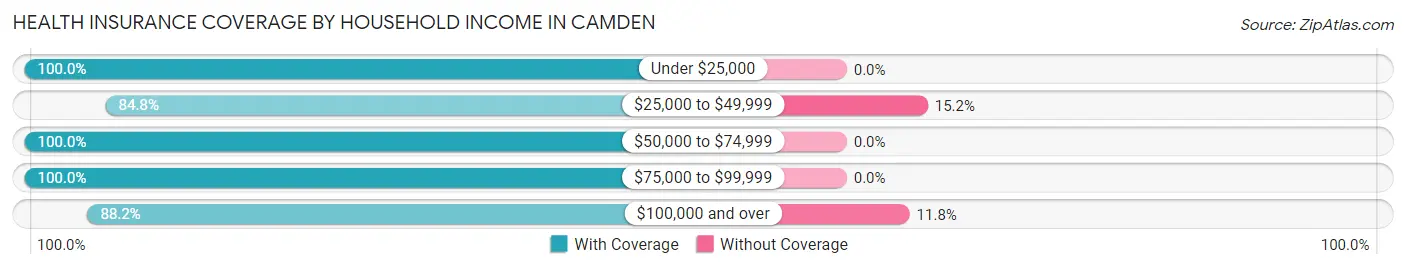
| Household Income | With Coverage | Without Coverage |
| Under $25,000 | 23 (100.0%) | 0 (0.0%) |
| $25,000 to $49,999 | 95 (84.8%) | 17 (15.2%) |
| $50,000 to $74,999 | 169 (100.0%) | 0 (0.0%) |
| $75,000 to $99,999 | 223 (100.0%) | 0 (0.0%) |
| $100,000 and over | 382 (88.2%) | 51 (11.8%) |
Public vs Private Health Insurance Coverage by Age in Camden
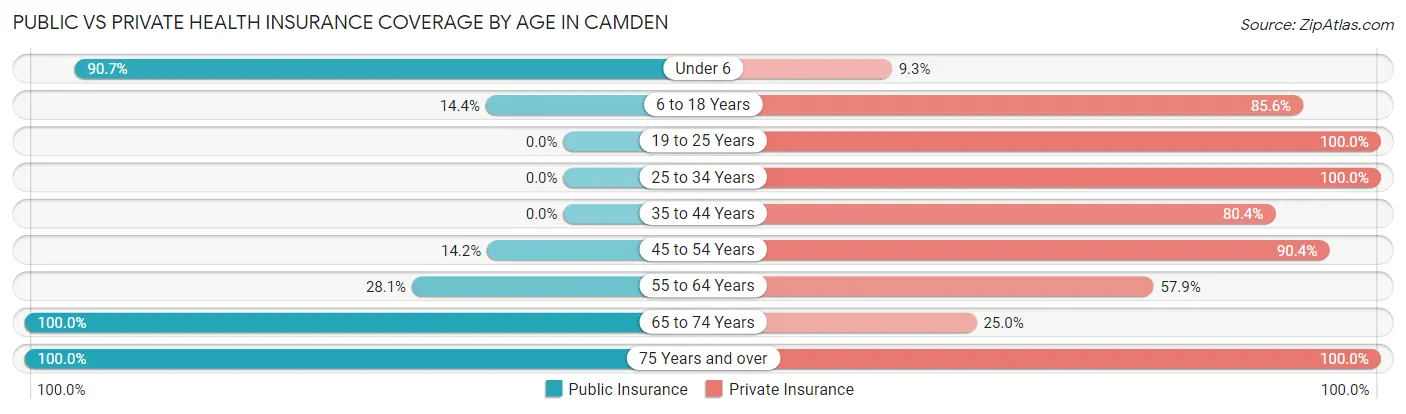
| Age Bracket | Public Insurance | Private Insurance |
| Under 6 | 49 (90.7%) | 5 (9.3%) |
| 6 to 18 Years | 32 (14.4%) | 190 (85.6%) |
| 19 to 25 Years | 0 (0.0%) | 74 (100.0%) |
| 25 to 34 Years | 0 (0.0%) | 41 (100.0%) |
| 35 to 44 Years | 0 (0.0%) | 115 (80.4%) |
| 45 to 54 Years | 34 (14.2%) | 217 (90.4%) |
| 55 to 64 Years | 34 (28.1%) | 70 (57.9%) |
| 65 to 74 Years | 32 (100.0%) | 8 (25.0%) |
| 75 Years and over | 33 (100.0%) | 33 (100.0%) |
| Total | 214 (22.3%) | 753 (78.4%) |
Disability Status by Sex by Age in Camden
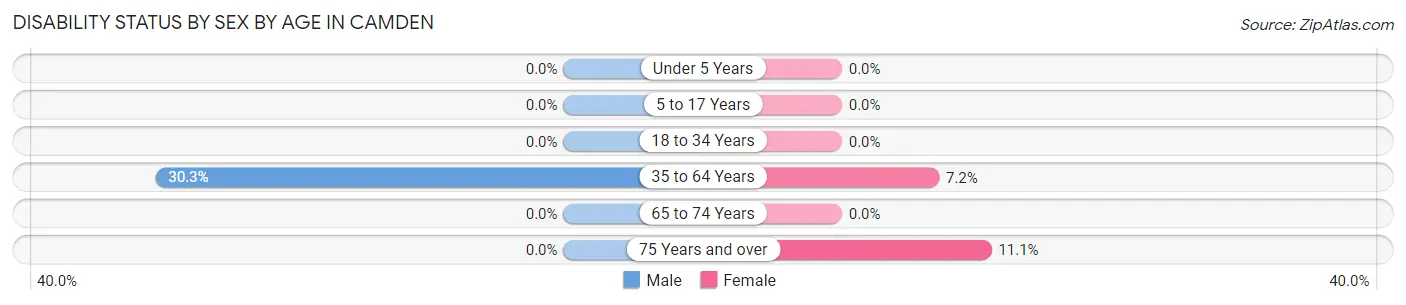
| Age Bracket | Male | Female |
| Under 5 Years | 0 (0.0%) | 0 (0.0%) |
| 5 to 17 Years | 0 (0.0%) | 0 (0.0%) |
| 18 to 34 Years | 0 (0.0%) | 0 (0.0%) |
| 35 to 64 Years | 73 (30.3%) | 19 (7.2%) |
| 65 to 74 Years | 0 (0.0%) | 0 (0.0%) |
| 75 Years and over | 0 (0.0%) | 1 (11.1%) |
Disability Class by Sex by Age in Camden
Disability Class: Hearing Difficulty
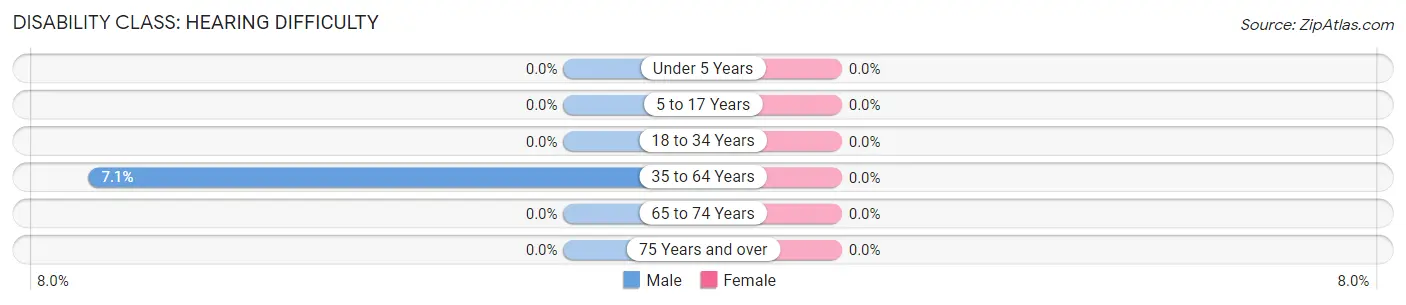
| Age Bracket | Male | Female |
| Under 5 Years | 0 (0.0%) | 0 (0.0%) |
| 5 to 17 Years | 0 (0.0%) | 0 (0.0%) |
| 18 to 34 Years | 0 (0.0%) | 0 (0.0%) |
| 35 to 64 Years | 17 (7.0%) | 0 (0.0%) |
| 65 to 74 Years | 0 (0.0%) | 0 (0.0%) |
| 75 Years and over | 0 (0.0%) | 0 (0.0%) |
Disability Class: Vision Difficulty
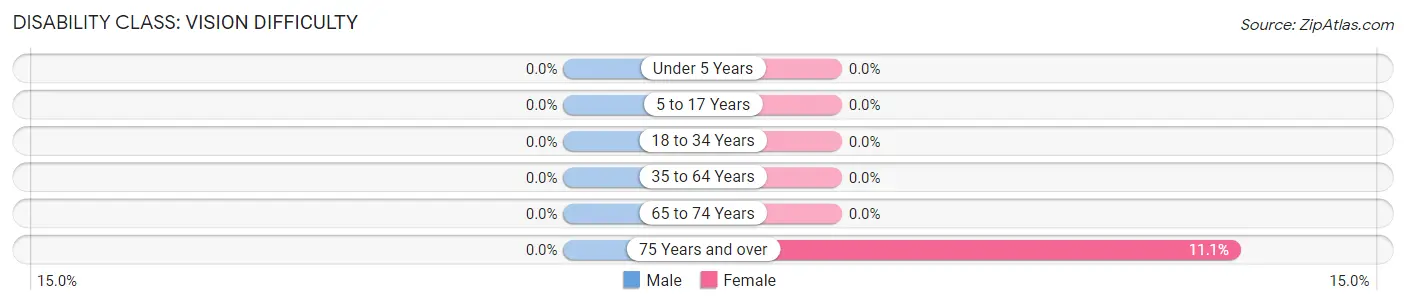
| Age Bracket | Male | Female |
| Under 5 Years | 0 (0.0%) | 0 (0.0%) |
| 5 to 17 Years | 0 (0.0%) | 0 (0.0%) |
| 18 to 34 Years | 0 (0.0%) | 0 (0.0%) |
| 35 to 64 Years | 0 (0.0%) | 0 (0.0%) |
| 65 to 74 Years | 0 (0.0%) | 0 (0.0%) |
| 75 Years and over | 0 (0.0%) | 1 (11.1%) |
Disability Class: Cognitive Difficulty

| Age Bracket | Male | Female |
| 5 to 17 Years | 0 (0.0%) | 0 (0.0%) |
| 18 to 34 Years | 0 (0.0%) | 0 (0.0%) |
| 35 to 64 Years | 34 (14.1%) | 0 (0.0%) |
| 65 to 74 Years | 0 (0.0%) | 0 (0.0%) |
| 75 Years and over | 0 (0.0%) | 0 (0.0%) |
Disability Class: Ambulatory Difficulty
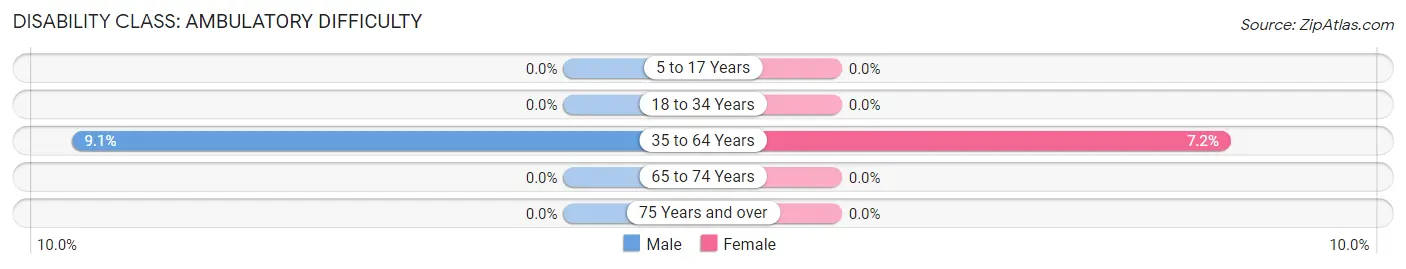
| Age Bracket | Male | Female |
| 5 to 17 Years | 0 (0.0%) | 0 (0.0%) |
| 18 to 34 Years | 0 (0.0%) | 0 (0.0%) |
| 35 to 64 Years | 22 (9.1%) | 19 (7.2%) |
| 65 to 74 Years | 0 (0.0%) | 0 (0.0%) |
| 75 Years and over | 0 (0.0%) | 0 (0.0%) |
Disability Class: Self-Care Difficulty
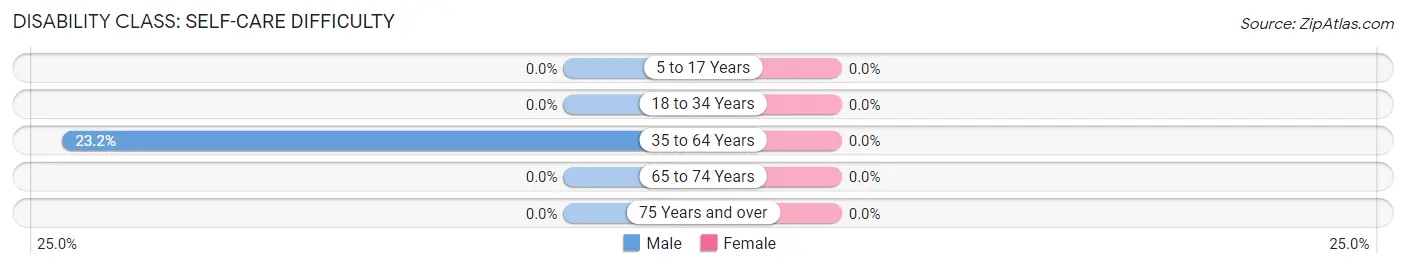
| Age Bracket | Male | Female |
| 5 to 17 Years | 0 (0.0%) | 0 (0.0%) |
| 18 to 34 Years | 0 (0.0%) | 0 (0.0%) |
| 35 to 64 Years | 56 (23.2%) | 0 (0.0%) |
| 65 to 74 Years | 0 (0.0%) | 0 (0.0%) |
| 75 Years and over | 0 (0.0%) | 0 (0.0%) |
Technology Access in Camden
Computing Device Access in Camden
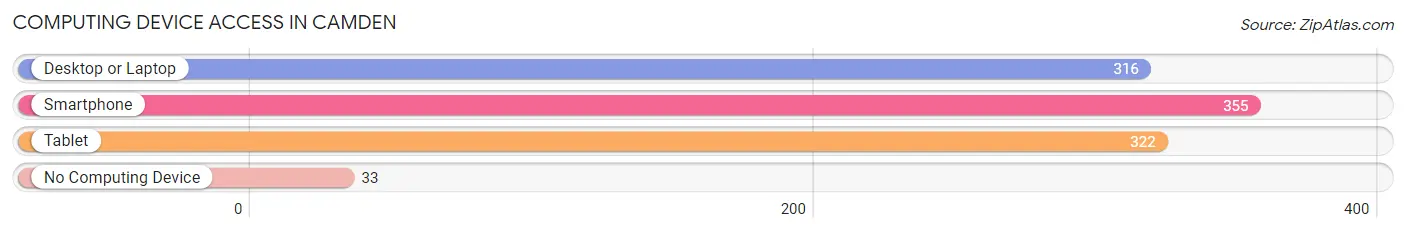
| Device Type | # Households | % Households |
| Desktop or Laptop | 316 | 81.4% |
| Smartphone | 355 | 91.5% |
| Tablet | 322 | 83.0% |
| No Computing Device | 33 | 8.5% |
| Total | 388 | 100.0% |
Internet Access in Camden
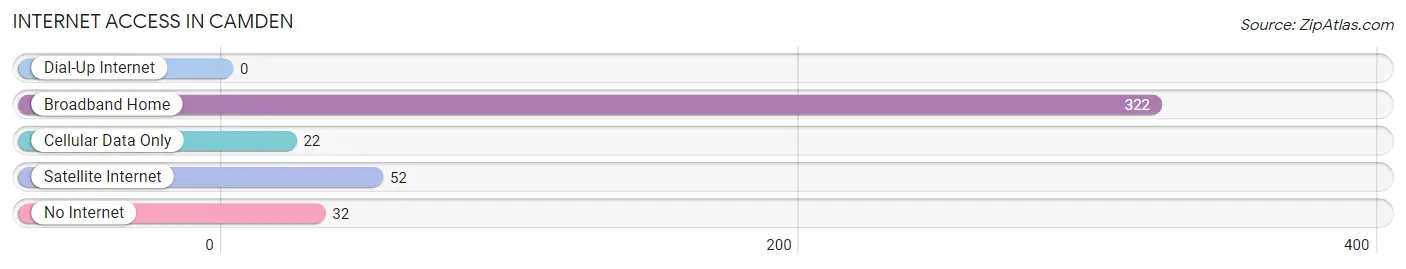
| Internet Type | # Households | % Households |
| Dial-Up Internet | 0 | 0.0% |
| Broadband Home | 322 | 83.0% |
| Cellular Data Only | 22 | 5.7% |
| Satellite Internet | 52 | 13.4% |
| No Internet | 32 | 8.3% |
| Total | 388 | 100.0% |
Camden Summary
Camden, North Carolina is a small town located in Camden County, North Carolina. It is situated on the banks of the Pasquotank River, approximately 30 miles south of Elizabeth City and about 50 miles north of the Outer Banks. The town has a population of approximately 1,500 people and is the county seat of Camden County.
History
The area that is now Camden was first settled in the late 1700s by English settlers. The town was officially established in 1777 and was named after Charles Pratt, the first Earl of Camden. The town was originally a trading post and was used as a port for ships traveling up and down the Pasquotank River. In the early 1800s, Camden became a major port for the export of naval stores, such as tar, pitch, and turpentine. The town was also a major center for the production of cotton and tobacco.
In the late 1800s, Camden began to experience a period of growth and development. The town was incorporated in 1891 and the first public school was established in 1895. The town also saw the construction of a new courthouse in 1895 and the opening of a new railroad line in 1898.
Geography
Camden is located in the northeastern corner of North Carolina, approximately 30 miles south of Elizabeth City and about 50 miles north of the Outer Banks. The town is situated on the banks of the Pasquotank River and is surrounded by the Croatan National Forest. The town has a total area of 2.2 square miles, all of which is land.
Economy
The economy of Camden is largely based on agriculture and tourism. The town is home to several farms that produce a variety of crops, including corn, soybeans, and cotton. The town is also home to several seafood processing plants, which process and package seafood for local restaurants and markets.
Tourism is also an important part of the local economy. The town is home to several historic sites, including the Camden County Courthouse, the Camden County Museum, and the Camden County Historical Society. The town also hosts several annual festivals and events, such as the Camden County Fair and the Camden County Music Festival.
Demographics
As of the 2010 census, Camden had a population of 1,500 people. The racial makeup of the town was 79.3% White, 17.3% African American, 0.7% Native American, 0.3% Asian, 0.7% from other races, and 1.7% from two or more races. Hispanic or Latino of any race were 2.3% of the population.
The median income for a household in the town was $31,250, and the median income for a family was $37,500. The per capita income for the town was $17,857. About 17.3% of families and 20.7% of the population were below the poverty line, including 28.3% of those under age 18 and 11.3% of those age 65 or over.
Common Questions
What is Per Capita Income in Camden?
Per Capita income in Camden is $41,405.
What is the Median Family Income in Camden?
Median Family Income in Camden is $84,069.
What is the Median Household income in Camden?
Median Household Income in Camden is $82,794.
What is Inequality or Gini Index in Camden?
Inequality or Gini Index in Camden is 0.40.
What is the Total Population of Camden?
Total Population of Camden is 960.
What is the Total Male Population of Camden?
Total Male Population of Camden is 555.
What is the Total Female Population of Camden?
Total Female Population of Camden is 405.
What is the Ratio of Males per 100 Females in Camden?
There are 137.04 Males per 100 Females in Camden.
What is the Ratio of Females per 100 Males in Camden?
There are 72.97 Females per 100 Males in Camden.
What is the Median Population Age in Camden?
Median Population Age in Camden is 41.2 Years.
What is the Average Family Size in Camden
Average Family Size in Camden is 2.7 People.
What is the Average Household Size in Camden
Average Household Size in Camden is 2.5 People.
How Large is the Labor Force in Camden?
There are 594 People in the Labor Forcein in Camden.
What is the Percentage of People in the Labor Force in Camden?
76.0% of People are in the Labor Force in Camden.
What is the Unemployment Rate in Camden?
Unemployment Rate in Camden is 6.9%.