Bessemer City, NC Map & Demographics
Bessemer City Map
Bessemer City Overview
$24,979
PER CAPITA INCOME
$68,194
AVG FAMILY INCOME
$44,440
AVG HOUSEHOLD INCOME
11.4%
WAGE / INCOME GAP [ % ]
88.6¢/ $1
WAGE / INCOME GAP [ $ ]
$10,602
FAMILY INCOME DEFICIT
0.42
INEQUALITY / GINI INDEX
5,472
TOTAL POPULATION
2,805
MALE POPULATION
2,667
FEMALE POPULATION
105.17
MALES / 100 FEMALES
95.08
FEMALES / 100 MALES
38.5
MEDIAN AGE
3.2
AVG FAMILY SIZE
2.5
AVG HOUSEHOLD SIZE
2,879
LABOR FORCE [ PEOPLE ]
62.0%
PERCENT IN LABOR FORCE
6.1%
UNEMPLOYMENT RATE
Bessemer City Zip Codes
Income in Bessemer City
Income Overview in Bessemer City
Per Capita Income in Bessemer City is $24,979, while median incomes of families and households are $68,194 and $44,440 respectively.
| Characteristic | Number | Measure |
| Per Capita Income | 5,472 | $24,979 |
| Median Family Income | 1,319 | $68,194 |
| Mean Family Income | 1,319 | $74,960 |
| Median Household Income | 2,181 | $44,440 |
| Mean Household Income | 2,181 | $59,200 |
| Income Deficit | 1,319 | $10,602 |
| Wage / Income Gap (%) | 5,472 | 11.35% |
| Wage / Income Gap ($) | 5,472 | 88.65¢ per $1 |
| Gini / Inequality Index | 5,472 | 0.42 |
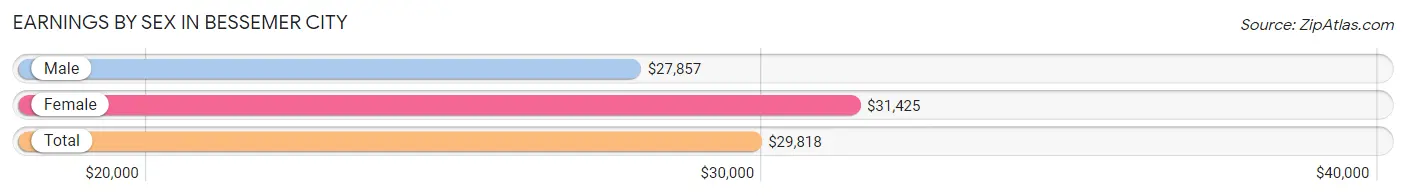
Earnings by Sex in Bessemer City
Average Earnings in Bessemer City are $29,818, $27,857 for men and $31,425 for women, a difference of 11.4%.
| Sex | Number | Average Earnings |
| Male | 1,624 (52.6%) | $27,857 |
| Female | 1,461 (47.4%) | $31,425 |
| Total | 3,085 (100.0%) | $29,818 |
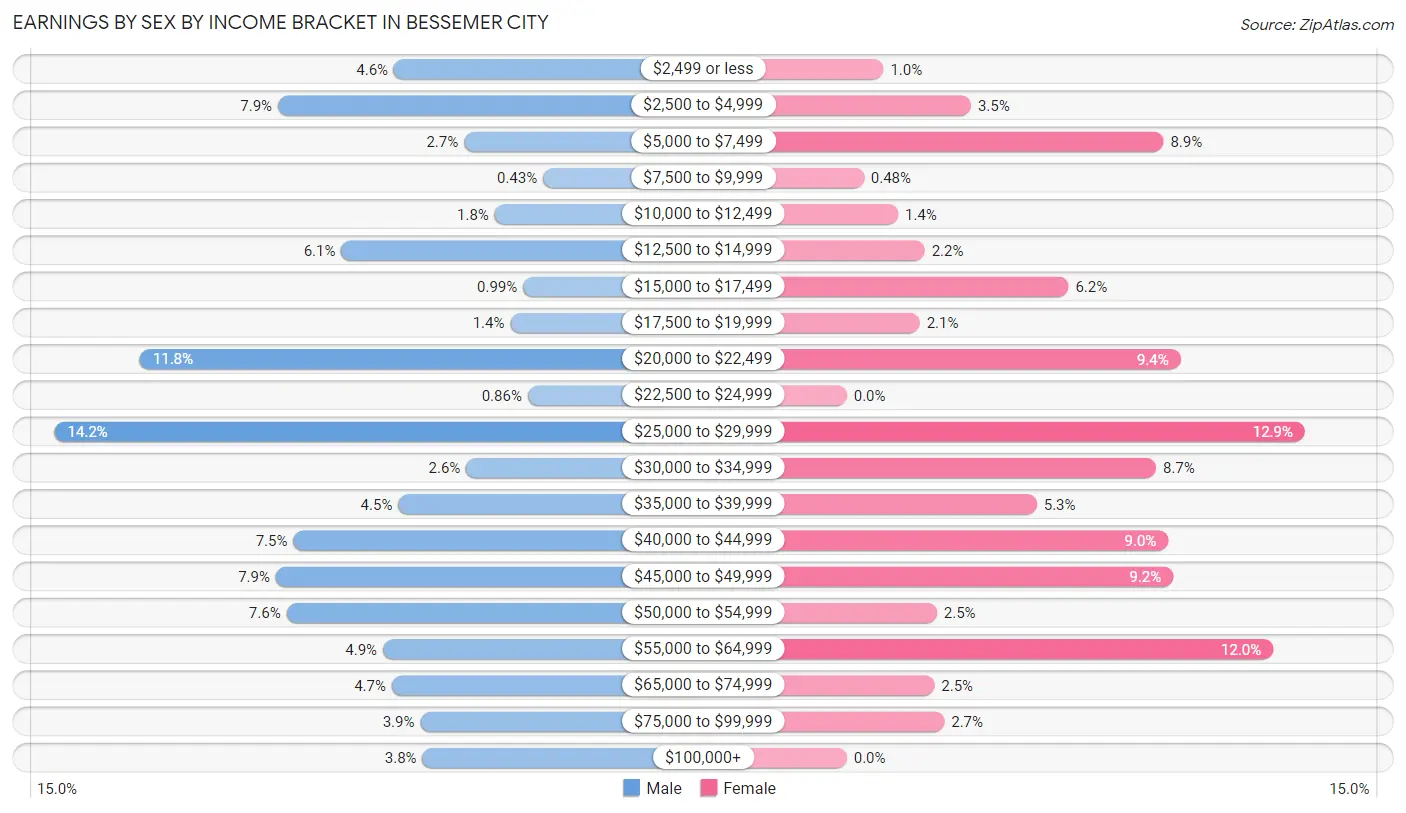
Earnings by Sex by Income Bracket in Bessemer City
The most common earnings brackets in Bessemer City are $25,000 to $29,999 for men (230 | 14.2%) and $25,000 to $29,999 for women (188 | 12.9%).
| Income | Male | Female |
| $2,499 or less | 75 (4.6%) | 15 (1.0%) |
| $2,500 to $4,999 | 128 (7.9%) | 51 (3.5%) |
| $5,000 to $7,499 | 43 (2.6%) | 130 (8.9%) |
| $7,500 to $9,999 | 7 (0.4%) | 7 (0.5%) |
| $10,000 to $12,499 | 29 (1.8%) | 21 (1.4%) |
| $12,500 to $14,999 | 99 (6.1%) | 32 (2.2%) |
| $15,000 to $17,499 | 16 (1.0%) | 91 (6.2%) |
| $17,500 to $19,999 | 22 (1.3%) | 30 (2.1%) |
| $20,000 to $22,499 | 191 (11.8%) | 137 (9.4%) |
| $22,500 to $24,999 | 14 (0.9%) | 0 (0.0%) |
| $25,000 to $29,999 | 230 (14.2%) | 188 (12.9%) |
| $30,000 to $34,999 | 42 (2.6%) | 127 (8.7%) |
| $35,000 to $39,999 | 73 (4.5%) | 78 (5.3%) |
| $40,000 to $44,999 | 121 (7.4%) | 132 (9.0%) |
| $45,000 to $49,999 | 129 (7.9%) | 134 (9.2%) |
| $50,000 to $54,999 | 124 (7.6%) | 37 (2.5%) |
| $55,000 to $64,999 | 80 (4.9%) | 175 (12.0%) |
| $65,000 to $74,999 | 76 (4.7%) | 36 (2.5%) |
| $75,000 to $99,999 | 63 (3.9%) | 40 (2.7%) |
| $100,000+ | 62 (3.8%) | 0 (0.0%) |
| Total | 1,624 (100.0%) | 1,461 (100.0%) |
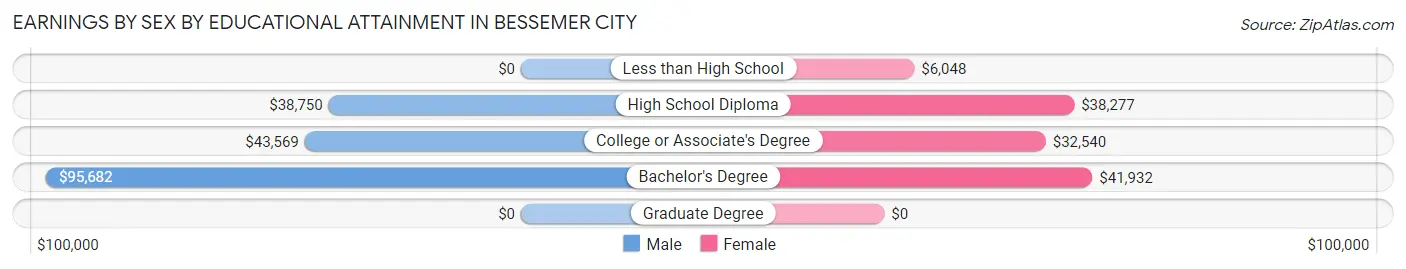
Earnings by Sex by Educational Attainment in Bessemer City
Average earnings in Bessemer City are $41,204 for men and $34,659 for women, a difference of 15.9%. Men with an educational attainment of bachelor's degree enjoy the highest average annual earnings of $95,682, while those with high school diploma education earn the least with $38,750. Women with an educational attainment of bachelor's degree earn the most with the average annual earnings of $41,932, while those with less than high school education have the smallest earnings of $6,048.
| Educational Attainment | Male Income | Female Income |
| Less than High School | - | - |
| High School Diploma | $38,750 | $38,277 |
| College or Associate's Degree | $43,569 | $32,540 |
| Bachelor's Degree | $95,682 | $41,932 |
| Graduate Degree | - | - |
| Total | $41,204 | $34,659 |
Family Income in Bessemer City
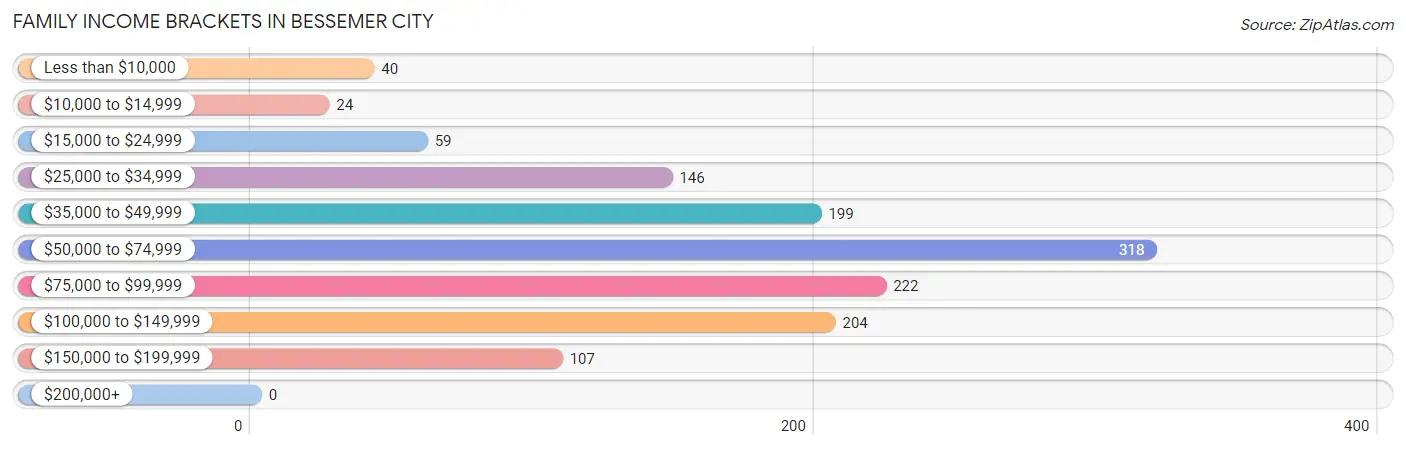
Family Income Brackets in Bessemer City
According to the Bessemer City family income data, there are 318 families falling into the $50,000 to $74,999 income range, which is the most common income bracket and makes up 24.1% of all families.
| Income Bracket | # Families | % Families |
| Less than $10,000 | 40 | 3.0% |
| $10,000 to $14,999 | 24 | 1.8% |
| $15,000 to $24,999 | 59 | 4.5% |
| $25,000 to $34,999 | 146 | 11.1% |
| $35,000 to $49,999 | 199 | 15.1% |
| $50,000 to $74,999 | 318 | 24.1% |
| $75,000 to $99,999 | 222 | 16.8% |
| $100,000 to $149,999 | 204 | 15.5% |
| $150,000 to $199,999 | 107 | 8.1% |
| $200,000+ | 0 | 0.0% |
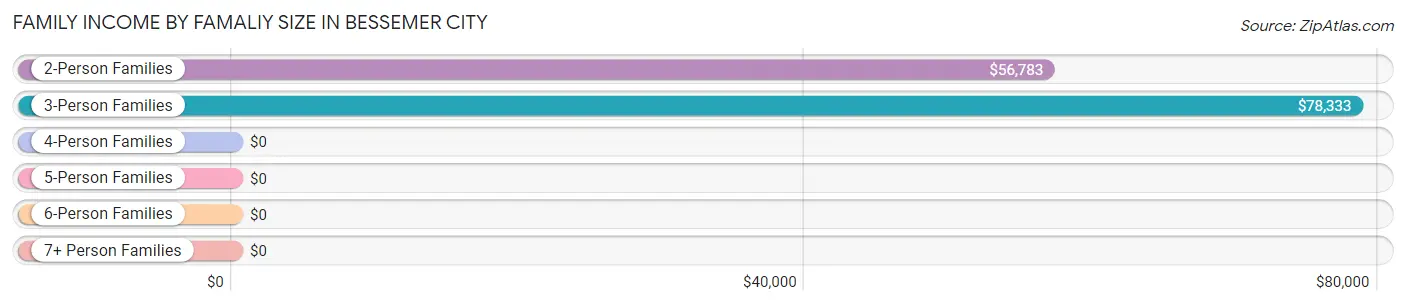
Family Income by Famaliy Size in Bessemer City
3-person families (464 | 35.2%) account for the highest median family income in Bessemer City with $78,333 per family, while 2-person families (531 | 40.3%) have the highest median income of $28,392 per family member.
| Income Bracket | # Families | Median Income |
| 2-Person Families | 531 (40.3%) | $56,783 |
| 3-Person Families | 464 (35.2%) | $78,333 |
| 4-Person Families | 237 (18.0%) | $0 |
| 5-Person Families | 52 (3.9%) | $0 |
| 6-Person Families | 23 (1.7%) | $0 |
| 7+ Person Families | 12 (0.9%) | $0 |
| Total | 1,319 (100.0%) | $68,194 |
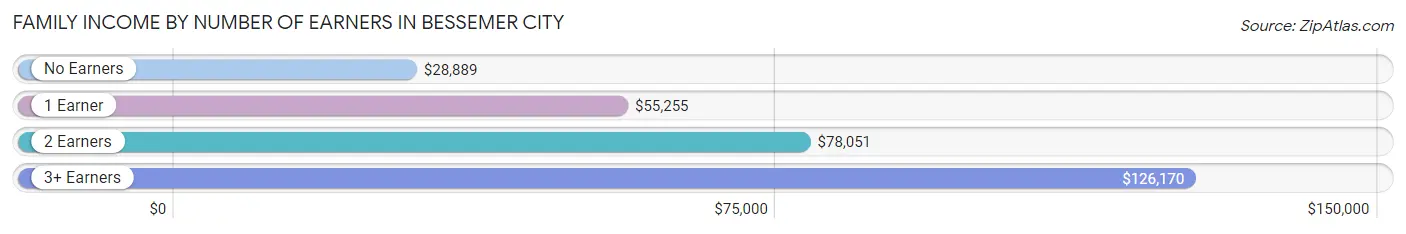
Family Income by Number of Earners in Bessemer City
The median family income in Bessemer City is $68,194, with families comprising 3+ earners (180) having the highest median family income of $126,170, while families with no earners (218) have the lowest median family income of $28,889, accounting for 13.7% and 16.5% of families, respectively.
| Number of Earners | # Families | Median Income |
| No Earners | 218 (16.5%) | $28,889 |
| 1 Earner | 465 (35.2%) | $55,255 |
| 2 Earners | 456 (34.6%) | $78,051 |
| 3+ Earners | 180 (13.7%) | $126,170 |
| Total | 1,319 (100.0%) | $68,194 |
Household Income in Bessemer City
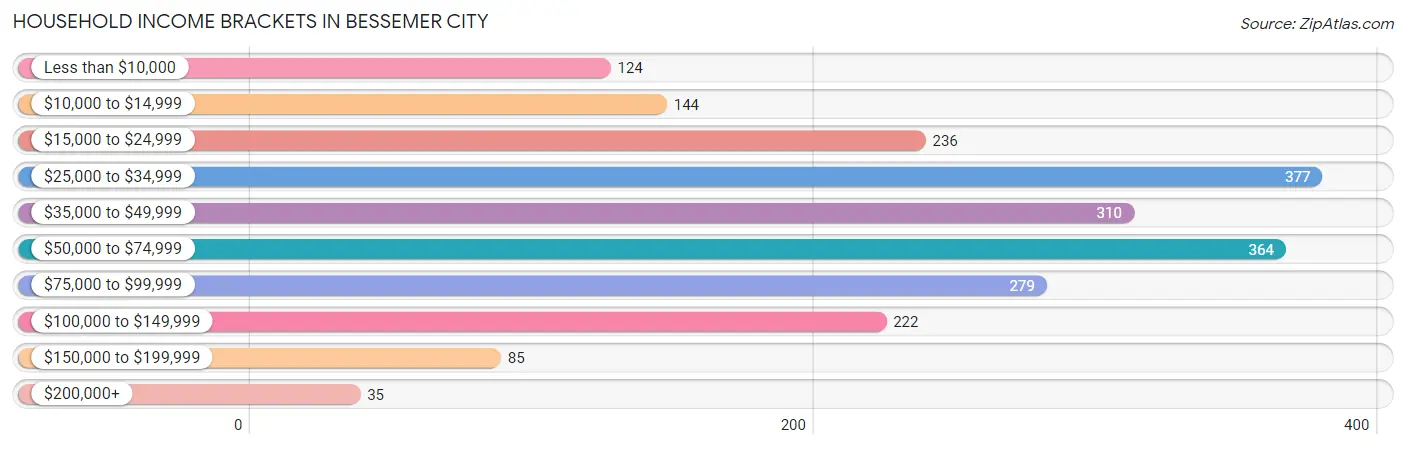
Household Income Brackets in Bessemer City
With 377 households falling in the category, the $25,000 to $34,999 income range is the most frequent in Bessemer City, accounting for 17.3% of all households. In contrast, only 35 households (1.6%) fall into the $200,000+ income bracket, making it the least populous group.
| Income Bracket | # Households | % Households |
| Less than $10,000 | 124 | 5.7% |
| $10,000 to $14,999 | 144 | 6.6% |
| $15,000 to $24,999 | 236 | 10.8% |
| $25,000 to $34,999 | 377 | 17.3% |
| $35,000 to $49,999 | 310 | 14.2% |
| $50,000 to $74,999 | 364 | 16.7% |
| $75,000 to $99,999 | 279 | 12.8% |
| $100,000 to $149,999 | 222 | 10.2% |
| $150,000 to $199,999 | 85 | 3.9% |
| $200,000+ | 35 | 1.6% |
Household Income by Householder Age in Bessemer City
The median household income in Bessemer City is $44,440, with the highest median household income of $72,891 found in the 45 to 64 years age bracket for the primary householder. A total of 737 households (33.8%) fall into this category. Meanwhile, the 15 to 24 years age bracket for the primary householder has the lowest median household income of $26,440, with 159 households (7.3%) in this group.
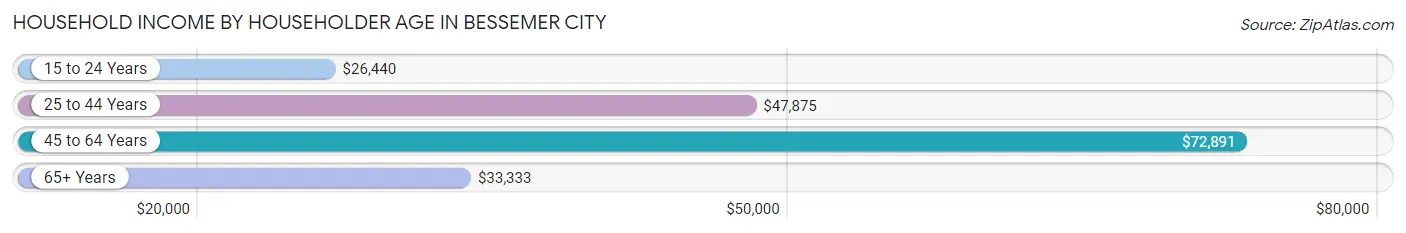
| Income Bracket | # Households | Median Income |
| 15 to 24 Years | 159 (7.3%) | $26,440 |
| 25 to 44 Years | 591 (27.1%) | $47,875 |
| 45 to 64 Years | 737 (33.8%) | $72,891 |
| 65+ Years | 694 (31.8%) | $33,333 |
| Total | 2,181 (100.0%) | $44,440 |
Poverty in Bessemer City
Income Below Poverty by Sex and Age in Bessemer City
With 13.5% poverty level for males and 15.0% for females among the residents of Bessemer City, 16 and 17 year old males and 12 to 14 year old females are the most vulnerable to poverty, with 38 males (64.4%) and 25 females (44.6%) in their respective age groups living below the poverty level.
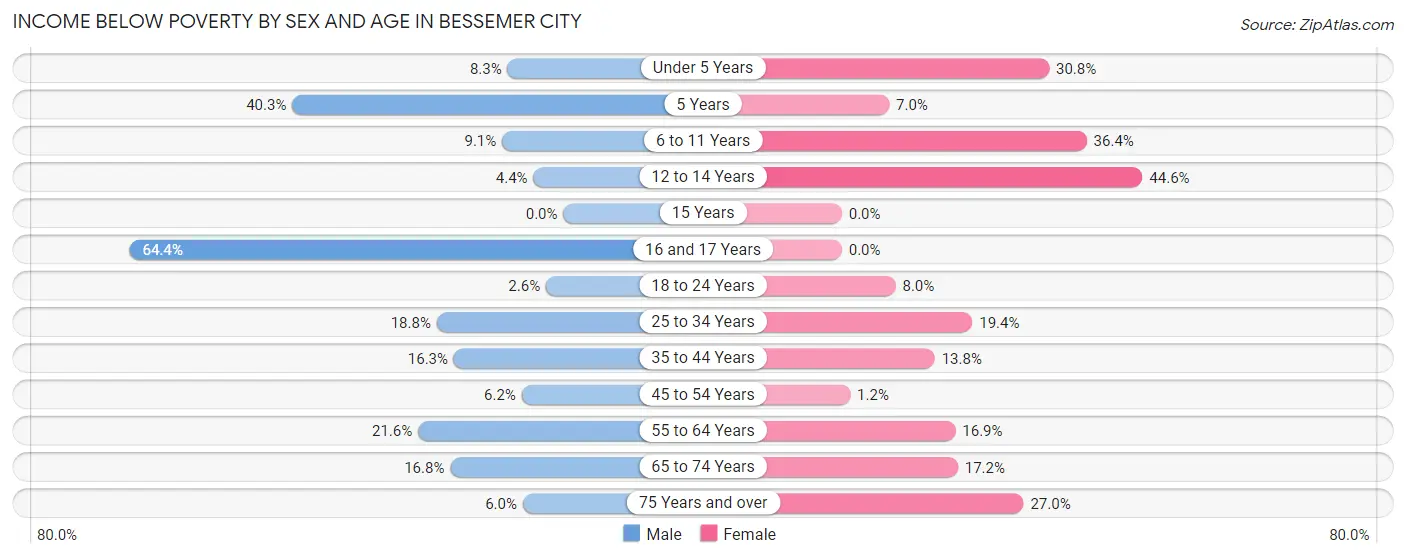
| Age Bracket | Male | Female |
| Under 5 Years | 18 (8.3%) | 20 (30.8%) |
| 5 Years | 31 (40.3%) | 4 (7.0%) |
| 6 to 11 Years | 9 (9.1%) | 44 (36.4%) |
| 12 to 14 Years | 4 (4.4%) | 25 (44.6%) |
| 15 Years | 0 (0.0%) | 0 (0.0%) |
| 16 and 17 Years | 38 (64.4%) | 0 (0.0%) |
| 18 to 24 Years | 13 (2.6%) | 21 (8.0%) |
| 25 to 34 Years | 97 (18.8%) | 81 (19.4%) |
| 35 to 44 Years | 33 (16.3%) | 45 (13.8%) |
| 45 to 54 Years | 21 (6.2%) | 7 (1.2%) |
| 55 to 64 Years | 63 (21.6%) | 43 (16.9%) |
| 65 to 74 Years | 43 (16.8%) | 52 (17.2%) |
| 75 Years and over | 8 (6.0%) | 58 (27.0%) |
| Total | 378 (13.5%) | 400 (15.0%) |
Income Above Poverty by Sex and Age in Bessemer City
According to the poverty statistics in Bessemer City, males aged 15 years and females aged 15 years are the age groups that are most secure financially, with 100.0% of males and 100.0% of females in these age groups living above the poverty line.
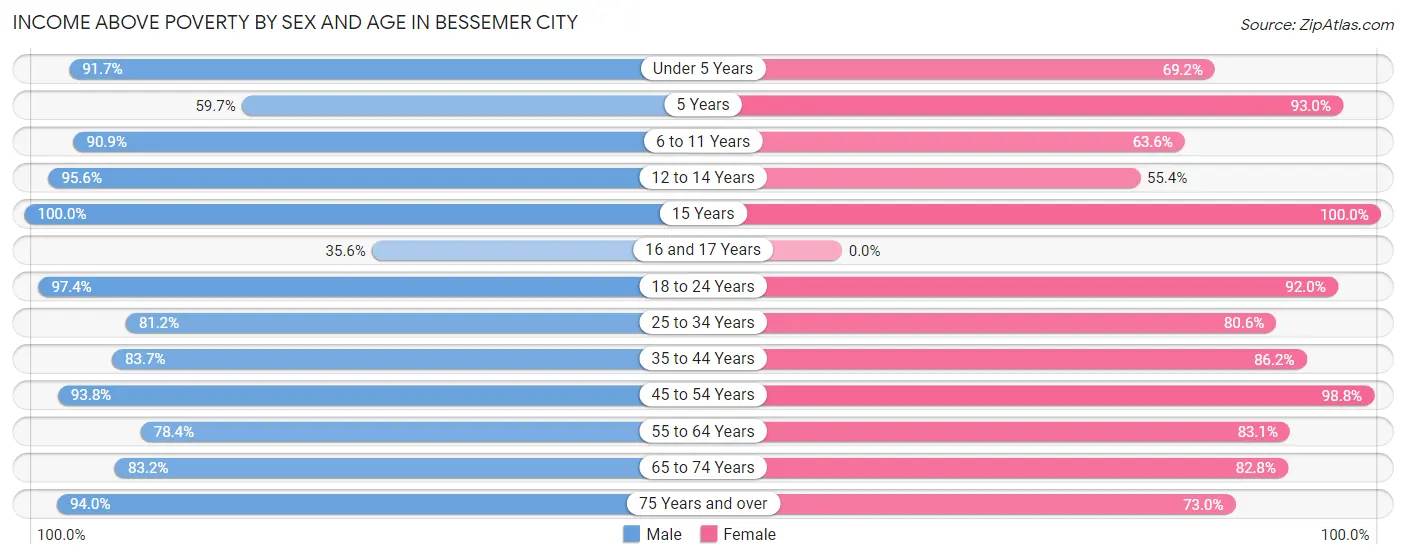
| Age Bracket | Male | Female |
| Under 5 Years | 199 (91.7%) | 45 (69.2%) |
| 5 Years | 46 (59.7%) | 53 (93.0%) |
| 6 to 11 Years | 90 (90.9%) | 77 (63.6%) |
| 12 to 14 Years | 86 (95.6%) | 31 (55.4%) |
| 15 Years | 12 (100.0%) | 25 (100.0%) |
| 16 and 17 Years | 21 (35.6%) | 0 (0.0%) |
| 18 to 24 Years | 490 (97.4%) | 242 (92.0%) |
| 25 to 34 Years | 419 (81.2%) | 337 (80.6%) |
| 35 to 44 Years | 170 (83.7%) | 281 (86.2%) |
| 45 to 54 Years | 318 (93.8%) | 557 (98.8%) |
| 55 to 64 Years | 229 (78.4%) | 212 (83.1%) |
| 65 to 74 Years | 213 (83.2%) | 250 (82.8%) |
| 75 Years and over | 125 (94.0%) | 157 (73.0%) |
| Total | 2,418 (86.5%) | 2,267 (85.0%) |
Income Below Poverty Among Married-Couple Families in Bessemer City
The poverty statistics for married-couple families in Bessemer City show that 5.4% or 45 of the total 836 families live below the poverty line. Families with no children have the highest poverty rate of 6.5%, comprising of 36 families. On the other hand, families with 3 or 4 children have the lowest poverty rate of 0.0%, which includes 0 families.
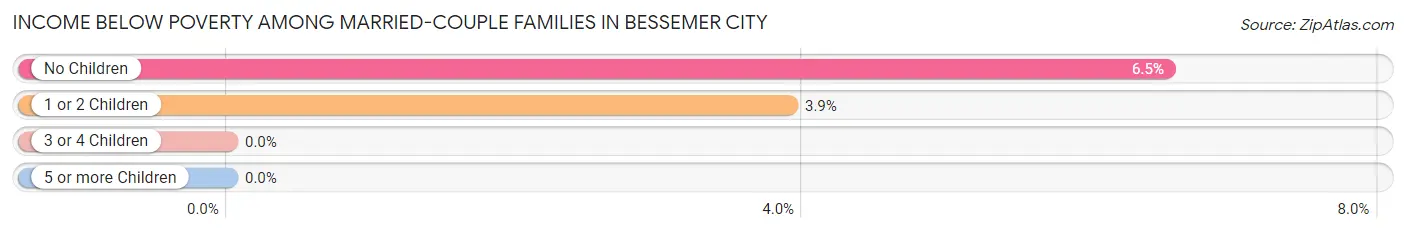
| Children | Above Poverty | Below Poverty |
| No Children | 515 (93.5%) | 36 (6.5%) |
| 1 or 2 Children | 222 (96.1%) | 9 (3.9%) |
| 3 or 4 Children | 54 (100.0%) | 0 (0.0%) |
| 5 or more Children | 0 (0.0%) | 0 (0.0%) |
| Total | 791 (94.6%) | 45 (5.4%) |
Income Below Poverty Among Single-Parent Households in Bessemer City
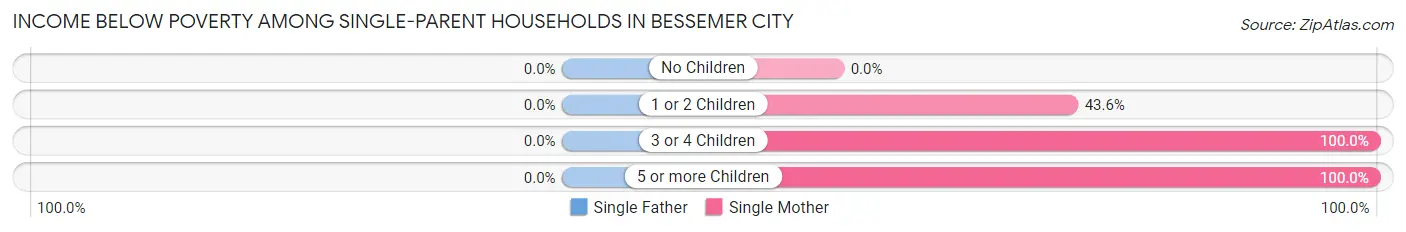
| Children | Single Father | Single Mother |
| No Children | 0 (0.0%) | 0 (0.0%) |
| 1 or 2 Children | 0 (0.0%) | 51 (43.6%) |
| 3 or 4 Children | 0 (0.0%) | 10 (100.0%) |
| 5 or more Children | 0 (0.0%) | 4 (100.0%) |
| Total | 0 (0.0%) | 65 (17.5%) |
Income Below Poverty Among Married-Couple vs Single-Parent Households in Bessemer City
The poverty data for Bessemer City shows that 45 of the married-couple family households (5.4%) and 65 of the single-parent households (13.5%) are living below the poverty level. Within the married-couple family households, those with no children have the highest poverty rate, with 36 households (6.5%) falling below the poverty line. Among the single-parent households, those with 3 or 4 children have the highest poverty rate, with 10 household (100.0%) living below poverty.
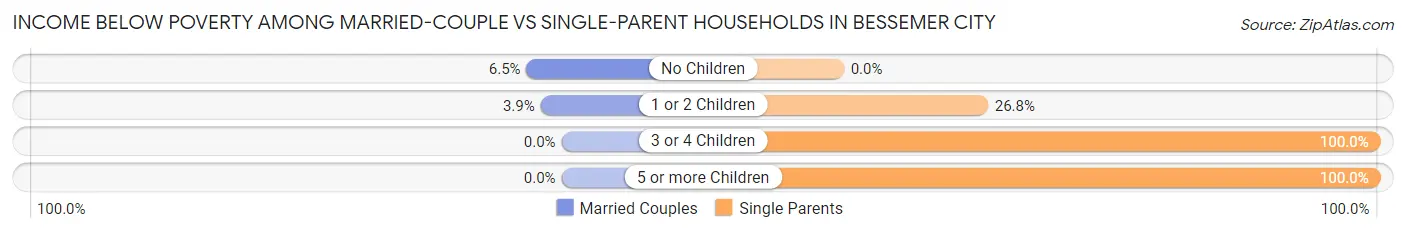
| Children | Married-Couple Families | Single-Parent Households |
| No Children | 36 (6.5%) | 0 (0.0%) |
| 1 or 2 Children | 9 (3.9%) | 51 (26.8%) |
| 3 or 4 Children | 0 (0.0%) | 10 (100.0%) |
| 5 or more Children | 0 (0.0%) | 4 (100.0%) |
| Total | 45 (5.4%) | 65 (13.5%) |
Race in Bessemer City
The most populous races in Bessemer City are White / Caucasian (4,445 | 81.2%), Black / African American (553 | 10.1%), and Hispanic or Latino (477 | 8.7%).
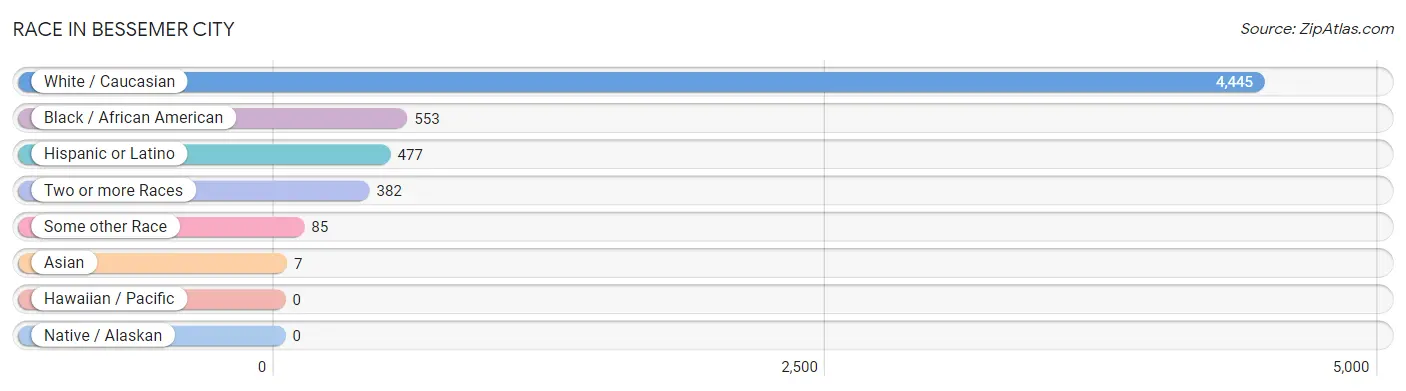
| Race | # Population | % Population |
| Asian | 7 | 0.1% |
| Black / African American | 553 | 10.1% |
| Hawaiian / Pacific | 0 | 0.0% |
| Hispanic or Latino | 477 | 8.7% |
| Native / Alaskan | 0 | 0.0% |
| White / Caucasian | 4,445 | 81.2% |
| Two or more Races | 382 | 7.0% |
| Some other Race | 85 | 1.5% |
| Total | 5,472 | 100.0% |
Ancestry in Bessemer City
The most populous ancestries reported in Bessemer City are American (1,311 | 24.0%), English (642 | 11.7%), German (515 | 9.4%), Mexican (288 | 5.3%), and Irish (274 | 5.0%), together accounting for 55.4% of all Bessemer City residents.
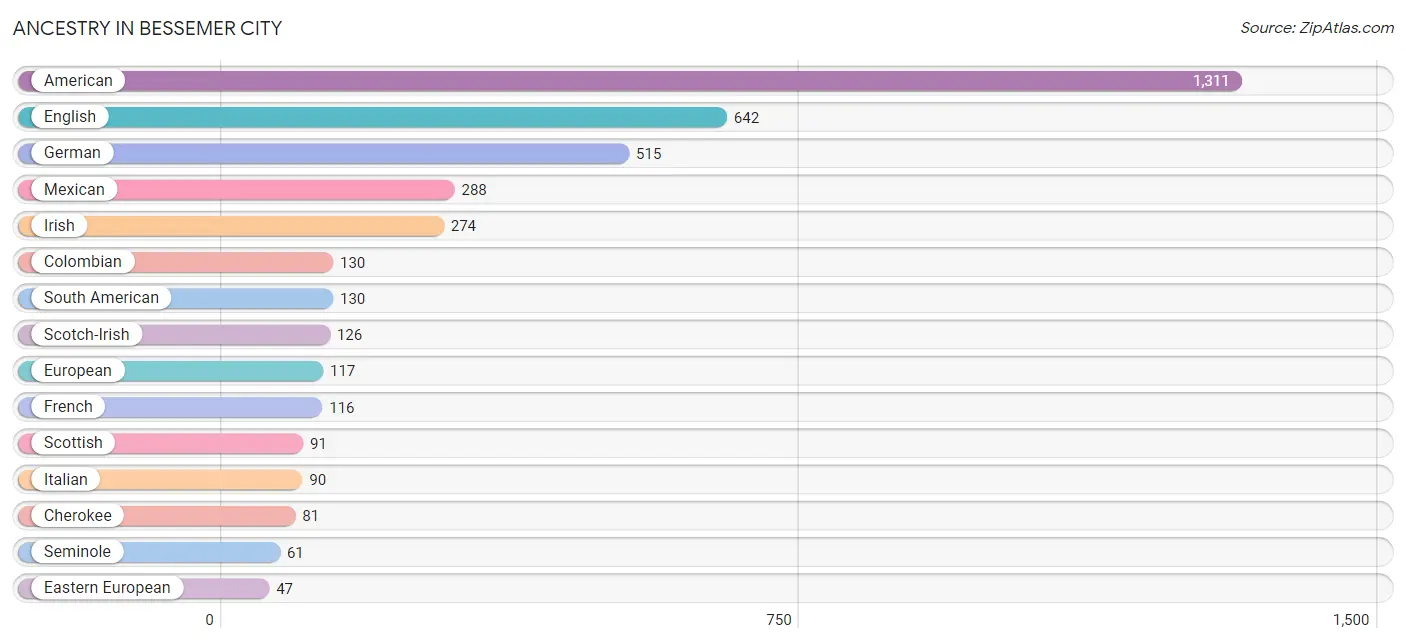
| Ancestry | # Population | % Population |
| American | 1,311 | 24.0% |
| Armenian | 12 | 0.2% |
| Bhutanese | 9 | 0.2% |
| Blackfeet | 7 | 0.1% |
| British | 18 | 0.3% |
| Burmese | 11 | 0.2% |
| Central American | 46 | 0.8% |
| Cherokee | 81 | 1.5% |
| Colombian | 130 | 2.4% |
| Costa Rican | 46 | 0.8% |
| Dutch | 21 | 0.4% |
| Eastern European | 47 | 0.9% |
| English | 642 | 11.7% |
| European | 117 | 2.1% |
| French | 116 | 2.1% |
| German | 515 | 9.4% |
| Hungarian | 4 | 0.1% |
| Irish | 274 | 5.0% |
| Italian | 90 | 1.6% |
| Korean | 7 | 0.1% |
| Mexican | 288 | 5.3% |
| Norwegian | 11 | 0.2% |
| Polish | 36 | 0.7% |
| Puerto Rican | 13 | 0.2% |
| Scandinavian | 39 | 0.7% |
| Scotch-Irish | 126 | 2.3% |
| Scottish | 91 | 1.7% |
| Seminole | 61 | 1.1% |
| South American | 130 | 2.4% |
| Welsh | 27 | 0.5% | View All 30 Rows |
Immigrants in Bessemer City
The most numerous immigrant groups reported in Bessemer City came from Central America (98 | 1.8%), Latin America (98 | 1.8%), Mexico (98 | 1.8%), Europe (28 | 0.5%), and Germany (23 | 0.4%), together accounting for 6.3% of all Bessemer City residents.
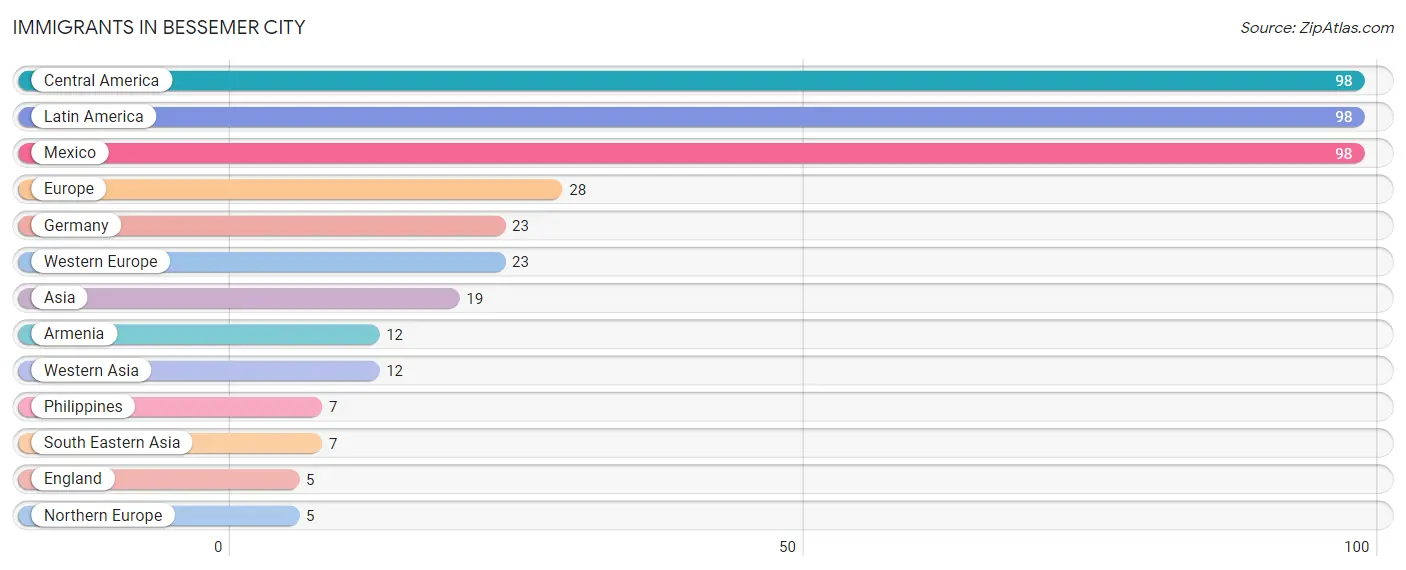
| Immigration Origin | # Population | % Population |
| Armenia | 12 | 0.2% |
| Asia | 19 | 0.4% |
| Central America | 98 | 1.8% |
| England | 5 | 0.1% |
| Europe | 28 | 0.5% |
| Germany | 23 | 0.4% |
| Latin America | 98 | 1.8% |
| Mexico | 98 | 1.8% |
| Northern Europe | 5 | 0.1% |
| Philippines | 7 | 0.1% |
| South Eastern Asia | 7 | 0.1% |
| Western Asia | 12 | 0.2% |
| Western Europe | 23 | 0.4% | View All 13 Rows |
Sex and Age in Bessemer City
Sex and Age in Bessemer City
The most populous age groups in Bessemer City are 25 to 29 Years (413 | 14.7%) for men and 45 to 49 Years (408 | 15.3%) for women.
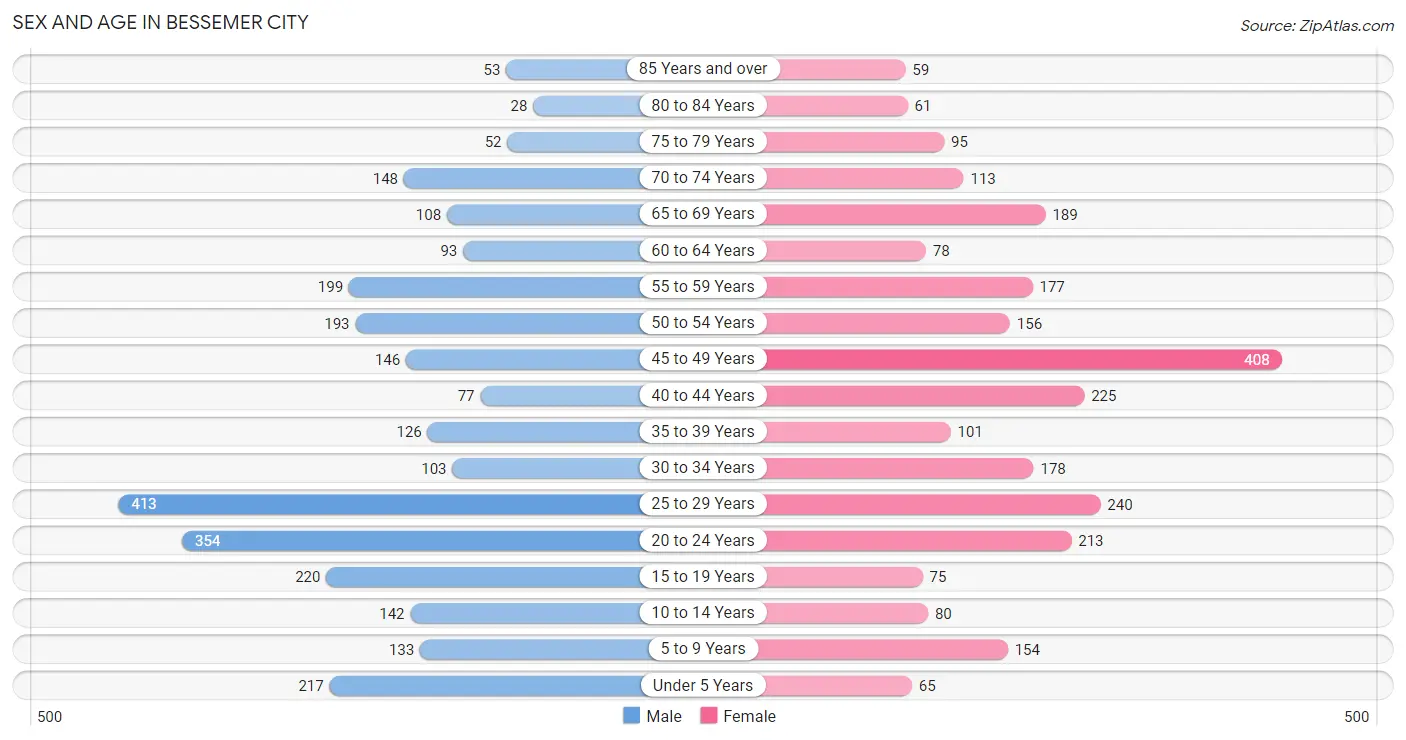
| Age Bracket | Male | Female |
| Under 5 Years | 217 (7.7%) | 65 (2.4%) |
| 5 to 9 Years | 133 (4.7%) | 154 (5.8%) |
| 10 to 14 Years | 142 (5.1%) | 80 (3.0%) |
| 15 to 19 Years | 220 (7.8%) | 75 (2.8%) |
| 20 to 24 Years | 354 (12.6%) | 213 (8.0%) |
| 25 to 29 Years | 413 (14.7%) | 240 (9.0%) |
| 30 to 34 Years | 103 (3.7%) | 178 (6.7%) |
| 35 to 39 Years | 126 (4.5%) | 101 (3.8%) |
| 40 to 44 Years | 77 (2.8%) | 225 (8.4%) |
| 45 to 49 Years | 146 (5.2%) | 408 (15.3%) |
| 50 to 54 Years | 193 (6.9%) | 156 (5.9%) |
| 55 to 59 Years | 199 (7.1%) | 177 (6.6%) |
| 60 to 64 Years | 93 (3.3%) | 78 (2.9%) |
| 65 to 69 Years | 108 (3.8%) | 189 (7.1%) |
| 70 to 74 Years | 148 (5.3%) | 113 (4.2%) |
| 75 to 79 Years | 52 (1.8%) | 95 (3.6%) |
| 80 to 84 Years | 28 (1.0%) | 61 (2.3%) |
| 85 Years and over | 53 (1.9%) | 59 (2.2%) |
| Total | 2,805 (100.0%) | 2,667 (100.0%) |
Families and Households in Bessemer City
Median Family Size in Bessemer City
The median family size in Bessemer City is 3.16 persons per family, with single female/mother families (372 | 28.2%) accounting for the largest median family size of 3.76 persons per family. On the other hand, married-couple families (836 | 63.4%) represent the smallest median family size with 2.92 persons per family.
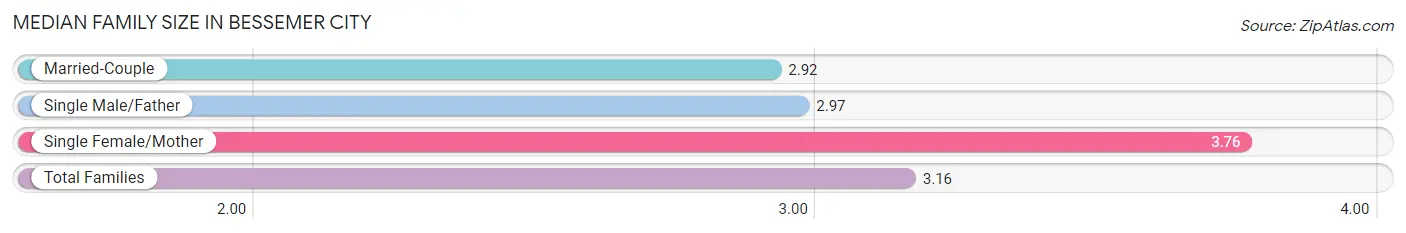
| Family Type | # Families | Family Size |
| Married-Couple | 836 (63.4%) | 2.92 |
| Single Male/Father | 111 (8.4%) | 2.97 |
| Single Female/Mother | 372 (28.2%) | 3.76 |
| Total Families | 1,319 (100.0%) | 3.16 |
Median Household Size in Bessemer City
The median household size in Bessemer City is 2.50 persons per household, with single female/mother households (372 | 17.1%) accounting for the largest median household size of 3.96 persons per household. non-family households (862 | 39.5%) represent the smallest median household size with 1.12 persons per household.
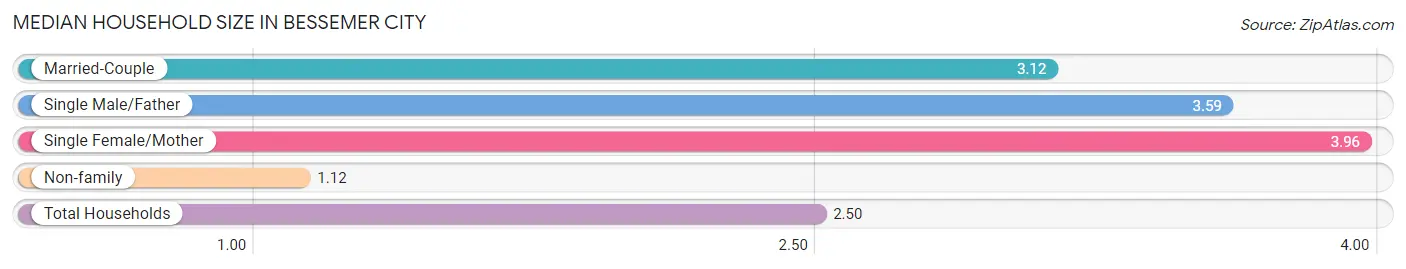
| Household Type | # Households | Household Size |
| Married-Couple | 836 (38.3%) | 3.12 |
| Single Male/Father | 111 (5.1%) | 3.59 |
| Single Female/Mother | 372 (17.1%) | 3.96 |
| Non-family | 862 (39.5%) | 1.12 |
| Total Households | 2,181 (100.0%) | 2.50 |
Household Size by Marriage Status in Bessemer City
Out of a total of 2,181 households in Bessemer City, 1,319 (60.5%) are family households, while 862 (39.5%) are nonfamily households. The most numerous type of family households are 2-person households, comprising 491, and the most common type of nonfamily households are 1-person households, comprising 792.
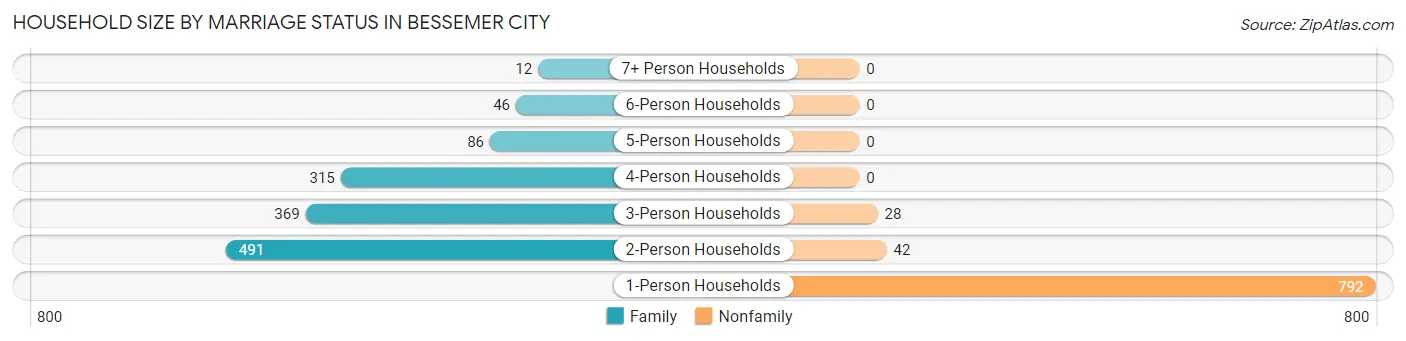
| Household Size | Family Households | Nonfamily Households |
| 1-Person Households | - | 792 (36.3%) |
| 2-Person Households | 491 (22.5%) | 42 (1.9%) |
| 3-Person Households | 369 (16.9%) | 28 (1.3%) |
| 4-Person Households | 315 (14.4%) | 0 (0.0%) |
| 5-Person Households | 86 (3.9%) | 0 (0.0%) |
| 6-Person Households | 46 (2.1%) | 0 (0.0%) |
| 7+ Person Households | 12 (0.5%) | 0 (0.0%) |
| Total | 1,319 (60.5%) | 862 (39.5%) |
Female Fertility in Bessemer City
Fertility by Age in Bessemer City
Average fertility rate in Bessemer City is 6.0 births per 1,000 women. Women in the age bracket of 35 to 50 years have the highest fertility rate with 11.0 births per 1,000 women. Women in the age bracket of 35 to 50 years acount for 100.0% of all women with births.
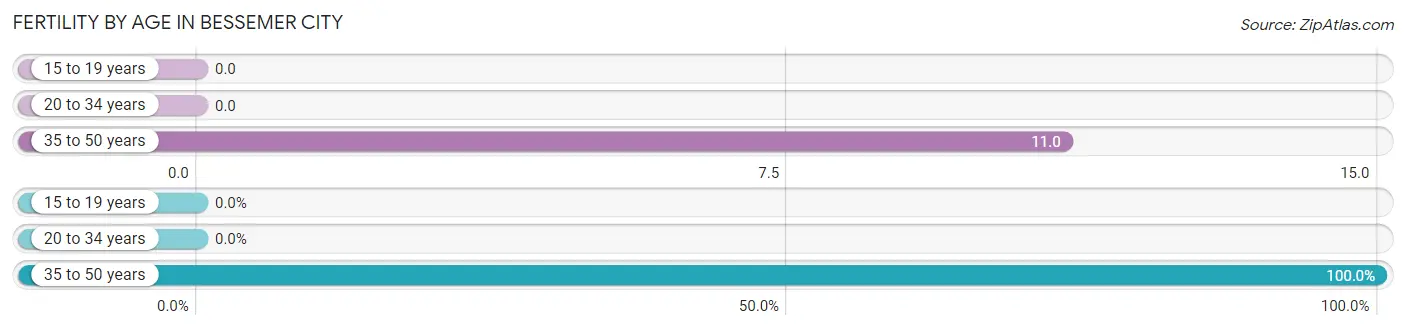
| Age Bracket | Women with Births | Births / 1,000 Women |
| 15 to 19 years | 0 (0.0%) | 0.0 |
| 20 to 34 years | 0 (0.0%) | 0.0 |
| 35 to 50 years | 9 (100.0%) | 11.0 |
| Total | 9 (100.0%) | 6.0 |
Fertility by Age by Marriage Status in Bessemer City
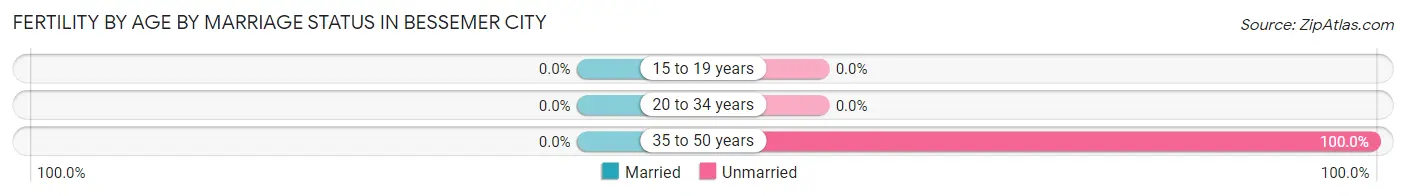
| Age Bracket | Married | Unmarried |
| 15 to 19 years | 0 (0.0%) | 0 (0.0%) |
| 20 to 34 years | 0 (0.0%) | 0 (0.0%) |
| 35 to 50 years | 0 (0.0%) | 9 (100.0%) |
| Total | 0 (0.0%) | 9 (100.0%) |
Fertility by Education in Bessemer City
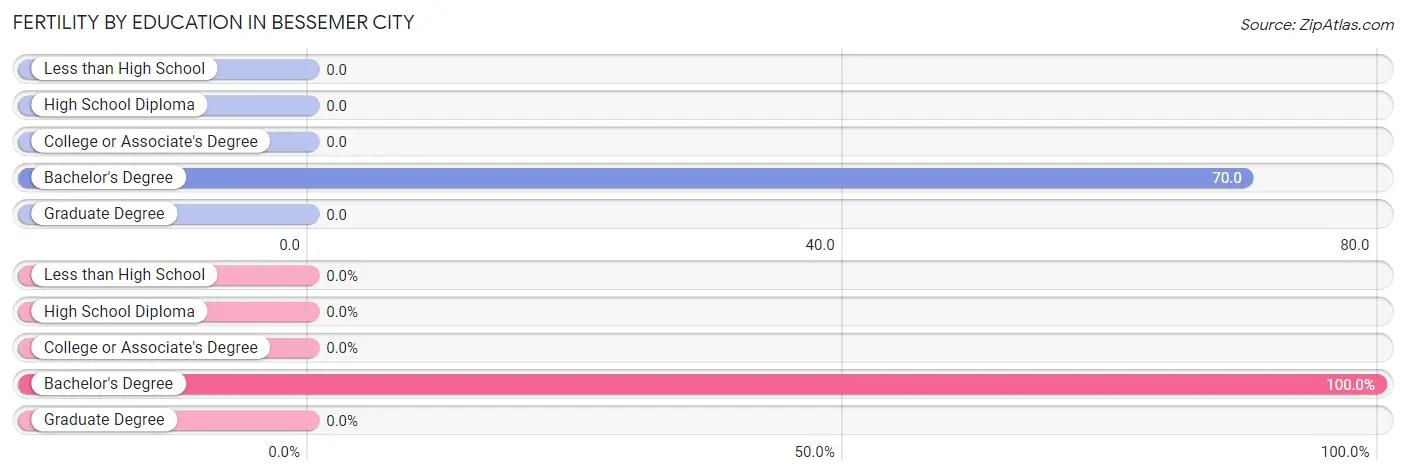
| Educational Attainment | Women with Births | Births / 1,000 Women |
| Less than High School | 0 (0.0%) | 0.0 |
| High School Diploma | 0 (0.0%) | 0.0 |
| College or Associate's Degree | 0 (0.0%) | 0.0 |
| Bachelor's Degree | 9 (100.0%) | 70.0 |
| Graduate Degree | 0 (0.0%) | 0.0 |
| Total | 9 (100.0%) | 6.0 |
Fertility by Education by Marriage Status in Bessemer City
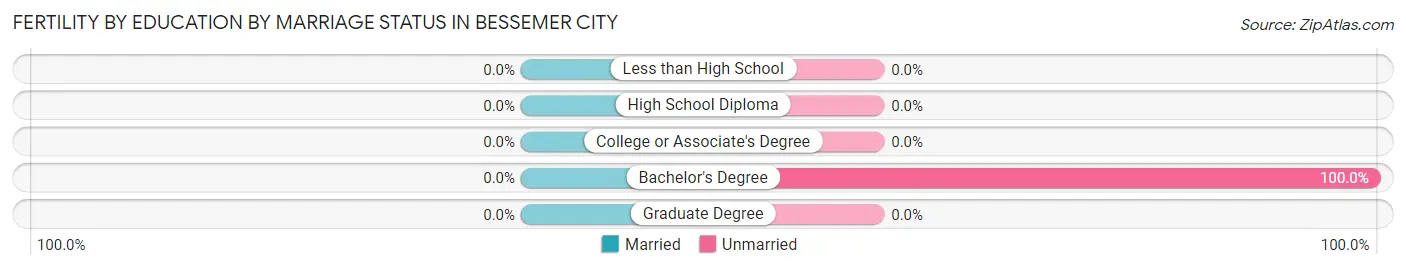
| Educational Attainment | Married | Unmarried |
| Less than High School | 0 (0.0%) | 0 (0.0%) |
| High School Diploma | 0 (0.0%) | 0 (0.0%) |
| College or Associate's Degree | 0 (0.0%) | 0 (0.0%) |
| Bachelor's Degree | 0 (0.0%) | 9 (100.0%) |
| Graduate Degree | 0 (0.0%) | 0 (0.0%) |
| Total | 0 (0.0%) | 9 (100.0%) |
Employment Characteristics in Bessemer City
Employment by Class of Employer in Bessemer City
Among the 2,605 employed individuals in Bessemer City, private company employees (2,207 | 84.7%), not-for-profit organizations (132 | 5.1%), and local government employees (120 | 4.6%) make up the most common classes of employment.
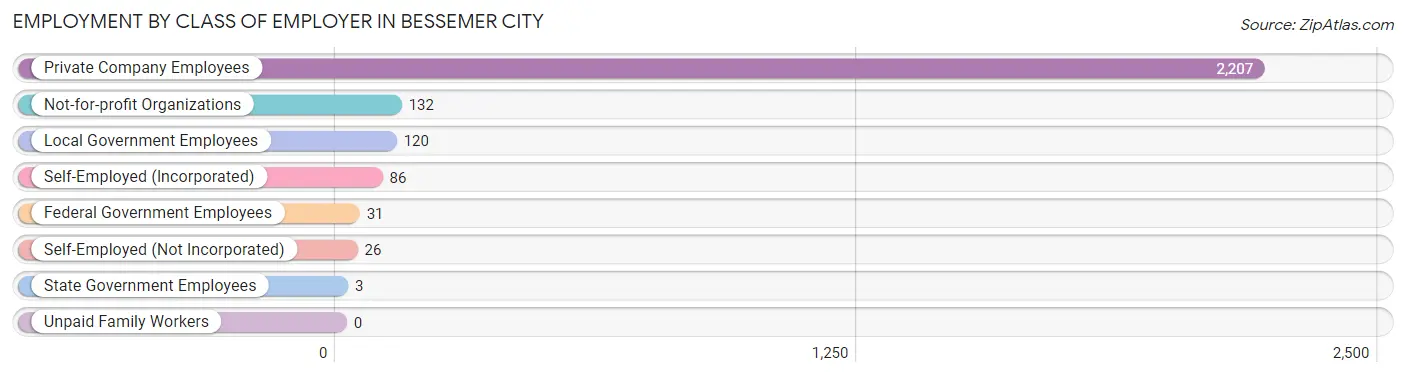
| Employer Class | # Employees | % Employees |
| Private Company Employees | 2,207 | 84.7% |
| Self-Employed (Incorporated) | 86 | 3.3% |
| Self-Employed (Not Incorporated) | 26 | 1.0% |
| Not-for-profit Organizations | 132 | 5.1% |
| Local Government Employees | 120 | 4.6% |
| State Government Employees | 3 | 0.1% |
| Federal Government Employees | 31 | 1.2% |
| Unpaid Family Workers | 0 | 0.0% |
| Total | 2,605 | 100.0% |
Employment Status by Age in Bessemer City
According to the labor force statistics for Bessemer City, out of the total population over 16 years of age (4,644), 62.0% or 2,879 individuals are in the labor force, with 6.1% or 176 of them unemployed. The age group with the highest labor force participation rate is 25 to 29 years, with 91.7% or 599 individuals in the labor force. Within the labor force, the 30 to 34 years age range has the highest percentage of unemployed individuals, with 45.1% or 65 of them being unemployed.
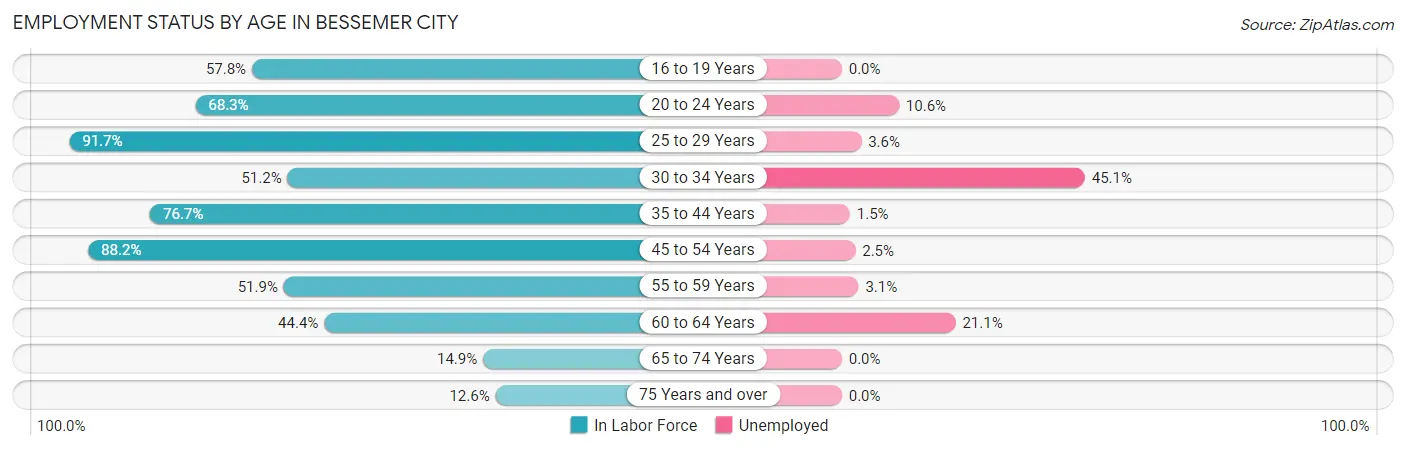
| Age Bracket | In Labor Force | Unemployed |
| 16 to 19 Years | 149 (57.8%) | 0 (0.0%) |
| 20 to 24 Years | 387 (68.3%) | 41 (10.6%) |
| 25 to 29 Years | 599 (91.7%) | 22 (3.6%) |
| 30 to 34 Years | 144 (51.2%) | 65 (45.1%) |
| 35 to 44 Years | 406 (76.7%) | 6 (1.5%) |
| 45 to 54 Years | 796 (88.2%) | 20 (2.5%) |
| 55 to 59 Years | 195 (51.9%) | 6 (3.1%) |
| 60 to 64 Years | 76 (44.4%) | 16 (21.1%) |
| 65 to 74 Years | 83 (14.9%) | 0 (0.0%) |
| 75 Years and over | 44 (12.6%) | 0 (0.0%) |
| Total | 2,879 (62.0%) | 176 (6.1%) |
Employment Status by Educational Attainment in Bessemer City
According to labor force statistics for Bessemer City, 76.1% of individuals (2,217) out of the total population between 25 and 64 years of age (2,913) are in the labor force, with 6.1% or 135 of them being unemployed. The group with the highest labor force participation rate are those with the educational attainment of college / associate degree, with 92.6% or 801 individuals in the labor force. Within the labor force, individuals with less than high school education have the highest percentage of unemployment, with 9.8% or 38 of them being unemployed.
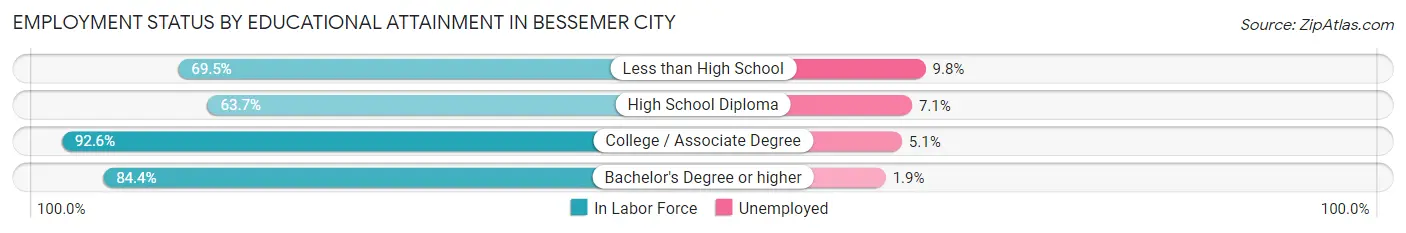
| Educational Attainment | In Labor Force | Unemployed |
| Less than High School | 387 (69.5%) | 55 (9.8%) |
| High School Diploma | 708 (63.7%) | 79 (7.1%) |
| College / Associate Degree | 801 (92.6%) | 44 (5.1%) |
| Bachelor's Degree or higher | 320 (84.4%) | 7 (1.9%) |
| Total | 2,217 (76.1%) | 178 (6.1%) |
Employment Occupations by Sex in Bessemer City
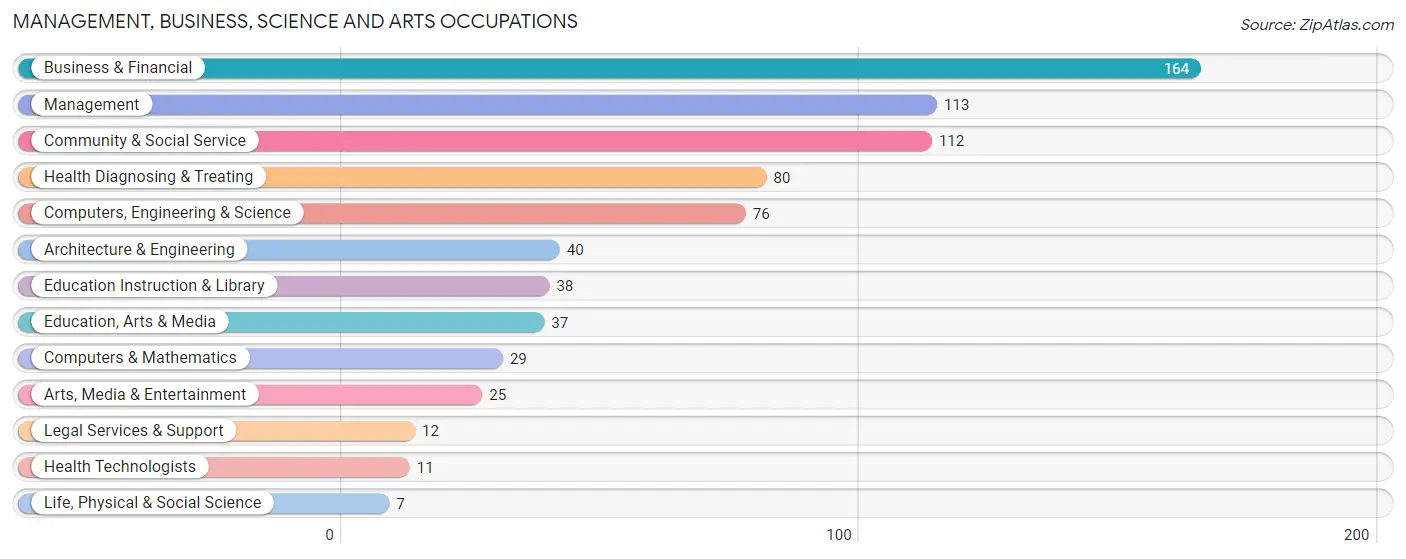
Management, Business, Science and Arts Occupations
The most common Management, Business, Science and Arts occupations in Bessemer City are Business & Financial (164 | 6.1%), Management (113 | 4.2%), Community & Social Service (112 | 4.2%), Health Diagnosing & Treating (80 | 3.0%), and Computers, Engineering & Science (76 | 2.8%).
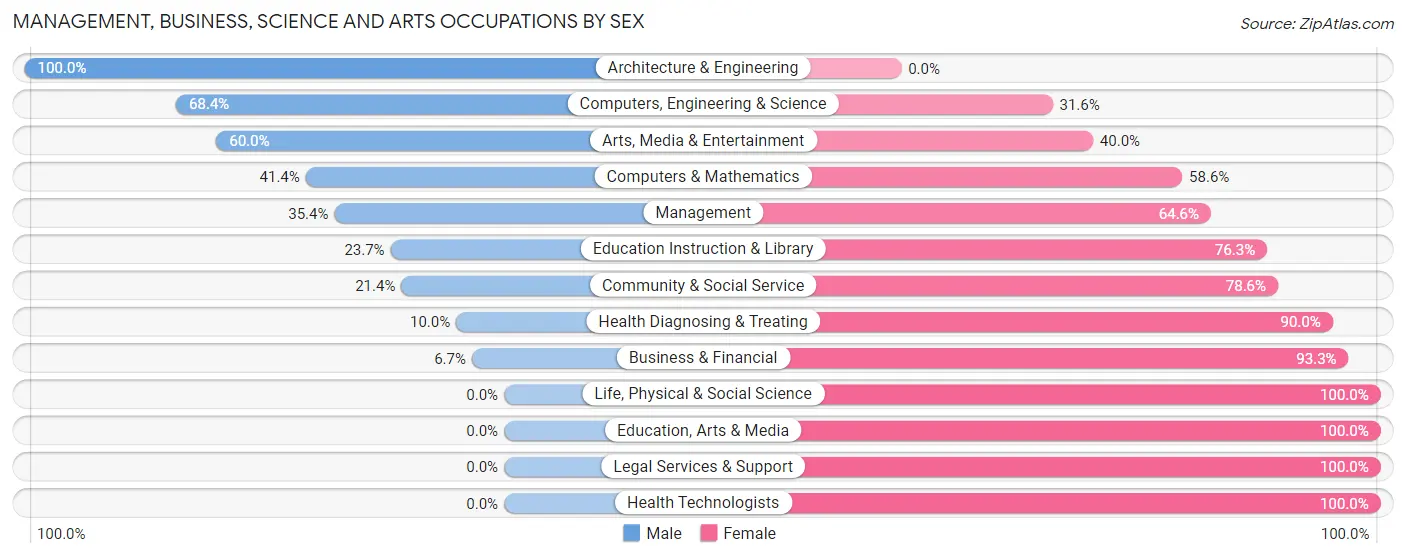
Management, Business, Science and Arts Occupations by Sex
Within the Management, Business, Science and Arts occupations in Bessemer City, the most male-oriented occupations are Architecture & Engineering (100.0%), Computers, Engineering & Science (68.4%), and Arts, Media & Entertainment (60.0%), while the most female-oriented occupations are Life, Physical & Social Science (100.0%), Education, Arts & Media (100.0%), and Legal Services & Support (100.0%).
| Occupation | Male | Female |
| Management | 40 (35.4%) | 73 (64.6%) |
| Business & Financial | 11 (6.7%) | 153 (93.3%) |
| Computers, Engineering & Science | 52 (68.4%) | 24 (31.6%) |
| Computers & Mathematics | 12 (41.4%) | 17 (58.6%) |
| Architecture & Engineering | 40 (100.0%) | 0 (0.0%) |
| Life, Physical & Social Science | 0 (0.0%) | 7 (100.0%) |
| Community & Social Service | 24 (21.4%) | 88 (78.6%) |
| Education, Arts & Media | 0 (0.0%) | 37 (100.0%) |
| Legal Services & Support | 0 (0.0%) | 12 (100.0%) |
| Education Instruction & Library | 9 (23.7%) | 29 (76.3%) |
| Arts, Media & Entertainment | 15 (60.0%) | 10 (40.0%) |
| Health Diagnosing & Treating | 8 (10.0%) | 72 (90.0%) |
| Health Technologists | 0 (0.0%) | 11 (100.0%) |
| Total (Category) | 135 (24.8%) | 410 (75.2%) |
| Total (Overall) | 1,396 (51.9%) | 1,293 (48.1%) |
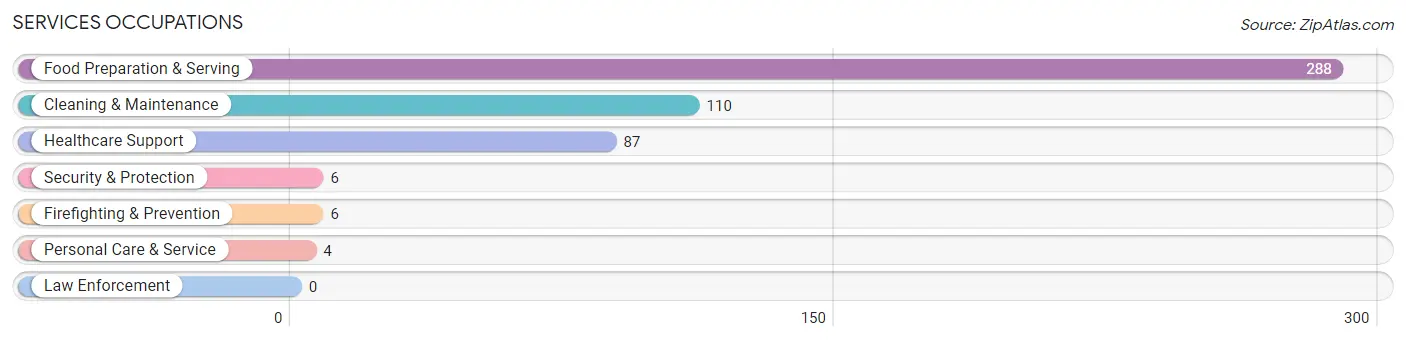
Services Occupations
The most common Services occupations in Bessemer City are Food Preparation & Serving (288 | 10.7%), Cleaning & Maintenance (110 | 4.1%), Healthcare Support (87 | 3.2%), Security & Protection (6 | 0.2%), and Firefighting & Prevention (6 | 0.2%).
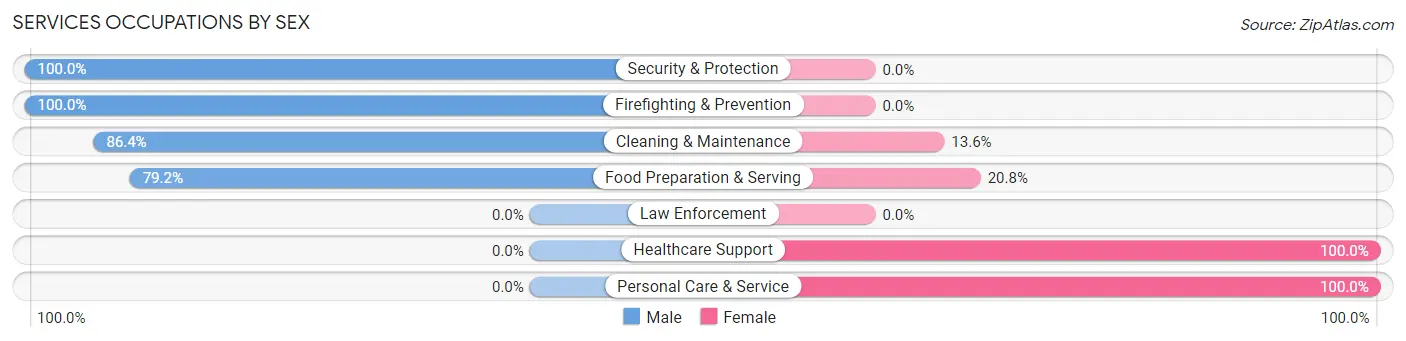
Services Occupations by Sex
Within the Services occupations in Bessemer City, the most male-oriented occupations are Security & Protection (100.0%), Firefighting & Prevention (100.0%), and Cleaning & Maintenance (86.4%), while the most female-oriented occupations are Healthcare Support (100.0%), Personal Care & Service (100.0%), and Food Preparation & Serving (20.8%).
| Occupation | Male | Female |
| Healthcare Support | 0 (0.0%) | 87 (100.0%) |
| Security & Protection | 6 (100.0%) | 0 (0.0%) |
| Firefighting & Prevention | 6 (100.0%) | 0 (0.0%) |
| Law Enforcement | 0 (0.0%) | 0 (0.0%) |
| Food Preparation & Serving | 228 (79.2%) | 60 (20.8%) |
| Cleaning & Maintenance | 95 (86.4%) | 15 (13.6%) |
| Personal Care & Service | 0 (0.0%) | 4 (100.0%) |
| Total (Category) | 329 (66.5%) | 166 (33.5%) |
| Total (Overall) | 1,396 (51.9%) | 1,293 (48.1%) |
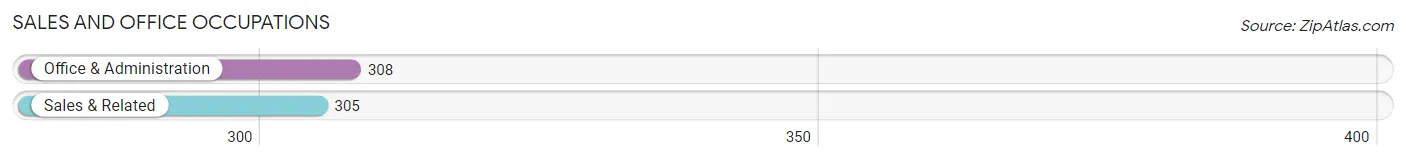
Sales and Office Occupations
The most common Sales and Office occupations in Bessemer City are Office & Administration (308 | 11.5%), and Sales & Related (305 | 11.3%).
Sales and Office Occupations by Sex
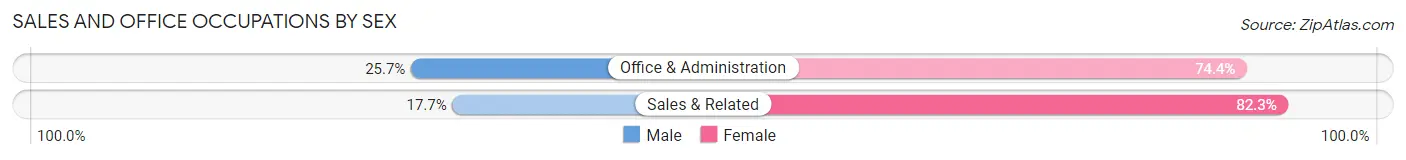
| Occupation | Male | Female |
| Sales & Related | 54 (17.7%) | 251 (82.3%) |
| Office & Administration | 79 (25.7%) | 229 (74.4%) |
| Total (Category) | 133 (21.7%) | 480 (78.3%) |
| Total (Overall) | 1,396 (51.9%) | 1,293 (48.1%) |
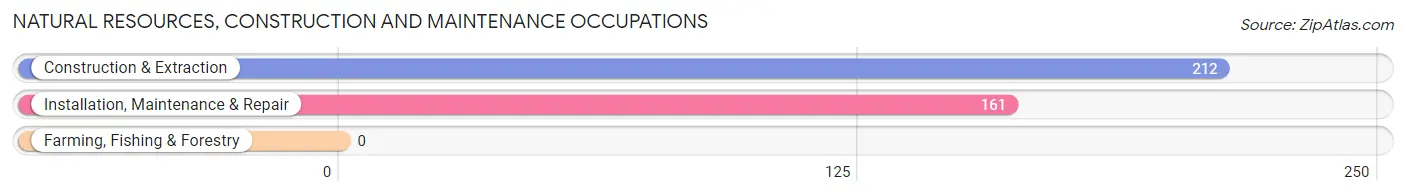
Natural Resources, Construction and Maintenance Occupations
The most common Natural Resources, Construction and Maintenance occupations in Bessemer City are Construction & Extraction (212 | 7.9%), and Installation, Maintenance & Repair (161 | 6.0%).
Natural Resources, Construction and Maintenance Occupations by Sex
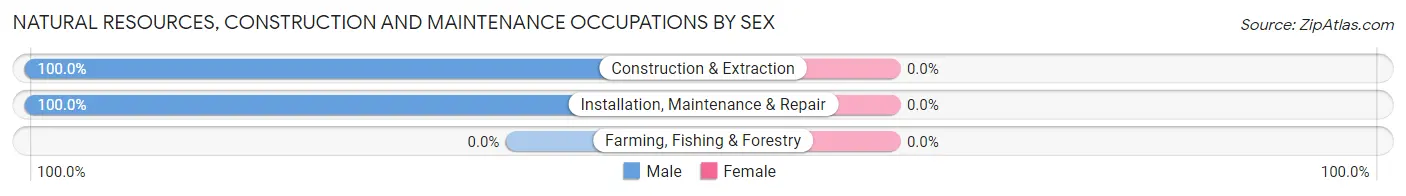
| Occupation | Male | Female |
| Farming, Fishing & Forestry | 0 (0.0%) | 0 (0.0%) |
| Construction & Extraction | 212 (100.0%) | 0 (0.0%) |
| Installation, Maintenance & Repair | 161 (100.0%) | 0 (0.0%) |
| Total (Category) | 373 (100.0%) | 0 (0.0%) |
| Total (Overall) | 1,396 (51.9%) | 1,293 (48.1%) |
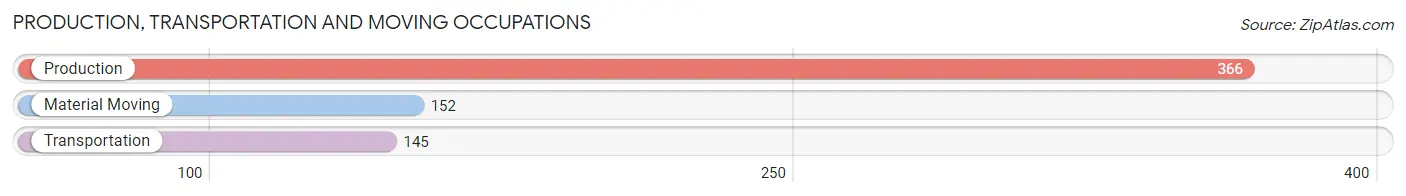
Production, Transportation and Moving Occupations
The most common Production, Transportation and Moving occupations in Bessemer City are Production (366 | 13.6%), Material Moving (152 | 5.7%), and Transportation (145 | 5.4%).
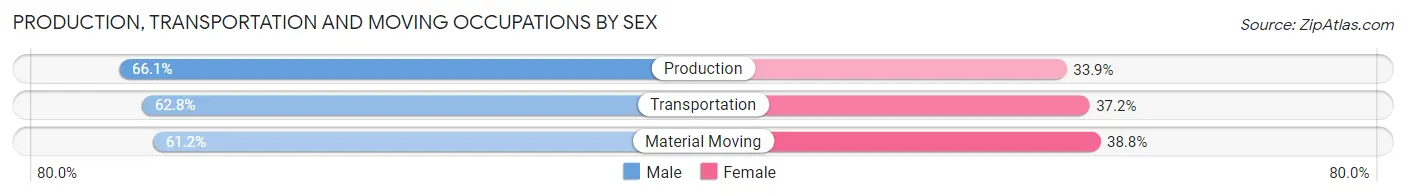
Production, Transportation and Moving Occupations by Sex
| Occupation | Male | Female |
| Production | 242 (66.1%) | 124 (33.9%) |
| Transportation | 91 (62.8%) | 54 (37.2%) |
| Material Moving | 93 (61.2%) | 59 (38.8%) |
| Total (Category) | 426 (64.2%) | 237 (35.7%) |
| Total (Overall) | 1,396 (51.9%) | 1,293 (48.1%) |
Employment Industries by Sex in Bessemer City
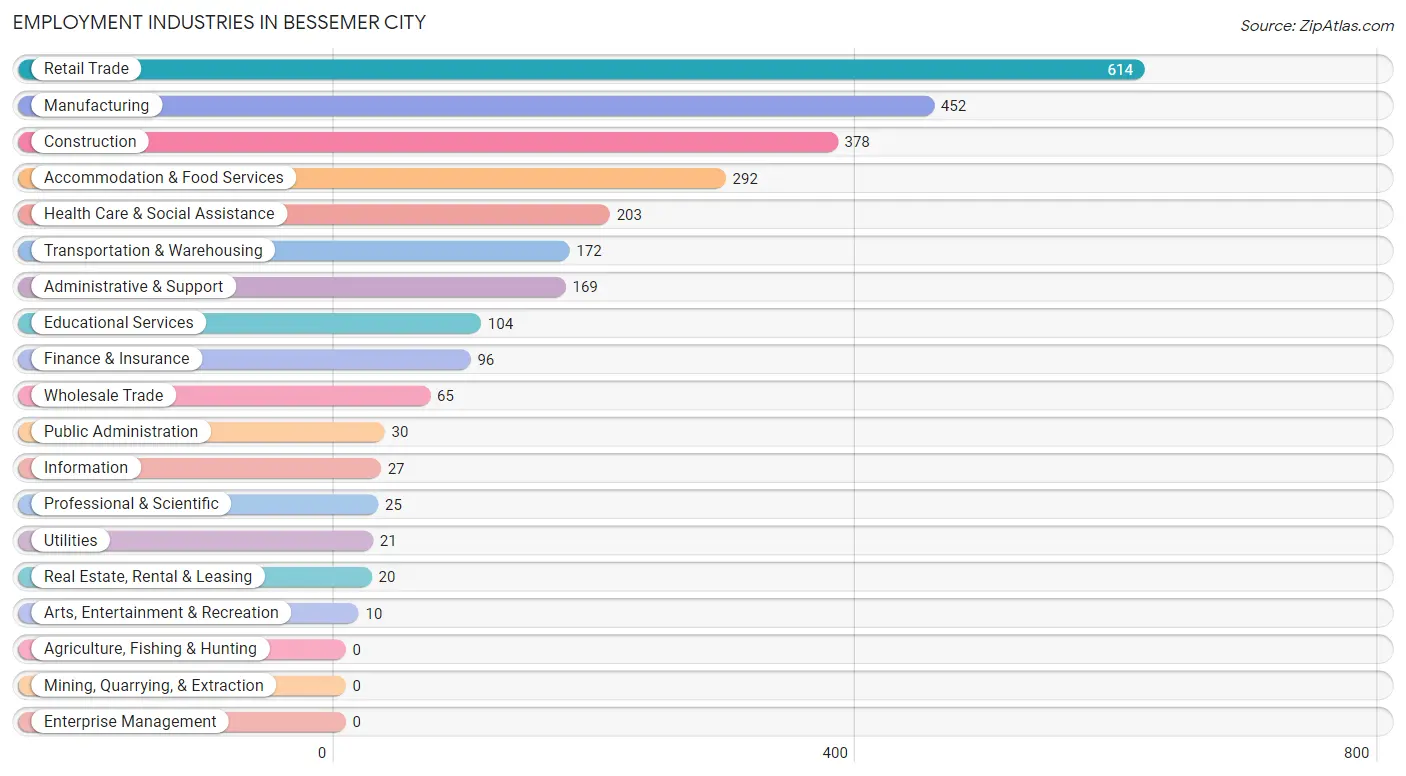
Employment Industries in Bessemer City
The major employment industries in Bessemer City include Retail Trade (614 | 22.8%), Manufacturing (452 | 16.8%), Construction (378 | 14.1%), Accommodation & Food Services (292 | 10.9%), and Health Care & Social Assistance (203 | 7.5%).
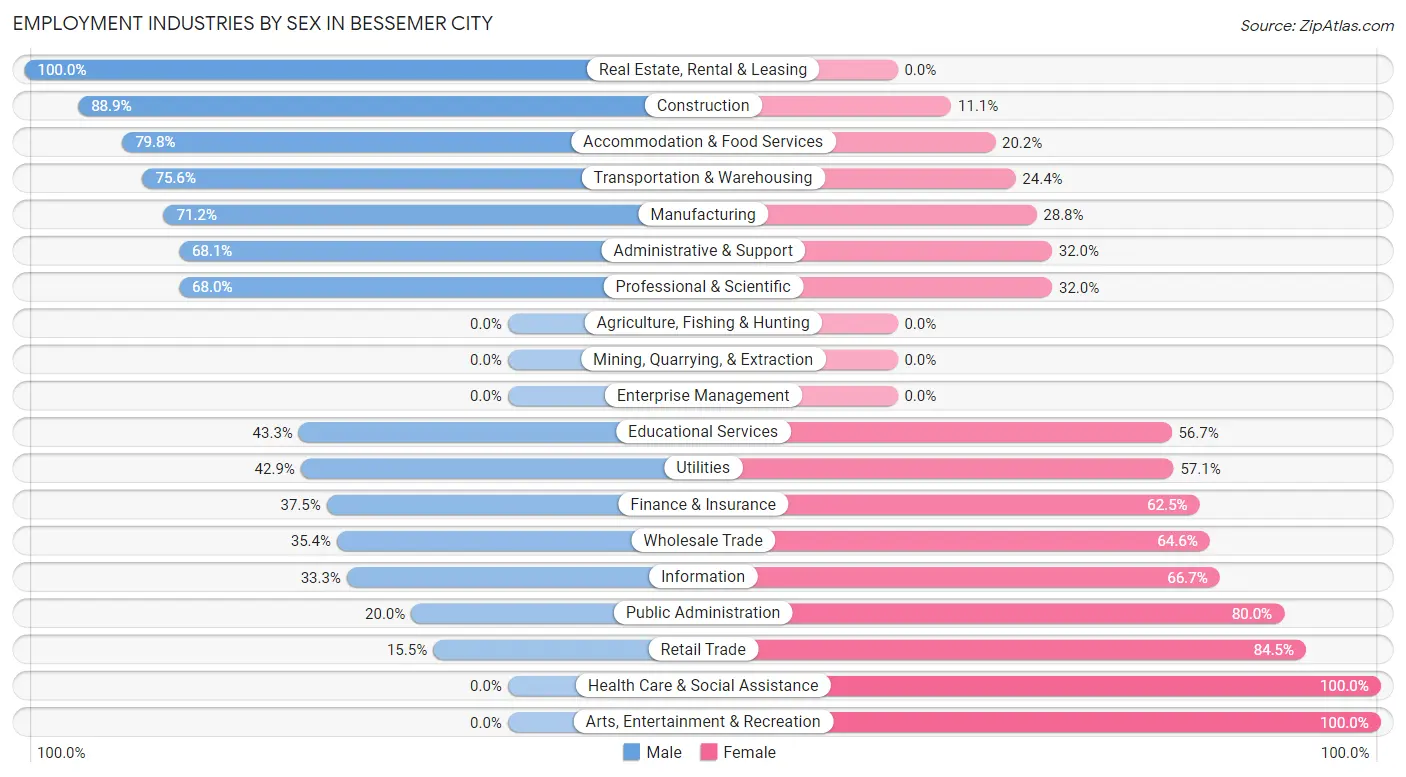
Employment Industries by Sex in Bessemer City
The Bessemer City industries that see more men than women are Real Estate, Rental & Leasing (100.0%), Construction (88.9%), and Accommodation & Food Services (79.8%), whereas the industries that tend to have a higher number of women are Health Care & Social Assistance (100.0%), Arts, Entertainment & Recreation (100.0%), and Retail Trade (84.5%).
| Industry | Male | Female |
| Agriculture, Fishing & Hunting | 0 (0.0%) | 0 (0.0%) |
| Mining, Quarrying, & Extraction | 0 (0.0%) | 0 (0.0%) |
| Construction | 336 (88.9%) | 42 (11.1%) |
| Manufacturing | 322 (71.2%) | 130 (28.8%) |
| Wholesale Trade | 23 (35.4%) | 42 (64.6%) |
| Retail Trade | 95 (15.5%) | 519 (84.5%) |
| Transportation & Warehousing | 130 (75.6%) | 42 (24.4%) |
| Utilities | 9 (42.9%) | 12 (57.1%) |
| Information | 9 (33.3%) | 18 (66.7%) |
| Finance & Insurance | 36 (37.5%) | 60 (62.5%) |
| Real Estate, Rental & Leasing | 20 (100.0%) | 0 (0.0%) |
| Professional & Scientific | 17 (68.0%) | 8 (32.0%) |
| Enterprise Management | 0 (0.0%) | 0 (0.0%) |
| Administrative & Support | 115 (68.0%) | 54 (32.0%) |
| Educational Services | 45 (43.3%) | 59 (56.7%) |
| Health Care & Social Assistance | 0 (0.0%) | 203 (100.0%) |
| Arts, Entertainment & Recreation | 0 (0.0%) | 10 (100.0%) |
| Accommodation & Food Services | 233 (79.8%) | 59 (20.2%) |
| Public Administration | 6 (20.0%) | 24 (80.0%) |
| Total | 1,396 (51.9%) | 1,293 (48.1%) |
Education in Bessemer City
School Enrollment in Bessemer City
The most common levels of schooling among the 774 students in Bessemer City are high school (212 | 27.4%), middle school (184 | 23.8%), and elementary school (114 | 14.7%).
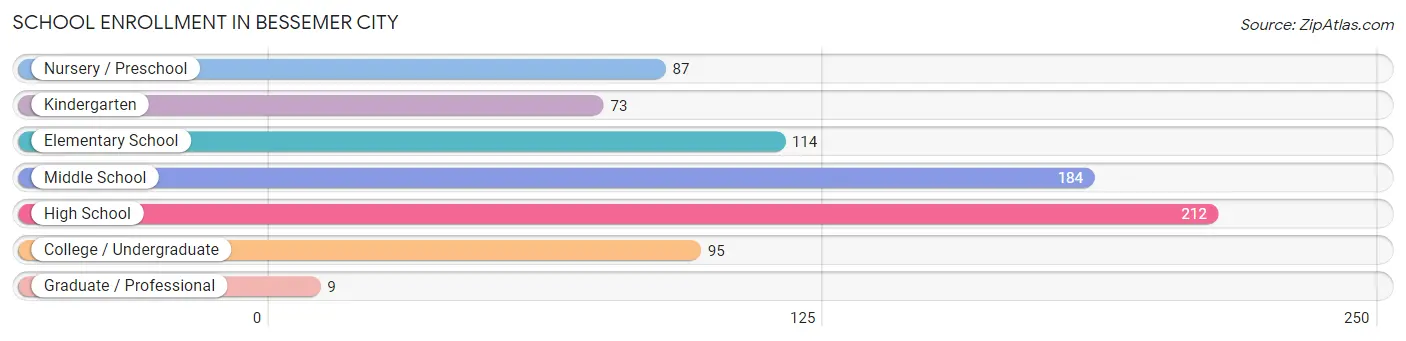
| School Level | # Students | % Students |
| Nursery / Preschool | 87 | 11.2% |
| Kindergarten | 73 | 9.4% |
| Elementary School | 114 | 14.7% |
| Middle School | 184 | 23.8% |
| High School | 212 | 27.4% |
| College / Undergraduate | 95 | 12.3% |
| Graduate / Professional | 9 | 1.2% |
| Total | 774 | 100.0% |
School Enrollment by Age by Funding Source in Bessemer City
Out of a total of 774 students who are enrolled in schools in Bessemer City, 134 (17.3%) attend a private institution, while the remaining 640 (82.7%) are enrolled in public schools. The age group of 3 to 4 year olds has the highest likelihood of being enrolled in private schools, with 7 (100.0% in the age bracket) enrolled. Conversely, the age group of 18 to 19 year olds has the lowest likelihood of being enrolled in a private school, with 95 (100.0% in the age bracket) attending a public institution.
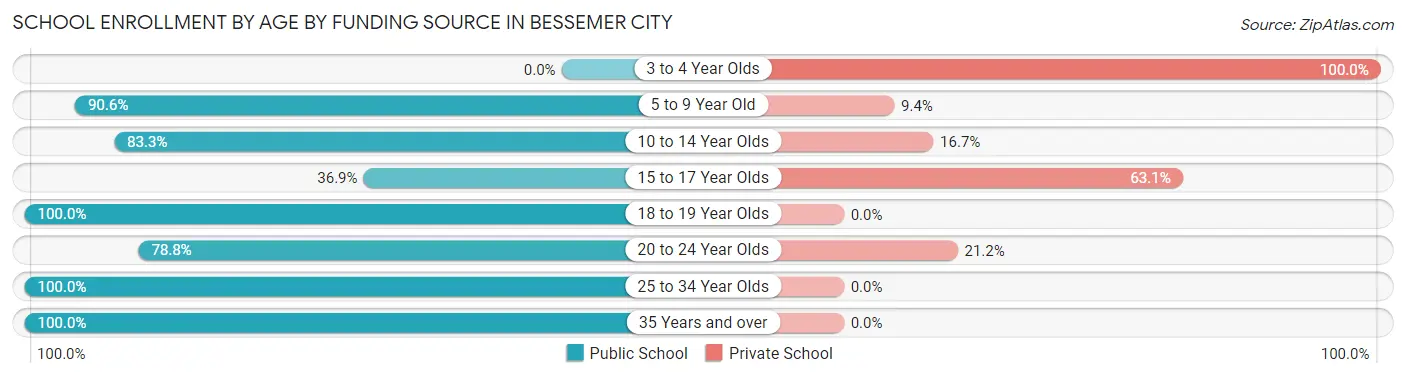
| Age Bracket | Public School | Private School |
| 3 to 4 Year Olds | 0 (0.0%) | 7 (100.0%) |
| 5 to 9 Year Old | 222 (90.6%) | 23 (9.4%) |
| 10 to 14 Year Olds | 185 (83.3%) | 37 (16.7%) |
| 15 to 17 Year Olds | 31 (36.9%) | 53 (63.1%) |
| 18 to 19 Year Olds | 95 (100.0%) | 0 (0.0%) |
| 20 to 24 Year Olds | 52 (78.8%) | 14 (21.2%) |
| 25 to 34 Year Olds | 30 (100.0%) | 0 (0.0%) |
| 35 Years and over | 25 (100.0%) | 0 (0.0%) |
| Total | 640 (82.7%) | 134 (17.3%) |
Educational Attainment by Field of Study in Bessemer City
Business (207 | 37.6%), education (59 | 10.7%), social sciences (45 | 8.2%), physical & health sciences (44 | 8.0%), and computers & mathematics (35 | 6.4%) are the most common fields of study among 550 individuals in Bessemer City who have obtained a bachelor's degree or higher.
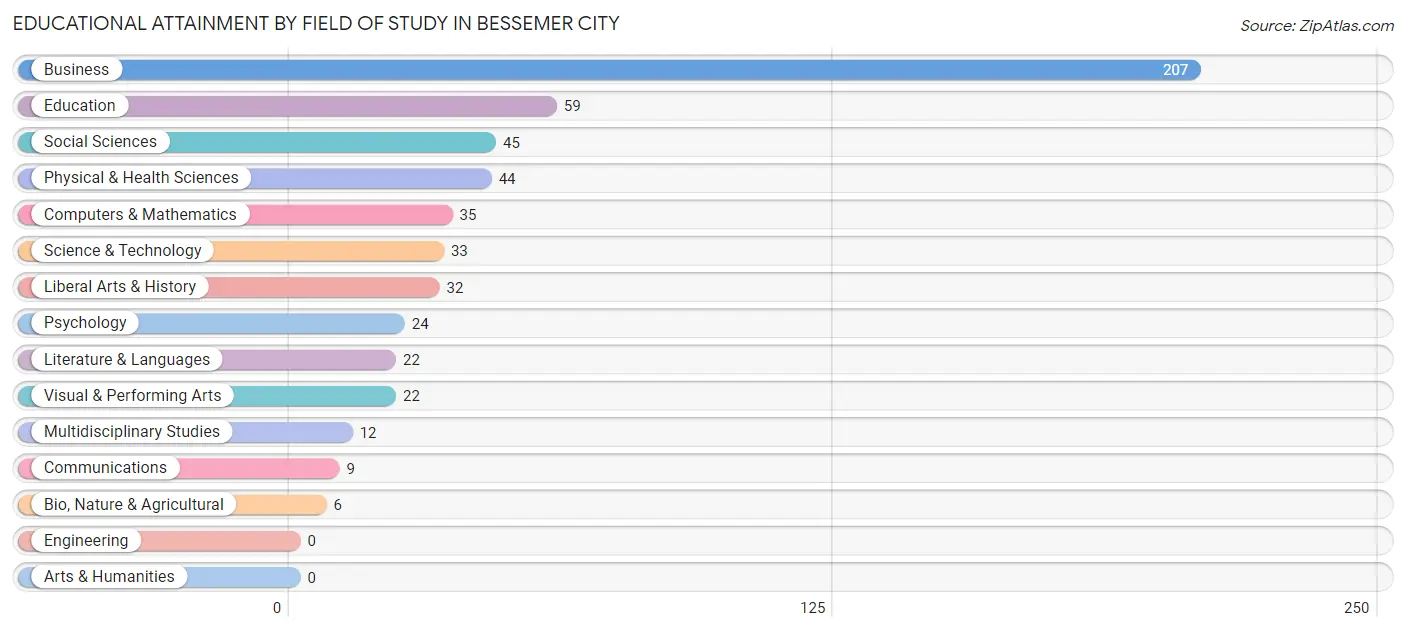
| Field of Study | # Graduates | % Graduates |
| Computers & Mathematics | 35 | 6.4% |
| Bio, Nature & Agricultural | 6 | 1.1% |
| Physical & Health Sciences | 44 | 8.0% |
| Psychology | 24 | 4.4% |
| Social Sciences | 45 | 8.2% |
| Engineering | 0 | 0.0% |
| Multidisciplinary Studies | 12 | 2.2% |
| Science & Technology | 33 | 6.0% |
| Business | 207 | 37.6% |
| Education | 59 | 10.7% |
| Literature & Languages | 22 | 4.0% |
| Liberal Arts & History | 32 | 5.8% |
| Visual & Performing Arts | 22 | 4.0% |
| Communications | 9 | 1.6% |
| Arts & Humanities | 0 | 0.0% |
| Total | 550 | 100.0% |
Transportation & Commute in Bessemer City
Vehicle Availability by Sex in Bessemer City
The most prevalent vehicle ownership categories in Bessemer City are males with 2 vehicles (596, accounting for 44.8%) and females with 2 vehicles (623, making up 46.8%).
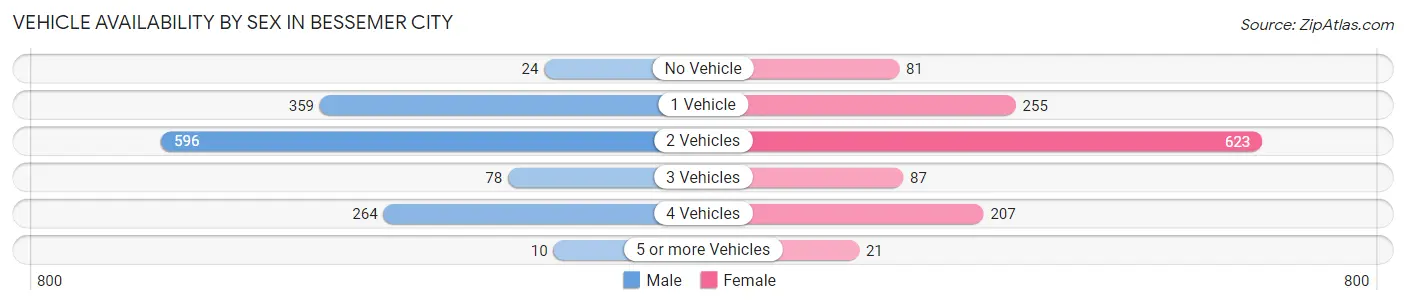
| Vehicles Available | Male | Female |
| No Vehicle | 24 (1.8%) | 81 (6.4%) |
| 1 Vehicle | 359 (27.0%) | 255 (20.0%) |
| 2 Vehicles | 596 (44.8%) | 623 (48.9%) |
| 3 Vehicles | 78 (5.9%) | 87 (6.8%) |
| 4 Vehicles | 264 (19.8%) | 207 (16.3%) |
| 5 or more Vehicles | 10 (0.7%) | 21 (1.7%) |
| Total | 1,331 (100.0%) | 1,274 (100.0%) |
Commute Time in Bessemer City
The most frequently occuring commute durations in Bessemer City are 15 to 19 minutes (695 commuters, 27.7%), 10 to 14 minutes (351 commuters, 14.0%), and 5 to 9 minutes (302 commuters, 12.0%).
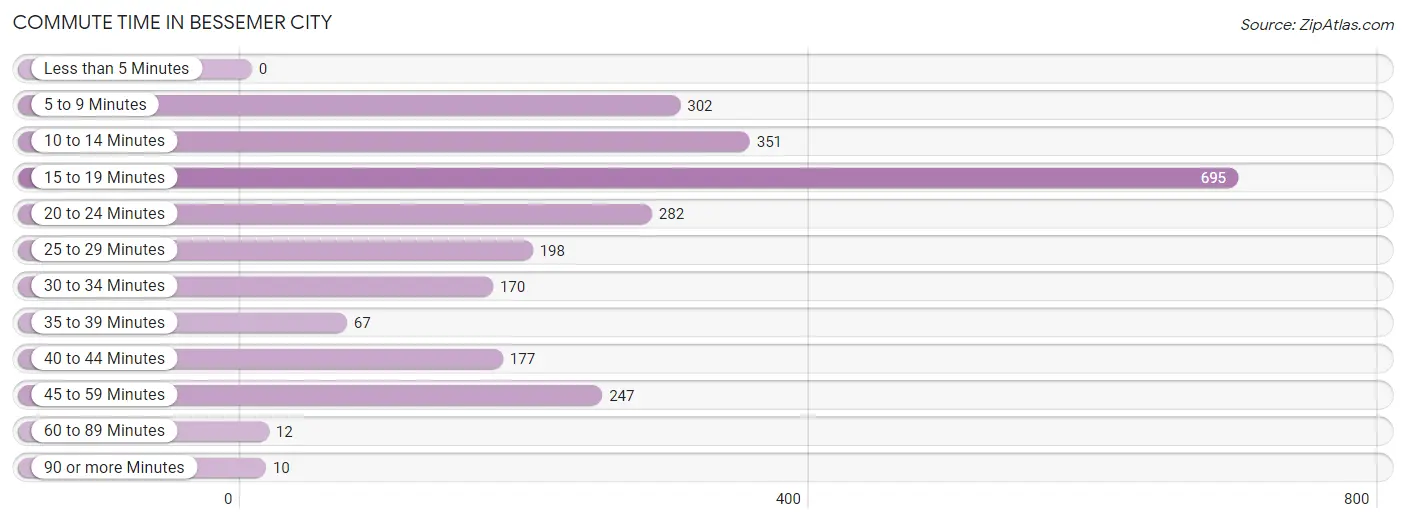
| Commute Time | # Commuters | % Commuters |
| Less than 5 Minutes | 0 | 0.0% |
| 5 to 9 Minutes | 302 | 12.0% |
| 10 to 14 Minutes | 351 | 14.0% |
| 15 to 19 Minutes | 695 | 27.7% |
| 20 to 24 Minutes | 282 | 11.2% |
| 25 to 29 Minutes | 198 | 7.9% |
| 30 to 34 Minutes | 170 | 6.8% |
| 35 to 39 Minutes | 67 | 2.7% |
| 40 to 44 Minutes | 177 | 7.0% |
| 45 to 59 Minutes | 247 | 9.8% |
| 60 to 89 Minutes | 12 | 0.5% |
| 90 or more Minutes | 10 | 0.4% |
Commute Time by Sex in Bessemer City
The most common commute times in Bessemer City are 15 to 19 minutes (314 commuters, 24.2%) for males and 15 to 19 minutes (381 commuters, 31.3%) for females.
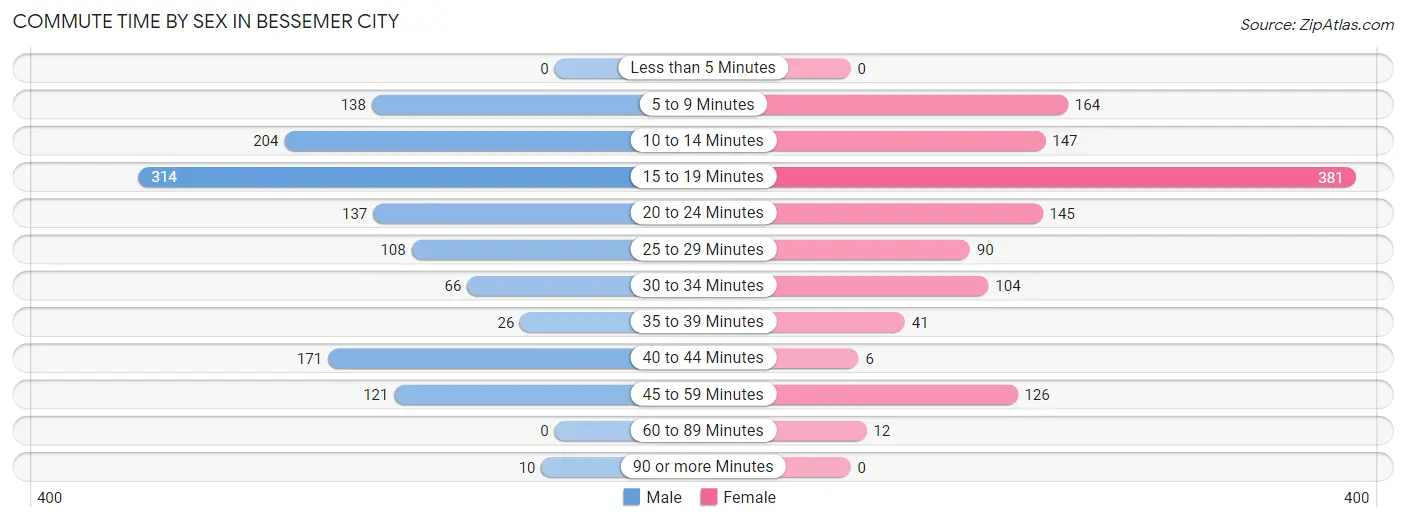
| Commute Time | Male | Female |
| Less than 5 Minutes | 0 (0.0%) | 0 (0.0%) |
| 5 to 9 Minutes | 138 (10.7%) | 164 (13.5%) |
| 10 to 14 Minutes | 204 (15.8%) | 147 (12.1%) |
| 15 to 19 Minutes | 314 (24.2%) | 381 (31.3%) |
| 20 to 24 Minutes | 137 (10.6%) | 145 (11.9%) |
| 25 to 29 Minutes | 108 (8.3%) | 90 (7.4%) |
| 30 to 34 Minutes | 66 (5.1%) | 104 (8.6%) |
| 35 to 39 Minutes | 26 (2.0%) | 41 (3.4%) |
| 40 to 44 Minutes | 171 (13.2%) | 6 (0.5%) |
| 45 to 59 Minutes | 121 (9.3%) | 126 (10.4%) |
| 60 to 89 Minutes | 0 (0.0%) | 12 (1.0%) |
| 90 or more Minutes | 10 (0.8%) | 0 (0.0%) |
Time of Departure to Work by Sex in Bessemer City
The most frequent times of departure to work in Bessemer City are 7:00 AM to 7:29 AM (225, 17.4%) for males and 7:30 AM to 7:59 AM (214, 17.6%) for females.
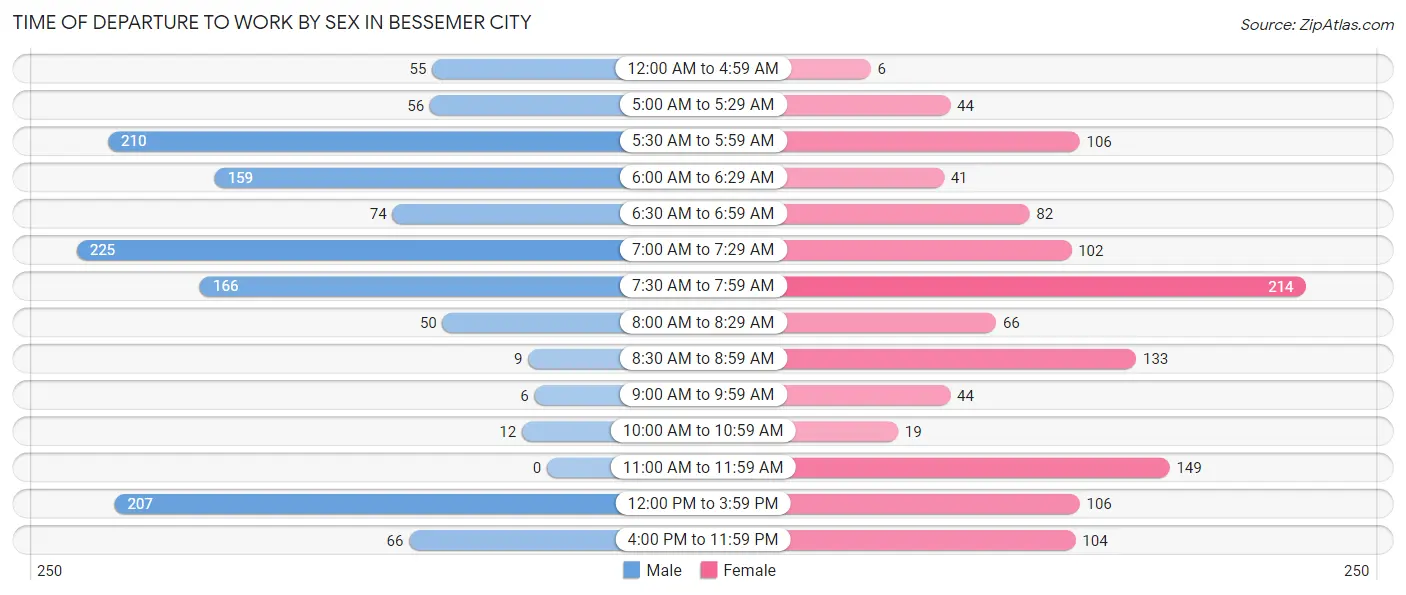
| Time of Departure | Male | Female |
| 12:00 AM to 4:59 AM | 55 (4.3%) | 6 (0.5%) |
| 5:00 AM to 5:29 AM | 56 (4.3%) | 44 (3.6%) |
| 5:30 AM to 5:59 AM | 210 (16.2%) | 106 (8.7%) |
| 6:00 AM to 6:29 AM | 159 (12.3%) | 41 (3.4%) |
| 6:30 AM to 6:59 AM | 74 (5.7%) | 82 (6.7%) |
| 7:00 AM to 7:29 AM | 225 (17.4%) | 102 (8.4%) |
| 7:30 AM to 7:59 AM | 166 (12.8%) | 214 (17.6%) |
| 8:00 AM to 8:29 AM | 50 (3.9%) | 66 (5.4%) |
| 8:30 AM to 8:59 AM | 9 (0.7%) | 133 (10.9%) |
| 9:00 AM to 9:59 AM | 6 (0.5%) | 44 (3.6%) |
| 10:00 AM to 10:59 AM | 12 (0.9%) | 19 (1.6%) |
| 11:00 AM to 11:59 AM | 0 (0.0%) | 149 (12.2%) |
| 12:00 PM to 3:59 PM | 207 (16.0%) | 106 (8.7%) |
| 4:00 PM to 11:59 PM | 66 (5.1%) | 104 (8.6%) |
| Total | 1,295 (100.0%) | 1,216 (100.0%) |
Housing Occupancy in Bessemer City
Occupancy by Ownership in Bessemer City
Of the total 2,181 dwellings in Bessemer City, owner-occupied units account for 1,068 (49.0%), while renter-occupied units make up 1,113 (51.0%).
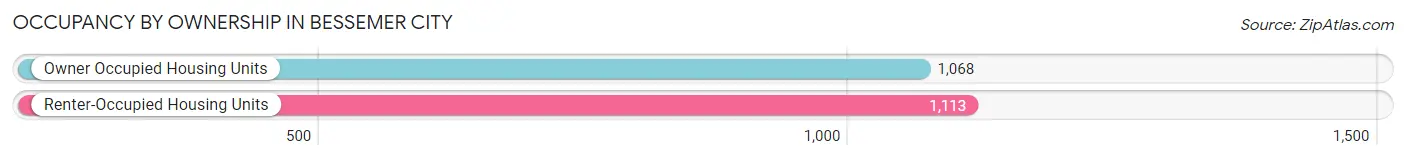
| Occupancy | # Housing Units | % Housing Units |
| Owner Occupied Housing Units | 1,068 | 49.0% |
| Renter-Occupied Housing Units | 1,113 | 51.0% |
| Total Occupied Housing Units | 2,181 | 100.0% |
Occupancy by Household Size in Bessemer City
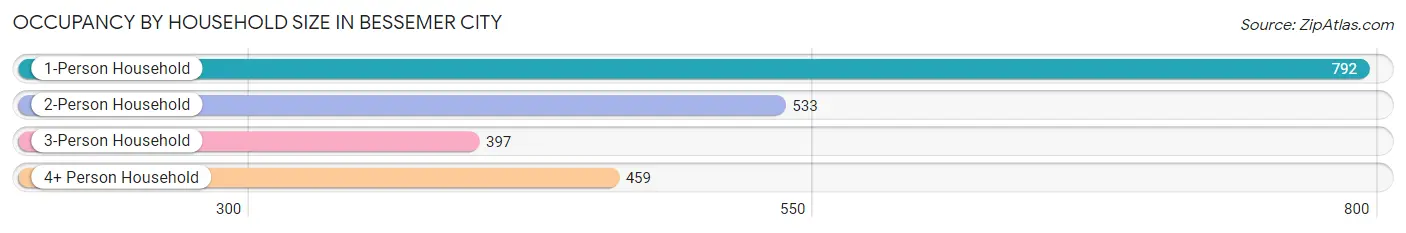
| Household Size | # Housing Units | % Housing Units |
| 1-Person Household | 792 | 36.3% |
| 2-Person Household | 533 | 24.4% |
| 3-Person Household | 397 | 18.2% |
| 4+ Person Household | 459 | 21.0% |
| Total Housing Units | 2,181 | 100.0% |
Occupancy by Ownership by Household Size in Bessemer City
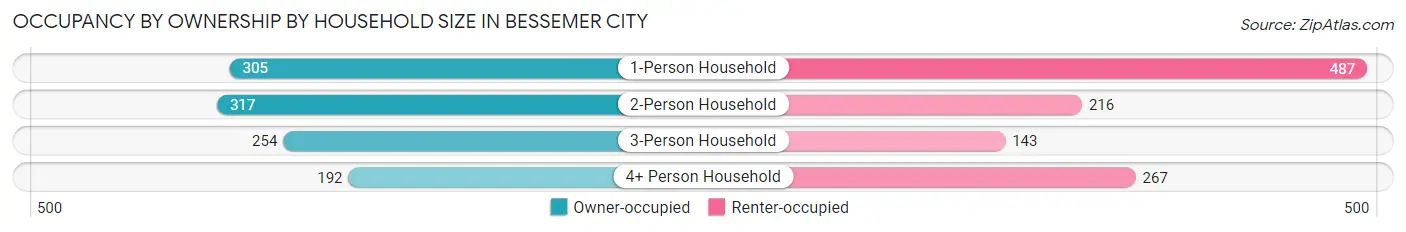
| Household Size | Owner-occupied | Renter-occupied |
| 1-Person Household | 305 (38.5%) | 487 (61.5%) |
| 2-Person Household | 317 (59.5%) | 216 (40.5%) |
| 3-Person Household | 254 (64.0%) | 143 (36.0%) |
| 4+ Person Household | 192 (41.8%) | 267 (58.2%) |
| Total Housing Units | 1,068 (49.0%) | 1,113 (51.0%) |
Occupancy by Educational Attainment in Bessemer City
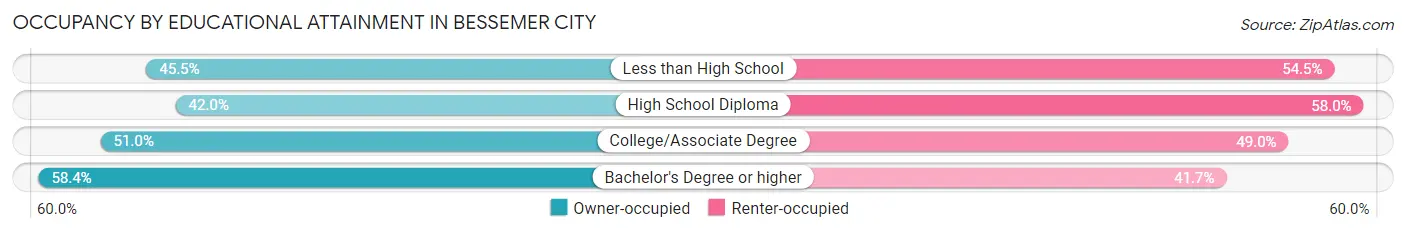
| Household Size | Owner-occupied | Renter-occupied |
| Less than High School | 157 (45.5%) | 188 (54.5%) |
| High School Diploma | 264 (42.0%) | 364 (58.0%) |
| College/Associate Degree | 399 (51.0%) | 384 (49.0%) |
| Bachelor's Degree or higher | 248 (58.4%) | 177 (41.6%) |
Occupancy by Age of Householder in Bessemer City
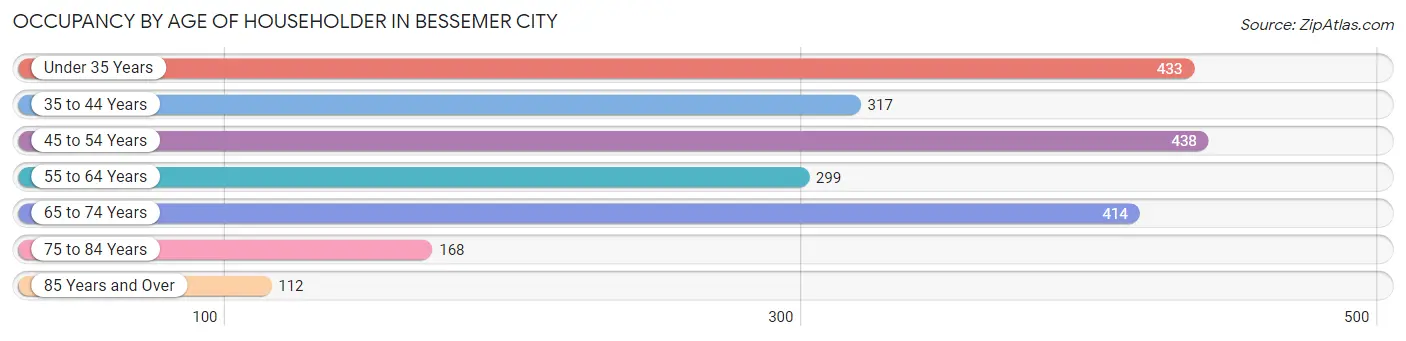
| Age Bracket | # Households | % Households |
| Under 35 Years | 433 | 19.9% |
| 35 to 44 Years | 317 | 14.5% |
| 45 to 54 Years | 438 | 20.1% |
| 55 to 64 Years | 299 | 13.7% |
| 65 to 74 Years | 414 | 19.0% |
| 75 to 84 Years | 168 | 7.7% |
| 85 Years and Over | 112 | 5.1% |
| Total | 2,181 | 100.0% |
Housing Finances in Bessemer City
Median Income by Occupancy in Bessemer City
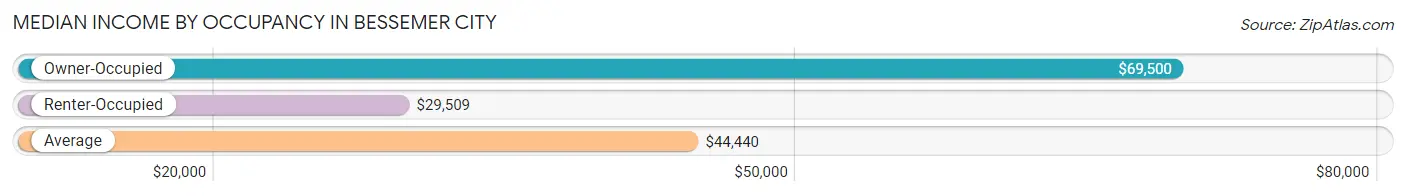
| Occupancy Type | # Households | Median Income |
| Owner-Occupied | 1,068 (49.0%) | $69,500 |
| Renter-Occupied | 1,113 (51.0%) | $29,509 |
| Average | 2,181 (100.0%) | $44,440 |
Occupancy by Householder Income Bracket in Bessemer City
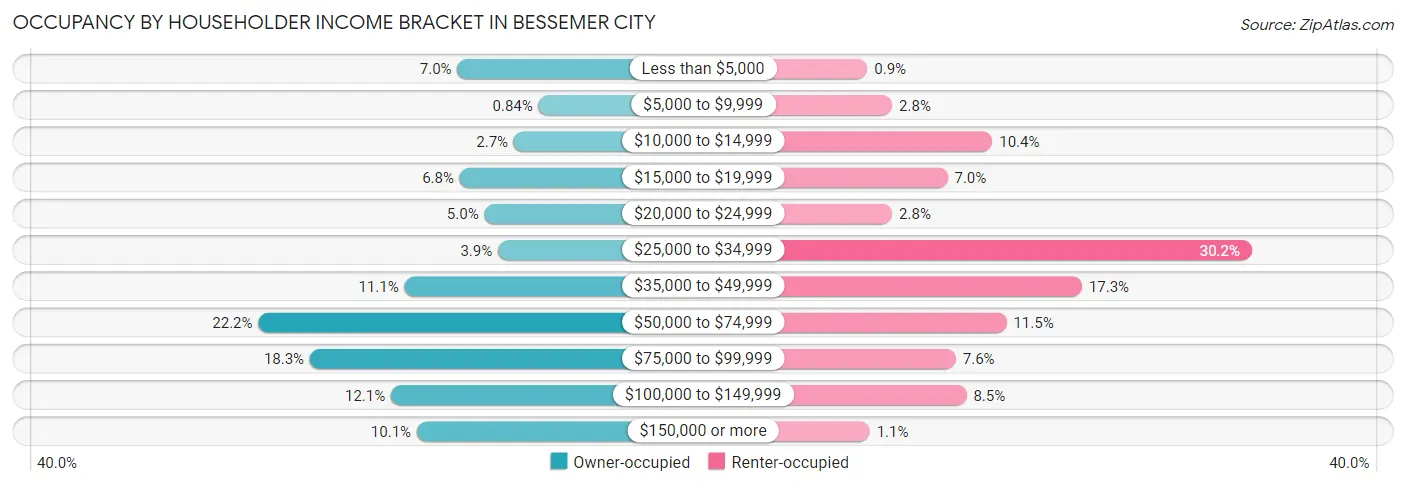
| Income Bracket | Owner-occupied | Renter-occupied |
| Less than $5,000 | 75 (7.0%) | 10 (0.9%) |
| $5,000 to $9,999 | 9 (0.8%) | 31 (2.8%) |
| $10,000 to $14,999 | 29 (2.7%) | 116 (10.4%) |
| $15,000 to $19,999 | 73 (6.8%) | 78 (7.0%) |
| $20,000 to $24,999 | 53 (5.0%) | 31 (2.8%) |
| $25,000 to $34,999 | 42 (3.9%) | 336 (30.2%) |
| $35,000 to $49,999 | 118 (11.1%) | 192 (17.2%) |
| $50,000 to $74,999 | 237 (22.2%) | 128 (11.5%) |
| $75,000 to $99,999 | 195 (18.3%) | 85 (7.6%) |
| $100,000 to $149,999 | 129 (12.1%) | 94 (8.5%) |
| $150,000 or more | 108 (10.1%) | 12 (1.1%) |
| Total | 1,068 (100.0%) | 1,113 (100.0%) |
Monthly Housing Cost Tiers in Bessemer City
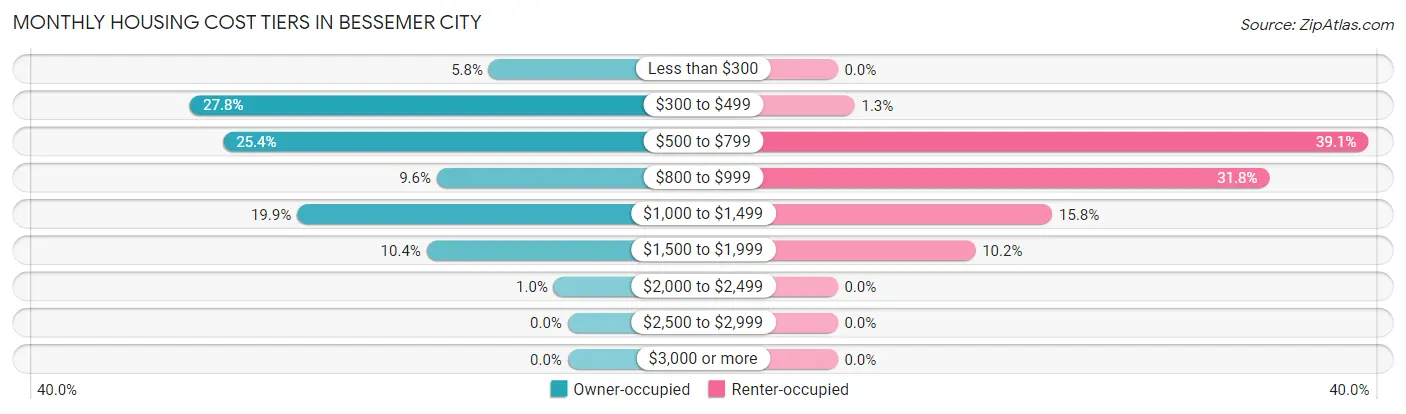
| Monthly Cost | Owner-occupied | Renter-occupied |
| Less than $300 | 62 (5.8%) | 0 (0.0%) |
| $300 to $499 | 297 (27.8%) | 14 (1.3%) |
| $500 to $799 | 271 (25.4%) | 435 (39.1%) |
| $800 to $999 | 103 (9.6%) | 354 (31.8%) |
| $1,000 to $1,499 | 213 (19.9%) | 176 (15.8%) |
| $1,500 to $1,999 | 111 (10.4%) | 113 (10.2%) |
| $2,000 to $2,499 | 11 (1.0%) | 0 (0.0%) |
| $2,500 to $2,999 | 0 (0.0%) | 0 (0.0%) |
| $3,000 or more | 0 (0.0%) | 0 (0.0%) |
| Total | 1,068 (100.0%) | 1,113 (100.0%) |
Physical Housing Characteristics in Bessemer City
Housing Structures in Bessemer City
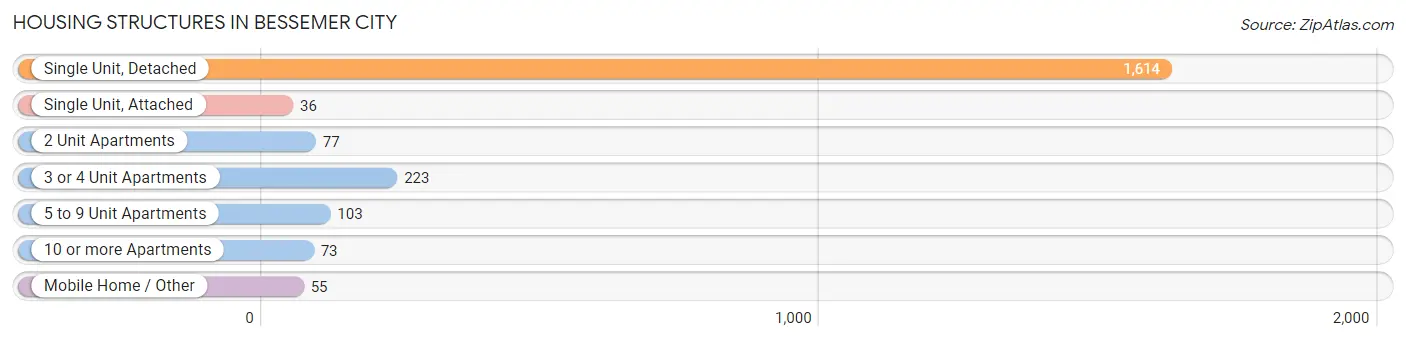
| Structure Type | # Housing Units | % Housing Units |
| Single Unit, Detached | 1,614 | 74.0% |
| Single Unit, Attached | 36 | 1.7% |
| 2 Unit Apartments | 77 | 3.5% |
| 3 or 4 Unit Apartments | 223 | 10.2% |
| 5 to 9 Unit Apartments | 103 | 4.7% |
| 10 or more Apartments | 73 | 3.4% |
| Mobile Home / Other | 55 | 2.5% |
| Total | 2,181 | 100.0% |
Housing Structures by Occupancy in Bessemer City
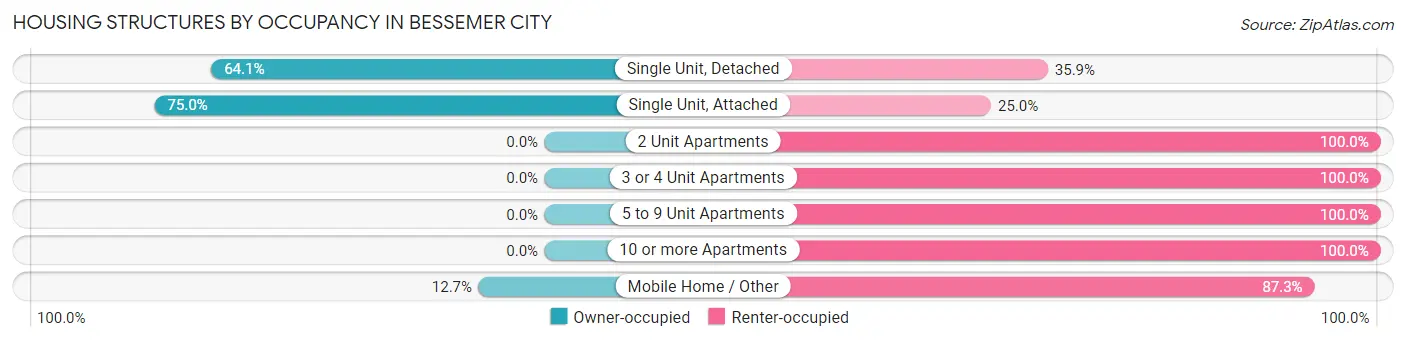
| Structure Type | Owner-occupied | Renter-occupied |
| Single Unit, Detached | 1,034 (64.1%) | 580 (35.9%) |
| Single Unit, Attached | 27 (75.0%) | 9 (25.0%) |
| 2 Unit Apartments | 0 (0.0%) | 77 (100.0%) |
| 3 or 4 Unit Apartments | 0 (0.0%) | 223 (100.0%) |
| 5 to 9 Unit Apartments | 0 (0.0%) | 103 (100.0%) |
| 10 or more Apartments | 0 (0.0%) | 73 (100.0%) |
| Mobile Home / Other | 7 (12.7%) | 48 (87.3%) |
| Total | 1,068 (49.0%) | 1,113 (51.0%) |
Housing Structures by Number of Rooms in Bessemer City
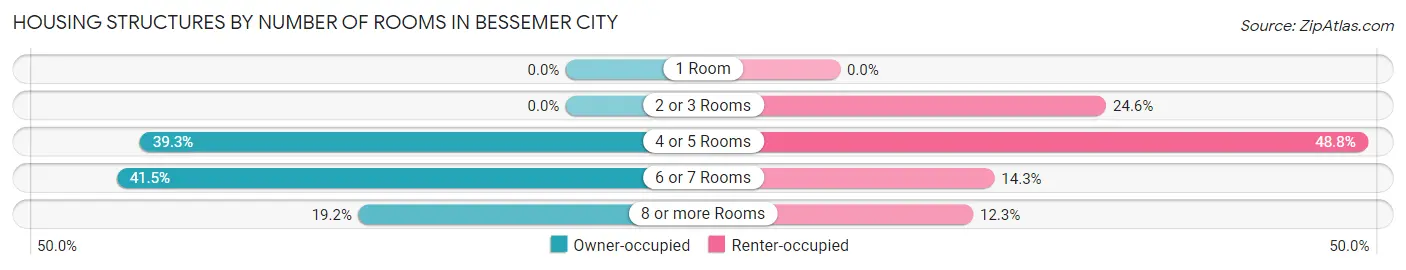
| Number of Rooms | Owner-occupied | Renter-occupied |
| 1 Room | 0 (0.0%) | 0 (0.0%) |
| 2 or 3 Rooms | 0 (0.0%) | 274 (24.6%) |
| 4 or 5 Rooms | 420 (39.3%) | 543 (48.8%) |
| 6 or 7 Rooms | 443 (41.5%) | 159 (14.3%) |
| 8 or more Rooms | 205 (19.2%) | 137 (12.3%) |
| Total | 1,068 (100.0%) | 1,113 (100.0%) |
Housing Structure by Heating Type in Bessemer City
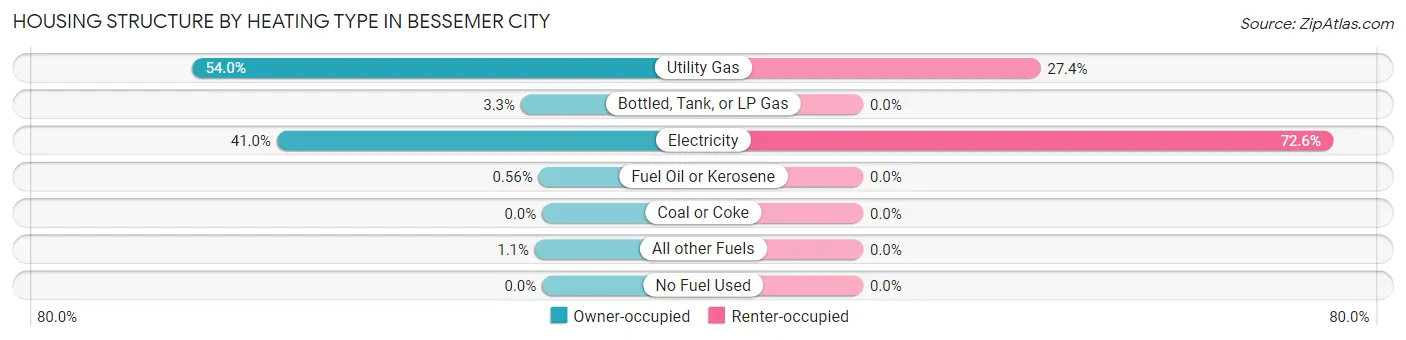
| Heating Type | Owner-occupied | Renter-occupied |
| Utility Gas | 577 (54.0%) | 305 (27.4%) |
| Bottled, Tank, or LP Gas | 35 (3.3%) | 0 (0.0%) |
| Electricity | 438 (41.0%) | 808 (72.6%) |
| Fuel Oil or Kerosene | 6 (0.6%) | 0 (0.0%) |
| Coal or Coke | 0 (0.0%) | 0 (0.0%) |
| All other Fuels | 12 (1.1%) | 0 (0.0%) |
| No Fuel Used | 0 (0.0%) | 0 (0.0%) |
| Total | 1,068 (100.0%) | 1,113 (100.0%) |
Household Vehicle Usage in Bessemer City
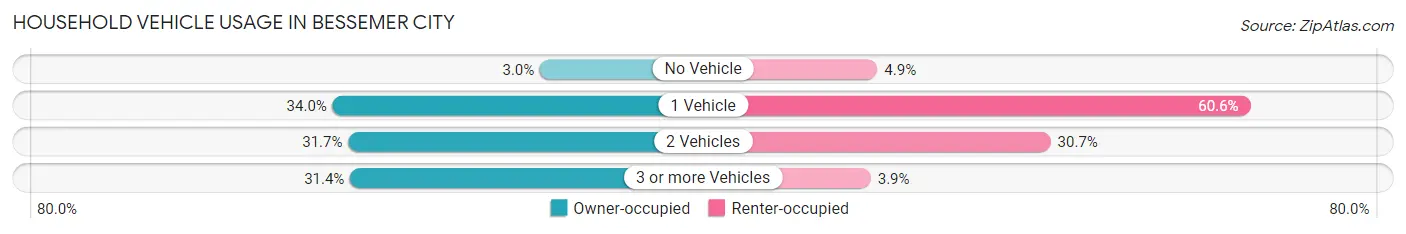
| Vehicles per Household | Owner-occupied | Renter-occupied |
| No Vehicle | 32 (3.0%) | 54 (4.9%) |
| 1 Vehicle | 363 (34.0%) | 674 (60.6%) |
| 2 Vehicles | 338 (31.7%) | 342 (30.7%) |
| 3 or more Vehicles | 335 (31.4%) | 43 (3.9%) |
| Total | 1,068 (100.0%) | 1,113 (100.0%) |
Real Estate & Mortgages in Bessemer City
Real Estate and Mortgage Overview in Bessemer City
| Characteristic | Without Mortgage | With Mortgage |
| Housing Units | 535 | 533 |
| Median Property Value | $115,500 | $160,400 |
| Median Household Income | $46,607 | $94 |
| Monthly Housing Costs | $436 | $0 |
| Real Estate Taxes | $1,289 | $9 |
Property Value by Mortgage Status in Bessemer City
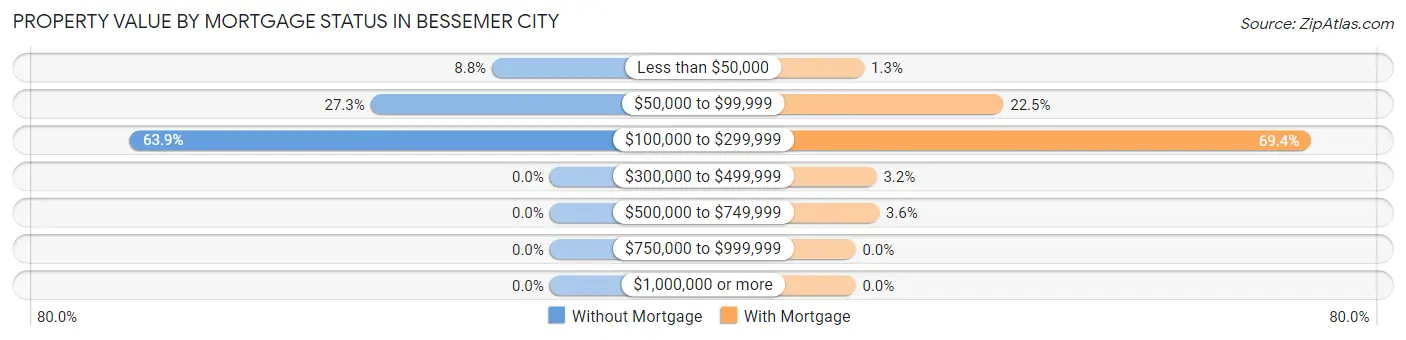
| Property Value | Without Mortgage | With Mortgage |
| Less than $50,000 | 47 (8.8%) | 7 (1.3%) |
| $50,000 to $99,999 | 146 (27.3%) | 120 (22.5%) |
| $100,000 to $299,999 | 342 (63.9%) | 370 (69.4%) |
| $300,000 to $499,999 | 0 (0.0%) | 17 (3.2%) |
| $500,000 to $749,999 | 0 (0.0%) | 19 (3.6%) |
| $750,000 to $999,999 | 0 (0.0%) | 0 (0.0%) |
| $1,000,000 or more | 0 (0.0%) | 0 (0.0%) |
| Total | 535 (100.0%) | 533 (100.0%) |
Household Income by Mortgage Status in Bessemer City
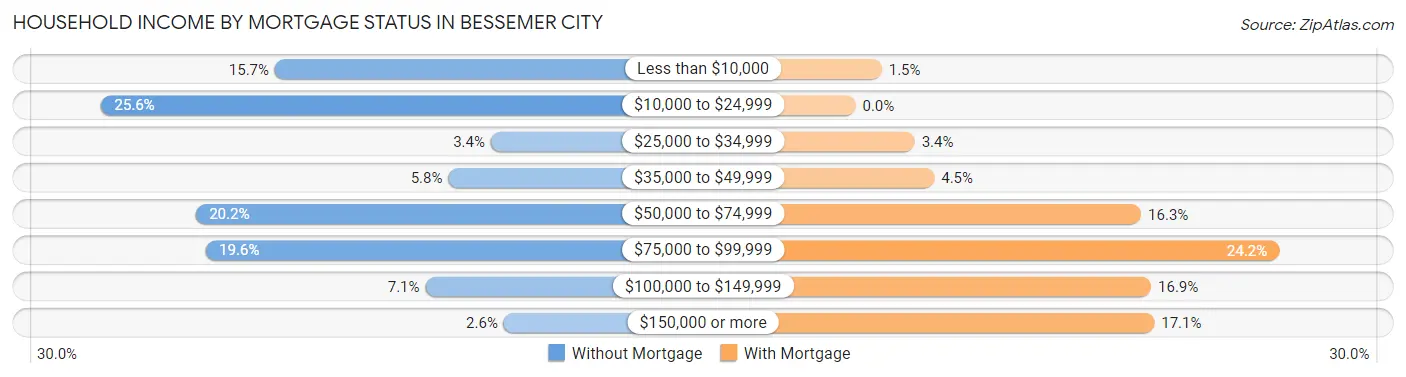
| Household Income | Without Mortgage | With Mortgage |
| Less than $10,000 | 84 (15.7%) | 8 (1.5%) |
| $10,000 to $24,999 | 137 (25.6%) | 0 (0.0%) |
| $25,000 to $34,999 | 18 (3.4%) | 18 (3.4%) |
| $35,000 to $49,999 | 31 (5.8%) | 24 (4.5%) |
| $50,000 to $74,999 | 108 (20.2%) | 87 (16.3%) |
| $75,000 to $99,999 | 105 (19.6%) | 129 (24.2%) |
| $100,000 to $149,999 | 38 (7.1%) | 90 (16.9%) |
| $150,000 or more | 14 (2.6%) | 91 (17.1%) |
| Total | 535 (100.0%) | 533 (100.0%) |
Property Value to Household Income Ratio in Bessemer City
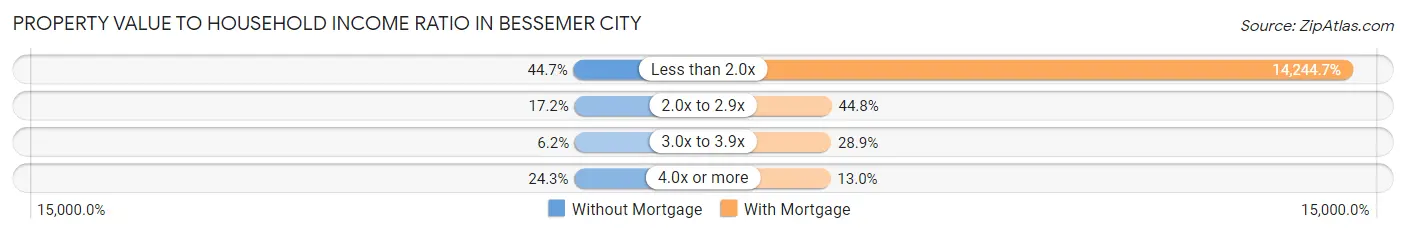
| Value-to-Income Ratio | Without Mortgage | With Mortgage |
| Less than 2.0x | 239 (44.7%) | 75,924 (14,244.6%) |
| 2.0x to 2.9x | 92 (17.2%) | 239 (44.8%) |
| 3.0x to 3.9x | 33 (6.2%) | 154 (28.9%) |
| 4.0x or more | 130 (24.3%) | 69 (13.0%) |
| Total | 535 (100.0%) | 533 (100.0%) |
Real Estate Taxes by Mortgage Status in Bessemer City
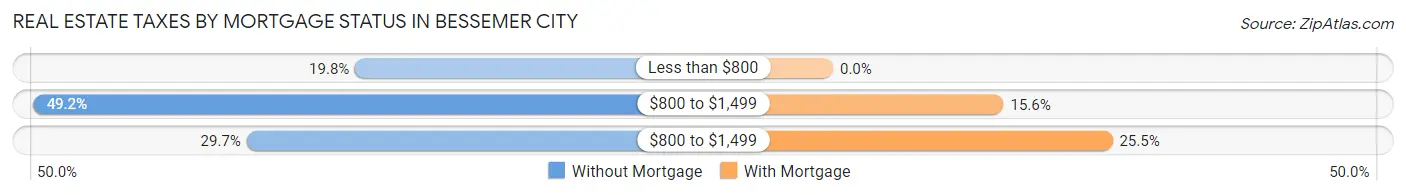
| Property Taxes | Without Mortgage | With Mortgage |
| Less than $800 | 106 (19.8%) | 0 (0.0%) |
| $800 to $1,499 | 263 (49.2%) | 83 (15.6%) |
| $800 to $1,499 | 159 (29.7%) | 136 (25.5%) |
| Total | 535 (100.0%) | 533 (100.0%) |
Health & Disability in Bessemer City
Health Insurance Coverage by Age in Bessemer City
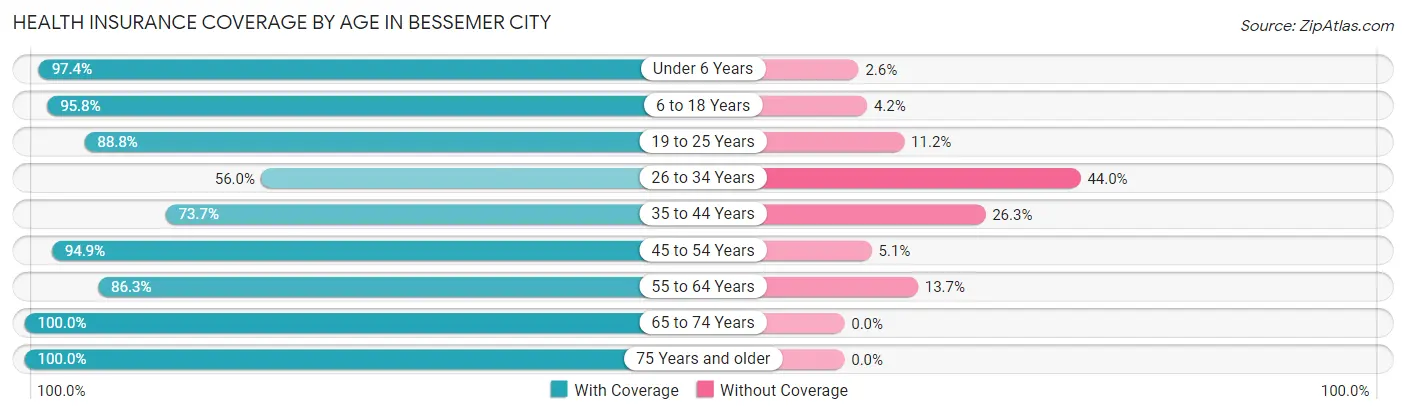
| Age Bracket | With Coverage | Without Coverage |
| Under 6 Years | 405 (97.4%) | 11 (2.6%) |
| 6 to 18 Years | 543 (95.8%) | 24 (4.2%) |
| 19 to 25 Years | 637 (88.8%) | 80 (11.2%) |
| 26 to 34 Years | 488 (56.0%) | 384 (44.0%) |
| 35 to 44 Years | 390 (73.7%) | 139 (26.3%) |
| 45 to 54 Years | 857 (94.9%) | 46 (5.1%) |
| 55 to 64 Years | 472 (86.3%) | 75 (13.7%) |
| 65 to 74 Years | 558 (100.0%) | 0 (0.0%) |
| 75 Years and older | 348 (100.0%) | 0 (0.0%) |
| Total | 4,698 (86.1%) | 759 (13.9%) |
Health Insurance Coverage by Citizenship Status in Bessemer City
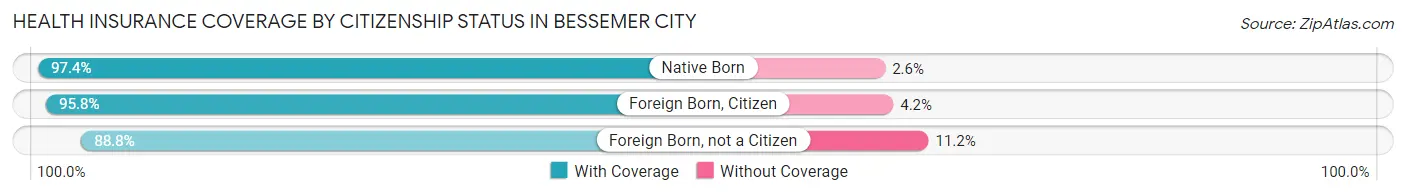
| Citizenship Status | With Coverage | Without Coverage |
| Native Born | 405 (97.4%) | 11 (2.6%) |
| Foreign Born, Citizen | 543 (95.8%) | 24 (4.2%) |
| Foreign Born, not a Citizen | 637 (88.8%) | 80 (11.2%) |
Health Insurance Coverage by Household Income in Bessemer City
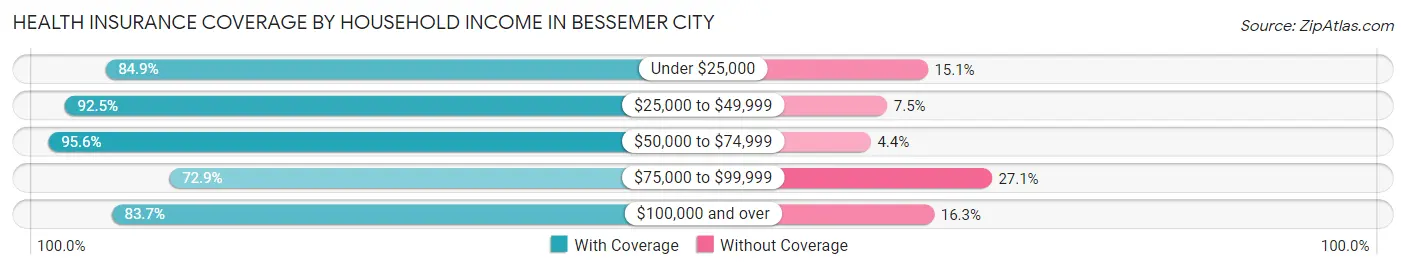
| Household Income | With Coverage | Without Coverage |
| Under $25,000 | 719 (84.9%) | 128 (15.1%) |
| $25,000 to $49,999 | 1,294 (92.5%) | 105 (7.5%) |
| $50,000 to $74,999 | 777 (95.6%) | 36 (4.4%) |
| $75,000 to $99,999 | 678 (72.9%) | 252 (27.1%) |
| $100,000 and over | 1,207 (83.7%) | 235 (16.3%) |
Public vs Private Health Insurance Coverage by Age in Bessemer City
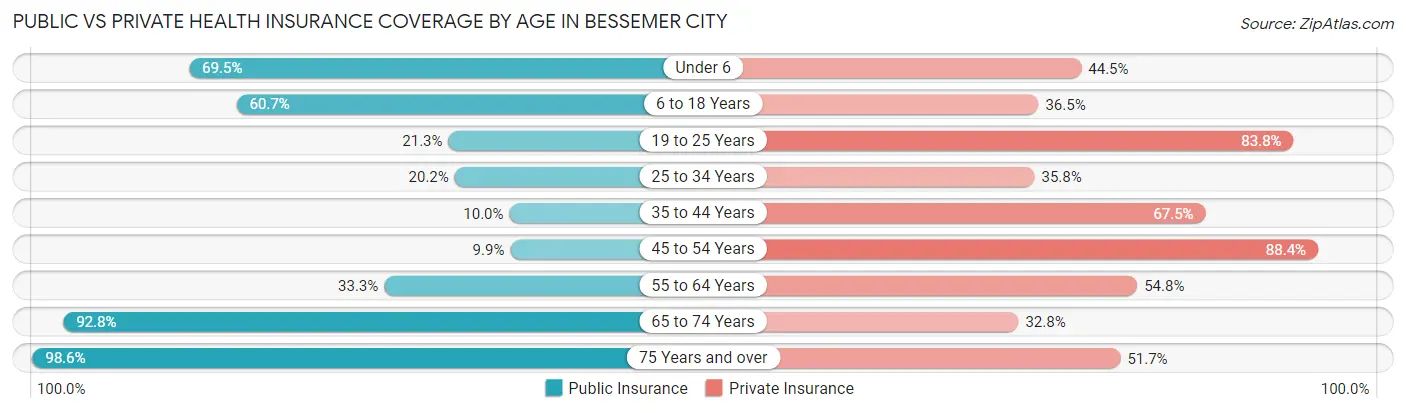
| Age Bracket | Public Insurance | Private Insurance |
| Under 6 | 289 (69.5%) | 185 (44.5%) |
| 6 to 18 Years | 344 (60.7%) | 207 (36.5%) |
| 19 to 25 Years | 153 (21.3%) | 601 (83.8%) |
| 25 to 34 Years | 176 (20.2%) | 312 (35.8%) |
| 35 to 44 Years | 53 (10.0%) | 357 (67.5%) |
| 45 to 54 Years | 89 (9.9%) | 798 (88.4%) |
| 55 to 64 Years | 182 (33.3%) | 300 (54.8%) |
| 65 to 74 Years | 518 (92.8%) | 183 (32.8%) |
| 75 Years and over | 343 (98.6%) | 180 (51.7%) |
| Total | 2,147 (39.3%) | 3,123 (57.2%) |
Disability Status by Sex by Age in Bessemer City
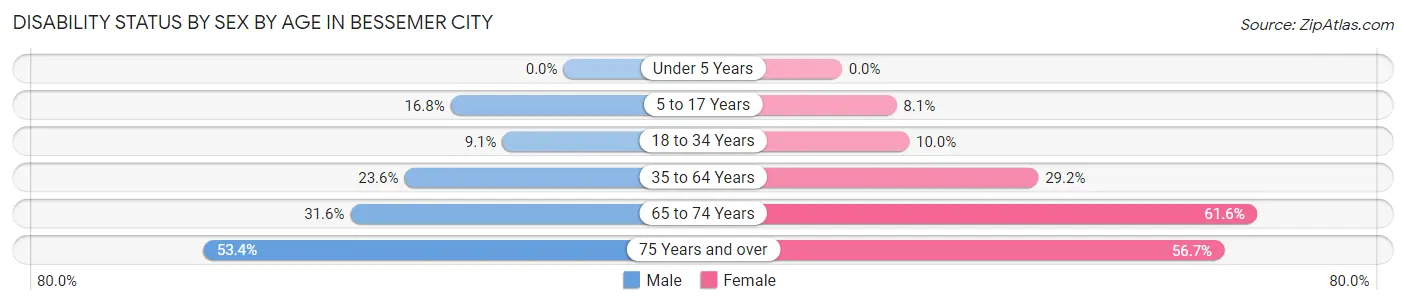
| Age Bracket | Male | Female |
| Under 5 Years | 0 (0.0%) | 0 (0.0%) |
| 5 to 17 Years | 58 (16.8%) | 21 (8.1%) |
| 18 to 34 Years | 91 (9.1%) | 68 (10.0%) |
| 35 to 64 Years | 197 (23.6%) | 334 (29.2%) |
| 65 to 74 Years | 81 (31.6%) | 186 (61.6%) |
| 75 Years and over | 71 (53.4%) | 122 (56.7%) |
Disability Class by Sex by Age in Bessemer City
Disability Class: Hearing Difficulty
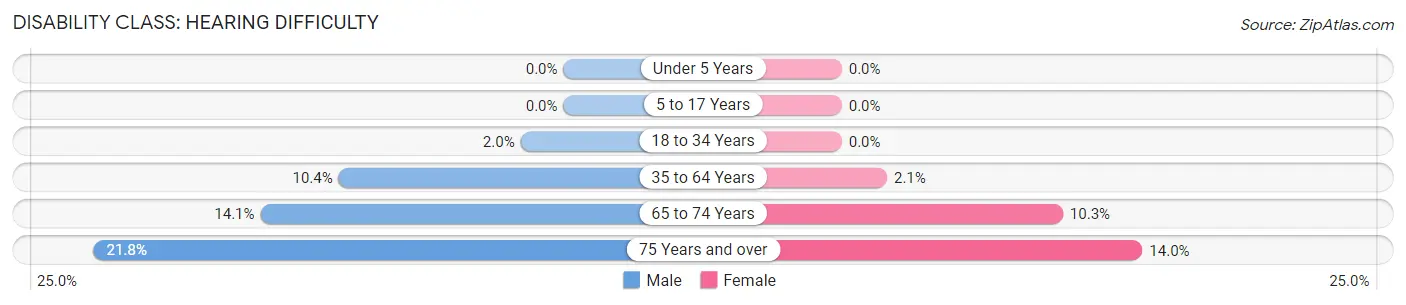
| Age Bracket | Male | Female |
| Under 5 Years | 0 (0.0%) | 0 (0.0%) |
| 5 to 17 Years | 0 (0.0%) | 0 (0.0%) |
| 18 to 34 Years | 20 (2.0%) | 0 (0.0%) |
| 35 to 64 Years | 87 (10.4%) | 24 (2.1%) |
| 65 to 74 Years | 36 (14.1%) | 31 (10.3%) |
| 75 Years and over | 29 (21.8%) | 30 (14.0%) |
Disability Class: Vision Difficulty
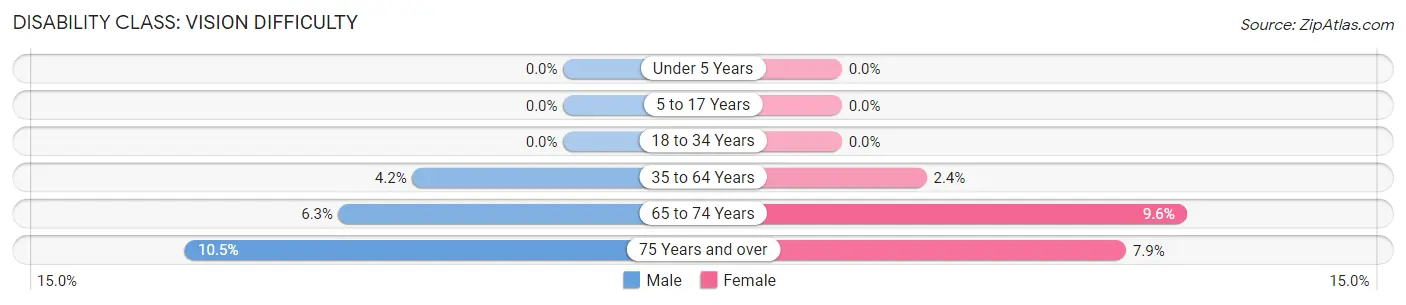
| Age Bracket | Male | Female |
| Under 5 Years | 0 (0.0%) | 0 (0.0%) |
| 5 to 17 Years | 0 (0.0%) | 0 (0.0%) |
| 18 to 34 Years | 0 (0.0%) | 0 (0.0%) |
| 35 to 64 Years | 35 (4.2%) | 27 (2.4%) |
| 65 to 74 Years | 16 (6.2%) | 29 (9.6%) |
| 75 Years and over | 14 (10.5%) | 17 (7.9%) |
Disability Class: Cognitive Difficulty
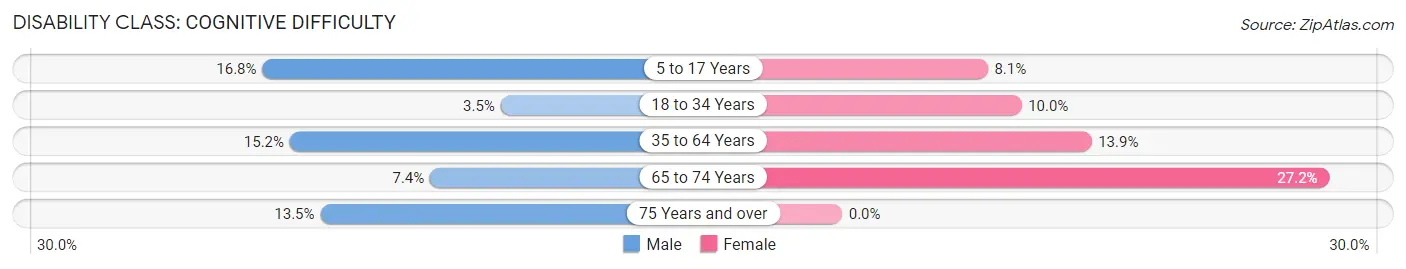
| Age Bracket | Male | Female |
| 5 to 17 Years | 58 (16.8%) | 21 (8.1%) |
| 18 to 34 Years | 35 (3.5%) | 68 (10.0%) |
| 35 to 64 Years | 127 (15.2%) | 159 (13.9%) |
| 65 to 74 Years | 19 (7.4%) | 82 (27.2%) |
| 75 Years and over | 18 (13.5%) | 0 (0.0%) |
Disability Class: Ambulatory Difficulty
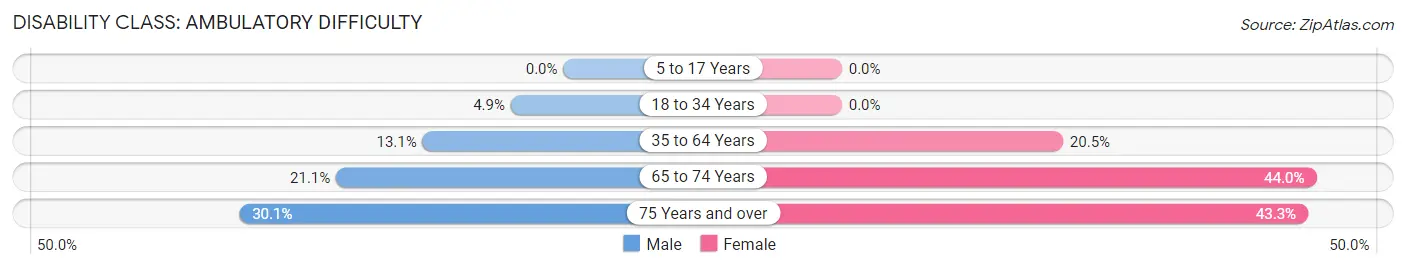
| Age Bracket | Male | Female |
| 5 to 17 Years | 0 (0.0%) | 0 (0.0%) |
| 18 to 34 Years | 49 (4.9%) | 0 (0.0%) |
| 35 to 64 Years | 109 (13.1%) | 235 (20.5%) |
| 65 to 74 Years | 54 (21.1%) | 133 (44.0%) |
| 75 Years and over | 40 (30.1%) | 93 (43.3%) |
Disability Class: Self-Care Difficulty
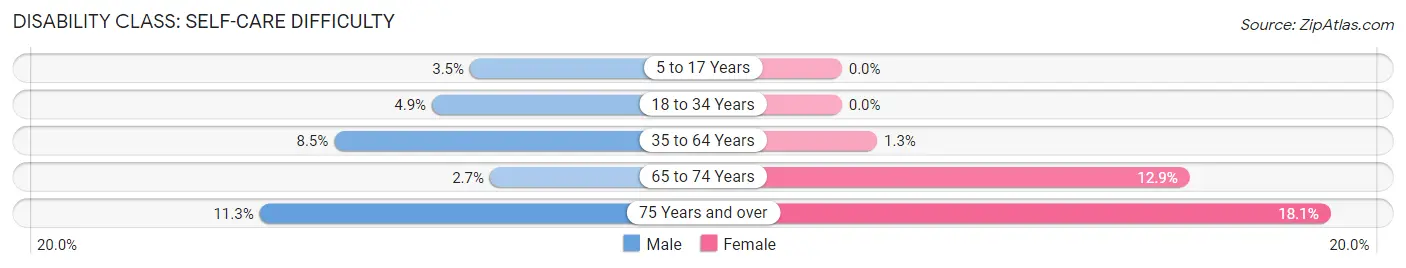
| Age Bracket | Male | Female |
| 5 to 17 Years | 12 (3.5%) | 0 (0.0%) |
| 18 to 34 Years | 49 (4.9%) | 0 (0.0%) |
| 35 to 64 Years | 71 (8.5%) | 15 (1.3%) |
| 65 to 74 Years | 7 (2.7%) | 39 (12.9%) |
| 75 Years and over | 15 (11.3%) | 39 (18.1%) |
Technology Access in Bessemer City
Computing Device Access in Bessemer City
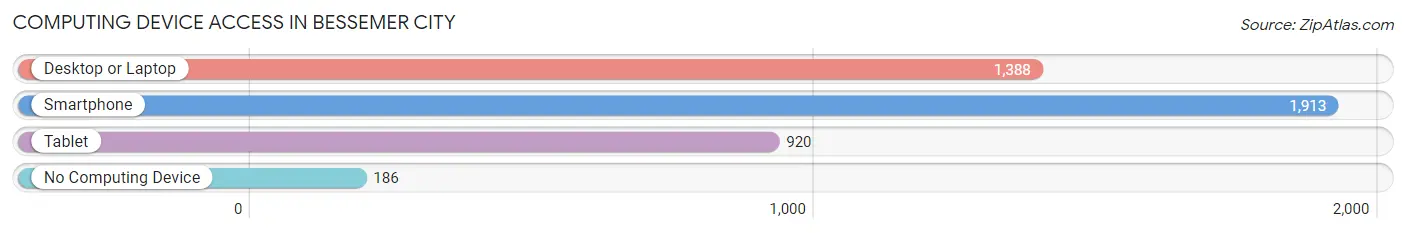
| Device Type | # Households | % Households |
| Desktop or Laptop | 1,388 | 63.6% |
| Smartphone | 1,913 | 87.7% |
| Tablet | 920 | 42.2% |
| No Computing Device | 186 | 8.5% |
| Total | 2,181 | 100.0% |
Internet Access in Bessemer City
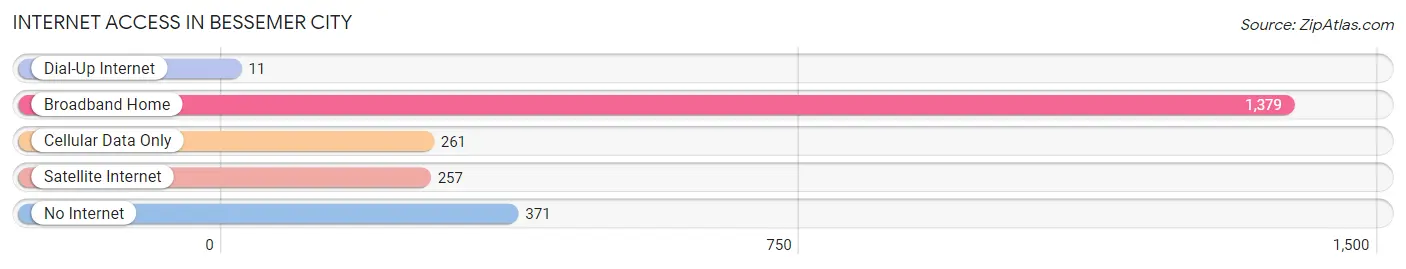
| Internet Type | # Households | % Households |
| Dial-Up Internet | 11 | 0.5% |
| Broadband Home | 1,379 | 63.2% |
| Cellular Data Only | 261 | 12.0% |
| Satellite Internet | 257 | 11.8% |
| No Internet | 371 | 17.0% |
| Total | 2,181 | 100.0% |
Bessemer City Summary
Bessemer City is a small town located in Gaston County, North Carolina. It is situated in the foothills of the Blue Ridge Mountains, approximately 25 miles west of Charlotte. The town has a population of approximately 4,500 people and covers an area of 2.3 square miles.
Geography
Bessemer City is located in the foothills of the Blue Ridge Mountains, approximately 25 miles west of Charlotte. The town is situated in the Piedmont region of North Carolina, which is characterized by rolling hills and valleys. The town is bordered by the towns of Gastonia, Kings Mountain, and Shelby. The Catawba River runs through the town, providing a source of recreation and fishing.
Climate
Bessemer City has a humid subtropical climate, with hot, humid summers and mild winters. The average annual temperature is around 60°F, with average highs in the summer reaching the mid-80s and lows in the winter reaching the mid-30s. The town receives an average of 48 inches of precipitation per year, with most of it falling in the summer months.
Demographics
As of the 2010 census, Bessemer City had a population of 4,484 people. The racial makeup of the town was 79.3% White, 15.2% African American, 0.4% Native American, 0.7% Asian, 0.1% Pacific Islander, and 3.3% from other races. Hispanic or Latino of any race were 4.3% of the population.
Economy
Bessemer City’s economy is largely based on manufacturing and retail. The town is home to several manufacturing plants, including a paper mill, a furniture factory, and a textile mill. The town also has several retail stores, including a Walmart Supercenter, a Lowe’s Home Improvement store, and a variety of restaurants and shops.
History
Bessemer City was founded in 1887 by the Bessemer Land and Improvement Company. The company was formed by a group of investors from New York who wanted to develop the area for industrial and residential use. The town was named after Henry Bessemer, the inventor of the Bessemer process for steel production.
The town grew rapidly in the early 20th century, becoming a center for manufacturing and industry. The town was home to several factories, including a paper mill, a furniture factory, and a textile mill. The town also had a thriving retail sector, with several stores and restaurants.
In the late 20th century, the town’s economy began to decline as manufacturing jobs moved overseas. The town’s population also began to decline, as people moved away in search of better job opportunities. In recent years, the town has seen a resurgence in its economy, with new businesses opening and the population increasing.
Common Questions
What is Per Capita Income in Bessemer City?
Per Capita income in Bessemer City is $24,979.
What is the Median Family Income in Bessemer City?
Median Family Income in Bessemer City is $68,194.
What is the Median Household income in Bessemer City?
Median Household Income in Bessemer City is $44,440.
What is Income or Wage Gap in Bessemer City?
Income or Wage Gap in Bessemer City is 11.4%.
Women in Bessemer City earn 88.6 cents for every dollar earned by a man.
What is Family Income Deficit in Bessemer City?
Family Income Deficit in Bessemer City is $10,602.
Families that are below poverty line in Bessemer City earn $10,602 less on average than the poverty threshold level.
What is Inequality or Gini Index in Bessemer City?
Inequality or Gini Index in Bessemer City is 0.42.
What is the Total Population of Bessemer City?
Total Population of Bessemer City is 5,472.
What is the Total Male Population of Bessemer City?
Total Male Population of Bessemer City is 2,805.
What is the Total Female Population of Bessemer City?
Total Female Population of Bessemer City is 2,667.
What is the Ratio of Males per 100 Females in Bessemer City?
There are 105.17 Males per 100 Females in Bessemer City.
What is the Ratio of Females per 100 Males in Bessemer City?
There are 95.08 Females per 100 Males in Bessemer City.
What is the Median Population Age in Bessemer City?
Median Population Age in Bessemer City is 38.5 Years.
What is the Average Family Size in Bessemer City
Average Family Size in Bessemer City is 3.2 People.
What is the Average Household Size in Bessemer City
Average Household Size in Bessemer City is 2.5 People.
How Large is the Labor Force in Bessemer City?
There are 2,879 People in the Labor Forcein in Bessemer City.
What is the Percentage of People in the Labor Force in Bessemer City?
62.0% of People are in the Labor Force in Bessemer City.
What is the Unemployment Rate in Bessemer City?
Unemployment Rate in Bessemer City is 6.1%.