Bayboro, NC Map & Demographics
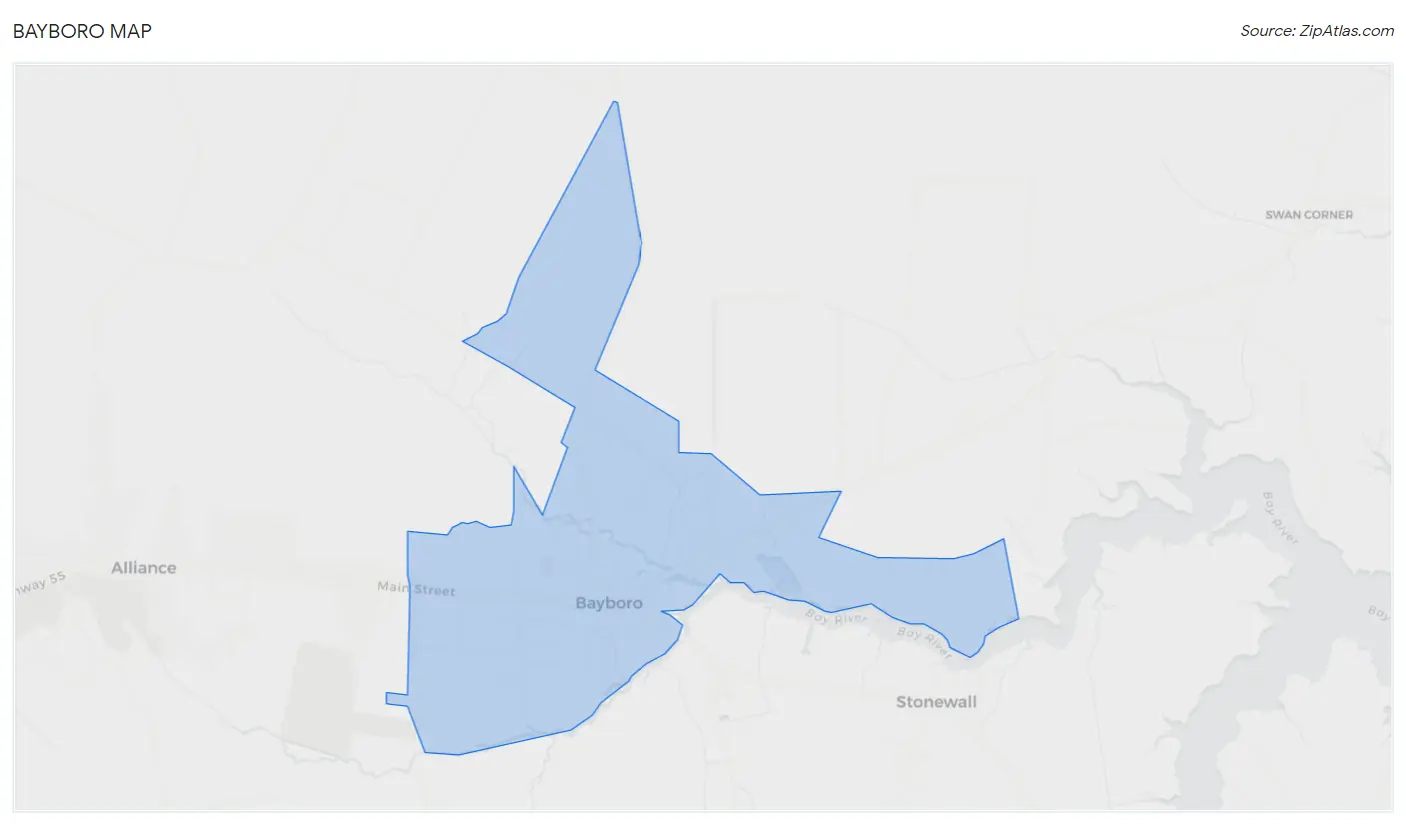
Bayboro Map
Bayboro Overview
$11,477
PER CAPITA INCOME
$48,333
AVG FAMILY INCOME
$28,393
AVG HOUSEHOLD INCOME
23.0%
WAGE / INCOME GAP [ % ]
77.0¢/ $1
WAGE / INCOME GAP [ $ ]
$11,650
FAMILY INCOME DEFICIT
0.51
INEQUALITY / GINI INDEX
1,209
TOTAL POPULATION
907
MALE POPULATION
302
FEMALE POPULATION
300.33
MALES / 100 FEMALES
33.30
FEMALES / 100 MALES
45.8
MEDIAN AGE
3.5
AVG FAMILY SIZE
2.2
AVG HOUSEHOLD SIZE
193
LABOR FORCE [ PEOPLE ]
17.5%
PERCENT IN LABOR FORCE
2.6%
UNEMPLOYMENT RATE
Bayboro Zip Codes
Bayboro Area Codes
Income in Bayboro
Income Overview in Bayboro
Per Capita Income in Bayboro is $11,477, while median incomes of families and households are $48,333 and $28,393 respectively.
| Characteristic | Number | Measure |
| Per Capita Income | 1,209 | $11,477 |
| Median Family Income | 90 | $48,333 |
| Mean Family Income | 90 | $78,724 |
| Median Household Income | 225 | $28,393 |
| Mean Household Income | 225 | $48,096 |
| Income Deficit | 90 | $11,650 |
| Wage / Income Gap (%) | 1,209 | 23.02% |
| Wage / Income Gap ($) | 1,209 | 76.98¢ per $1 |
| Gini / Inequality Index | 1,209 | 0.51 |
Earnings by Sex in Bayboro
Average Earnings in Bayboro are $23,720, $24,155 for men and $18,594 for women, a difference of 23.0%.
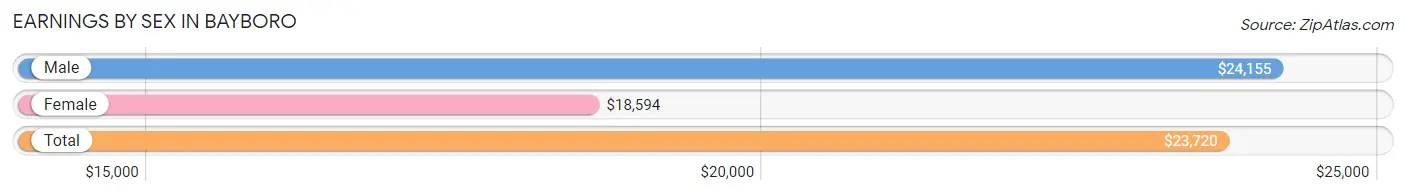
| Sex | Number | Average Earnings |
| Male | 127 (52.5%) | $24,155 |
| Female | 115 (47.5%) | $18,594 |
| Total | 242 (100.0%) | $23,720 |
Earnings by Sex by Income Bracket in Bayboro
The most common earnings brackets in Bayboro are $22,500 to $24,999 for men (37 | 29.1%) and $15,000 to $17,499 for women (27 | 23.5%).
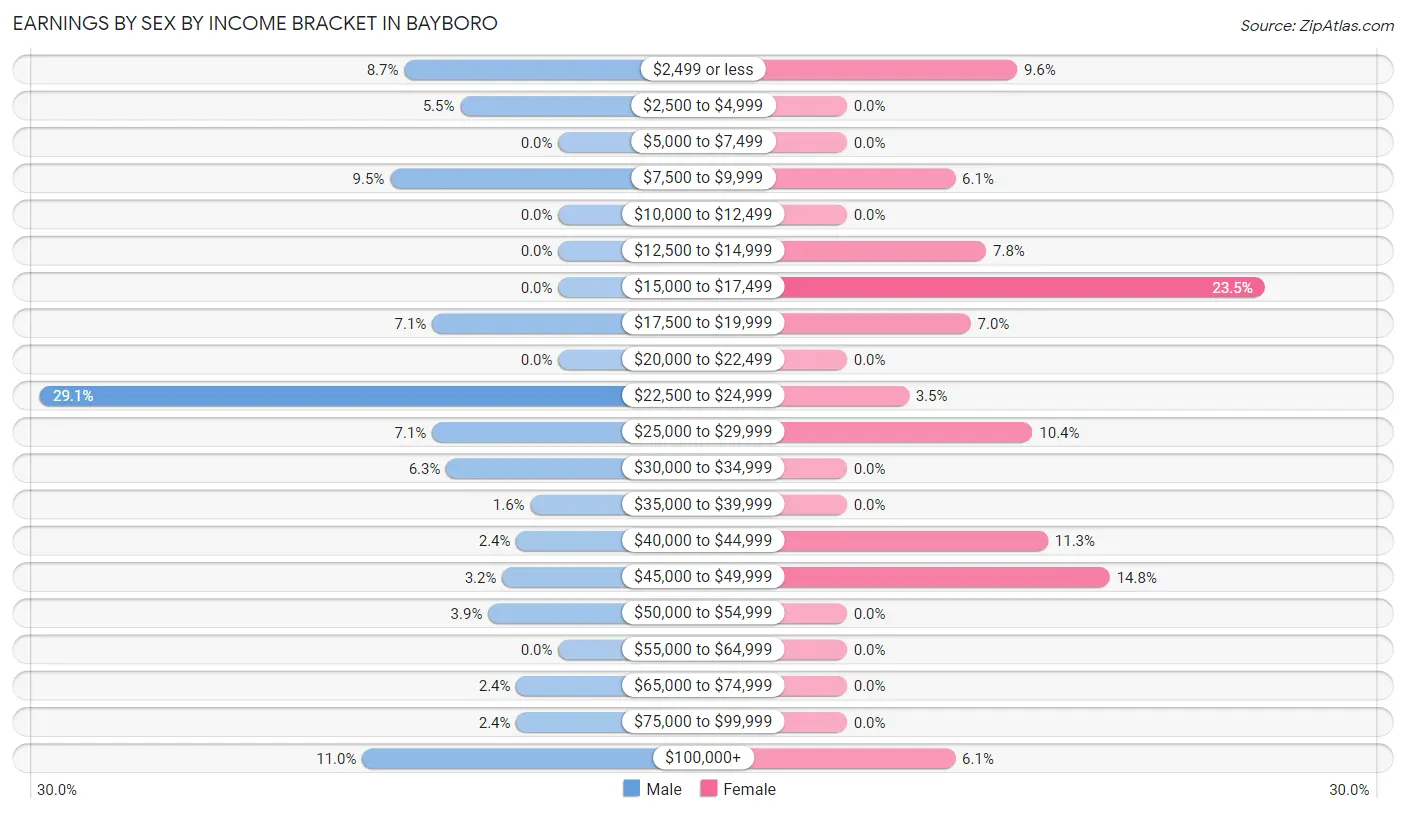
| Income | Male | Female |
| $2,499 or less | 11 (8.7%) | 11 (9.6%) |
| $2,500 to $4,999 | 7 (5.5%) | 0 (0.0%) |
| $5,000 to $7,499 | 0 (0.0%) | 0 (0.0%) |
| $7,500 to $9,999 | 12 (9.5%) | 7 (6.1%) |
| $10,000 to $12,499 | 0 (0.0%) | 0 (0.0%) |
| $12,500 to $14,999 | 0 (0.0%) | 9 (7.8%) |
| $15,000 to $17,499 | 0 (0.0%) | 27 (23.5%) |
| $17,500 to $19,999 | 9 (7.1%) | 8 (7.0%) |
| $20,000 to $22,499 | 0 (0.0%) | 0 (0.0%) |
| $22,500 to $24,999 | 37 (29.1%) | 4 (3.5%) |
| $25,000 to $29,999 | 9 (7.1%) | 12 (10.4%) |
| $30,000 to $34,999 | 8 (6.3%) | 0 (0.0%) |
| $35,000 to $39,999 | 2 (1.6%) | 0 (0.0%) |
| $40,000 to $44,999 | 3 (2.4%) | 13 (11.3%) |
| $45,000 to $49,999 | 4 (3.2%) | 17 (14.8%) |
| $50,000 to $54,999 | 5 (3.9%) | 0 (0.0%) |
| $55,000 to $64,999 | 0 (0.0%) | 0 (0.0%) |
| $65,000 to $74,999 | 3 (2.4%) | 0 (0.0%) |
| $75,000 to $99,999 | 3 (2.4%) | 0 (0.0%) |
| $100,000+ | 14 (11.0%) | 7 (6.1%) |
| Total | 127 (100.0%) | 115 (100.0%) |
Earnings by Sex by Educational Attainment in Bayboro
Average earnings in Bayboro are $24,020 for men and $17,454 for women, a difference of 27.3%. Men with an educational attainment of high school diploma enjoy the highest average annual earnings of $23,958, while those with high school diploma education earn the least with $23,958. Women with an educational attainment of high school diploma earn the most with the average annual earnings of $17,200, while those with high school diploma education have the smallest earnings of $17,200.
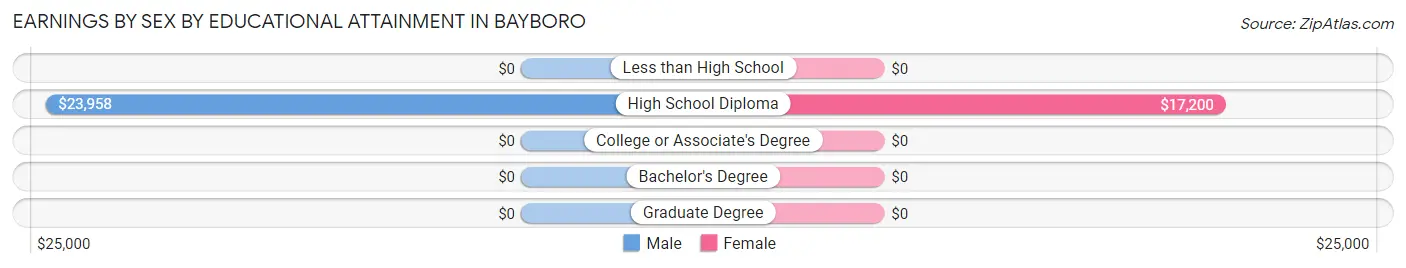
| Educational Attainment | Male Income | Female Income |
| Less than High School | - | - |
| High School Diploma | $23,958 | $17,200 |
| College or Associate's Degree | - | - |
| Bachelor's Degree | - | - |
| Graduate Degree | - | - |
| Total | $24,020 | $17,454 |
Family Income in Bayboro
Family Income Brackets in Bayboro
According to the Bayboro family income data, there are 16 families falling into the $50,000 to $74,999 income range, which is the most common income bracket and makes up 17.8% of all families.
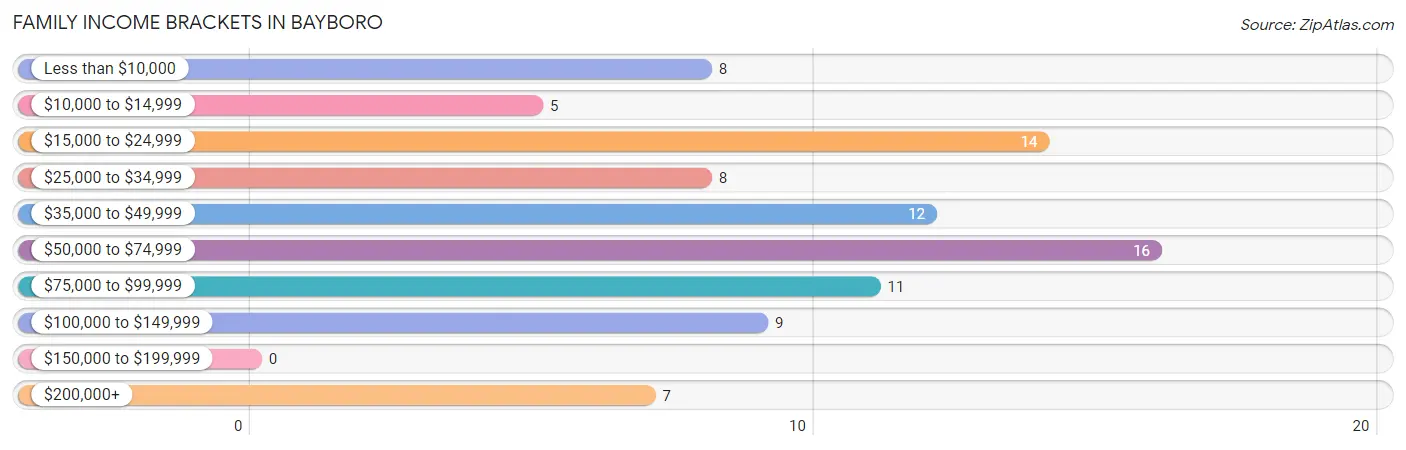
| Income Bracket | # Families | % Families |
| Less than $10,000 | 8 | 8.9% |
| $10,000 to $14,999 | 5 | 5.6% |
| $15,000 to $24,999 | 14 | 15.6% |
| $25,000 to $34,999 | 8 | 8.9% |
| $35,000 to $49,999 | 12 | 13.3% |
| $50,000 to $74,999 | 16 | 17.8% |
| $75,000 to $99,999 | 11 | 12.2% |
| $100,000 to $149,999 | 9 | 10.0% |
| $150,000 to $199,999 | 0 | 0.0% |
| $200,000+ | 7 | 7.8% |
Family Income by Famaliy Size in Bayboro
2-person families (40 | 44.4%) account for the highest median family income in Bayboro with $92,917 per family, while 2-person families (40 | 44.4%) have the highest median income of $46,458 per family member.
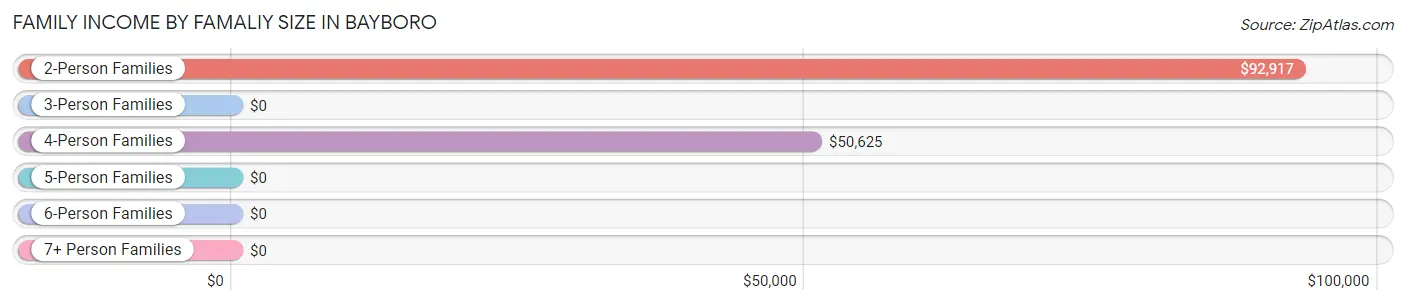
| Income Bracket | # Families | Median Income |
| 2-Person Families | 40 (44.4%) | $92,917 |
| 3-Person Families | 19 (21.1%) | $0 |
| 4-Person Families | 21 (23.3%) | $50,625 |
| 5-Person Families | 3 (3.3%) | $0 |
| 6-Person Families | 0 (0.0%) | $0 |
| 7+ Person Families | 7 (7.8%) | $0 |
| Total | 90 (100.0%) | $48,333 |
Family Income by Number of Earners in Bayboro
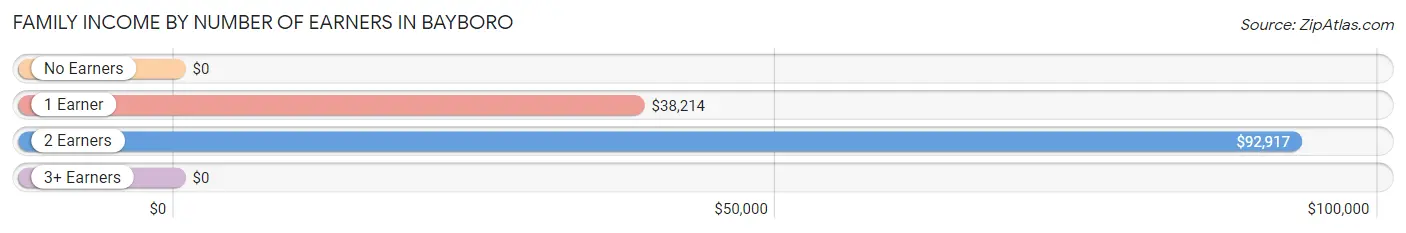
| Number of Earners | # Families | Median Income |
| No Earners | 16 (17.8%) | $0 |
| 1 Earner | 42 (46.7%) | $38,214 |
| 2 Earners | 30 (33.3%) | $92,917 |
| 3+ Earners | 2 (2.2%) | $0 |
| Total | 90 (100.0%) | $48,333 |
Household Income in Bayboro
Household Income Brackets in Bayboro
With 68 households falling in the category, the $15,000 to $24,999 income range is the most frequent in Bayboro, accounting for 30.2% of all households.
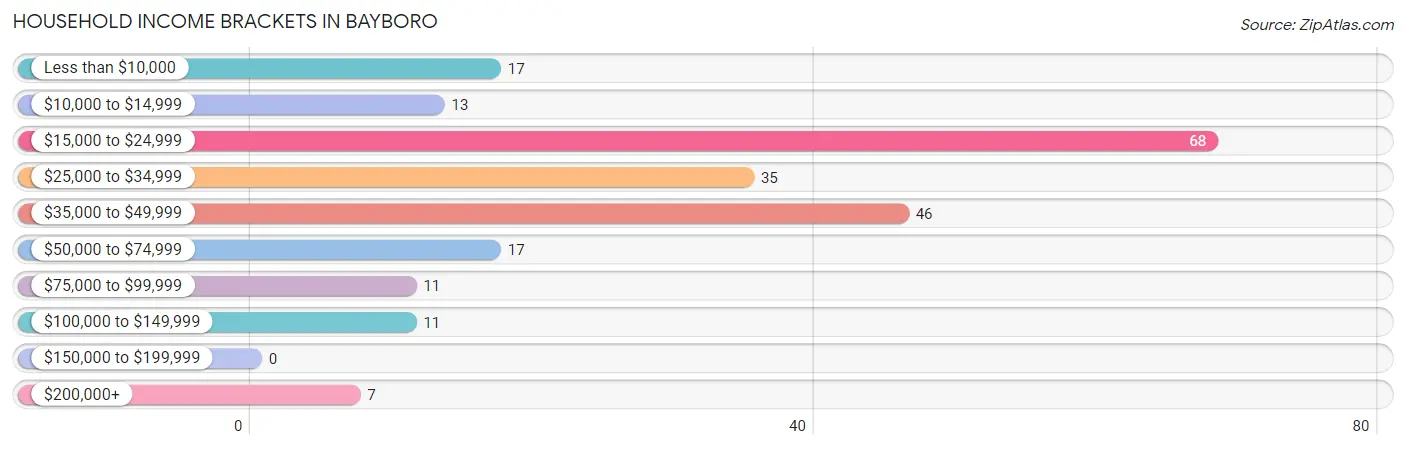
| Income Bracket | # Households | % Households |
| Less than $10,000 | 17 | 7.6% |
| $10,000 to $14,999 | 13 | 5.8% |
| $15,000 to $24,999 | 68 | 30.2% |
| $25,000 to $34,999 | 35 | 15.6% |
| $35,000 to $49,999 | 46 | 20.4% |
| $50,000 to $74,999 | 17 | 7.6% |
| $75,000 to $99,999 | 11 | 4.9% |
| $100,000 to $149,999 | 11 | 4.9% |
| $150,000 to $199,999 | 0 | 0.0% |
| $200,000+ | 7 | 3.1% |
Household Income by Householder Age in Bayboro
The median household income in Bayboro is $28,393, with the highest median household income of $39,450 found in the 45 to 64 years age bracket for the primary householder. A total of 83 households (36.9%) fall into this category.
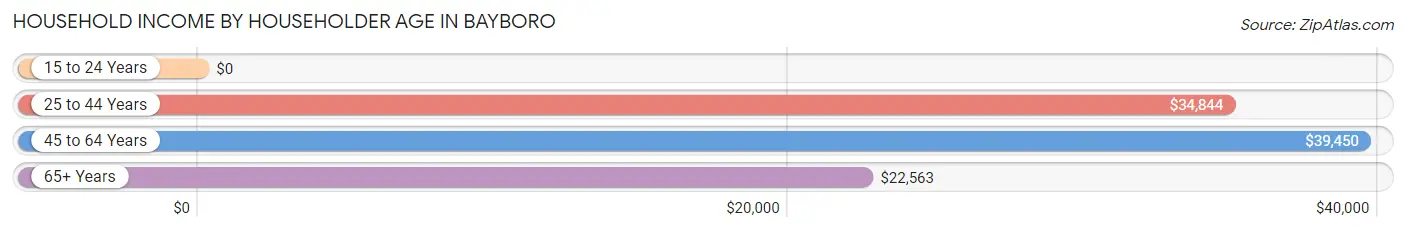
| Income Bracket | # Households | Median Income |
| 15 to 24 Years | 0 (0.0%) | $0 |
| 25 to 44 Years | 49 (21.8%) | $34,844 |
| 45 to 64 Years | 83 (36.9%) | $39,450 |
| 65+ Years | 93 (41.3%) | $22,563 |
| Total | 225 (100.0%) | $28,393 |
Poverty in Bayboro
Income Below Poverty by Sex and Age in Bayboro
With 38.9% poverty level for males and 23.2% for females among the residents of Bayboro, 18 to 24 year old males and 6 to 11 year old females are the most vulnerable to poverty, with 12 males (100.0%) and 3 females (100.0%) in their respective age groups living below the poverty level.
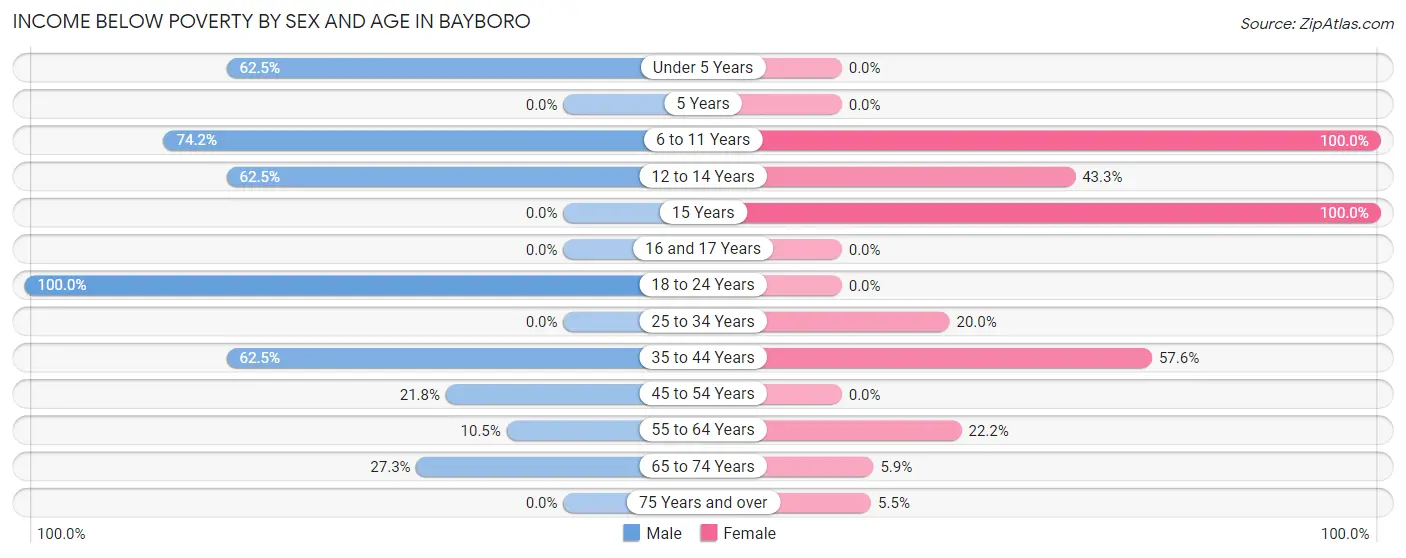
| Age Bracket | Male | Female |
| Under 5 Years | 5 (62.5%) | 0 (0.0%) |
| 5 Years | 0 (0.0%) | 0 (0.0%) |
| 6 to 11 Years | 23 (74.2%) | 3 (100.0%) |
| 12 to 14 Years | 10 (62.5%) | 13 (43.3%) |
| 15 Years | 0 (0.0%) | 13 (100.0%) |
| 16 and 17 Years | 0 (0.0%) | 0 (0.0%) |
| 18 to 24 Years | 12 (100.0%) | 0 (0.0%) |
| 25 to 34 Years | 0 (0.0%) | 3 (20.0%) |
| 35 to 44 Years | 5 (62.5%) | 19 (57.6%) |
| 45 to 54 Years | 12 (21.8%) | 0 (0.0%) |
| 55 to 64 Years | 2 (10.5%) | 14 (22.2%) |
| 65 to 74 Years | 3 (27.3%) | 2 (5.9%) |
| 75 Years and over | 0 (0.0%) | 3 (5.4%) |
| Total | 72 (38.9%) | 70 (23.2%) |
Income Above Poverty by Sex and Age in Bayboro
According to the poverty statistics in Bayboro, males aged 5 years and females aged under 5 years are the age groups that are most secure financially, with 100.0% of males and 100.0% of females in these age groups living above the poverty line.
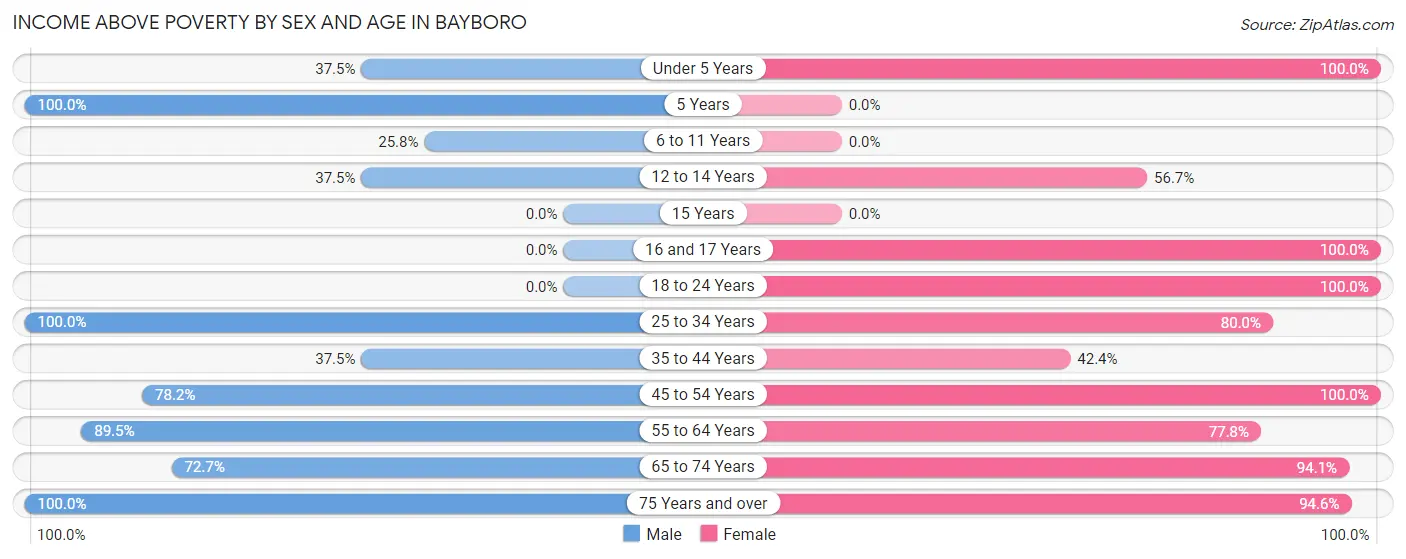
| Age Bracket | Male | Female |
| Under 5 Years | 3 (37.5%) | 2 (100.0%) |
| 5 Years | 1 (100.0%) | 0 (0.0%) |
| 6 to 11 Years | 8 (25.8%) | 0 (0.0%) |
| 12 to 14 Years | 6 (37.5%) | 17 (56.7%) |
| 15 Years | 0 (0.0%) | 0 (0.0%) |
| 16 and 17 Years | 0 (0.0%) | 14 (100.0%) |
| 18 to 24 Years | 0 (0.0%) | 14 (100.0%) |
| 25 to 34 Years | 8 (100.0%) | 12 (80.0%) |
| 35 to 44 Years | 3 (37.5%) | 14 (42.4%) |
| 45 to 54 Years | 43 (78.2%) | 26 (100.0%) |
| 55 to 64 Years | 17 (89.5%) | 49 (77.8%) |
| 65 to 74 Years | 8 (72.7%) | 32 (94.1%) |
| 75 Years and over | 16 (100.0%) | 52 (94.6%) |
| Total | 113 (61.1%) | 232 (76.8%) |
Income Below Poverty Among Married-Couple Families in Bayboro
The poverty statistics for married-couple families in Bayboro show that 19.6% or 11 of the total 56 families live below the poverty line. Families with 3 or 4 children have the highest poverty rate of 70.0%, comprising of 7 families. On the other hand, families with no children have the lowest poverty rate of 3.3%, which includes 1 families.
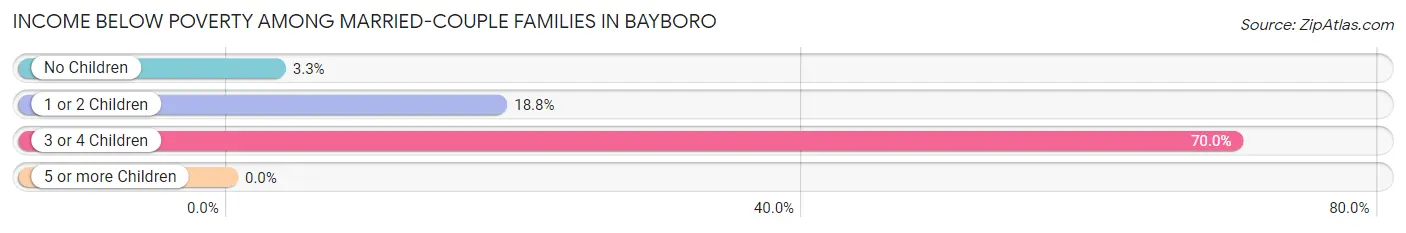
| Children | Above Poverty | Below Poverty |
| No Children | 29 (96.7%) | 1 (3.3%) |
| 1 or 2 Children | 13 (81.2%) | 3 (18.8%) |
| 3 or 4 Children | 3 (30.0%) | 7 (70.0%) |
| 5 or more Children | 0 (0.0%) | 0 (0.0%) |
| Total | 45 (80.4%) | 11 (19.6%) |
Income Below Poverty Among Single-Parent Households in Bayboro
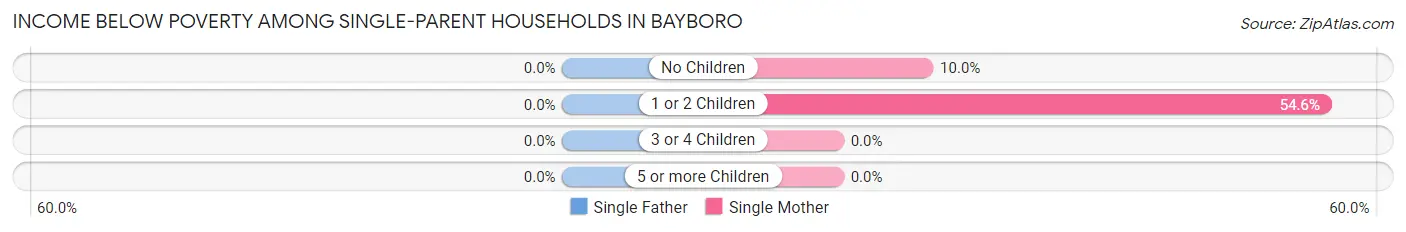
| Children | Single Father | Single Mother |
| No Children | 0 (0.0%) | 1 (10.0%) |
| 1 or 2 Children | 0 (0.0%) | 12 (54.5%) |
| 3 or 4 Children | 0 (0.0%) | 0 (0.0%) |
| 5 or more Children | 0 (0.0%) | 0 (0.0%) |
| Total | 0 (0.0%) | 13 (40.6%) |
Income Below Poverty Among Married-Couple vs Single-Parent Households in Bayboro
The poverty data for Bayboro shows that 11 of the married-couple family households (19.6%) and 13 of the single-parent households (38.2%) are living below the poverty level. Within the married-couple family households, those with 3 or 4 children have the highest poverty rate, with 7 households (70.0%) falling below the poverty line. Among the single-parent households, those with 1 or 2 children have the highest poverty rate, with 12 household (54.5%) living below poverty.
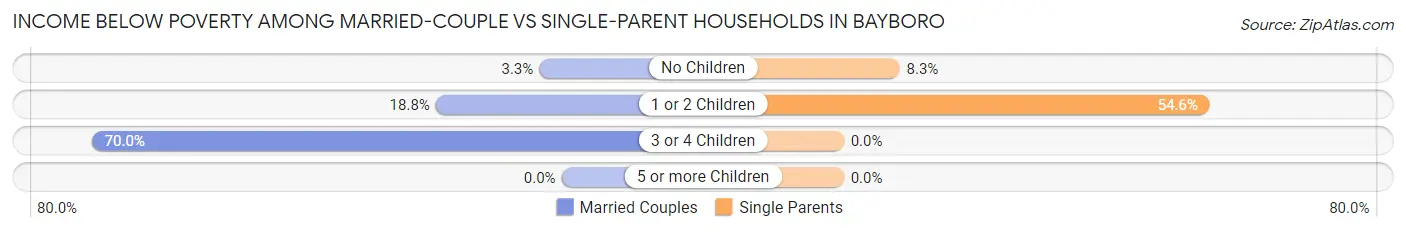
| Children | Married-Couple Families | Single-Parent Households |
| No Children | 1 (3.3%) | 1 (8.3%) |
| 1 or 2 Children | 3 (18.8%) | 12 (54.5%) |
| 3 or 4 Children | 7 (70.0%) | 0 (0.0%) |
| 5 or more Children | 0 (0.0%) | 0 (0.0%) |
| Total | 11 (19.6%) | 13 (38.2%) |
Race in Bayboro
The most populous races in Bayboro are Black / African American (610 | 50.4%), White / Caucasian (495 | 40.9%), and Two or more Races (94 | 7.8%).
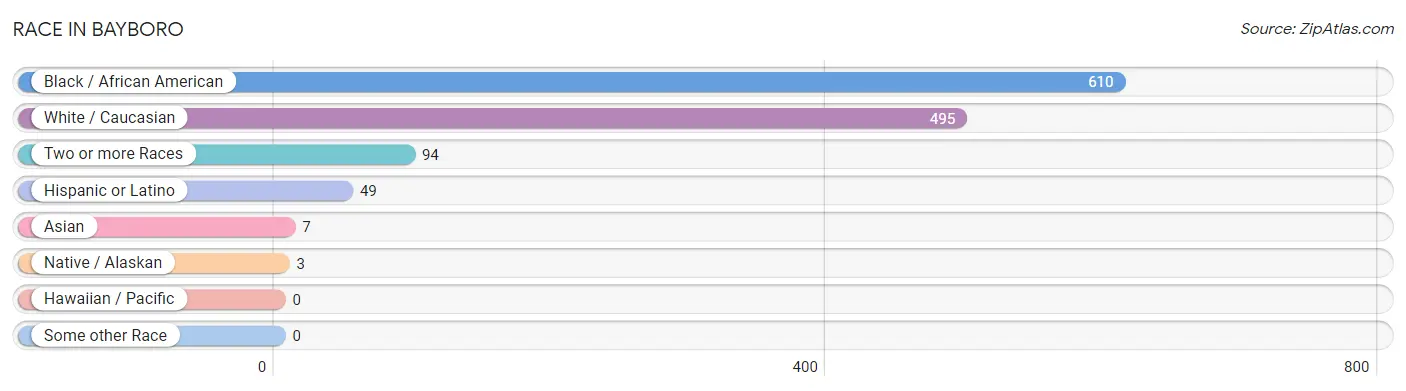
| Race | # Population | % Population |
| Asian | 7 | 0.6% |
| Black / African American | 610 | 50.4% |
| Hawaiian / Pacific | 0 | 0.0% |
| Hispanic or Latino | 49 | 4.1% |
| Native / Alaskan | 3 | 0.3% |
| White / Caucasian | 495 | 40.9% |
| Two or more Races | 94 | 7.8% |
| Some other Race | 0 | 0.0% |
| Total | 1,209 | 100.0% |
Ancestry in Bayboro
The most populous ancestries reported in Bayboro are Irish (126 | 10.4%), German (92 | 7.6%), Mexican (41 | 3.4%), English (17 | 1.4%), and American (16 | 1.3%), together accounting for 24.1% of all Bayboro residents.
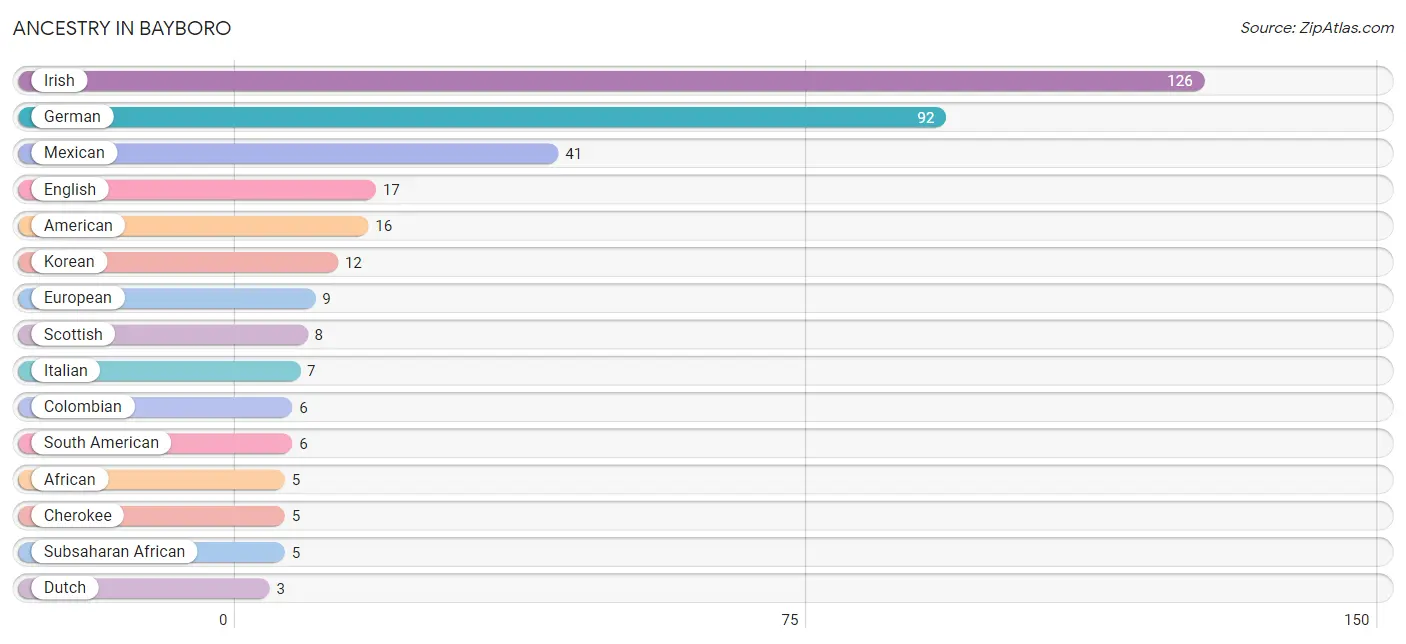
| Ancestry | # Population | % Population |
| African | 5 | 0.4% |
| American | 16 | 1.3% |
| Bhutanese | 2 | 0.2% |
| Cherokee | 5 | 0.4% |
| Colombian | 6 | 0.5% |
| Dutch | 3 | 0.3% |
| English | 17 | 1.4% |
| European | 9 | 0.7% |
| French | 1 | 0.1% |
| German | 92 | 7.6% |
| Irish | 126 | 10.4% |
| Italian | 7 | 0.6% |
| Korean | 12 | 1.0% |
| Lumbee | 3 | 0.3% |
| Mexican | 41 | 3.4% |
| Scandinavian | 3 | 0.3% |
| Scottish | 8 | 0.7% |
| South American | 6 | 0.5% |
| Subsaharan African | 5 | 0.4% |
| Welsh | 1 | 0.1% | View All 20 Rows |
Immigrants in Bayboro
The most numerous immigrant groups reported in Bayboro came from Latin America (18 | 1.5%), Central America (12 | 1.0%), Mexico (12 | 1.0%), Asia (7 | 0.6%), and Philippines (7 | 0.6%), together accounting for 4.6% of all Bayboro residents.
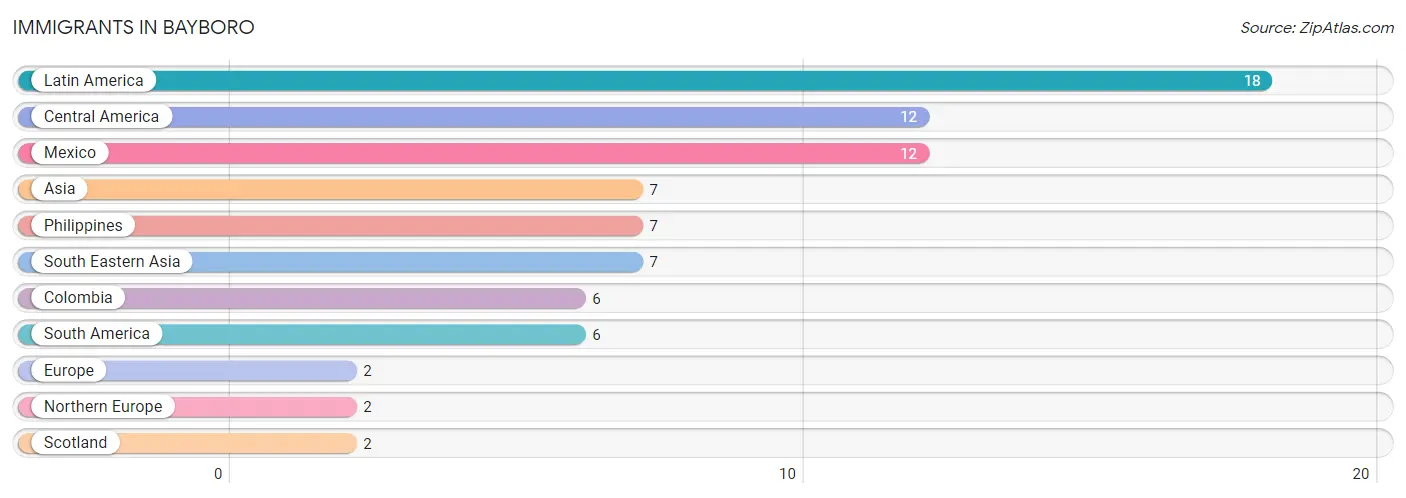
| Immigration Origin | # Population | % Population |
| Asia | 7 | 0.6% |
| Central America | 12 | 1.0% |
| Colombia | 6 | 0.5% |
| Europe | 2 | 0.2% |
| Latin America | 18 | 1.5% |
| Mexico | 12 | 1.0% |
| Northern Europe | 2 | 0.2% |
| Philippines | 7 | 0.6% |
| Scotland | 2 | 0.2% |
| South America | 6 | 0.5% |
| South Eastern Asia | 7 | 0.6% | View All 11 Rows |
Sex and Age in Bayboro
Sex and Age in Bayboro
The most populous age groups in Bayboro are 40 to 44 Years (153 | 16.9%) for men and 85 Years and over (46 | 15.2%) for women.
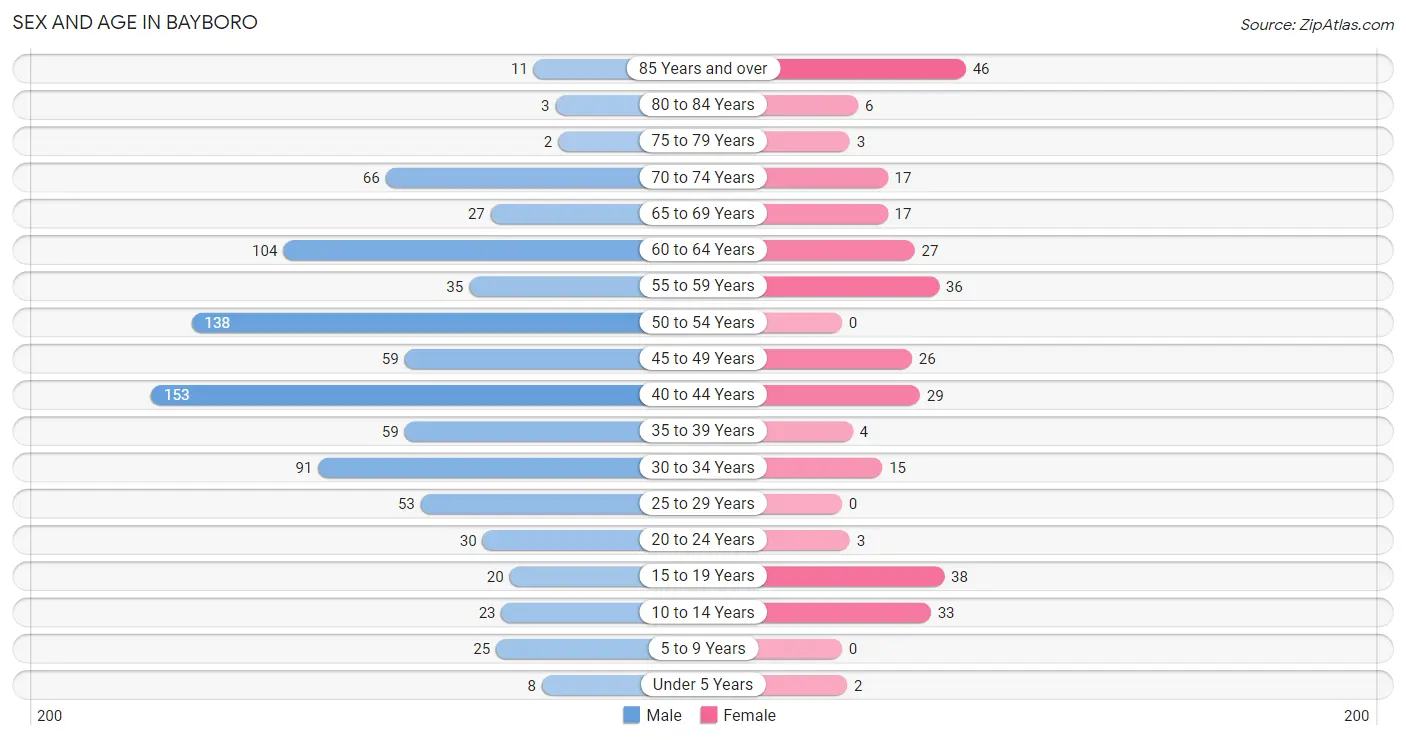
| Age Bracket | Male | Female |
| Under 5 Years | 8 (0.9%) | 2 (0.7%) |
| 5 to 9 Years | 25 (2.8%) | 0 (0.0%) |
| 10 to 14 Years | 23 (2.5%) | 33 (10.9%) |
| 15 to 19 Years | 20 (2.2%) | 38 (12.6%) |
| 20 to 24 Years | 30 (3.3%) | 3 (1.0%) |
| 25 to 29 Years | 53 (5.8%) | 0 (0.0%) |
| 30 to 34 Years | 91 (10.0%) | 15 (5.0%) |
| 35 to 39 Years | 59 (6.5%) | 4 (1.3%) |
| 40 to 44 Years | 153 (16.9%) | 29 (9.6%) |
| 45 to 49 Years | 59 (6.5%) | 26 (8.6%) |
| 50 to 54 Years | 138 (15.2%) | 0 (0.0%) |
| 55 to 59 Years | 35 (3.9%) | 36 (11.9%) |
| 60 to 64 Years | 104 (11.5%) | 27 (8.9%) |
| 65 to 69 Years | 27 (3.0%) | 17 (5.6%) |
| 70 to 74 Years | 66 (7.3%) | 17 (5.6%) |
| 75 to 79 Years | 2 (0.2%) | 3 (1.0%) |
| 80 to 84 Years | 3 (0.3%) | 6 (2.0%) |
| 85 Years and over | 11 (1.2%) | 46 (15.2%) |
| Total | 907 (100.0%) | 302 (100.0%) |
Families and Households in Bayboro
Median Family Size in Bayboro
The median family size in Bayboro is 3.46 persons per family, with married-couple families (56 | 62.2%) accounting for the largest median family size of 3.54 persons per family. On the other hand, single male/father families (2 | 2.2%) represent the smallest median family size with 2.00 persons per family.
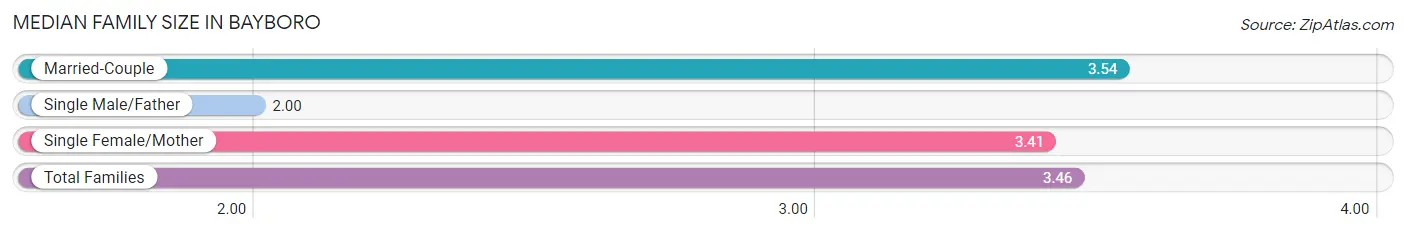
| Family Type | # Families | Family Size |
| Married-Couple | 56 (62.2%) | 3.54 |
| Single Male/Father | 2 (2.2%) | 2.00 |
| Single Female/Mother | 32 (35.6%) | 3.41 |
| Total Families | 90 (100.0%) | 3.46 |
Median Household Size in Bayboro
The median household size in Bayboro is 2.16 persons per household, with married-couple households (56 | 24.9%) accounting for the largest median household size of 3.54 persons per household. non-family households (135 | 60.0%) represent the smallest median household size with 1.30 persons per household.
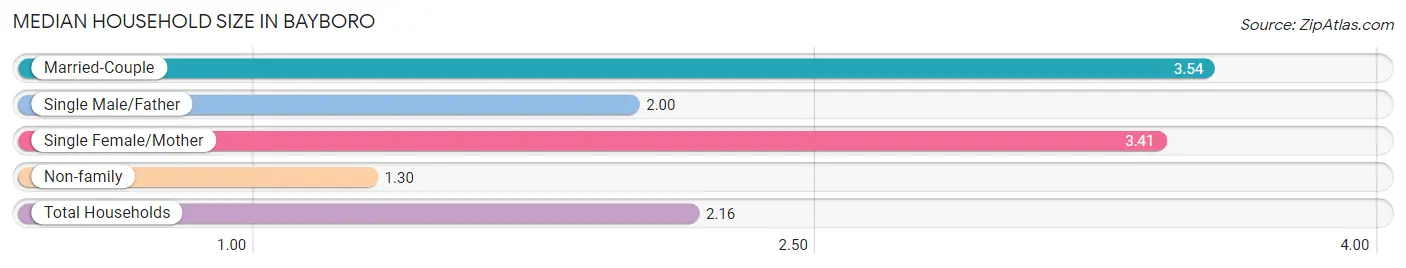
| Household Type | # Households | Household Size |
| Married-Couple | 56 (24.9%) | 3.54 |
| Single Male/Father | 2 (0.9%) | 2.00 |
| Single Female/Mother | 32 (14.2%) | 3.41 |
| Non-family | 135 (60.0%) | 1.30 |
| Total Households | 225 (100.0%) | 2.16 |
Household Size by Marriage Status in Bayboro
Out of a total of 225 households in Bayboro, 90 (40.0%) are family households, while 135 (60.0%) are nonfamily households. The most numerous type of family households are 2-person households, comprising 40, and the most common type of nonfamily households are 1-person households, comprising 101.
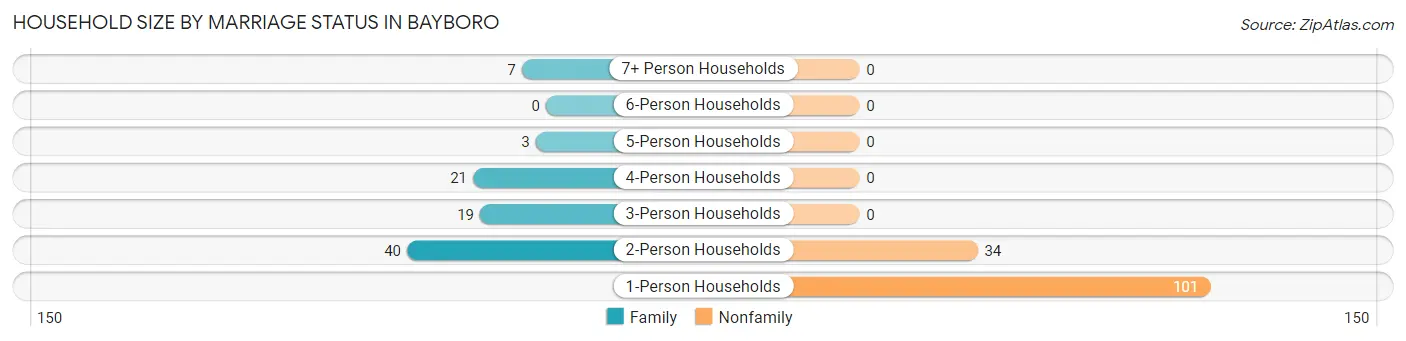
| Household Size | Family Households | Nonfamily Households |
| 1-Person Households | - | 101 (44.9%) |
| 2-Person Households | 40 (17.8%) | 34 (15.1%) |
| 3-Person Households | 19 (8.4%) | 0 (0.0%) |
| 4-Person Households | 21 (9.3%) | 0 (0.0%) |
| 5-Person Households | 3 (1.3%) | 0 (0.0%) |
| 6-Person Households | 0 (0.0%) | 0 (0.0%) |
| 7+ Person Households | 7 (3.1%) | 0 (0.0%) |
| Total | 90 (40.0%) | 135 (60.0%) |
Female Fertility in Bayboro
Fertility by Age in Bayboro
| Age Bracket | Women with Births | Births / 1,000 Women |
| 15 to 19 years | 0 (0.0%) | 0.0 |
| 20 to 34 years | 0 (0.0%) | 0.0 |
| 35 to 50 years | 0 (0.0%) | 0.0 |
| Total | 0 (0.0%) | 0.0 |
Fertility by Age by Marriage Status in Bayboro
| Age Bracket | Married | Unmarried |
| 15 to 19 years | 0 (0.0%) | 0 (0.0%) |
| 20 to 34 years | 0 (0.0%) | 0 (0.0%) |
| 35 to 50 years | 0 (0.0%) | 0 (0.0%) |
| Total | 0 (0.0%) | 0 (0.0%) |
Fertility by Education in Bayboro
| Educational Attainment | Women with Births | Births / 1,000 Women |
| Less than High School | 0 (0.0%) | 0.0 |
| High School Diploma | 0 (0.0%) | 0.0 |
| College or Associate's Degree | 0 (0.0%) | 0.0 |
| Bachelor's Degree | 0 (0.0%) | 0.0 |
| Graduate Degree | 0 (0.0%) | 0.0 |
| Total | 0 (0.0%) | 0.0 |
Fertility by Education by Marriage Status in Bayboro
| Educational Attainment | Married | Unmarried |
| Less than High School | 0 (0.0%) | 0 (0.0%) |
| High School Diploma | 0 (0.0%) | 0 (0.0%) |
| College or Associate's Degree | 0 (0.0%) | 0 (0.0%) |
| Bachelor's Degree | 0 (0.0%) | 0 (0.0%) |
| Graduate Degree | 0 (0.0%) | 0 (0.0%) |
| Total | 0 (0.0%) | 0 (0.0%) |
Employment Characteristics in Bayboro
Employment by Class of Employer in Bayboro
Among the 188 employed individuals in Bayboro, private company employees (159 | 84.6%), self-employed (not incorporated) (11 | 5.9%), and local government employees (8 | 4.3%) make up the most common classes of employment.
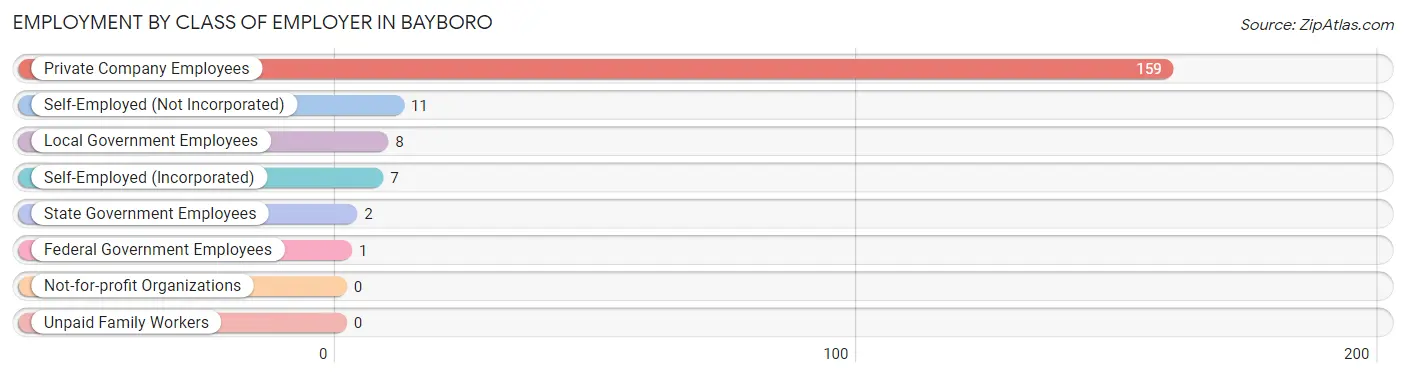
| Employer Class | # Employees | % Employees |
| Private Company Employees | 159 | 84.6% |
| Self-Employed (Incorporated) | 7 | 3.7% |
| Self-Employed (Not Incorporated) | 11 | 5.9% |
| Not-for-profit Organizations | 0 | 0.0% |
| Local Government Employees | 8 | 4.3% |
| State Government Employees | 2 | 1.1% |
| Federal Government Employees | 1 | 0.5% |
| Unpaid Family Workers | 0 | 0.0% |
| Total | 188 | 100.0% |
Employment Status by Age in Bayboro
According to the labor force statistics for Bayboro, out of the total population over 16 years of age (1,105), 17.5% or 193 individuals are in the labor force, with 2.6% or 5 of them unemployed. The age group with the highest labor force participation rate is 45 to 54 years, with 30.9% or 69 individuals in the labor force. Within the labor force, the 20 to 24 years age range has the highest percentage of unemployed individuals, with 100.0% or 3 of them being unemployed.
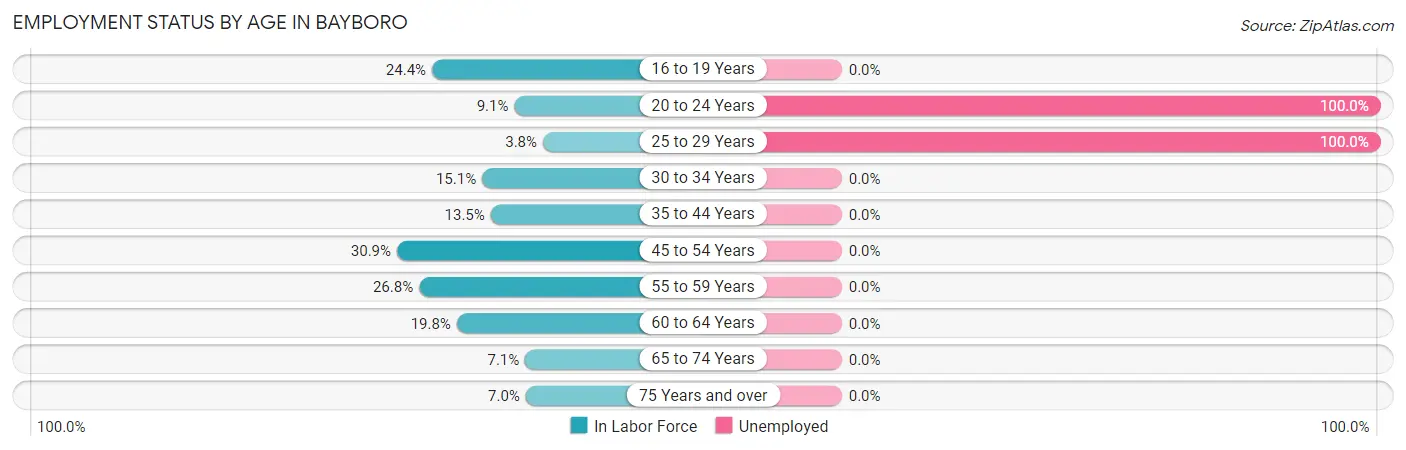
| Age Bracket | In Labor Force | Unemployed |
| 16 to 19 Years | 11 (24.4%) | 0 (0.0%) |
| 20 to 24 Years | 3 (9.1%) | 3 (100.0%) |
| 25 to 29 Years | 2 (3.8%) | 2 (100.0%) |
| 30 to 34 Years | 16 (15.1%) | 0 (0.0%) |
| 35 to 44 Years | 33 (13.5%) | 0 (0.0%) |
| 45 to 54 Years | 69 (30.9%) | 0 (0.0%) |
| 55 to 59 Years | 19 (26.8%) | 0 (0.0%) |
| 60 to 64 Years | 26 (19.8%) | 0 (0.0%) |
| 65 to 74 Years | 9 (7.1%) | 0 (0.0%) |
| 75 Years and over | 5 (7.0%) | 0 (0.0%) |
| Total | 193 (17.5%) | 5 (2.6%) |
Employment Status by Educational Attainment in Bayboro
According to labor force statistics for Bayboro, 19.9% of individuals (165) out of the total population between 25 and 64 years of age (829) are in the labor force, with 1.2% or 2 of them being unemployed. The group with the highest labor force participation rate are those with the educational attainment of high school diploma, with 25.4% or 116 individuals in the labor force. Within the labor force, individuals with college / associate degree education have the highest percentage of unemployment, with 6.7% or 2 of them being unemployed.
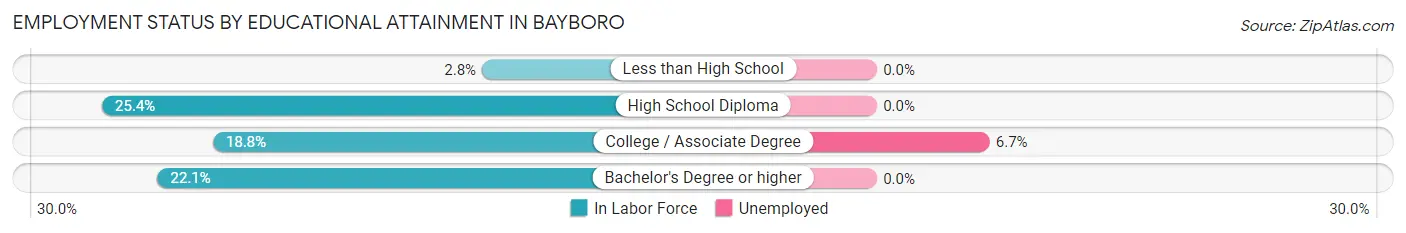
| Educational Attainment | In Labor Force | Unemployed |
| Less than High School | 4 (2.8%) | 0 (0.0%) |
| High School Diploma | 116 (25.4%) | 0 (0.0%) |
| College / Associate Degree | 30 (18.8%) | 11 (6.7%) |
| Bachelor's Degree or higher | 15 (22.1%) | 0 (0.0%) |
| Total | 165 (19.9%) | 10 (1.2%) |
Employment Occupations by Sex in Bayboro
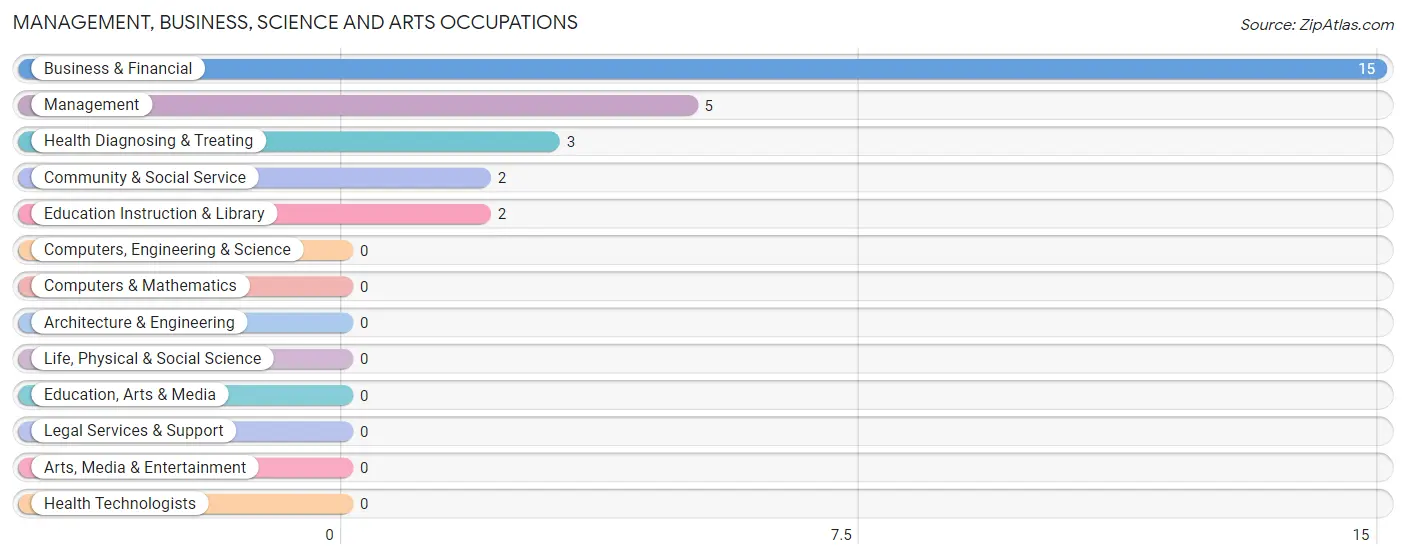
Management, Business, Science and Arts Occupations
The most common Management, Business, Science and Arts occupations in Bayboro are Business & Financial (15 | 8.0%), Management (5 | 2.7%), Health Diagnosing & Treating (3 | 1.6%), Community & Social Service (2 | 1.1%), and Education Instruction & Library (2 | 1.1%).
Management, Business, Science and Arts Occupations by Sex
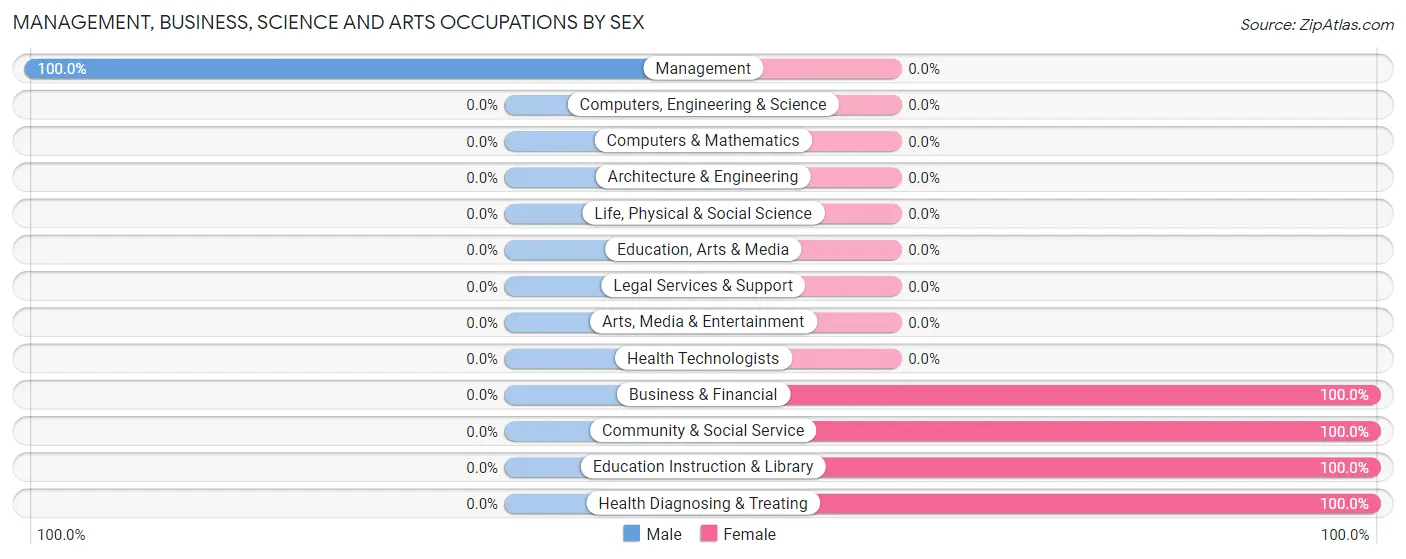
| Occupation | Male | Female |
| Management | 5 (100.0%) | 0 (0.0%) |
| Business & Financial | 0 (0.0%) | 15 (100.0%) |
| Computers, Engineering & Science | 0 (0.0%) | 0 (0.0%) |
| Computers & Mathematics | 0 (0.0%) | 0 (0.0%) |
| Architecture & Engineering | 0 (0.0%) | 0 (0.0%) |
| Life, Physical & Social Science | 0 (0.0%) | 0 (0.0%) |
| Community & Social Service | 0 (0.0%) | 2 (100.0%) |
| Education, Arts & Media | 0 (0.0%) | 0 (0.0%) |
| Legal Services & Support | 0 (0.0%) | 0 (0.0%) |
| Education Instruction & Library | 0 (0.0%) | 2 (100.0%) |
| Arts, Media & Entertainment | 0 (0.0%) | 0 (0.0%) |
| Health Diagnosing & Treating | 0 (0.0%) | 3 (100.0%) |
| Health Technologists | 0 (0.0%) | 0 (0.0%) |
| Total (Category) | 5 (20.0%) | 20 (80.0%) |
| Total (Overall) | 76 (40.4%) | 112 (59.6%) |
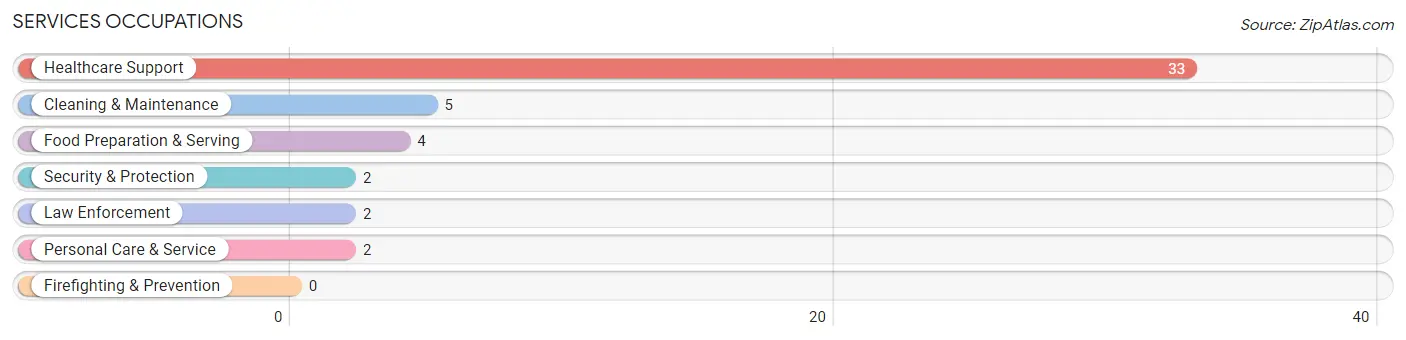
Services Occupations
The most common Services occupations in Bayboro are Healthcare Support (33 | 17.5%), Cleaning & Maintenance (5 | 2.7%), Food Preparation & Serving (4 | 2.1%), Security & Protection (2 | 1.1%), and Law Enforcement (2 | 1.1%).
Services Occupations by Sex
Within the Services occupations in Bayboro, the most male-oriented occupations are Security & Protection (100.0%), Law Enforcement (100.0%), and Cleaning & Maintenance (100.0%), while the most female-oriented occupations are Healthcare Support (100.0%), Food Preparation & Serving (100.0%), and Personal Care & Service (100.0%).
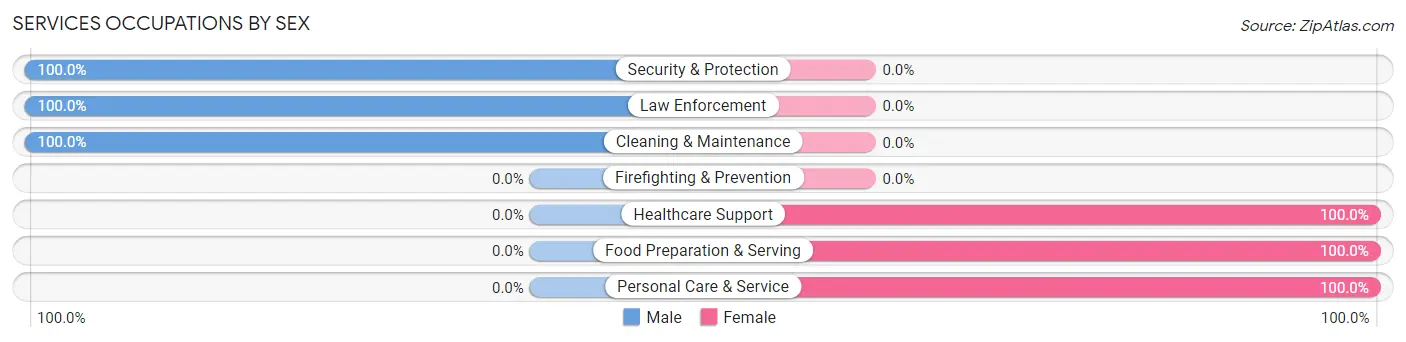
| Occupation | Male | Female |
| Healthcare Support | 0 (0.0%) | 33 (100.0%) |
| Security & Protection | 2 (100.0%) | 0 (0.0%) |
| Firefighting & Prevention | 0 (0.0%) | 0 (0.0%) |
| Law Enforcement | 2 (100.0%) | 0 (0.0%) |
| Food Preparation & Serving | 0 (0.0%) | 4 (100.0%) |
| Cleaning & Maintenance | 5 (100.0%) | 0 (0.0%) |
| Personal Care & Service | 0 (0.0%) | 2 (100.0%) |
| Total (Category) | 7 (15.2%) | 39 (84.8%) |
| Total (Overall) | 76 (40.4%) | 112 (59.6%) |
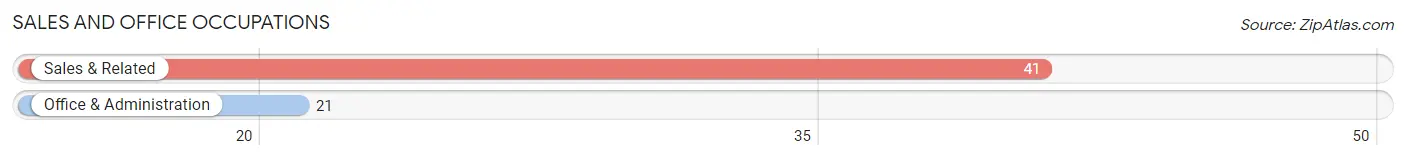
Sales and Office Occupations
The most common Sales and Office occupations in Bayboro are Sales & Related (41 | 21.8%), and Office & Administration (21 | 11.2%).
Sales and Office Occupations by Sex
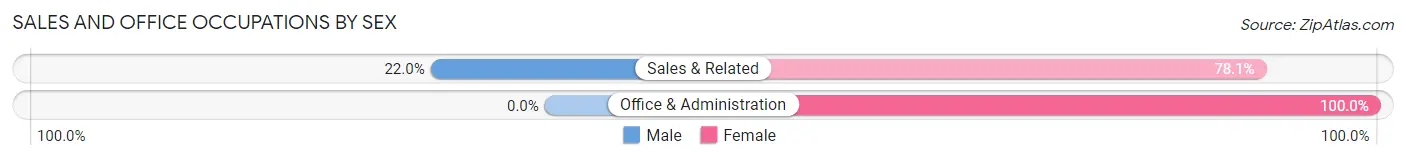
| Occupation | Male | Female |
| Sales & Related | 9 (22.0%) | 32 (78.0%) |
| Office & Administration | 0 (0.0%) | 21 (100.0%) |
| Total (Category) | 9 (14.5%) | 53 (85.5%) |
| Total (Overall) | 76 (40.4%) | 112 (59.6%) |
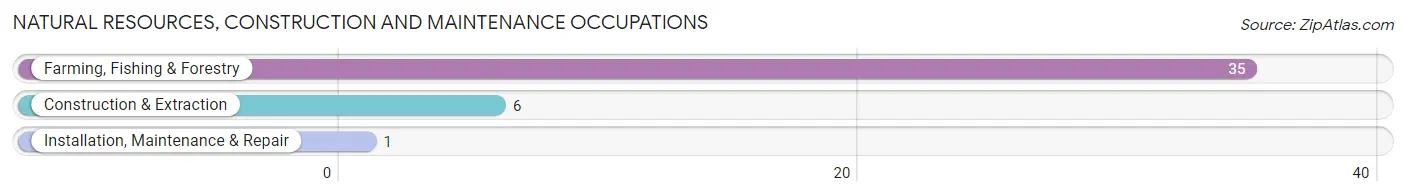
Natural Resources, Construction and Maintenance Occupations
The most common Natural Resources, Construction and Maintenance occupations in Bayboro are Farming, Fishing & Forestry (35 | 18.6%), Construction & Extraction (6 | 3.2%), and Installation, Maintenance & Repair (1 | 0.5%).
Natural Resources, Construction and Maintenance Occupations by Sex
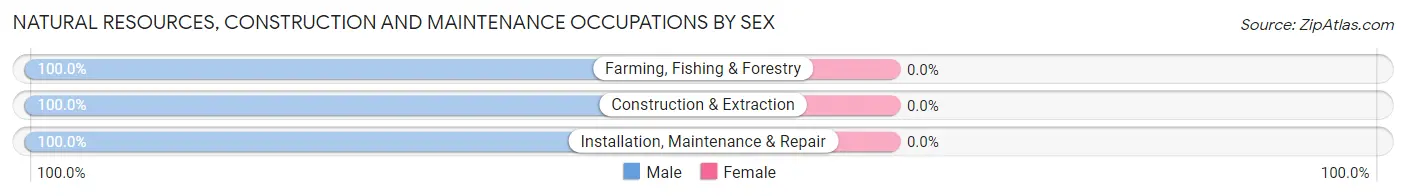
| Occupation | Male | Female |
| Farming, Fishing & Forestry | 35 (100.0%) | 0 (0.0%) |
| Construction & Extraction | 6 (100.0%) | 0 (0.0%) |
| Installation, Maintenance & Repair | 1 (100.0%) | 0 (0.0%) |
| Total (Category) | 42 (100.0%) | 0 (0.0%) |
| Total (Overall) | 76 (40.4%) | 112 (59.6%) |
Production, Transportation and Moving Occupations
The most common Production, Transportation and Moving occupations in Bayboro are Production (8 | 4.3%), Transportation (4 | 2.1%), and Material Moving (1 | 0.5%).
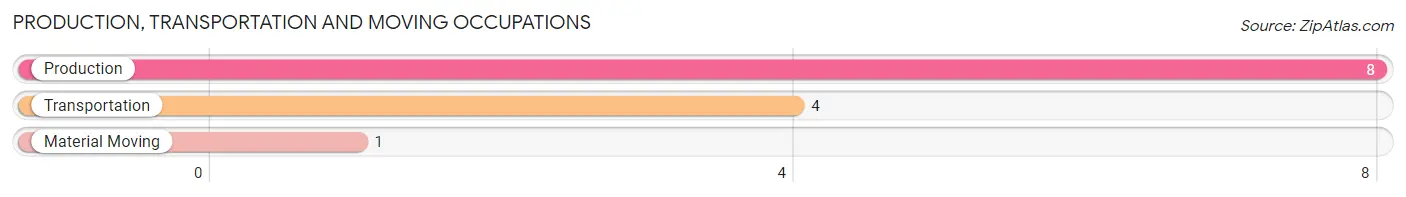
Production, Transportation and Moving Occupations by Sex
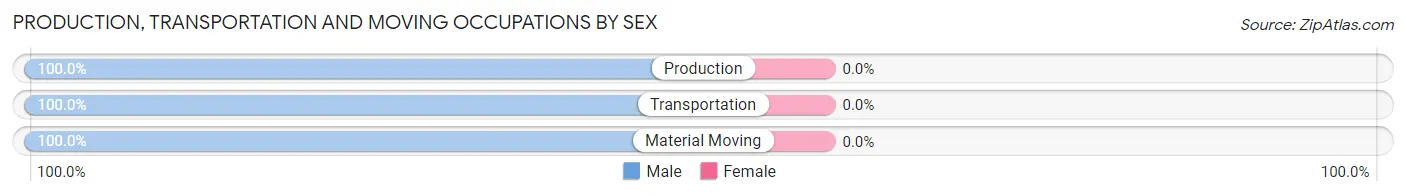
| Occupation | Male | Female |
| Production | 8 (100.0%) | 0 (0.0%) |
| Transportation | 4 (100.0%) | 0 (0.0%) |
| Material Moving | 1 (100.0%) | 0 (0.0%) |
| Total (Category) | 13 (100.0%) | 0 (0.0%) |
| Total (Overall) | 76 (40.4%) | 112 (59.6%) |
Employment Industries by Sex in Bayboro
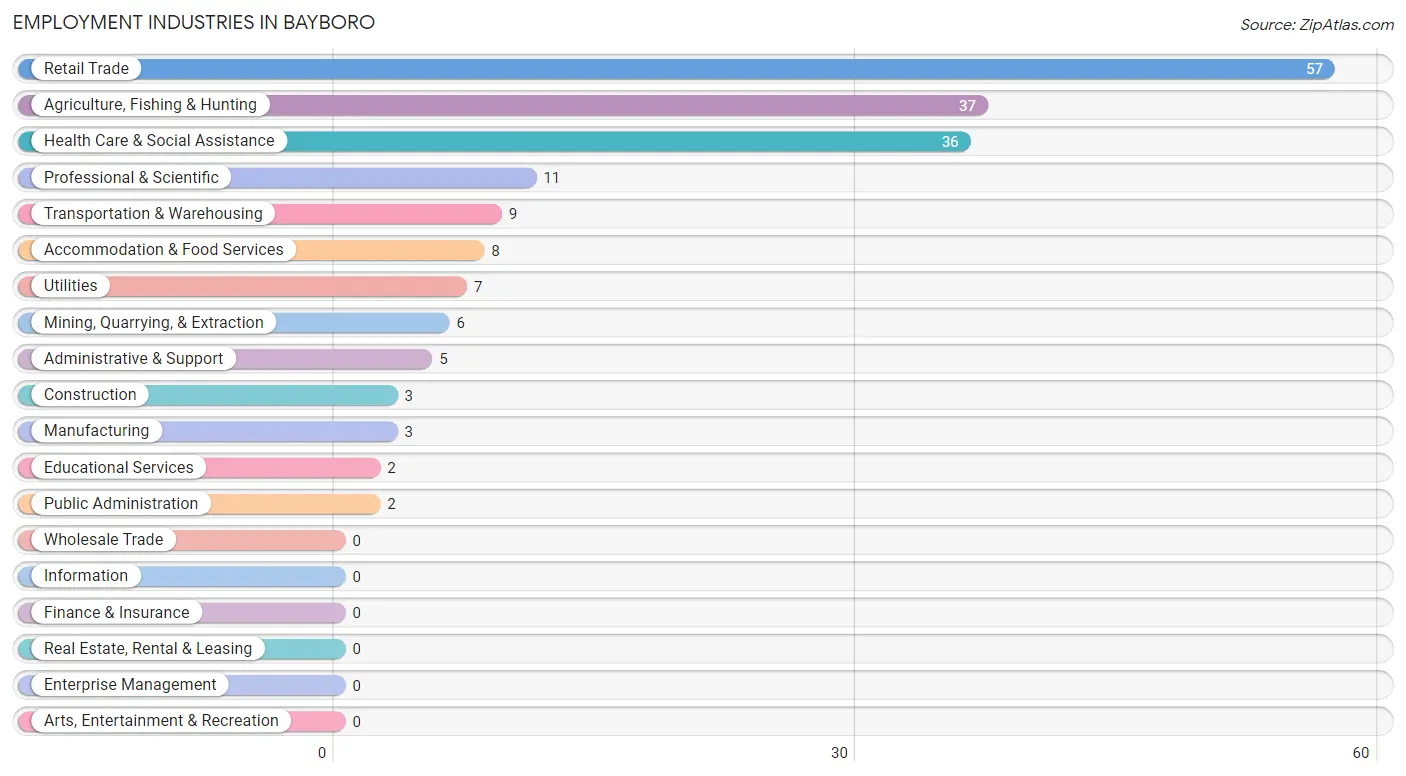
Employment Industries in Bayboro
The major employment industries in Bayboro include Retail Trade (57 | 30.3%), Agriculture, Fishing & Hunting (37 | 19.7%), Health Care & Social Assistance (36 | 19.2%), Professional & Scientific (11 | 5.9%), and Transportation & Warehousing (9 | 4.8%).
Employment Industries by Sex in Bayboro
The Bayboro industries that see more men than women are Agriculture, Fishing & Hunting (100.0%), Mining, Quarrying, & Extraction (100.0%), and Construction (100.0%), whereas the industries that tend to have a higher number of women are Professional & Scientific (100.0%), Educational Services (100.0%), and Health Care & Social Assistance (100.0%).
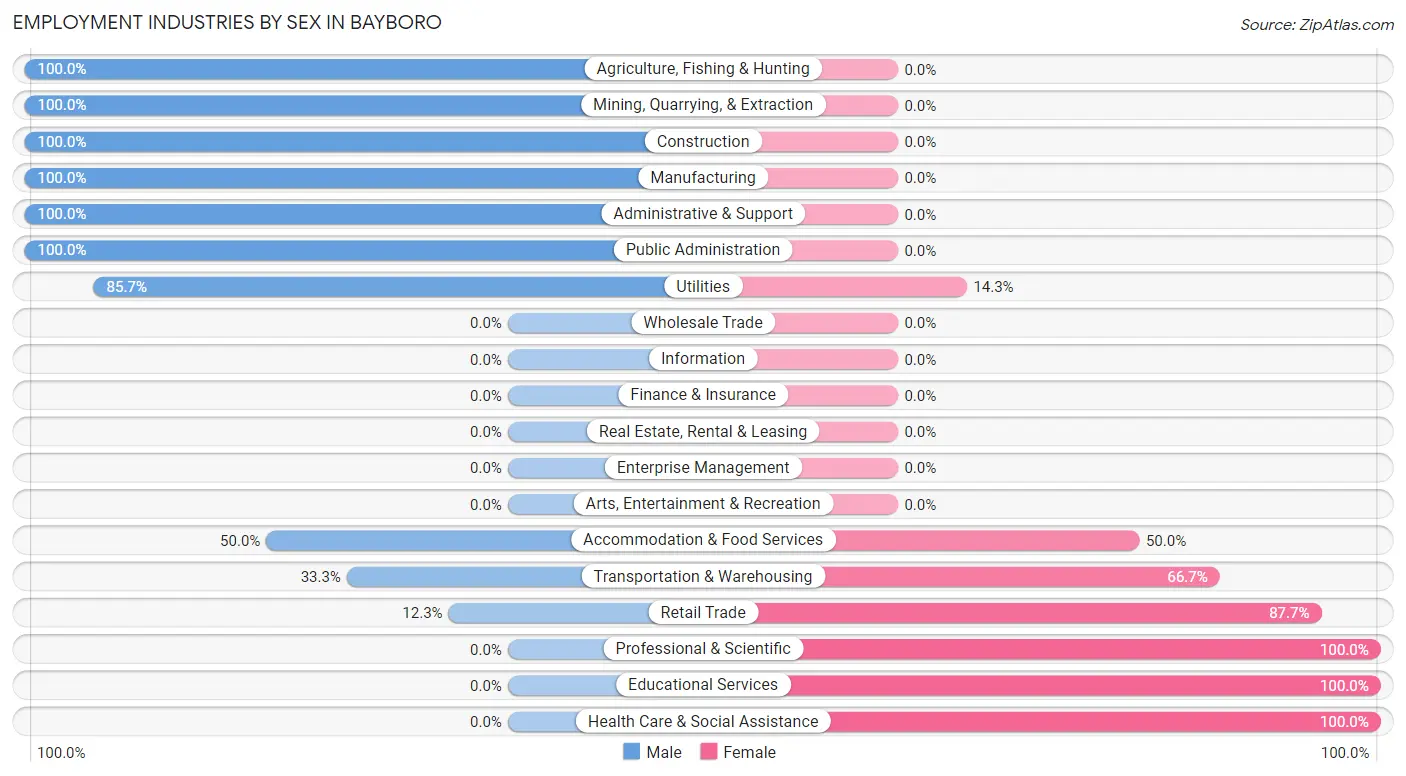
| Industry | Male | Female |
| Agriculture, Fishing & Hunting | 37 (100.0%) | 0 (0.0%) |
| Mining, Quarrying, & Extraction | 6 (100.0%) | 0 (0.0%) |
| Construction | 3 (100.0%) | 0 (0.0%) |
| Manufacturing | 3 (100.0%) | 0 (0.0%) |
| Wholesale Trade | 0 (0.0%) | 0 (0.0%) |
| Retail Trade | 7 (12.3%) | 50 (87.7%) |
| Transportation & Warehousing | 3 (33.3%) | 6 (66.7%) |
| Utilities | 6 (85.7%) | 1 (14.3%) |
| Information | 0 (0.0%) | 0 (0.0%) |
| Finance & Insurance | 0 (0.0%) | 0 (0.0%) |
| Real Estate, Rental & Leasing | 0 (0.0%) | 0 (0.0%) |
| Professional & Scientific | 0 (0.0%) | 11 (100.0%) |
| Enterprise Management | 0 (0.0%) | 0 (0.0%) |
| Administrative & Support | 5 (100.0%) | 0 (0.0%) |
| Educational Services | 0 (0.0%) | 2 (100.0%) |
| Health Care & Social Assistance | 0 (0.0%) | 36 (100.0%) |
| Arts, Entertainment & Recreation | 0 (0.0%) | 0 (0.0%) |
| Accommodation & Food Services | 4 (50.0%) | 4 (50.0%) |
| Public Administration | 2 (100.0%) | 0 (0.0%) |
| Total | 76 (40.4%) | 112 (59.6%) |
Education in Bayboro
School Enrollment in Bayboro
The most common levels of schooling among the 135 students in Bayboro are high school (66 | 48.9%), middle school (29 | 21.5%), and college / undergraduate (21 | 15.6%).
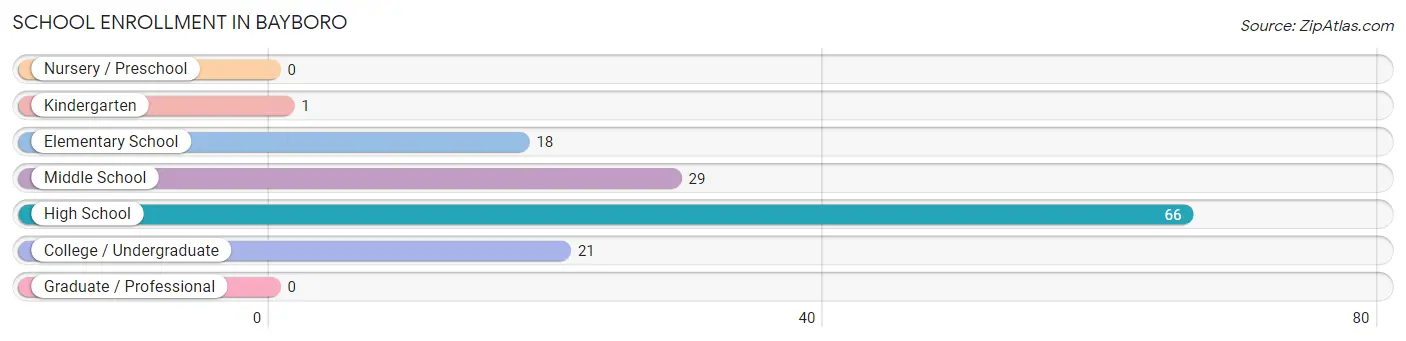
| School Level | # Students | % Students |
| Nursery / Preschool | 0 | 0.0% |
| Kindergarten | 1 | 0.7% |
| Elementary School | 18 | 13.3% |
| Middle School | 29 | 21.5% |
| High School | 66 | 48.9% |
| College / Undergraduate | 21 | 15.6% |
| Graduate / Professional | 0 | 0.0% |
| Total | 135 | 100.0% |
School Enrollment by Age by Funding Source in Bayboro
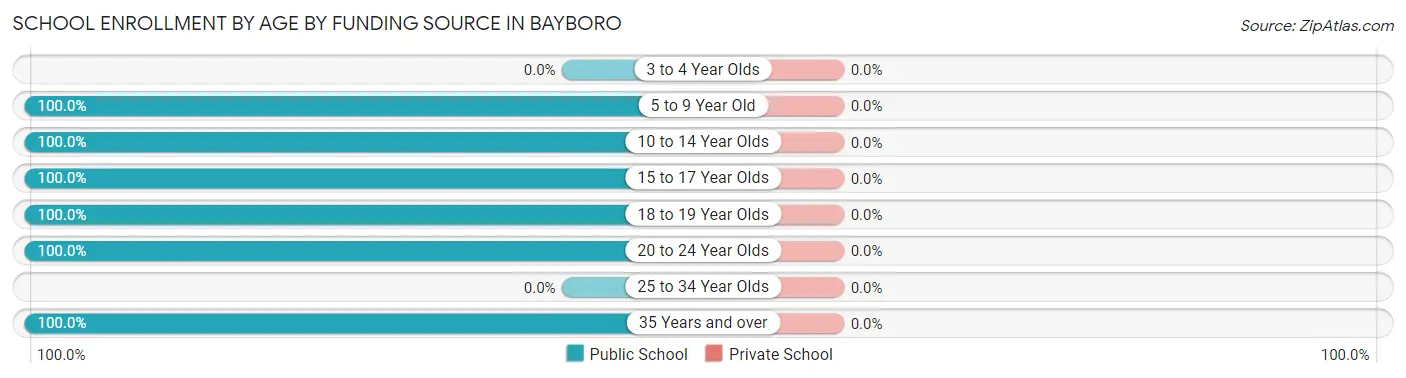
| Age Bracket | Public School | Private School |
| 3 to 4 Year Olds | 0 (0.0%) | 0 (0.0%) |
| 5 to 9 Year Old | 19 (100.0%) | 0 (0.0%) |
| 10 to 14 Year Olds | 56 (100.0%) | 0 (0.0%) |
| 15 to 17 Year Olds | 27 (100.0%) | 0 (0.0%) |
| 18 to 19 Year Olds | 23 (100.0%) | 0 (0.0%) |
| 20 to 24 Year Olds | 3 (100.0%) | 0 (0.0%) |
| 25 to 34 Year Olds | 0 (0.0%) | 0 (0.0%) |
| 35 Years and over | 7 (100.0%) | 0 (0.0%) |
| Total | 135 (100.0%) | 0 (0.0%) |
Educational Attainment by Field of Study in Bayboro
Business (51 | 63.7%), education (16 | 20.0%), liberal arts & history (5 | 6.2%), bio, nature & agricultural (3 | 3.7%), and literature & languages (2 | 2.5%) are the most common fields of study among 80 individuals in Bayboro who have obtained a bachelor's degree or higher.
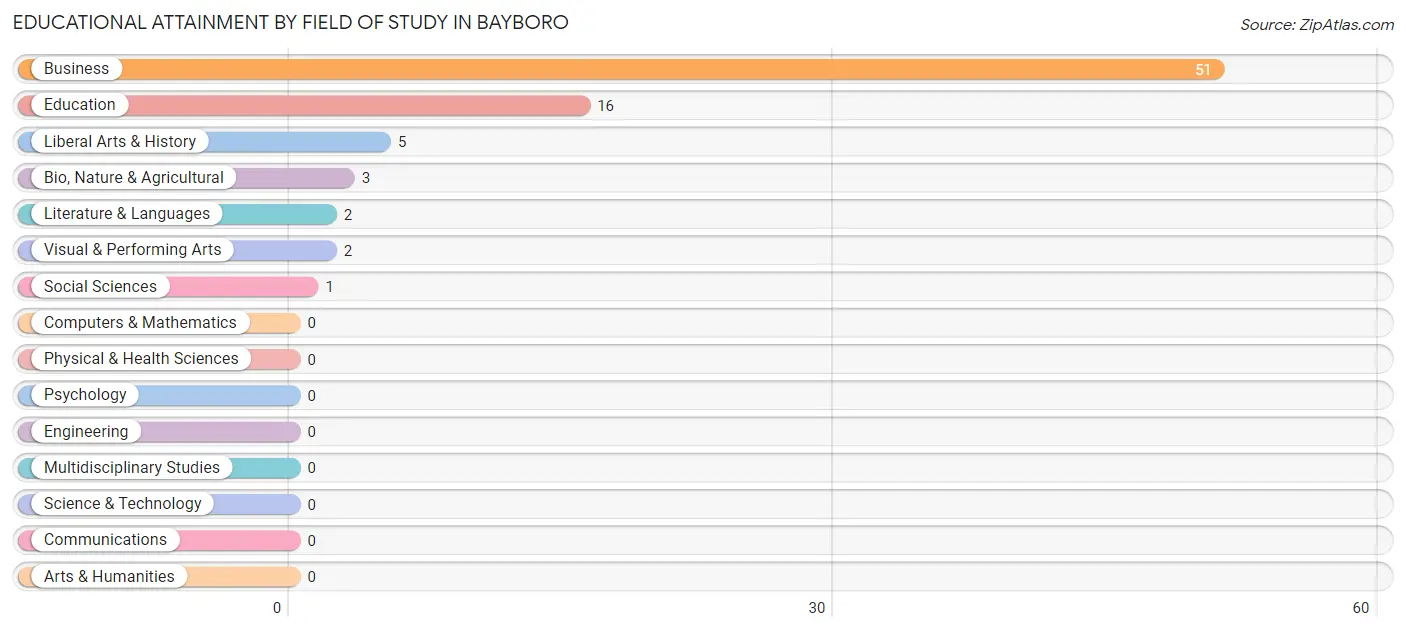
| Field of Study | # Graduates | % Graduates |
| Computers & Mathematics | 0 | 0.0% |
| Bio, Nature & Agricultural | 3 | 3.7% |
| Physical & Health Sciences | 0 | 0.0% |
| Psychology | 0 | 0.0% |
| Social Sciences | 1 | 1.3% |
| Engineering | 0 | 0.0% |
| Multidisciplinary Studies | 0 | 0.0% |
| Science & Technology | 0 | 0.0% |
| Business | 51 | 63.7% |
| Education | 16 | 20.0% |
| Literature & Languages | 2 | 2.5% |
| Liberal Arts & History | 5 | 6.2% |
| Visual & Performing Arts | 2 | 2.5% |
| Communications | 0 | 0.0% |
| Arts & Humanities | 0 | 0.0% |
| Total | 80 | 100.0% |
Transportation & Commute in Bayboro
Vehicle Availability by Sex in Bayboro
The most prevalent vehicle ownership categories in Bayboro are males with 1 vehicle (43, accounting for 56.6%) and females with 1 vehicle (42, making up 38.4%).
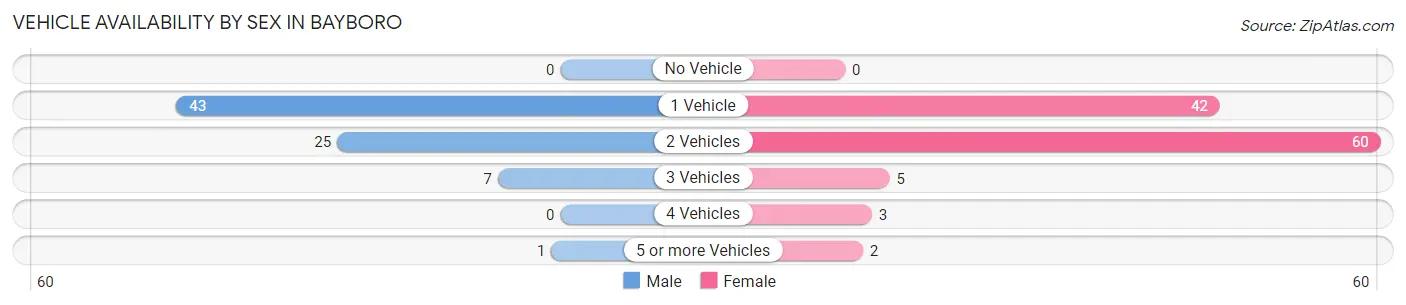
| Vehicles Available | Male | Female |
| No Vehicle | 0 (0.0%) | 0 (0.0%) |
| 1 Vehicle | 43 (56.6%) | 42 (37.5%) |
| 2 Vehicles | 25 (32.9%) | 60 (53.6%) |
| 3 Vehicles | 7 (9.2%) | 5 (4.5%) |
| 4 Vehicles | 0 (0.0%) | 3 (2.7%) |
| 5 or more Vehicles | 1 (1.3%) | 2 (1.8%) |
| Total | 76 (100.0%) | 112 (100.0%) |
Commute Time in Bayboro
The most frequently occuring commute durations in Bayboro are 10 to 14 minutes (67 commuters, 36.0%), 5 to 9 minutes (38 commuters, 20.4%), and 15 to 19 minutes (28 commuters, 15.0%).
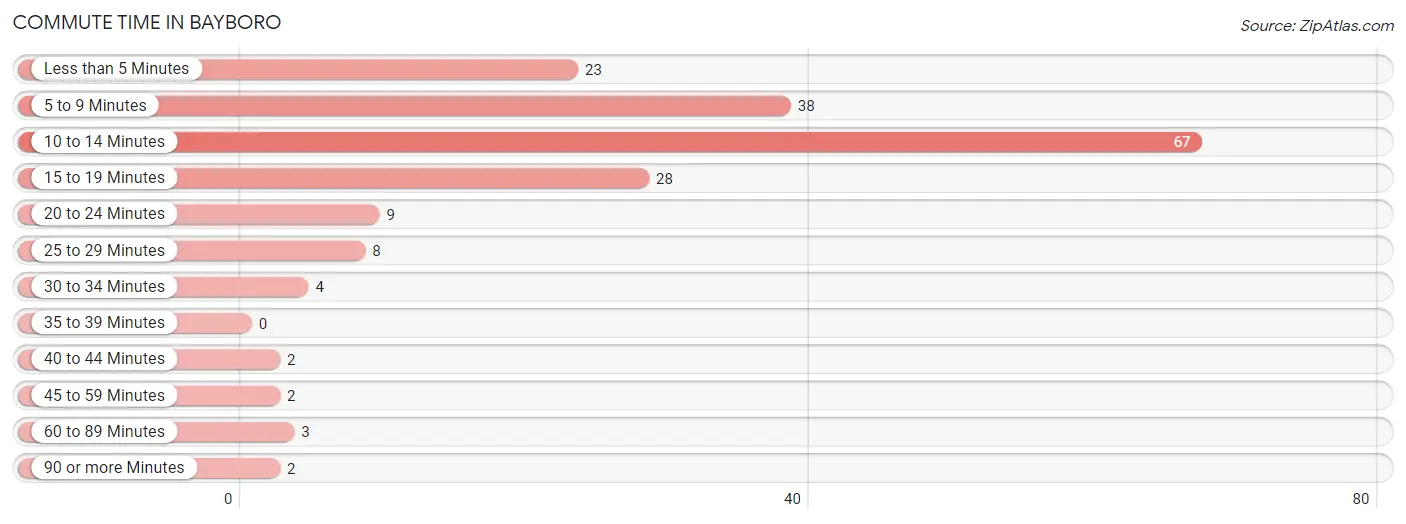
| Commute Time | # Commuters | % Commuters |
| Less than 5 Minutes | 23 | 12.4% |
| 5 to 9 Minutes | 38 | 20.4% |
| 10 to 14 Minutes | 67 | 36.0% |
| 15 to 19 Minutes | 28 | 15.0% |
| 20 to 24 Minutes | 9 | 4.8% |
| 25 to 29 Minutes | 8 | 4.3% |
| 30 to 34 Minutes | 4 | 2.1% |
| 35 to 39 Minutes | 0 | 0.0% |
| 40 to 44 Minutes | 2 | 1.1% |
| 45 to 59 Minutes | 2 | 1.1% |
| 60 to 89 Minutes | 3 | 1.6% |
| 90 or more Minutes | 2 | 1.1% |
Commute Time by Sex in Bayboro
The most common commute times in Bayboro are 10 to 14 minutes (41 commuters, 55.4%) for males and 5 to 9 minutes (31 commuters, 27.7%) for females.
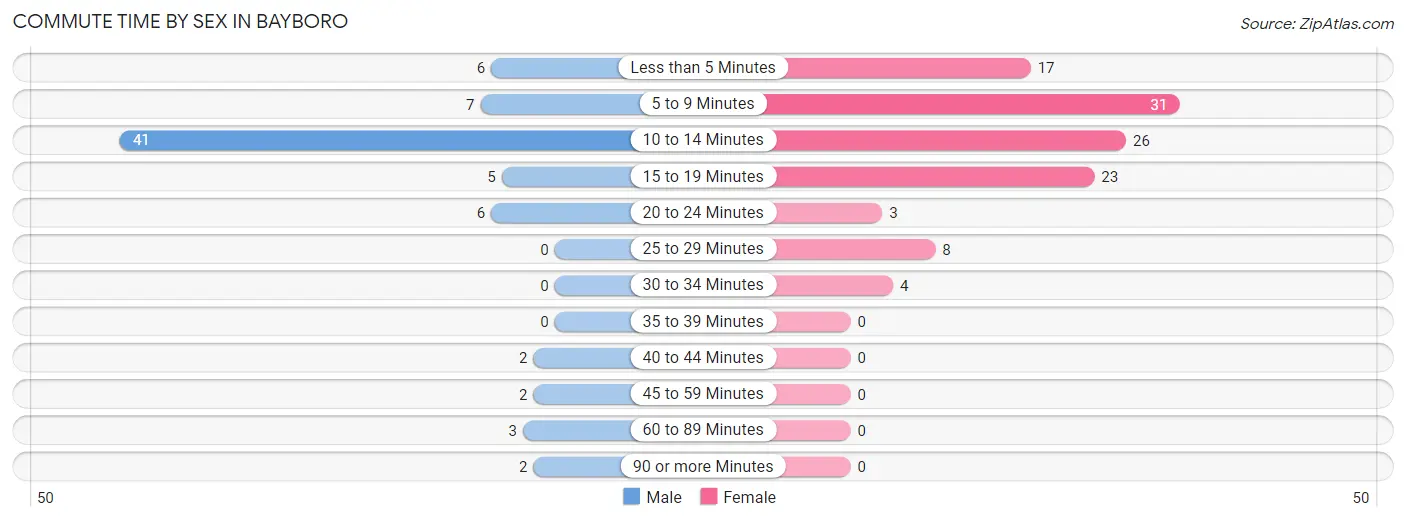
| Commute Time | Male | Female |
| Less than 5 Minutes | 6 (8.1%) | 17 (15.2%) |
| 5 to 9 Minutes | 7 (9.5%) | 31 (27.7%) |
| 10 to 14 Minutes | 41 (55.4%) | 26 (23.2%) |
| 15 to 19 Minutes | 5 (6.8%) | 23 (20.5%) |
| 20 to 24 Minutes | 6 (8.1%) | 3 (2.7%) |
| 25 to 29 Minutes | 0 (0.0%) | 8 (7.1%) |
| 30 to 34 Minutes | 0 (0.0%) | 4 (3.6%) |
| 35 to 39 Minutes | 0 (0.0%) | 0 (0.0%) |
| 40 to 44 Minutes | 2 (2.7%) | 0 (0.0%) |
| 45 to 59 Minutes | 2 (2.7%) | 0 (0.0%) |
| 60 to 89 Minutes | 3 (4.1%) | 0 (0.0%) |
| 90 or more Minutes | 2 (2.7%) | 0 (0.0%) |
Time of Departure to Work by Sex in Bayboro
The most frequent times of departure to work in Bayboro are 7:00 AM to 7:29 AM (36, 48.6%) for males and 8:00 AM to 8:29 AM (46, 41.1%) for females.
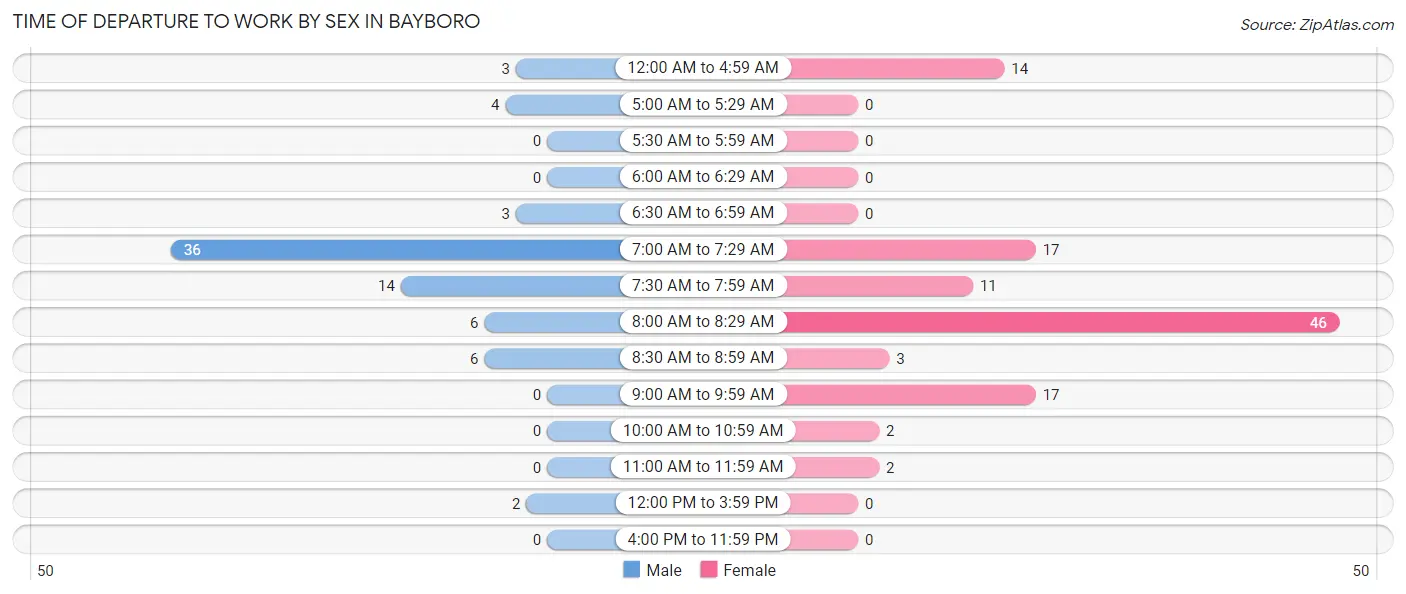
| Time of Departure | Male | Female |
| 12:00 AM to 4:59 AM | 3 (4.1%) | 14 (12.5%) |
| 5:00 AM to 5:29 AM | 4 (5.4%) | 0 (0.0%) |
| 5:30 AM to 5:59 AM | 0 (0.0%) | 0 (0.0%) |
| 6:00 AM to 6:29 AM | 0 (0.0%) | 0 (0.0%) |
| 6:30 AM to 6:59 AM | 3 (4.1%) | 0 (0.0%) |
| 7:00 AM to 7:29 AM | 36 (48.6%) | 17 (15.2%) |
| 7:30 AM to 7:59 AM | 14 (18.9%) | 11 (9.8%) |
| 8:00 AM to 8:29 AM | 6 (8.1%) | 46 (41.1%) |
| 8:30 AM to 8:59 AM | 6 (8.1%) | 3 (2.7%) |
| 9:00 AM to 9:59 AM | 0 (0.0%) | 17 (15.2%) |
| 10:00 AM to 10:59 AM | 0 (0.0%) | 2 (1.8%) |
| 11:00 AM to 11:59 AM | 0 (0.0%) | 2 (1.8%) |
| 12:00 PM to 3:59 PM | 2 (2.7%) | 0 (0.0%) |
| 4:00 PM to 11:59 PM | 0 (0.0%) | 0 (0.0%) |
| Total | 74 (100.0%) | 112 (100.0%) |
Housing Occupancy in Bayboro
Occupancy by Ownership in Bayboro
Of the total 225 dwellings in Bayboro, owner-occupied units account for 144 (64.0%), while renter-occupied units make up 81 (36.0%).
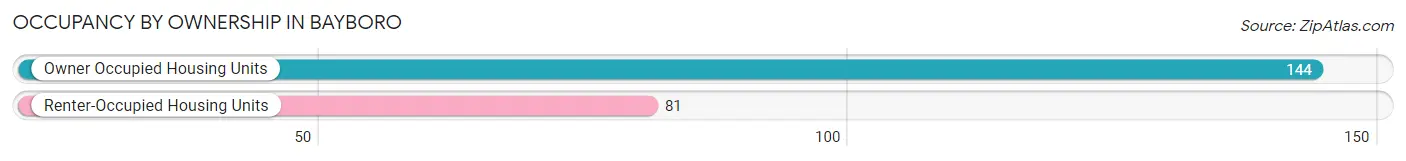
| Occupancy | # Housing Units | % Housing Units |
| Owner Occupied Housing Units | 144 | 64.0% |
| Renter-Occupied Housing Units | 81 | 36.0% |
| Total Occupied Housing Units | 225 | 100.0% |
Occupancy by Household Size in Bayboro
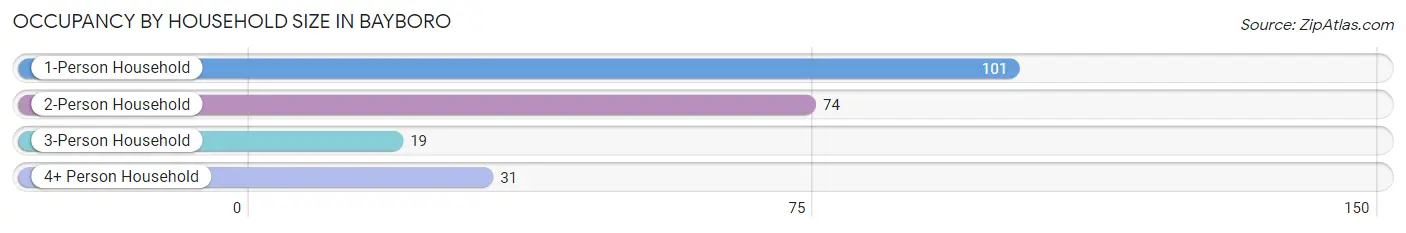
| Household Size | # Housing Units | % Housing Units |
| 1-Person Household | 101 | 44.9% |
| 2-Person Household | 74 | 32.9% |
| 3-Person Household | 19 | 8.4% |
| 4+ Person Household | 31 | 13.8% |
| Total Housing Units | 225 | 100.0% |
Occupancy by Ownership by Household Size in Bayboro
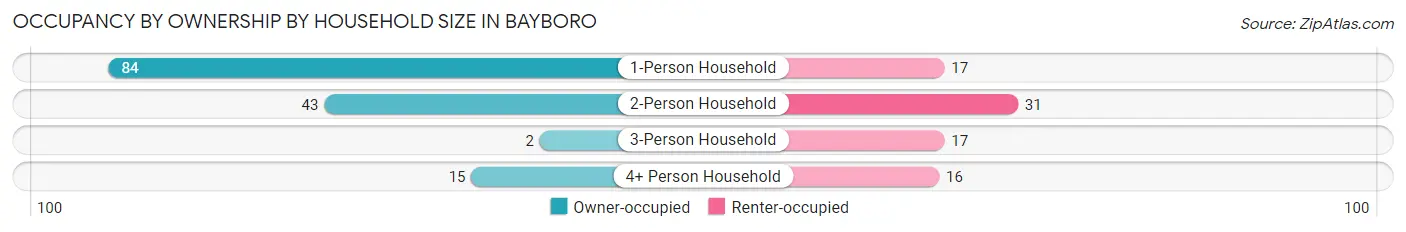
| Household Size | Owner-occupied | Renter-occupied |
| 1-Person Household | 84 (83.2%) | 17 (16.8%) |
| 2-Person Household | 43 (58.1%) | 31 (41.9%) |
| 3-Person Household | 2 (10.5%) | 17 (89.5%) |
| 4+ Person Household | 15 (48.4%) | 16 (51.6%) |
| Total Housing Units | 144 (64.0%) | 81 (36.0%) |
Occupancy by Educational Attainment in Bayboro
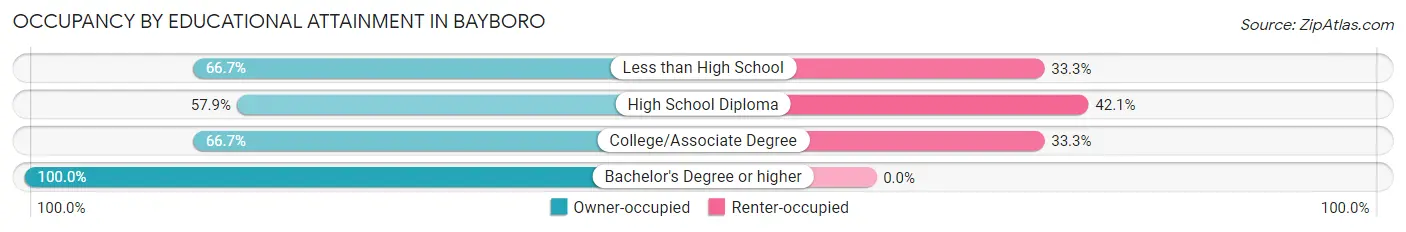
| Household Size | Owner-occupied | Renter-occupied |
| Less than High School | 4 (66.7%) | 2 (33.3%) |
| High School Diploma | 84 (57.9%) | 61 (42.1%) |
| College/Associate Degree | 36 (66.7%) | 18 (33.3%) |
| Bachelor's Degree or higher | 20 (100.0%) | 0 (0.0%) |
Occupancy by Age of Householder in Bayboro
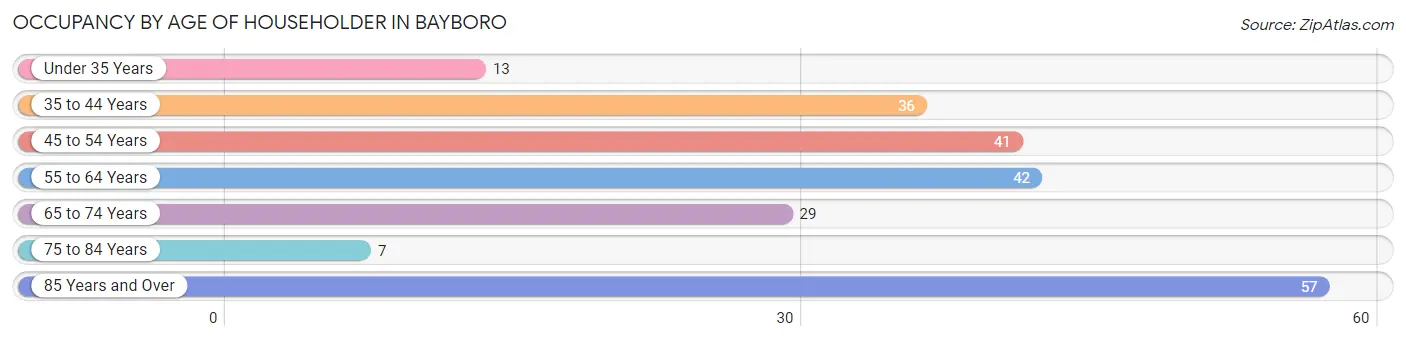
| Age Bracket | # Households | % Households |
| Under 35 Years | 13 | 5.8% |
| 35 to 44 Years | 36 | 16.0% |
| 45 to 54 Years | 41 | 18.2% |
| 55 to 64 Years | 42 | 18.7% |
| 65 to 74 Years | 29 | 12.9% |
| 75 to 84 Years | 7 | 3.1% |
| 85 Years and Over | 57 | 25.3% |
| Total | 225 | 100.0% |
Housing Finances in Bayboro
Median Income by Occupancy in Bayboro
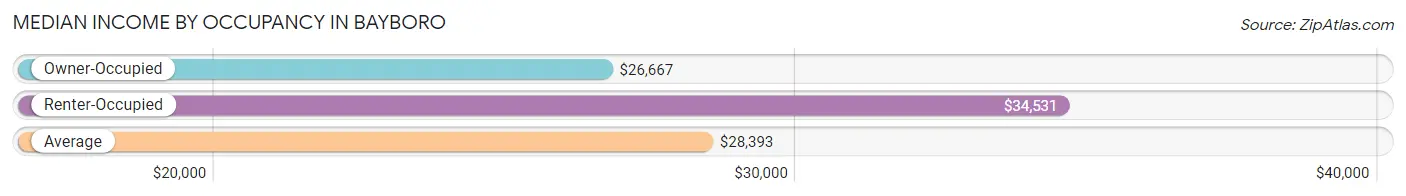
| Occupancy Type | # Households | Median Income |
| Owner-Occupied | 144 (64.0%) | $26,667 |
| Renter-Occupied | 81 (36.0%) | $34,531 |
| Average | 225 (100.0%) | $28,393 |
Occupancy by Householder Income Bracket in Bayboro
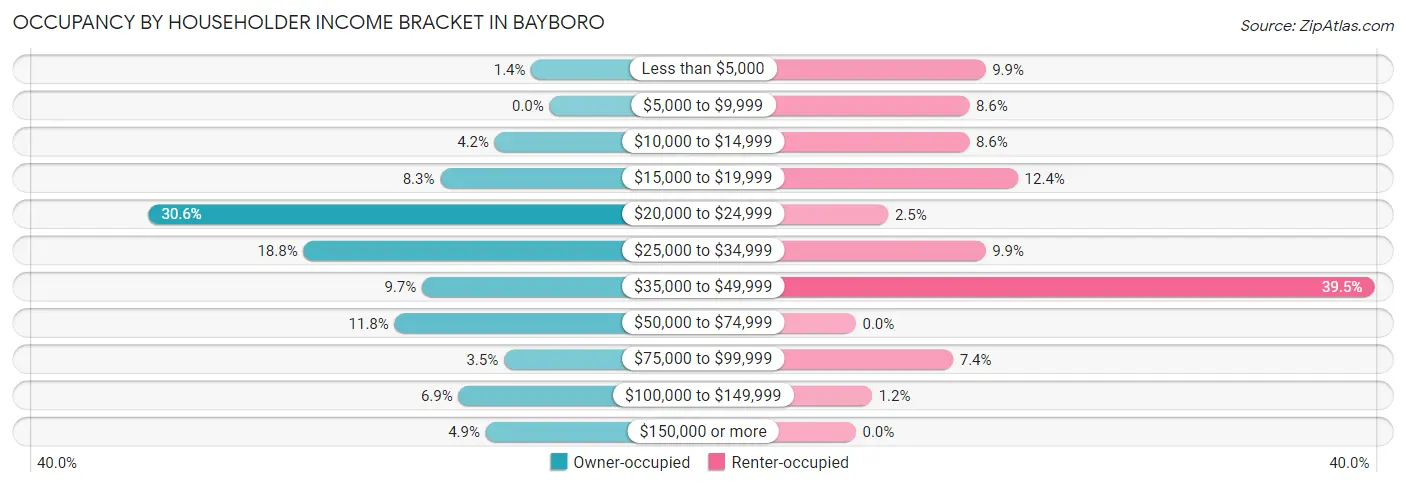
| Income Bracket | Owner-occupied | Renter-occupied |
| Less than $5,000 | 2 (1.4%) | 8 (9.9%) |
| $5,000 to $9,999 | 0 (0.0%) | 7 (8.6%) |
| $10,000 to $14,999 | 6 (4.2%) | 7 (8.6%) |
| $15,000 to $19,999 | 12 (8.3%) | 10 (12.3%) |
| $20,000 to $24,999 | 44 (30.6%) | 2 (2.5%) |
| $25,000 to $34,999 | 27 (18.8%) | 8 (9.9%) |
| $35,000 to $49,999 | 14 (9.7%) | 32 (39.5%) |
| $50,000 to $74,999 | 17 (11.8%) | 0 (0.0%) |
| $75,000 to $99,999 | 5 (3.5%) | 6 (7.4%) |
| $100,000 to $149,999 | 10 (6.9%) | 1 (1.2%) |
| $150,000 or more | 7 (4.9%) | 0 (0.0%) |
| Total | 144 (100.0%) | 81 (100.0%) |
Monthly Housing Cost Tiers in Bayboro
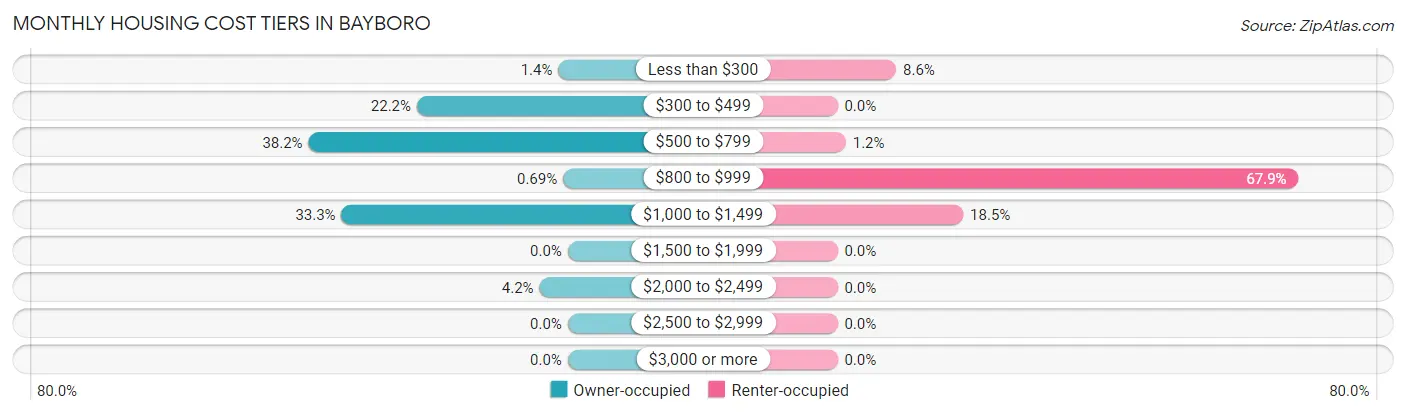
| Monthly Cost | Owner-occupied | Renter-occupied |
| Less than $300 | 2 (1.4%) | 7 (8.6%) |
| $300 to $499 | 32 (22.2%) | 0 (0.0%) |
| $500 to $799 | 55 (38.2%) | 1 (1.2%) |
| $800 to $999 | 1 (0.7%) | 55 (67.9%) |
| $1,000 to $1,499 | 48 (33.3%) | 15 (18.5%) |
| $1,500 to $1,999 | 0 (0.0%) | 0 (0.0%) |
| $2,000 to $2,499 | 6 (4.2%) | 0 (0.0%) |
| $2,500 to $2,999 | 0 (0.0%) | 0 (0.0%) |
| $3,000 or more | 0 (0.0%) | 0 (0.0%) |
| Total | 144 (100.0%) | 81 (100.0%) |
Physical Housing Characteristics in Bayboro
Housing Structures in Bayboro
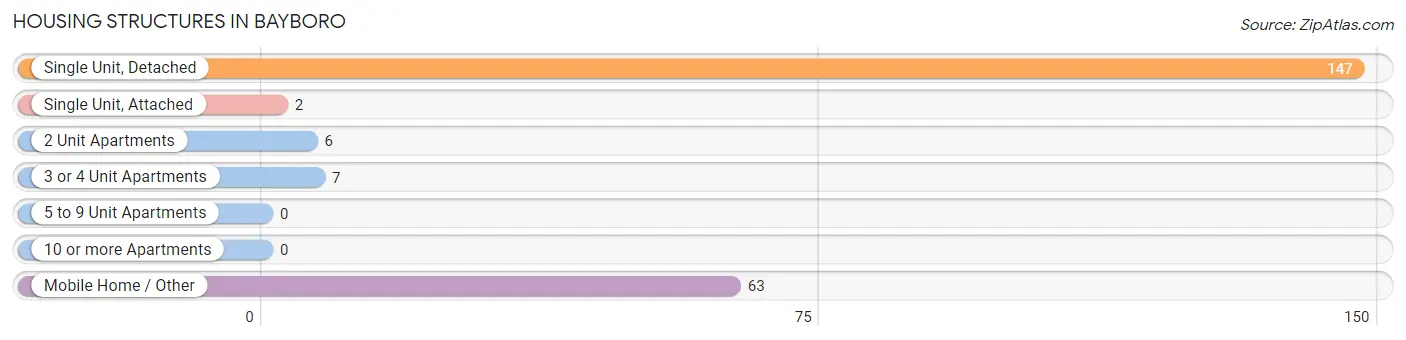
| Structure Type | # Housing Units | % Housing Units |
| Single Unit, Detached | 147 | 65.3% |
| Single Unit, Attached | 2 | 0.9% |
| 2 Unit Apartments | 6 | 2.7% |
| 3 or 4 Unit Apartments | 7 | 3.1% |
| 5 to 9 Unit Apartments | 0 | 0.0% |
| 10 or more Apartments | 0 | 0.0% |
| Mobile Home / Other | 63 | 28.0% |
| Total | 225 | 100.0% |
Housing Structures by Occupancy in Bayboro
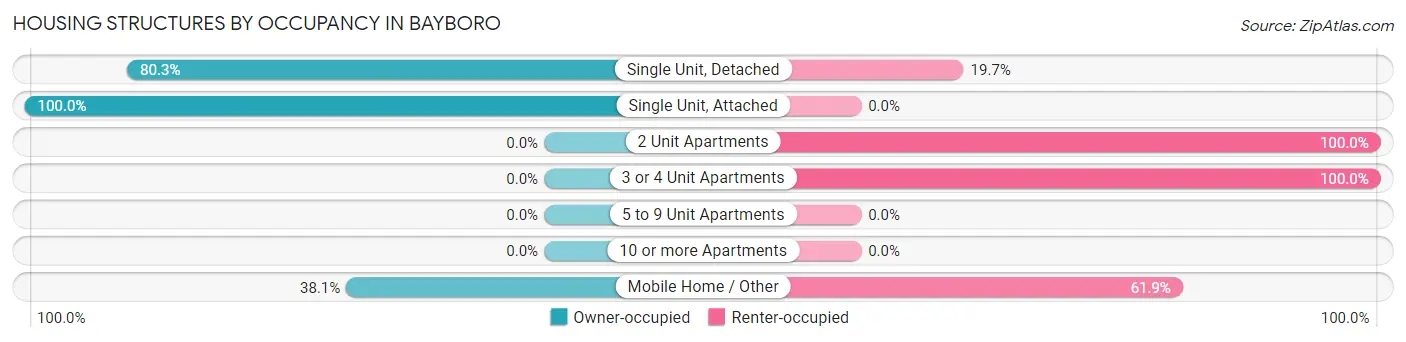
| Structure Type | Owner-occupied | Renter-occupied |
| Single Unit, Detached | 118 (80.3%) | 29 (19.7%) |
| Single Unit, Attached | 2 (100.0%) | 0 (0.0%) |
| 2 Unit Apartments | 0 (0.0%) | 6 (100.0%) |
| 3 or 4 Unit Apartments | 0 (0.0%) | 7 (100.0%) |
| 5 to 9 Unit Apartments | 0 (0.0%) | 0 (0.0%) |
| 10 or more Apartments | 0 (0.0%) | 0 (0.0%) |
| Mobile Home / Other | 24 (38.1%) | 39 (61.9%) |
| Total | 144 (64.0%) | 81 (36.0%) |
Housing Structures by Number of Rooms in Bayboro
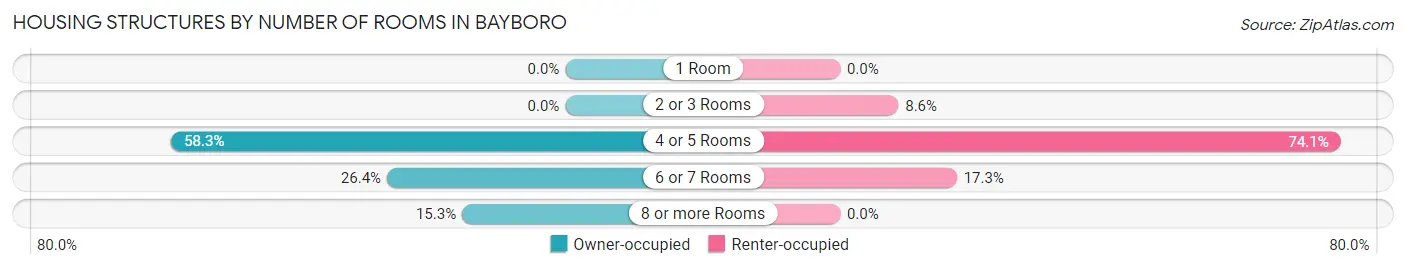
| Number of Rooms | Owner-occupied | Renter-occupied |
| 1 Room | 0 (0.0%) | 0 (0.0%) |
| 2 or 3 Rooms | 0 (0.0%) | 7 (8.6%) |
| 4 or 5 Rooms | 84 (58.3%) | 60 (74.1%) |
| 6 or 7 Rooms | 38 (26.4%) | 14 (17.3%) |
| 8 or more Rooms | 22 (15.3%) | 0 (0.0%) |
| Total | 144 (100.0%) | 81 (100.0%) |
Housing Structure by Heating Type in Bayboro
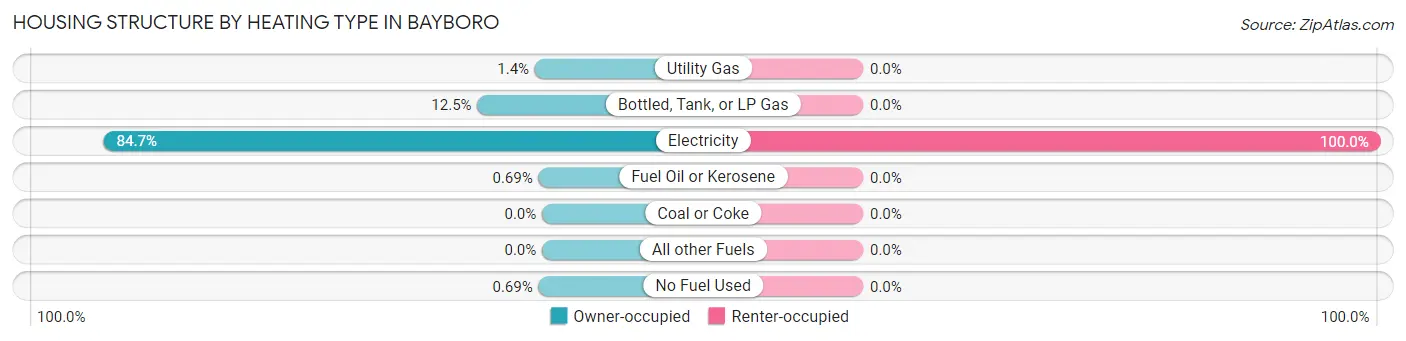
| Heating Type | Owner-occupied | Renter-occupied |
| Utility Gas | 2 (1.4%) | 0 (0.0%) |
| Bottled, Tank, or LP Gas | 18 (12.5%) | 0 (0.0%) |
| Electricity | 122 (84.7%) | 81 (100.0%) |
| Fuel Oil or Kerosene | 1 (0.7%) | 0 (0.0%) |
| Coal or Coke | 0 (0.0%) | 0 (0.0%) |
| All other Fuels | 0 (0.0%) | 0 (0.0%) |
| No Fuel Used | 1 (0.7%) | 0 (0.0%) |
| Total | 144 (100.0%) | 81 (100.0%) |
Household Vehicle Usage in Bayboro
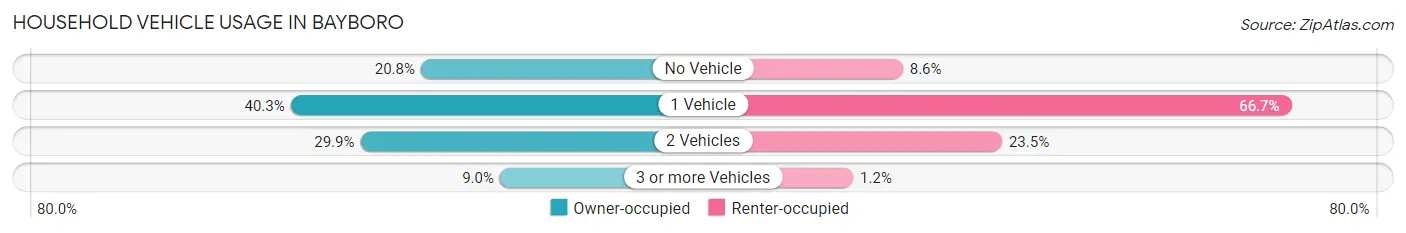
| Vehicles per Household | Owner-occupied | Renter-occupied |
| No Vehicle | 30 (20.8%) | 7 (8.6%) |
| 1 Vehicle | 58 (40.3%) | 54 (66.7%) |
| 2 Vehicles | 43 (29.9%) | 19 (23.5%) |
| 3 or more Vehicles | 13 (9.0%) | 1 (1.2%) |
| Total | 144 (100.0%) | 81 (100.0%) |
Real Estate & Mortgages in Bayboro
Real Estate and Mortgage Overview in Bayboro
| Characteristic | Without Mortgage | With Mortgage |
| Housing Units | 70 | 74 |
| Median Property Value | $202,200 | $121,200 |
| Median Household Income | $42,500 | $0 |
| Monthly Housing Costs | $514 | $0 |
| Real Estate Taxes | $980 | $1 |
Property Value by Mortgage Status in Bayboro
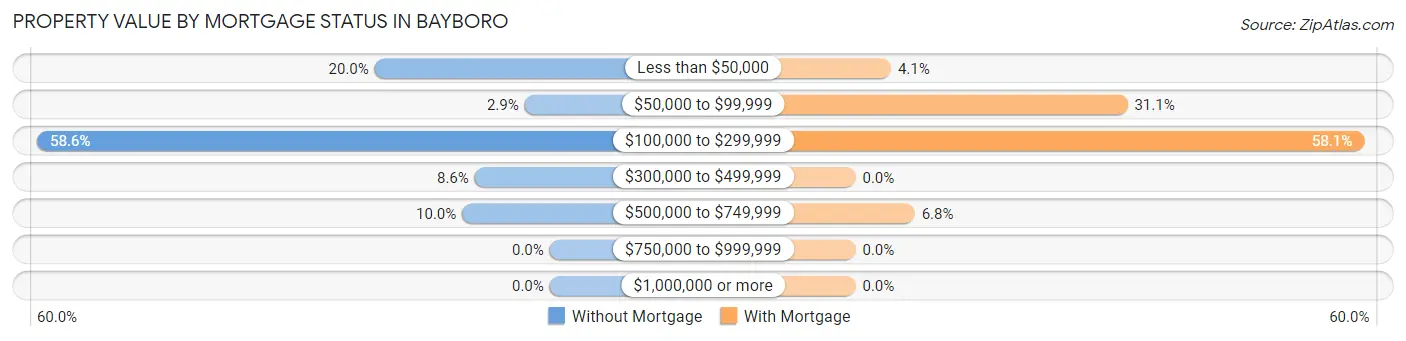
| Property Value | Without Mortgage | With Mortgage |
| Less than $50,000 | 14 (20.0%) | 3 (4.1%) |
| $50,000 to $99,999 | 2 (2.9%) | 23 (31.1%) |
| $100,000 to $299,999 | 41 (58.6%) | 43 (58.1%) |
| $300,000 to $499,999 | 6 (8.6%) | 0 (0.0%) |
| $500,000 to $749,999 | 7 (10.0%) | 5 (6.8%) |
| $750,000 to $999,999 | 0 (0.0%) | 0 (0.0%) |
| $1,000,000 or more | 0 (0.0%) | 0 (0.0%) |
| Total | 70 (100.0%) | 74 (100.0%) |
Household Income by Mortgage Status in Bayboro
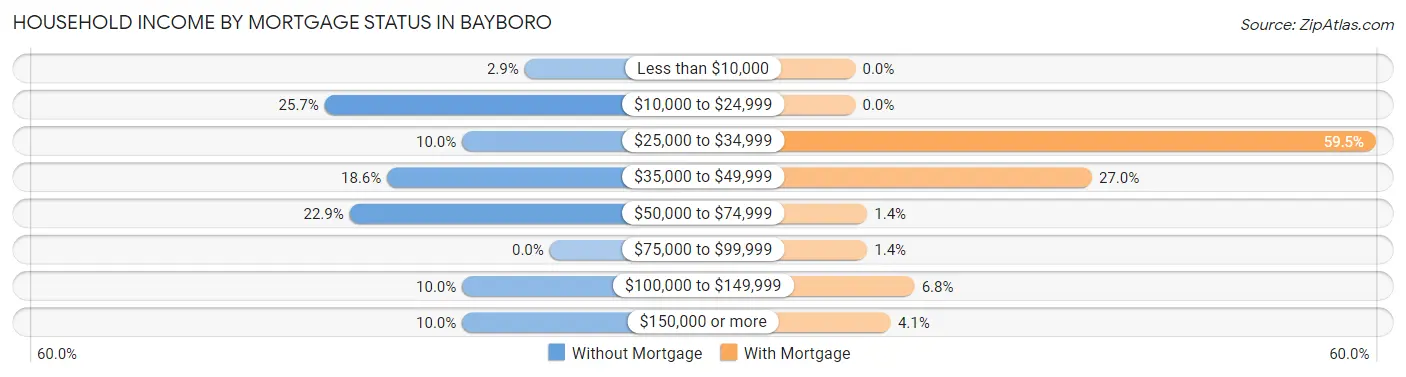
| Household Income | Without Mortgage | With Mortgage |
| Less than $10,000 | 2 (2.9%) | 0 (0.0%) |
| $10,000 to $24,999 | 18 (25.7%) | 0 (0.0%) |
| $25,000 to $34,999 | 7 (10.0%) | 44 (59.5%) |
| $35,000 to $49,999 | 13 (18.6%) | 20 (27.0%) |
| $50,000 to $74,999 | 16 (22.9%) | 1 (1.3%) |
| $75,000 to $99,999 | 0 (0.0%) | 1 (1.3%) |
| $100,000 to $149,999 | 7 (10.0%) | 5 (6.8%) |
| $150,000 or more | 7 (10.0%) | 3 (4.1%) |
| Total | 70 (100.0%) | 74 (100.0%) |
Property Value to Household Income Ratio in Bayboro
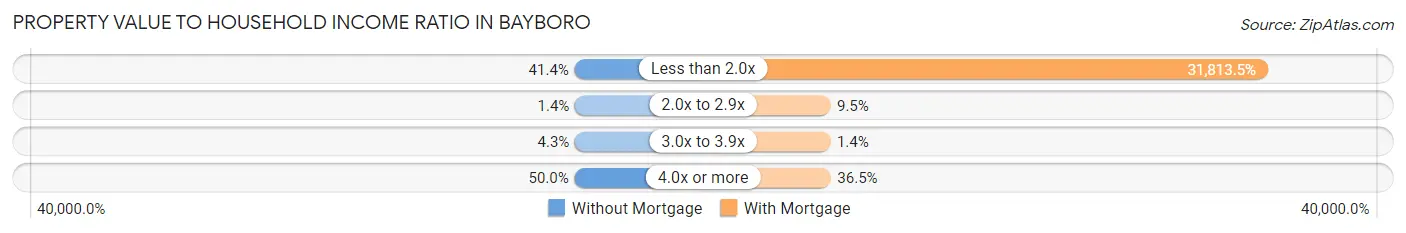
| Value-to-Income Ratio | Without Mortgage | With Mortgage |
| Less than 2.0x | 29 (41.4%) | 23,542 (31,813.5%) |
| 2.0x to 2.9x | 1 (1.4%) | 7 (9.5%) |
| 3.0x to 3.9x | 3 (4.3%) | 1 (1.3%) |
| 4.0x or more | 35 (50.0%) | 27 (36.5%) |
| Total | 70 (100.0%) | 74 (100.0%) |
Real Estate Taxes by Mortgage Status in Bayboro
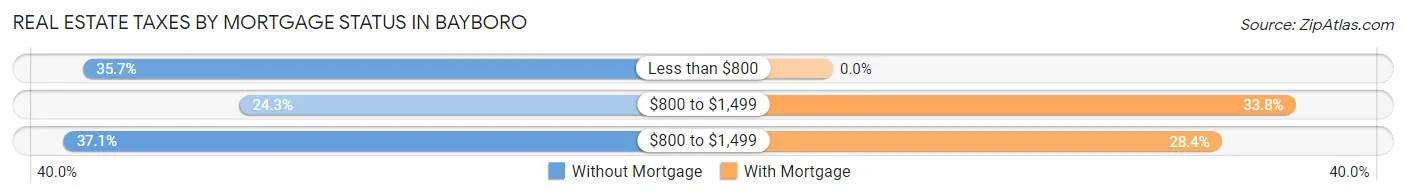
| Property Taxes | Without Mortgage | With Mortgage |
| Less than $800 | 25 (35.7%) | 0 (0.0%) |
| $800 to $1,499 | 17 (24.3%) | 25 (33.8%) |
| $800 to $1,499 | 26 (37.1%) | 21 (28.4%) |
| Total | 70 (100.0%) | 74 (100.0%) |
Health & Disability in Bayboro
Health Insurance Coverage by Age in Bayboro
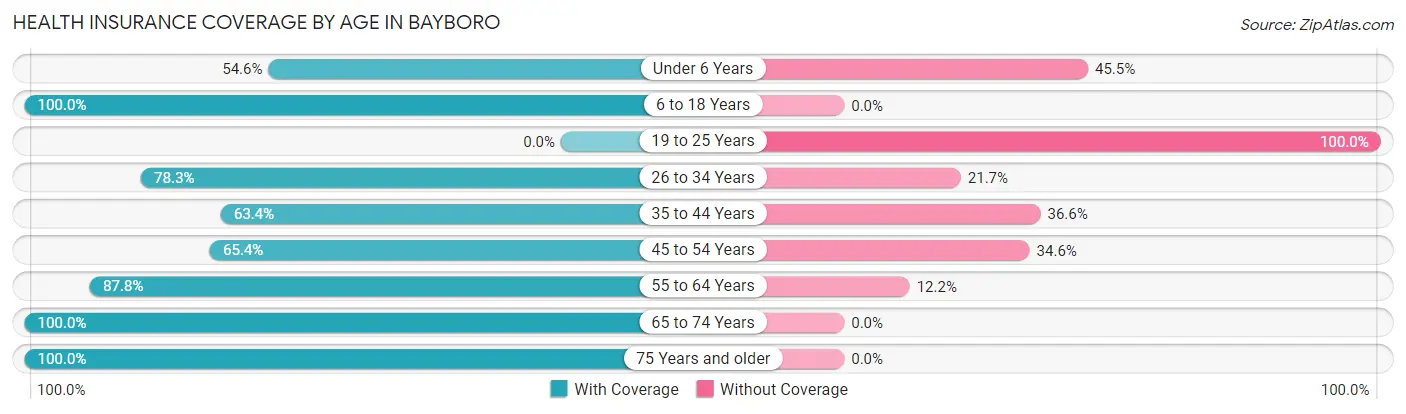
| Age Bracket | With Coverage | Without Coverage |
| Under 6 Years | 6 (54.5%) | 5 (45.5%) |
| 6 to 18 Years | 130 (100.0%) | 0 (0.0%) |
| 19 to 25 Years | 0 (0.0%) | 3 (100.0%) |
| 26 to 34 Years | 18 (78.3%) | 5 (21.7%) |
| 35 to 44 Years | 26 (63.4%) | 15 (36.6%) |
| 45 to 54 Years | 53 (65.4%) | 28 (34.6%) |
| 55 to 64 Years | 72 (87.8%) | 10 (12.2%) |
| 65 to 74 Years | 45 (100.0%) | 0 (0.0%) |
| 75 Years and older | 71 (100.0%) | 0 (0.0%) |
| Total | 421 (86.5%) | 66 (13.6%) |
Health Insurance Coverage by Citizenship Status in Bayboro
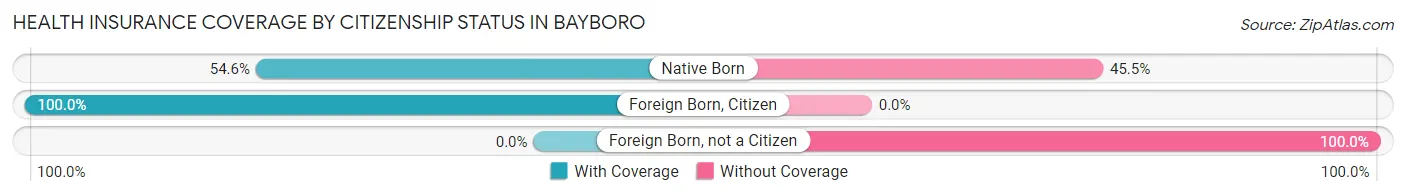
| Citizenship Status | With Coverage | Without Coverage |
| Native Born | 6 (54.5%) | 5 (45.5%) |
| Foreign Born, Citizen | 130 (100.0%) | 0 (0.0%) |
| Foreign Born, not a Citizen | 0 (0.0%) | 3 (100.0%) |
Health Insurance Coverage by Household Income in Bayboro
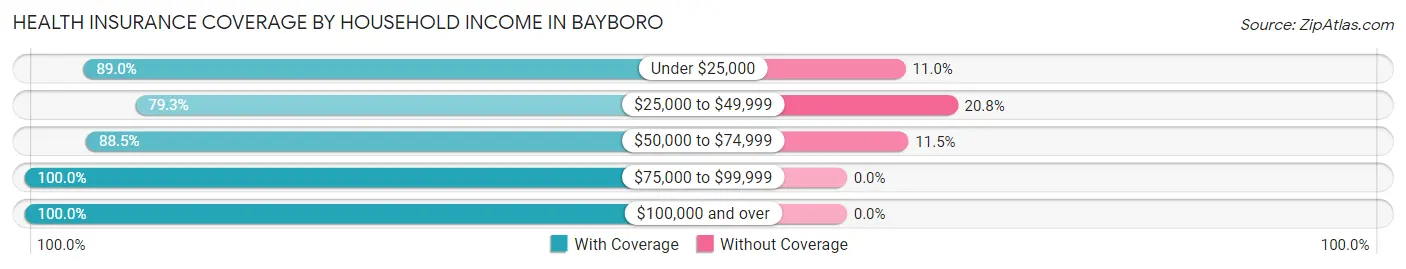
| Household Income | With Coverage | Without Coverage |
| Under $25,000 | 129 (89.0%) | 16 (11.0%) |
| $25,000 to $49,999 | 168 (79.2%) | 44 (20.7%) |
| $50,000 to $74,999 | 46 (88.5%) | 6 (11.5%) |
| $75,000 to $99,999 | 34 (100.0%) | 0 (0.0%) |
| $100,000 and over | 44 (100.0%) | 0 (0.0%) |
Public vs Private Health Insurance Coverage by Age in Bayboro
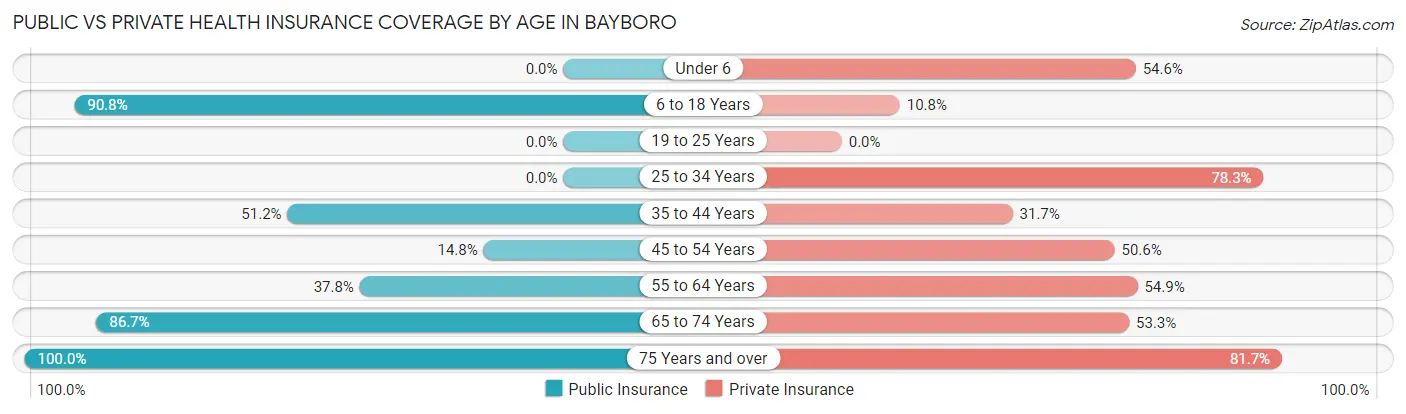
| Age Bracket | Public Insurance | Private Insurance |
| Under 6 | 0 (0.0%) | 6 (54.5%) |
| 6 to 18 Years | 118 (90.8%) | 14 (10.8%) |
| 19 to 25 Years | 0 (0.0%) | 0 (0.0%) |
| 25 to 34 Years | 0 (0.0%) | 18 (78.3%) |
| 35 to 44 Years | 21 (51.2%) | 13 (31.7%) |
| 45 to 54 Years | 12 (14.8%) | 41 (50.6%) |
| 55 to 64 Years | 31 (37.8%) | 45 (54.9%) |
| 65 to 74 Years | 39 (86.7%) | 24 (53.3%) |
| 75 Years and over | 71 (100.0%) | 58 (81.7%) |
| Total | 292 (60.0%) | 219 (45.0%) |
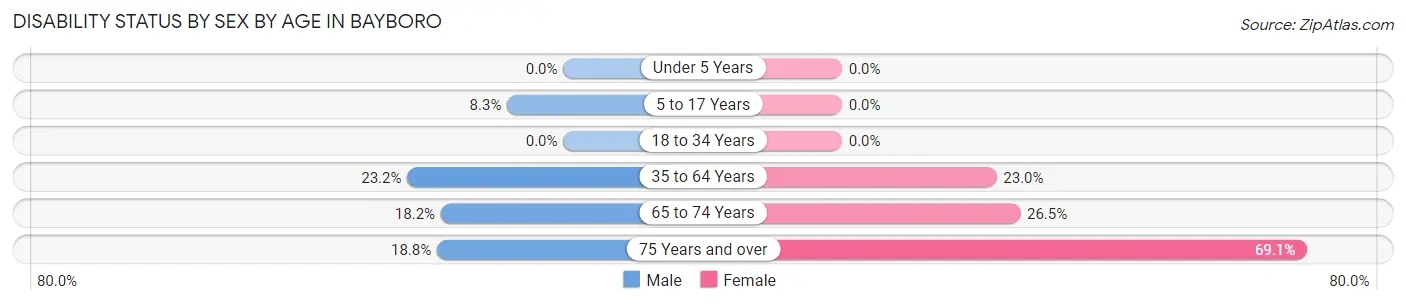
Disability Status by Sex by Age in Bayboro
| Age Bracket | Male | Female |
| Under 5 Years | 0 (0.0%) | 0 (0.0%) |
| 5 to 17 Years | 4 (8.3%) | 0 (0.0%) |
| 18 to 34 Years | 0 (0.0%) | 0 (0.0%) |
| 35 to 64 Years | 19 (23.2%) | 28 (23.0%) |
| 65 to 74 Years | 2 (18.2%) | 9 (26.5%) |
| 75 Years and over | 3 (18.8%) | 38 (69.1%) |
Disability Class by Sex by Age in Bayboro
Disability Class: Hearing Difficulty
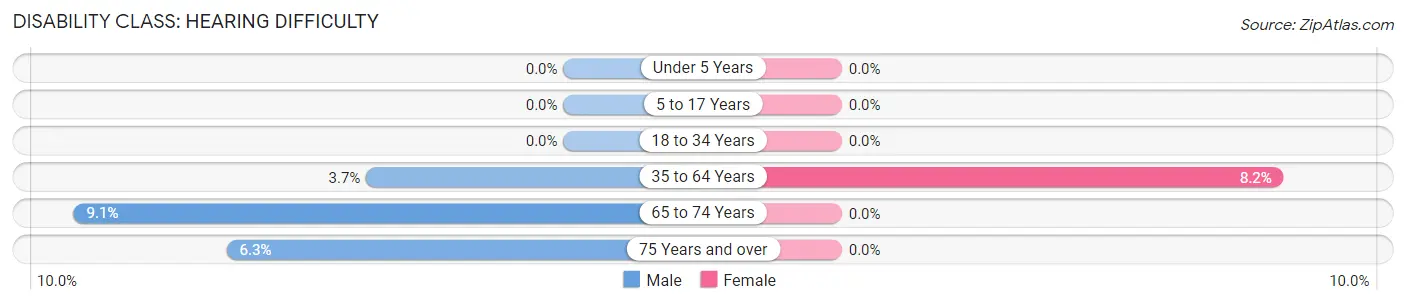
| Age Bracket | Male | Female |
| Under 5 Years | 0 (0.0%) | 0 (0.0%) |
| 5 to 17 Years | 0 (0.0%) | 0 (0.0%) |
| 18 to 34 Years | 0 (0.0%) | 0 (0.0%) |
| 35 to 64 Years | 3 (3.7%) | 10 (8.2%) |
| 65 to 74 Years | 1 (9.1%) | 0 (0.0%) |
| 75 Years and over | 1 (6.2%) | 0 (0.0%) |
Disability Class: Vision Difficulty
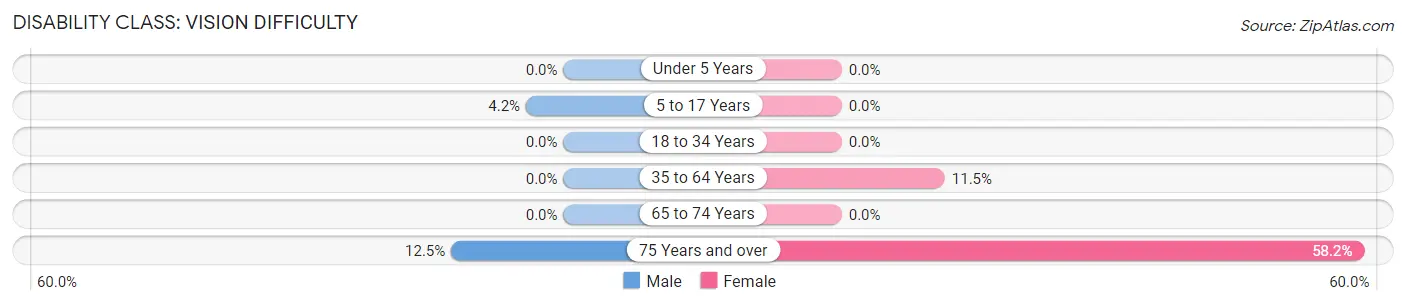
| Age Bracket | Male | Female |
| Under 5 Years | 0 (0.0%) | 0 (0.0%) |
| 5 to 17 Years | 2 (4.2%) | 0 (0.0%) |
| 18 to 34 Years | 0 (0.0%) | 0 (0.0%) |
| 35 to 64 Years | 0 (0.0%) | 14 (11.5%) |
| 65 to 74 Years | 0 (0.0%) | 0 (0.0%) |
| 75 Years and over | 2 (12.5%) | 32 (58.2%) |
Disability Class: Cognitive Difficulty
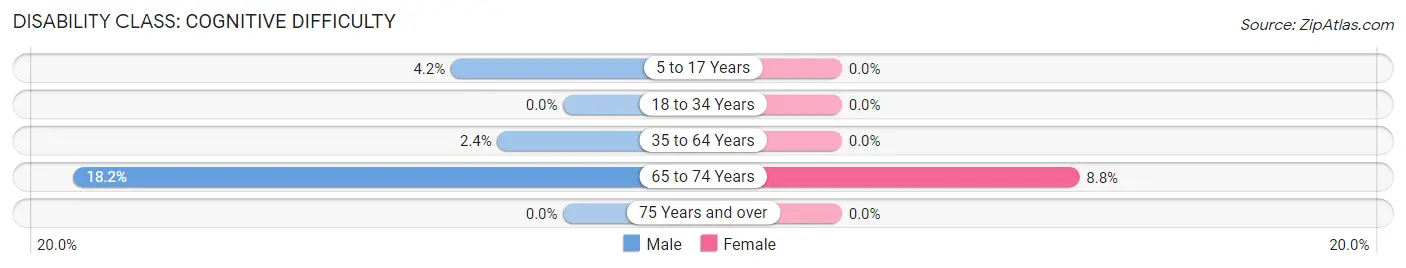
| Age Bracket | Male | Female |
| 5 to 17 Years | 2 (4.2%) | 0 (0.0%) |
| 18 to 34 Years | 0 (0.0%) | 0 (0.0%) |
| 35 to 64 Years | 2 (2.4%) | 0 (0.0%) |
| 65 to 74 Years | 2 (18.2%) | 3 (8.8%) |
| 75 Years and over | 0 (0.0%) | 0 (0.0%) |
Disability Class: Ambulatory Difficulty
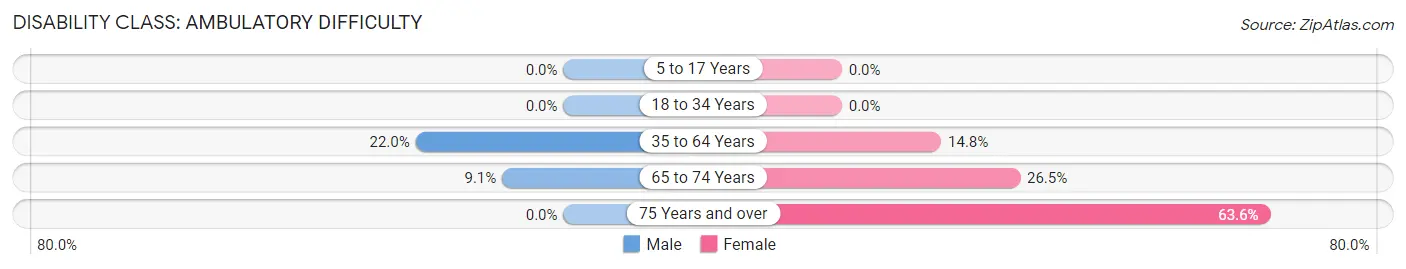
| Age Bracket | Male | Female |
| 5 to 17 Years | 0 (0.0%) | 0 (0.0%) |
| 18 to 34 Years | 0 (0.0%) | 0 (0.0%) |
| 35 to 64 Years | 18 (22.0%) | 18 (14.7%) |
| 65 to 74 Years | 1 (9.1%) | 9 (26.5%) |
| 75 Years and over | 0 (0.0%) | 35 (63.6%) |
Disability Class: Self-Care Difficulty
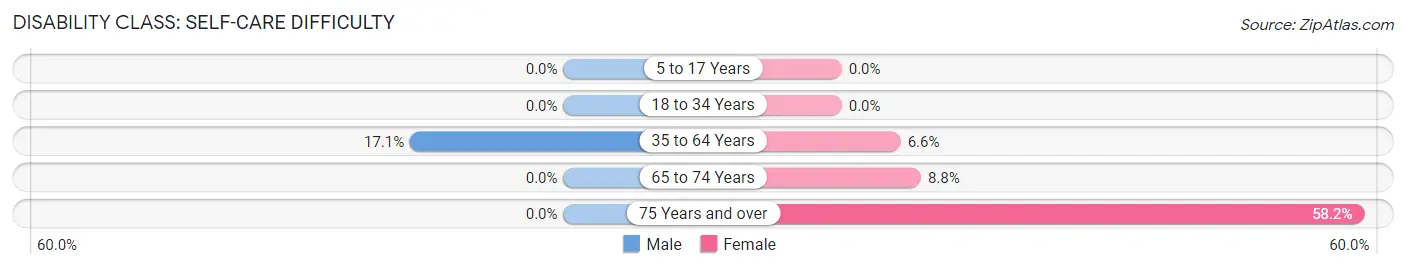
| Age Bracket | Male | Female |
| 5 to 17 Years | 0 (0.0%) | 0 (0.0%) |
| 18 to 34 Years | 0 (0.0%) | 0 (0.0%) |
| 35 to 64 Years | 14 (17.1%) | 8 (6.6%) |
| 65 to 74 Years | 0 (0.0%) | 3 (8.8%) |
| 75 Years and over | 0 (0.0%) | 32 (58.2%) |
Technology Access in Bayboro
Computing Device Access in Bayboro
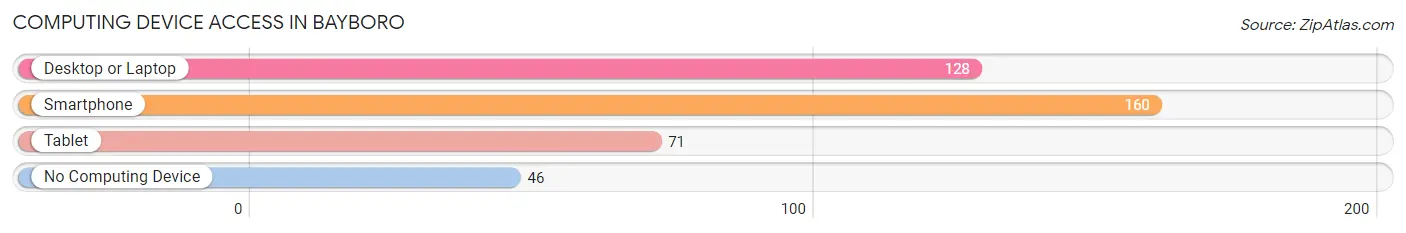
| Device Type | # Households | % Households |
| Desktop or Laptop | 128 | 56.9% |
| Smartphone | 160 | 71.1% |
| Tablet | 71 | 31.6% |
| No Computing Device | 46 | 20.4% |
| Total | 225 | 100.0% |
Internet Access in Bayboro
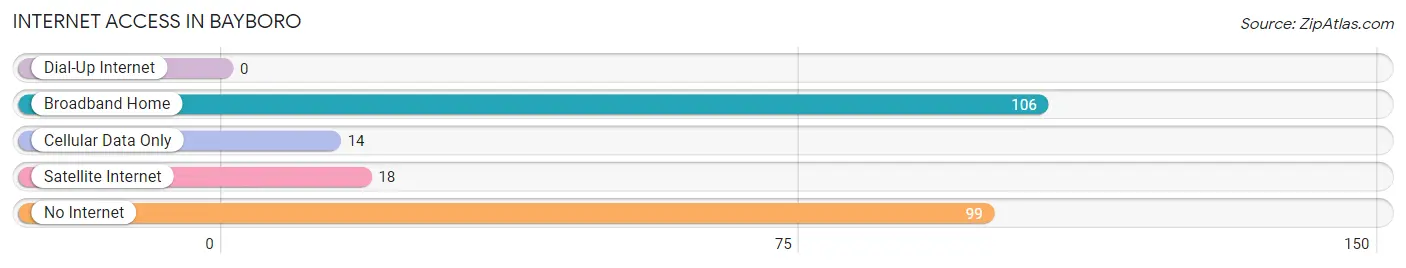
| Internet Type | # Households | % Households |
| Dial-Up Internet | 0 | 0.0% |
| Broadband Home | 106 | 47.1% |
| Cellular Data Only | 14 | 6.2% |
| Satellite Internet | 18 | 8.0% |
| No Internet | 99 | 44.0% |
| Total | 225 | 100.0% |
Bayboro Summary
Bayboro is a small town located in Pamlico County, North Carolina. It is situated on the banks of the Pamlico River, approximately 30 miles east of New Bern. The town has a population of 1,717 people, according to the 2010 census.
Geography
Bayboro is located in the coastal plain region of North Carolina. The town is situated on the banks of the Pamlico River, which is part of the Intracoastal Waterway. The town is surrounded by farmland and is located approximately 30 miles east of New Bern. The town is located at an elevation of 10 feet above sea level.
History
Bayboro was founded in 1790 by William Bay, who was a planter and merchant from Virginia. The town was originally known as Bay’s Point, but was later changed to Bayboro. The town was incorporated in 1891 and was the county seat of Pamlico County until it was moved to Bayboro in 1894.
The town was a major port of entry for goods and services during the 19th century. It was also a major center for the lumber industry. The town was also home to a number of shipbuilding companies, which produced vessels for the Confederate Navy during the Civil War.
Economy
The economy of Bayboro is largely based on agriculture and fishing. The town is home to a number of farms, which produce a variety of crops, including corn, soybeans, and cotton. The town is also home to a number of seafood processing plants, which process a variety of fish and shellfish.
The town is also home to a number of small businesses, including restaurants, retail stores, and service providers. The town is also home to a number of marinas, which provide services to recreational boaters.
Demographics
According to the 2010 census, the population of Bayboro was 1,717 people. The racial makeup of the town was 79.3% White, 17.2% African American, 0.7% Native American, 0.3% Asian, 0.1% Pacific Islander, and 2.4% from other races. The median household income was $31,250, and the median family income was $37,500.
Conclusion
Bayboro is a small town located in Pamlico County, North Carolina. It is situated on the banks of the Pamlico River, approximately 30 miles east of New Bern. The town has a population of 1,717 people, according to the 2010 census. The economy of Bayboro is largely based on agriculture and fishing, and the town is home to a number of small businesses. The racial makeup of the town is 79.3% White, 17.2% African American, 0.7% Native American, 0.3% Asian, 0.1% Pacific Islander, and 2.4% from other races. The median household income was $31,250, and the median family income was $37,500.
Common Questions
What is Per Capita Income in Bayboro?
Per Capita income in Bayboro is $11,477.
What is the Median Family Income in Bayboro?
Median Family Income in Bayboro is $48,333.
What is the Median Household income in Bayboro?
Median Household Income in Bayboro is $28,393.
What is Income or Wage Gap in Bayboro?
Income or Wage Gap in Bayboro is 23.0%.
Women in Bayboro earn 77.0 cents for every dollar earned by a man.
What is Family Income Deficit in Bayboro?
Family Income Deficit in Bayboro is $11,650.
Families that are below poverty line in Bayboro earn $11,650 less on average than the poverty threshold level.
What is Inequality or Gini Index in Bayboro?
Inequality or Gini Index in Bayboro is 0.51.
What is the Total Population of Bayboro?
Total Population of Bayboro is 1,209.
What is the Total Male Population of Bayboro?
Total Male Population of Bayboro is 907.
What is the Total Female Population of Bayboro?
Total Female Population of Bayboro is 302.
What is the Ratio of Males per 100 Females in Bayboro?
There are 300.33 Males per 100 Females in Bayboro.
What is the Ratio of Females per 100 Males in Bayboro?
There are 33.30 Females per 100 Males in Bayboro.
What is the Median Population Age in Bayboro?
Median Population Age in Bayboro is 45.8 Years.
What is the Average Family Size in Bayboro
Average Family Size in Bayboro is 3.5 People.
What is the Average Household Size in Bayboro
Average Household Size in Bayboro is 2.2 People.
How Large is the Labor Force in Bayboro?
There are 193 People in the Labor Forcein in Bayboro.
What is the Percentage of People in the Labor Force in Bayboro?
17.5% of People are in the Labor Force in Bayboro.
What is the Unemployment Rate in Bayboro?
Unemployment Rate in Bayboro is 2.6%.