Zip Codes with the Highest Percentage of Households Heated by Bottled Gas / Liquid Propane in Independence, MO
RELATED REPORTS & OPTIONS
Bottled Gas / LP Heating
Independence
Compare Zip Codes
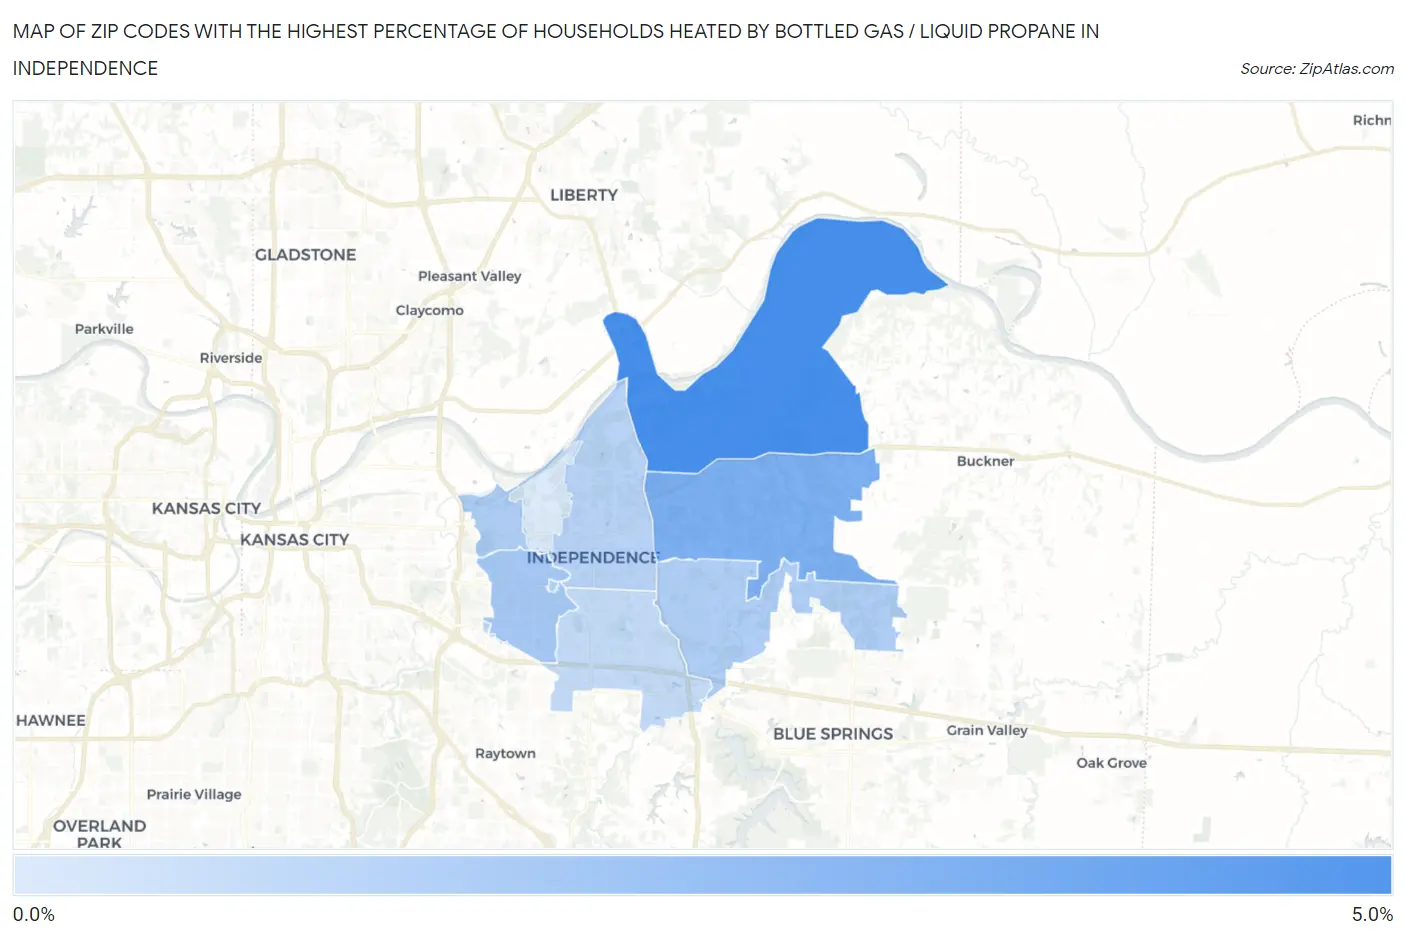
Map of Zip Codes with the Highest Percentage of Households Heated by Bottled Gas / Liquid Propane in Independence
0.0%
5.0%
Zip Codes with the Highest Percentage of Households Heated by Bottled Gas / Liquid Propane in Independence, MO
| Zip Code | Bottled Gas / LP Heating | vs State | vs National | |
| 1. | 64058 | 4.7% | 8.5%(-3.80)#815 | 4.9%(-0.200)#18,892 |
| 2. | 64056 | 3.2% | 8.5%(-5.30)#846 | 4.9%(-1.70)#20,703 |
| 3. | 64052 | 2.0% | 8.5%(-6.50)#875 | 4.9%(-2.90)#23,216 |
| 4. | 64057 | 1.8% | 8.5%(-6.70)#886 | 4.9%(-3.10)#23,828 |
| 5. | 64053 | 1.8% | 8.5%(-6.70)#887 | 4.9%(-3.10)#23,870 |
| 6. | 64050 | 1.5% | 8.5%(-7.00)#901 | 4.9%(-3.40)#24,790 |
| 7. | 64055 | 1.2% | 8.5%(-7.30)#921 | 4.9%(-3.70)#25,819 |
| 8. | 64054 | 0.50% | 8.5%(-8.00)#964 | 4.9%(-4.40)#28,767 |
1
Common Questions
What are the Top 5 Zip Codes with the Highest Percentage of Households Heated by Bottled Gas / Liquid Propane in Independence, MO?
Top 5 Zip Codes with the Highest Percentage of Households Heated by Bottled Gas / Liquid Propane in Independence, MO are:
What zip code has the Highest Percentage of Households Heated by Bottled Gas / Liquid Propane in Independence, MO?
64058 has the Highest Percentage of Households Heated by Bottled Gas / Liquid Propane in Independence, MO with 4.7%.
What is the Percentage of Households Heated by Bottled Gas / Liquid Propane in Independence, MO?
Percentage of Households Heated by Bottled Gas / Liquid Propane in Independence is 1.6%.
What is the Percentage of Households Heated by Bottled Gas / Liquid Propane in Missouri?
Percentage of Households Heated by Bottled Gas / Liquid Propane in Missouri is 8.5%.
What is the Percentage of Households Heated by Bottled Gas / Liquid Propane in the United States?
Percentage of Households Heated by Bottled Gas / Liquid Propane in the United States is 4.9%.