Zip Codes with the Highest Percentage of Households Heated by Bottled Gas / Liquid Propane in Columbia, MO
RELATED REPORTS & OPTIONS
Bottled Gas / LP Heating
Columbia
Compare Zip Codes
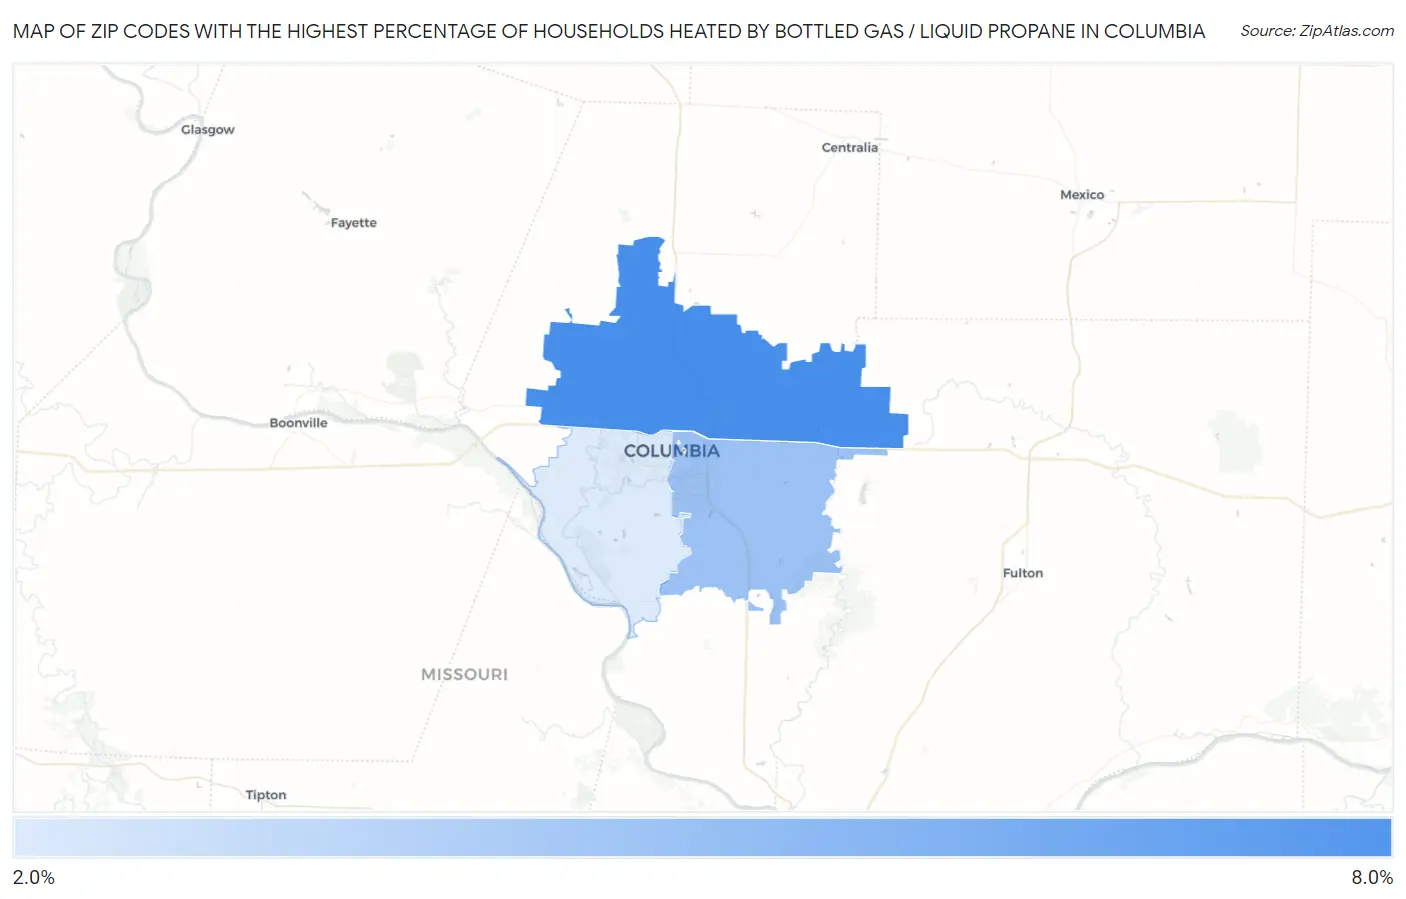
Map of Zip Codes with the Highest Percentage of Households Heated by Bottled Gas / Liquid Propane in Columbia
2.3%
6.6%
Zip Codes with the Highest Percentage of Households Heated by Bottled Gas / Liquid Propane in Columbia, MO
| Zip Code | Bottled Gas / LP Heating | vs State | vs National | |
| 1. | 65202 | 6.6% | 8.5%(-1.90)#780 | 4.9%(+1.70)#17,072 |
| 2. | 65201 | 4.2% | 8.5%(-4.30)#823 | 4.9%(-0.700)#19,400 |
| 3. | 65203 | 2.3% | 8.5%(-6.20)#861 | 4.9%(-2.60)#22,328 |
1
Common Questions
What are the Top Zip Codes with the Highest Percentage of Households Heated by Bottled Gas / Liquid Propane in Columbia, MO?
Top Zip Codes with the Highest Percentage of Households Heated by Bottled Gas / Liquid Propane in Columbia, MO are:
What zip code has the Highest Percentage of Households Heated by Bottled Gas / Liquid Propane in Columbia, MO?
65202 has the Highest Percentage of Households Heated by Bottled Gas / Liquid Propane in Columbia, MO with 6.6%.
What is the Percentage of Households Heated by Bottled Gas / Liquid Propane in Columbia, MO?
Percentage of Households Heated by Bottled Gas / Liquid Propane in Columbia is 1.6%.
What is the Percentage of Households Heated by Bottled Gas / Liquid Propane in Missouri?
Percentage of Households Heated by Bottled Gas / Liquid Propane in Missouri is 8.5%.
What is the Percentage of Households Heated by Bottled Gas / Liquid Propane in the United States?
Percentage of Households Heated by Bottled Gas / Liquid Propane in the United States is 4.9%.