Zip Codes with the Highest Percentage of Population Employed in Architecture & Engineering in Columbia, MO
RELATED REPORTS & OPTIONS
Architecture & Engineering
Columbia
Compare Zip Codes
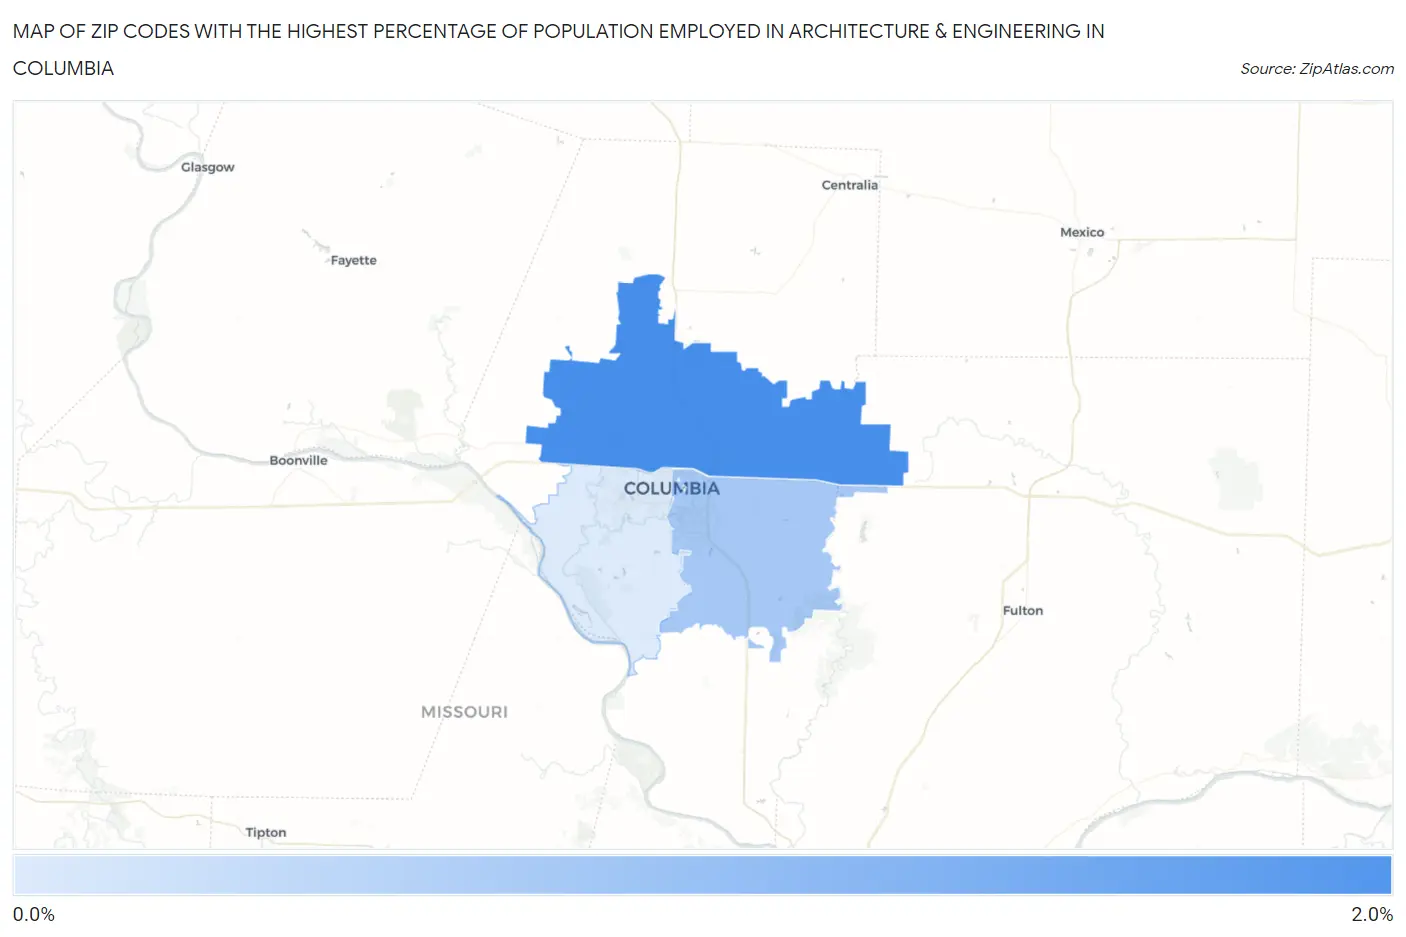
Map of Zip Codes with the Highest Percentage of Population Employed in Architecture & Engineering in Columbia
0.86%
1.7%
Zip Codes with the Highest Percentage of Population Employed in Architecture & Engineering in Columbia, MO
| Zip Code | % Employed | vs State | vs National | |
| 1. | 65202 | 1.7% | 1.7%(+0.027)#221 | 2.1%(-0.417)#11,279 |
| 2. | 65201 | 1.2% | 1.7%(-0.528)#305 | 2.1%(-0.973)#15,265 |
| 3. | 65203 | 0.86% | 1.7%(-0.842)#383 | 2.1%(-1.29)#17,654 |
1
Common Questions
What are the Top 3 Zip Codes with the Highest Percentage of Population Employed in Architecture & Engineering in Columbia, MO?
Top 3 Zip Codes with the Highest Percentage of Population Employed in Architecture & Engineering in Columbia, MO are:
What zip code has the Highest Percentage of Population Employed in Architecture & Engineering in Columbia, MO?
65202 has the Highest Percentage of Population Employed in Architecture & Engineering in Columbia, MO with 1.7%.
What is the Percentage of Population Employed in Architecture & Engineering in Columbia, MO?
Percentage of Population Employed in Architecture & Engineering in Columbia is 1.3%.
What is the Percentage of Population Employed in Architecture & Engineering in Missouri?
Percentage of Population Employed in Architecture & Engineering in Missouri is 1.7%.
What is the Percentage of Population Employed in Architecture & Engineering in the United States?
Percentage of Population Employed in Architecture & Engineering in the United States is 2.1%.