Zip Codes with the Highest Percentage of Population Employed in Real Estate, Rental & Leasing in Columbia, MO

RELATED REPORTS & OPTIONS

Real Estate, Rental & Leasing
Population
Families and Households
Female Fertility
Female Fertility (Unmarried)
Race (Community Size)
Race (Percentage)
Ancestry (Community Size)
AfricanAlbanianAmericanApacheArabAustrianBelgianBhutaneseBlackfeetBolivianBrazilianBritishBurmeseCajunCanadianCelticCentral AmericanCherokeeChileanChippewaChoctawColombianCosta RicanCroatianCubanCzechCzechoslovakianDanishDominicanDutchEastern EuropeanEcuadorianEgyptianEnglishEthiopianEuropeanFilipinoFinnishFrenchFrench American IndianFrench CanadianGermanGhanaianGreekGuamanian / ChamorroGuatemalanHaitianHonduranHungarianIndian (Asian)IranianIraqiIrishIroquoisIsraeliItalianJamaicanJapaneseKenyanKoreanLebaneseLithuanianMexicanNative HawaiianNavajoNicaraguanNigerianNorthern EuropeanNorwegianPakistaniPanamanianPennsylvania GermanPeruvianPolishPortuguesePotawatomiPuerto RicanRomanianRussianSalvadoranSamoanScandinavianScotch-IrishScottishSiouxSlavicSlovakSloveneSouth AmericanSpaniardSpanishSri LankanSubsaharan AfricanSudaneseSwedishSwissSyrianThaiTrinidadian and TobagonianTurkishUkrainianWelshYugoslavian
Ancestry (Percentage)
AfricanAlbanianAmericanApacheArabAustrianBelgianBhutaneseBlackfeetBolivianBrazilianBritishBurmeseCajunCanadianCelticCentral AmericanCherokeeChileanChippewaChoctawColombianCosta RicanCroatianCubanCzechCzechoslovakianDanishDominicanDutchEastern EuropeanEcuadorianEgyptianEnglishEthiopianEuropeanFilipinoFinnishFrenchFrench American IndianFrench CanadianGermanGhanaianGreekGuamanian / ChamorroGuatemalanHaitianHonduranHungarianIndian (Asian)IranianIraqiIrishIroquoisIsraeliItalianJamaicanJapaneseKenyanKoreanLebaneseLithuanianMexicanNative HawaiianNavajoNicaraguanNigerianNorthern EuropeanNorwegianPakistaniPanamanianPennsylvania GermanPeruvianPolishPortuguesePotawatomiPuerto RicanRomanianRussianSalvadoranSamoanScandinavianScotch-IrishScottishSiouxSlavicSlovakSloveneSouth AmericanSpaniardSpanishSri LankanSubsaharan AfricanSudaneseSwedishSwissSyrianThaiTrinidadian and TobagonianTurkishUkrainianWelshYugoslavian
Immigrant Origin (Total)
Immigrant Origin (Percentage)
Income
Income (Families)
Income (Households)
Poverty
Poverty (Families)
Unemployment
Employment Occupations
Employment Industries
Employer Class
Commute Time
Commute Means
School Enrollment
Education by Degree Field
Occupancy
Finances
Physical Characteristics
Columbia
Compare Zip Codes
Comparison Subject

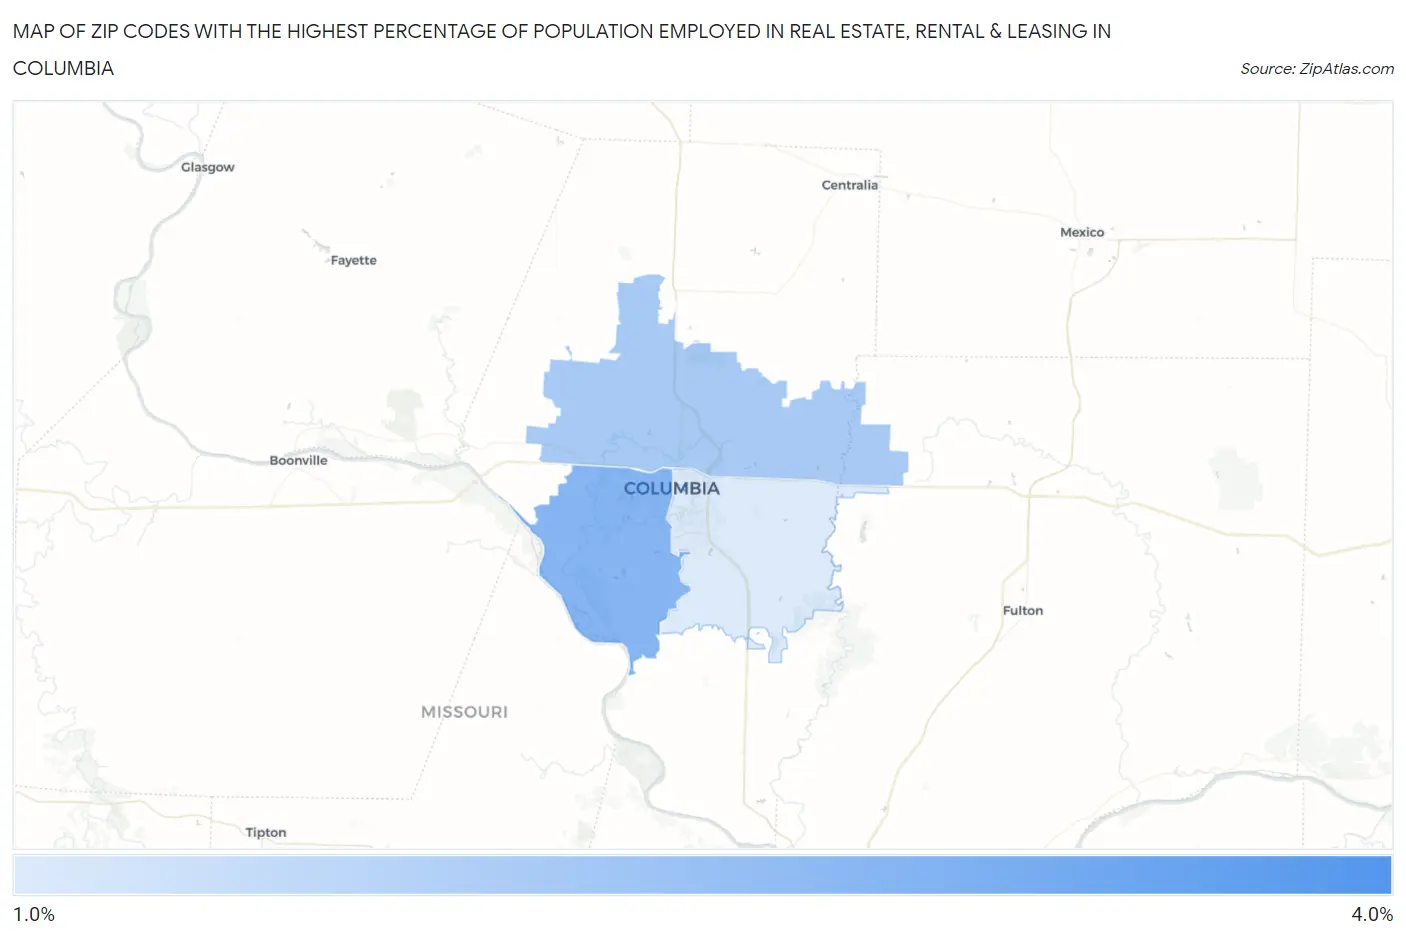
Map of Zip Codes with the Highest Percentage of Population Employed in Real Estate, Rental & Leasing in Columbia

0.0%
4.0%
Zip Codes with the Highest Percentage of Population Employed in Real Estate, Rental & Leasing in Columbia Map

Zip Codes with the Highest Percentage of Population Employed in Real Estate, Rental & Leasing in Columbia, MO

Zip Code % Employed vs State vs National
1.652163.2%1.6%(+1.54)#751.9%(+1.28)#3,468
2.652032.3%1.6%(+0.656)#1531.9%(+0.395)#6,364
3.652021.8%1.6%(+0.149)#2141.9%(-0.111)#9,254
4.652011.0%1.6%(-0.591)#3501.9%(-0.851)#14,801

Common Questions

What are the Top 3 Zip Codes with the Highest Percentage of Population Employed in Real Estate, Rental & Leasing in Columbia, MO?
Top 3 Zip Codes with the Highest Percentage of Population Employed in Real Estate, Rental & Leasing in Columbia, MO are:
#1
3.2%
#2
2.3%
#3
1.8%
What zip code has the Highest Percentage of Population Employed in Real Estate, Rental & Leasing in Columbia, MO?
65216 has the Highest Percentage of Population Employed in Real Estate, Rental & Leasing in Columbia, MO with 3.2%.
What is the Percentage of Population Employed in Real Estate, Rental & Leasing in Columbia, MO?
Percentage of Population Employed in Real Estate, Rental & Leasing in Columbia is 1.8%.
What is the Percentage of Population Employed in Real Estate, Rental & Leasing in Missouri?
Percentage of Population Employed in Real Estate, Rental & Leasing in Missouri is 1.6%.
What is the Percentage of Population Employed in Real Estate, Rental & Leasing in the United States?
Percentage of Population Employed in Real Estate, Rental & Leasing in the United States is 1.9%.