Zip Codes with the Highest Percentage of Households Heated by Bottled Gas / Liquid Propane in Saint Paul, MN
RELATED REPORTS & OPTIONS
Bottled Gas / LP Heating
Saint Paul
Compare Zip Codes
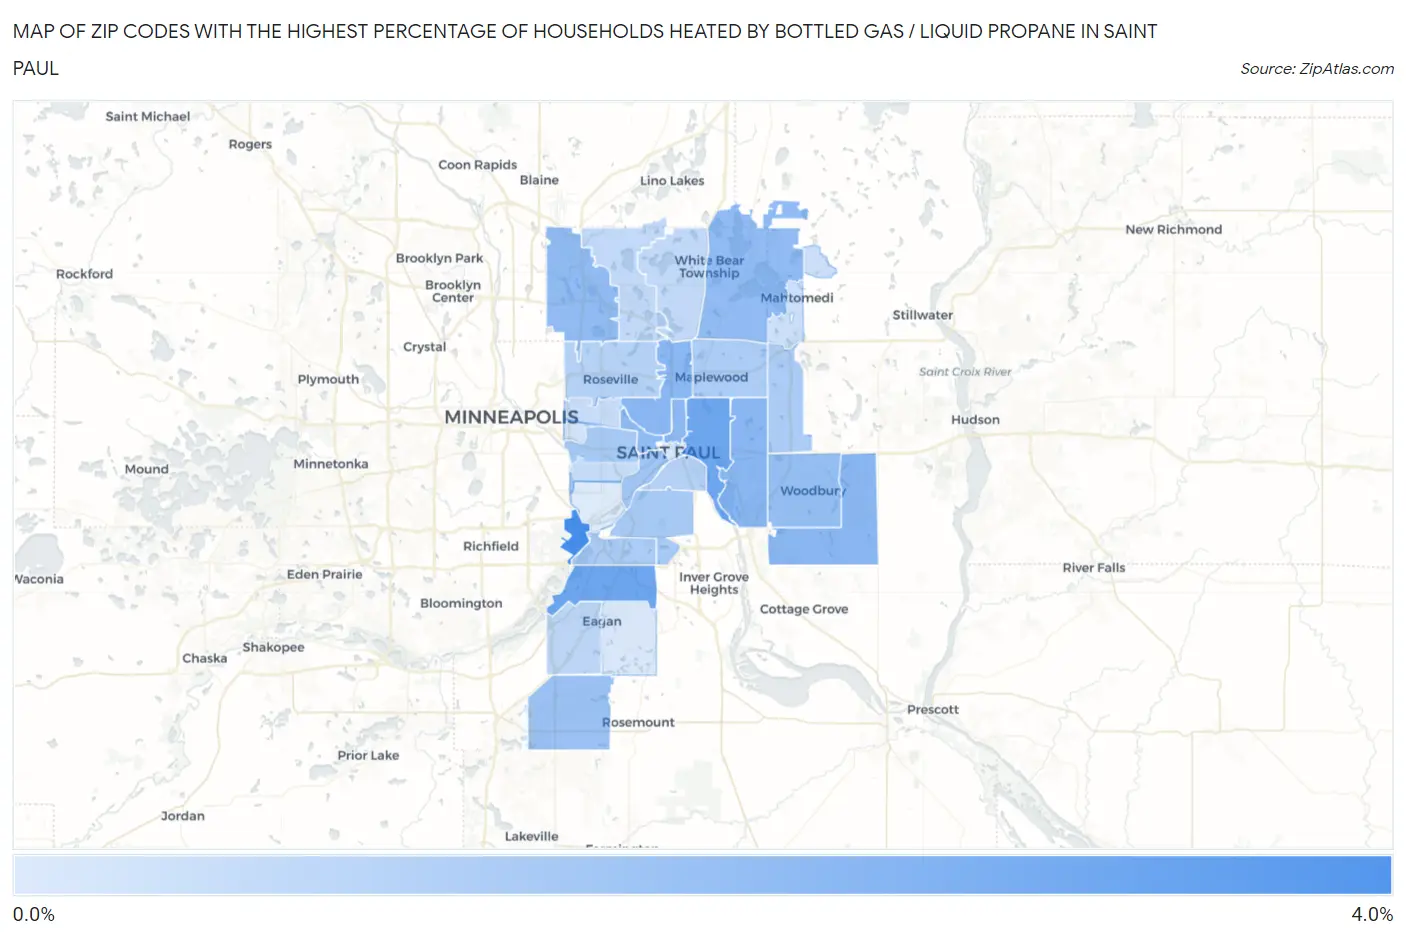
Map of Zip Codes with the Highest Percentage of Households Heated by Bottled Gas / Liquid Propane in Saint Paul
0.0%
4.0%
Zip Codes with the Highest Percentage of Households Heated by Bottled Gas / Liquid Propane in Saint Paul, MN
| Zip Code | Bottled Gas / LP Heating | vs State | vs National | |
| 1. | 55111 | 4.0% | 10.8%(-6.80)#717 | 4.9%(-0.900)#19,707 |
| 2. | 55106 | 3.0% | 10.8%(-7.80)#728 | 4.9%(-1.90)#20,980 |
| 3. | 55121 | 3.0% | 10.8%(-7.80)#730 | 4.9%(-1.90)#21,086 |
| 4. | 55117 | 2.3% | 10.8%(-8.50)#749 | 4.9%(-2.60)#22,347 |
| 5. | 55119 | 2.3% | 10.8%(-8.50)#750 | 4.9%(-2.60)#22,349 |
| 6. | 55129 | 2.3% | 10.8%(-8.50)#751 | 4.9%(-2.60)#22,395 |
| 7. | 55130 | 2.2% | 10.8%(-8.60)#757 | 4.9%(-2.70)#22,683 |
| 8. | 55112 | 2.1% | 10.8%(-8.70)#762 | 4.9%(-2.80)#22,824 |
| 9. | 55110 | 2.1% | 10.8%(-8.70)#763 | 4.9%(-2.80)#22,850 |
| 10. | 55103 | 2.1% | 10.8%(-8.70)#766 | 4.9%(-2.80)#22,970 |
| 11. | 55125 | 2.0% | 10.8%(-8.80)#768 | 4.9%(-2.90)#23,123 |
| 12. | 55124 | 1.8% | 10.8%(-9.00)#776 | 4.9%(-3.10)#23,663 |
| 13. | 55102 | 1.7% | 10.8%(-9.10)#786 | 4.9%(-3.20)#24,096 |
| 14. | 55104 | 1.5% | 10.8%(-9.30)#794 | 4.9%(-3.40)#24,646 |
| 15. | 55118 | 1.5% | 10.8%(-9.30)#796 | 4.9%(-3.40)#24,740 |
| 16. | 55109 | 1.4% | 10.8%(-9.40)#798 | 4.9%(-3.50)#25,070 |
| 17. | 55128 | 1.4% | 10.8%(-9.40)#799 | 4.9%(-3.50)#25,105 |
| 18. | 55120 | 1.4% | 10.8%(-9.40)#803 | 4.9%(-3.50)#25,278 |
| 19. | 55113 | 1.2% | 10.8%(-9.60)#811 | 4.9%(-3.70)#25,793 |
| 20. | 55107 | 1.2% | 10.8%(-9.60)#816 | 4.9%(-3.70)#26,002 |
| 21. | 55122 | 1.0% | 10.8%(-9.80)#822 | 4.9%(-3.90)#26,645 |
| 22. | 55126 | 0.90% | 10.8%(-9.90)#827 | 4.9%(-4.00)#27,112 |
| 23. | 55127 | 0.90% | 10.8%(-9.90)#828 | 4.9%(-4.00)#27,188 |
| 24. | 55105 | 0.80% | 10.8%(-10.00)#833 | 4.9%(-4.10)#27,513 |
| 25. | 55108 | 0.70% | 10.8%(-10.1)#843 | 4.9%(-4.20)#27,990 |
| 26. | 55115 | 0.60% | 10.8%(-10.2)#847 | 4.9%(-4.30)#28,385 |
| 27. | 55114 | 0.50% | 10.8%(-10.3)#851 | 4.9%(-4.40)#28,763 |
| 28. | 55123 | 0.30% | 10.8%(-10.5)#856 | 4.9%(-4.60)#29,152 |
| 29. | 55101 | 0.30% | 10.8%(-10.5)#858 | 4.9%(-4.60)#29,278 |
| 30. | 55116 | 0.20% | 10.8%(-10.6)#859 | 4.9%(-4.70)#29,392 |
1
Common Questions
What are the Top 10 Zip Codes with the Highest Percentage of Households Heated by Bottled Gas / Liquid Propane in Saint Paul, MN?
Top 10 Zip Codes with the Highest Percentage of Households Heated by Bottled Gas / Liquid Propane in Saint Paul, MN are:
What zip code has the Highest Percentage of Households Heated by Bottled Gas / Liquid Propane in Saint Paul, MN?
55111 has the Highest Percentage of Households Heated by Bottled Gas / Liquid Propane in Saint Paul, MN with 4.0%.
What is the Percentage of Households Heated by Bottled Gas / Liquid Propane in Minnesota?
Percentage of Households Heated by Bottled Gas / Liquid Propane in Minnesota is 10.8%.
What is the Percentage of Households Heated by Bottled Gas / Liquid Propane in the United States?
Percentage of Households Heated by Bottled Gas / Liquid Propane in the United States is 4.9%.