Zip Codes with the Highest Percentage of Families with Income Below $10,000 in Hopkins, MN
RELATED REPORTS & OPTIONS
Family Income | $0-10k
Hopkins
Compare Zip Codes
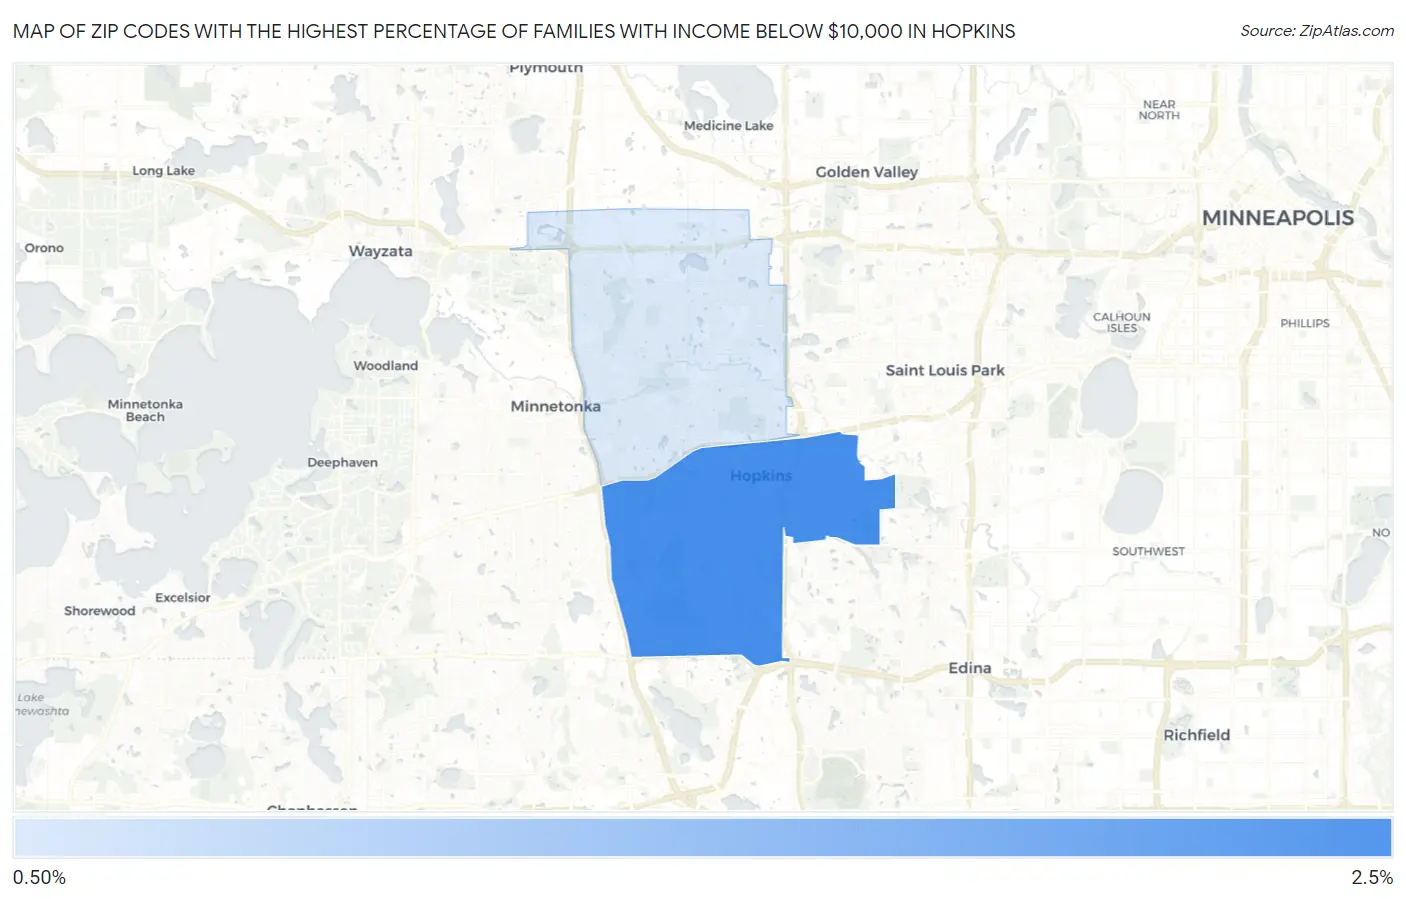
Map of Zip Codes with the Highest Percentage of Families with Income Below $10,000 in Hopkins
0.70%
2.3%
Zip Codes with the Highest Percentage of Families with Income Below $10,000 in Hopkins, MN
| Zip Code | Families with Income < $10k | vs State | vs National | |
| 1. | 55343 | 2.3% | 1.8%(+0.500)#251 | 3.1%(-0.800)#13,959 |
| 2. | 55305 | 0.70% | 1.8%(-1.10)#576 | 3.1%(-2.40)#21,732 |
1
Common Questions
What are the Top Zip Codes with the Highest Percentage of Families with Income Below $10,000 in Hopkins, MN?
Top Zip Codes with the Highest Percentage of Families with Income Below $10,000 in Hopkins, MN are:
What zip code has the Highest Percentage of Families with Income Below $10,000 in Hopkins, MN?
55343 has the Highest Percentage of Families with Income Below $10,000 in Hopkins, MN with 2.3%.
What is the Percentage of Families with Income Below $10,000 in Hopkins, MN?
Percentage of Families with Income Below $10,000 in Hopkins is 3.6%.
What is the Percentage of Families with Income Below $10,000 in Minnesota?
Percentage of Families with Income Below $10,000 in Minnesota is 1.8%.
What is the Percentage of Families with Income Below $10,000 in the United States?
Percentage of Families with Income Below $10,000 in the United States is 3.1%.