Zip Codes with the Highest Percentage of Population Employed in Legal Services & Support in Clinton Township, MI
RELATED REPORTS & OPTIONS
Legal Services & Support
Clinton Township
Compare Zip Codes
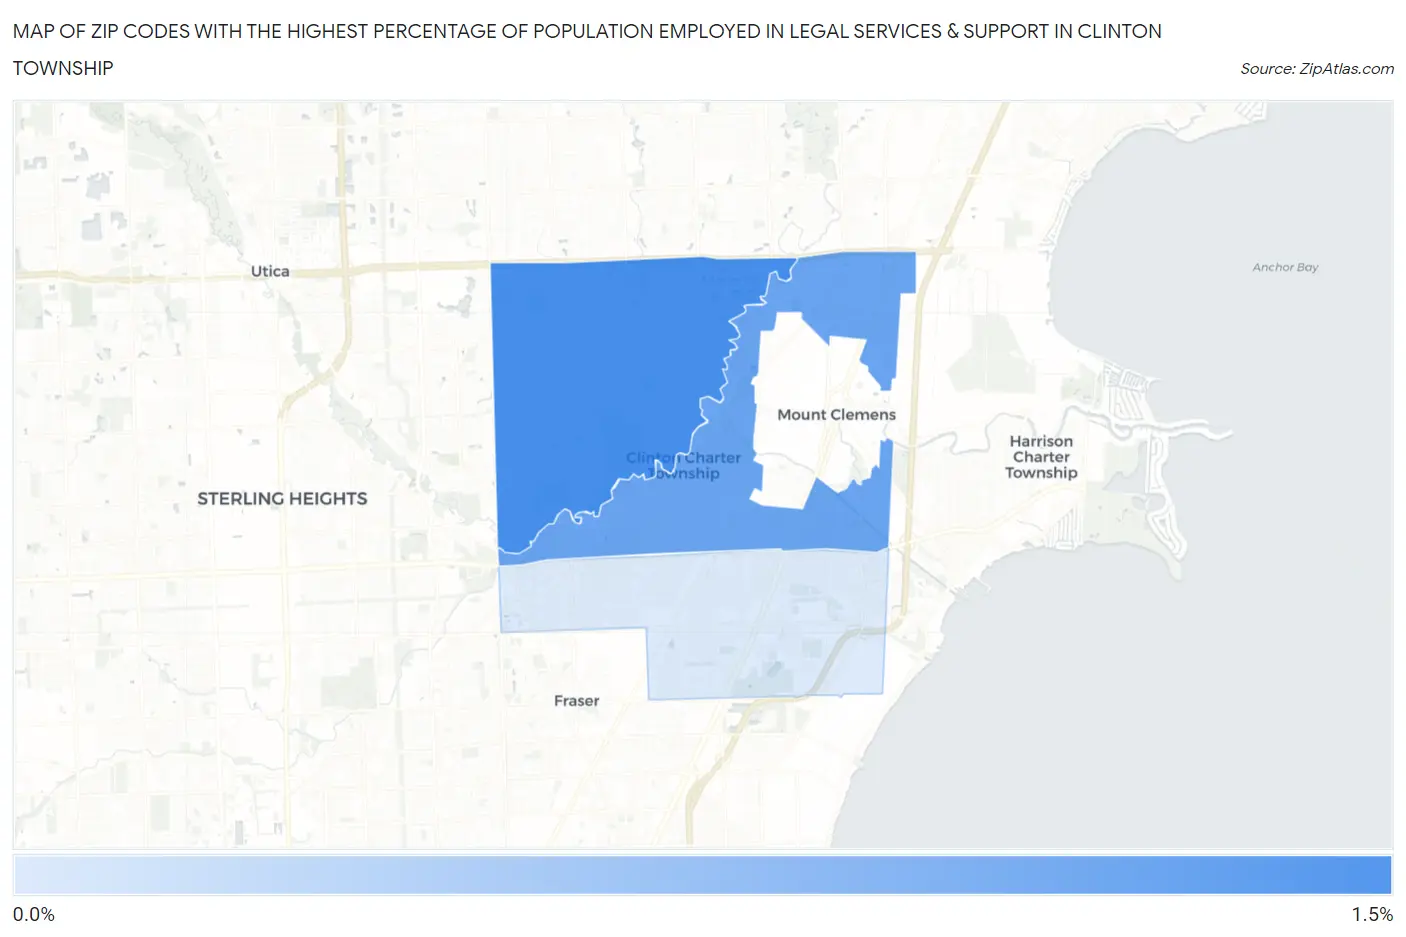
Map of Zip Codes with the Highest Percentage of Population Employed in Legal Services & Support in Clinton Township
0.45%
1.2%
Zip Codes with the Highest Percentage of Population Employed in Legal Services & Support in Clinton Township, MI
| Zip Code | % Employed | vs State | vs National | |
| 1. | 48038 | 1.2% | 0.89%(+0.266)#163 | 1.2%(-0.033)#6,812 |
| 2. | 48036 | 0.99% | 0.89%(+0.103)#199 | 1.2%(-0.196)#7,907 |
| 3. | 48035 | 0.45% | 0.89%(-0.433)#404 | 1.2%(-0.732)#13,227 |
1
Common Questions
What are the Top Zip Codes with the Highest Percentage of Population Employed in Legal Services & Support in Clinton Township, MI?
Top Zip Codes with the Highest Percentage of Population Employed in Legal Services & Support in Clinton Township, MI are:
What zip code has the Highest Percentage of Population Employed in Legal Services & Support in Clinton Township, MI?
48038 has the Highest Percentage of Population Employed in Legal Services & Support in Clinton Township, MI with 1.2%.
What is the Percentage of Population Employed in Legal Services & Support in Michigan?
Percentage of Population Employed in Legal Services & Support in Michigan is 0.89%.
What is the Percentage of Population Employed in Legal Services & Support in the United States?
Percentage of Population Employed in Legal Services & Support in the United States is 1.2%.